Visiongain assesses that the thermal insulation market is moderately concentrated with the top 20 companies accounting for just over 70% of the global thermal insulation market in 2019.
Building insulation is used to reduce the amount of power required to heat or cool a building and minimise the amount of heat that escapes during the winter and to limit the hot summer air penetration. Building insulation stands to be the most cost-effective measure in a climate that has a wide range of annual average temperature.
Who are the top 20 thermal insulation companies? Visiongain’s comprehensive new report contains a detailed analysis of the leading 20 thermal insulation companies with the key facts of each company’s revenue, market share, SWOT analysis and outlook.
How this 163-page report will inform you:
• View extensive profiles of the leading 20 companies in the thermal insulation market to keep your knowledge ahead of your competition and ensure you exploit key business opportunities
• The report provides detailed sales of the market and the commercial drivers and restraints, allowing you to more effectively compete in the market. Our study shows current market data, market shares, original analysis and insight into commercial developments
• The report provides 206 tables, charts, and graphs
• Let our analysts present you with a thorough assessment of the current thermal insulation market. This analysis will achieve quicker, easier understanding. Also, you will gain from our analyst’s industry expertise allowing you to demonstrate your authority on the thermal insulation sector.
• Discover sales for the top 20 thermal insulation companies
• What are the prospects for the top 20 thermal insulation companies? How is the market evolving? Which company generates the most revenue? Use our study and expert insight to grow your business and give you more industry influence. Stay informed about the potential for each of these thermal insulation market with individual analysis 2019.
• Explore the factors affecting top companies, and learn about the forces influencing market dynamics
• Explore the strengths, weaknesses, opportunities and threats (SWOT) affecting the industry. Discover what the present and future outlook for business will be. Learn about the following business-critical issues
• Identify who are the leading 20 companies in the thermal insulation industry
• Our report reveals the companies which hold the greatest potential. In particular, exploring and analysing the activities of these companies: See where the expected gains will be. Our work explains that potential, helping you stay ahead. Gain a thorough understanding of the competitive landscape with profiles of 20 leading thermal insulation companies examining their positioning, capabilities product portfolios, services, focus, strategies, M&A activity, and future outlook.
• Arkema SA
• BASF SE
• Beijing New Building Material (Group) Co. Ltd.
• Clariant AG
• Covestro AG
• DowDuPont Inc.
• Eastman Chemical Co.
• Evonik Industries AG
• Fletcher Building Ltd.
• GAF Industries Inc.
• Johns Manville Corp.
• Kingspan Group PLC
• Knauf Insulation
• Masco Corp.
• Owens Corning Corporation
• Rockwool International
• Saint-Gobain SA
• Sika AG
• Solvay SA
• Wanhua Chemical Group Co. Ltd.
Discover information found nowhere else in this independent assessment of the top 20 thermal insulation companies
Top 20 thermal insulation companies 2019: Market Share Analysis, Financials & Key Strategies and Achievements Details for The Leading Expanded Polystyrene (EPS), Extruded Polystyrene (XPS), Polyurethane Foam Companies, Including Owens Corning Corporation, Saint-Gobain SA, Rockwool International, DowDuPont, Inc., Johns Manville Corp. and More report provides impartial thermal insulation sector analysis. With the independent business intelligence found only in our work, you will discover where the prospects are for profit. In particular, our new research provides you with key strategic advantages: independent and objective analysis, and revealing company profiles will provide you with that necessary edge, allowing you to gain ground over your competitors.
With this report, you are less likely to fall behind in knowledge or miss crucial business opportunities. You will save time and receive recognition for your market insight. See how this report could benefit and enhance your research, analysis, company presentations and ultimately your individual business decisions and your company’s prospects.
What makes this report unique?
Visiongain’s research methodology involves an exclusive blend of primary and secondary sources providing informed analysis. This methodology allows insight into the key drivers and restraints behind market dynamics and competitive developments. The report, therefore, presents a comprehensive analysis of the top 20 thermal insulation companies, including revenue, market share, products, services and outlook.
Why Choose Visiongain Business Intelligence?
Visiongain’s increasingly diverse sector coverage strengthens our research portfolio. The growing cross-sector convergence of key verticals and the interplay of game-changing technologies across hitherto unrelated industries are creating new synergies, resulting in new business opportunities for you to leverage.
Visiongain is a trading partner with the US Federal Government
CCR Ref number: KD4R6
Do you have any custom requirements we can help you with? Any need for specific country, geo region, market segment or specific company information? Contact us today, we can discuss your needs and see how we can help: sara.peerun@visiongain.com
1 Report Overview
1.1 Global Building Thermal Insulation Market Overview
1.2 Why You Should Read This Report
1.3 How This Report Delivers
1.4 Key Questions Answered by This Analytical Report Include:
1.5 Who is This Report For?
1.6 Methodology
1.6.1 Secondary Research
1.6.2 Market Evaluation & Forecasting Methodology
1.7 Frequently Asked Questions (FAQ)
1.8 Associated Visiongain Reports
1.9 About Visiongain
2 Introduction to the Building Thermal Insulation Market
2.1 Global Building Thermal Insulation Market Structure
2.2 Building Thermal Insulation Market Definition
2.3 Global Building Thermal Insulation Market Drivers
2.3.1 Greenhouse Gas Emission Reduction
2.3.2 Cause Deficiency
2.4 Global Building Thermal Insulation Market Restraints
2.4.1 Slow Growth of Construction Sector in Europe
2.4.2 Lack of Awareness
2.5 Opportunity
2.5.1 More Energy Requirements
2.6 Value-Chain Analysis
2.6.1 Raw Materials
2.6.2 Building Insulation Material
2.6.3 Building Insulation Material Product Form
2.6.4 Distribution Network
2.6.5 End User
2.7 Policy and Regulation
3 Competitor Positioning in the Global Building Thermal Insulation Market
3.1 Top 20 Building Thermal Insulation Company Share Analysis 2018
3.2 Composition of the Building Thermal Insulation Market
3.2.1 Building Thermal Insulation Market Composition Overview
3.2.2 The positioning of Top 20 Building Thermal Insulation Companies
4 Top 20 Building Thermal Insulation Companies 2019
4.1 BASF SE
4.1.1 BASF SE Key Developments 2014-2018
4.1.2 BASF SE Sales 2015-2018
4.1.3 BASF SE Net Income 2015-2018
4.1.4 BASF SE Organisational Structure
4.1.5 BASF SE Building Thermal Insulation Market Products / Services
4.1.6 BASF SE Primary Market Competitors 2018
4.1.7 BASF SE Overview
4.1.8 BASF SE Key Financial Ratios
4.1.9 BASF SE Financial Outlook
4.1.10 BASF SE SWOT Analysis
4.2 Rockwool International
4.2.1 Rockwool International Key Developments 2013-2018
4.2.2 Rockwool International Sales 2015-2018
4.2.3 Rockwool International Net Income 2015-2018
4.2.4 Rockwool International Organisational Structure
4.2.5 Rockwool International Building Thermal Insulation Market Products / Services
4.2.6 Rockwool International Primary Market Competitors 2018
4.2.7 Rockwool International Overview
4.2.8 Rockwool International Key Financial Ratios
4.2.9 Rockwool International Financial Outlook
4.2.10 Rockwool International SWOT Analysis
4.3 Saint-Gobain SA
4.3.1 Saint-Gobain SA Key Developments 2014-2018
4.3.2 Saint-Gobain SA Sales 2015-2018
4.3.3 Saint-Gobain SA Net Income 2015-2018
4.3.4 Saint-Gobain SA Organisational Structure
4.3.5 Saint-Gobain SA Building Thermal Insulation Market Products / Services
4.3.6 Saint-Gobain SA Primary Market Competitors 2018
4.3.7 Saint-Gobain SA Overview
4.3.8 Saint-Gobain SA Key Financial Ratios
4.3.9 Saint-Gobain SA Financial Outlook
4.3.10 Saint-Gobain SA SWOT Analysis
4.4 Owens Corning Corporation
4.4.1 Owens Corning Corporation Key Developments 2013-2018
4.4.2 Owens Corning Corporation Sales 2015-2018
4.4.3 Owens Corning Corporation Net Income 2015-2018
4.4.4 Owens Corning Corporation Market Sectors
4.4.5 Owens Corning Corporation Building Thermal Insulation Market Products / Services
4.4.6 Owens Corning Corporation Primary Market Competitors 2018
4.4.7 Owens Corning Corporation Overview
4.4.8 Owens Corning Corporation Key Financial Ratios
4.4.9 Owens Corning Corporation Financial Outlook
4.4.10 Owens Corning Corporation SWOT Analysis
4.5 Kingspan Group PLC
4.5.1 Kingspan Group PLC Key Developments 2015-2018
4.5.2 Kingspan Group PLC Sales 2014-2018
4.5.3 Kingspan Group PLC Net Income 2014-2018
4.5.4 Kingspan Group PLC Company Structure
4.5.5 Kingspan Group PLC Building Thermal Insulation Market Products / Services
4.5.6 Kingspan Group PLC Primary Market Competitors 2018
4.5.7 Kingspan Group PLC Overview
4.5.8 Kingspan Group PLC Key Financial Ratios
4.5.9 Kingspan Group PLC Financial Outlook
4.5.10 Kingspan Group PLC SWOT Analysis
4.6 DowDuPont, Inc.
4.6.1 DowDuPont, Inc. Key Developments 2017-2019
4.6.2 DowDuPont, Inc. Sales 2014-2018
4.6.3 DowDuPont, Inc. Net Income 2014-2018
4.6.4 DowDuPont, Inc. Business Divisions
4.6.5 DowDuPont, Inc. Building Thermal Insulation Market Products / Services
4.6.6 DowDuPont, Inc. Primary Market Competitors 2018
4.6.7 DowDuPont, Inc. Overview
4.6.7.1 DowDuPont, Inc. Number of Manufacturing Sites
4.6.8 DowDuPont, Inc. Key Financial Ratios
4.6.9 DowDuPont, Inc. Financial Outlook
4.6.10 DowDuPont, Inc. SWOT Analysis
4.7 Knauf Insulation
4.7.1 Knauf Insulation Key Developments 2014-2019
4.7.2 Knauf Insulation Building Thermal Insulation Market Products / Services
4.7.3 Knauf Insulation Primary Market Competitors 2018
4.7.4 Knauf Insulation Overview
4.7.5 Knauf Insulation SWOT Analysis
4.8 Johns Manville Corp.
4.8.1 Johns Manville Corp. Key Developments 2014-2019
4.8.2 Johns Manville Corp. Business Divisions
4.8.3 Johns Manville Corp. Building Thermal Insulation Market Products / Services
4.8.4 Johns Manville Corp. Primary Market Competitors 2018
4.8.5 Johns Manville Corp. Overview
4.8.6 Johns Manville Corp. SWOT Analysis
4.9 Evonik Industries AG
4.9.1 Evonik Industries AG Key Developments 2016-2018
4.9.2 Evonik Industries AG Sales 2014-2018
4.9.3 Evonik Industries AG Net Income 2014-2018
4.9.4 Evonik Industries AG Business Segments
4.9.5 Evonik Industries AG Building Thermal Insulation Market Products / Services
4.9.6 Evonik Industries AG Primary Market Competitors 2018
4.9.7 Evonik Industries AG Overview
4.9.8 Evonik Industries AG Key Financial Ratios
4.9.9 Evonik Industries AG Financial Outlook
4.9.10 Evonik Industries AG SWOT Analysis
4.10 Covestro AG
4.10.1 Covestro AG Key Developments 2017-2019
4.10.2 Covestro AG Sales 2014-2018
4.10.3 Covestro AG Net Income 2014-2018
4.10.4 Covestro AG Business Sectors
4.10.5 Covestro AG Building Thermal Insulation Market Products / Services
4.10.6 Covestro AG Primary Market Competitors 2018
4.10.7 Covestro AG Overview
4.10.8 Covestro AG Key Financial Ratios
4.10.9 Covestro AG Financial Outlook
4.10.10 Covestro AG SWOT Analysis
4.11 Solvay SA
4.11.1 Solvay SA Key Developments 2018-2019
4.11.2 Solvay SA Sales 2014-2018
4.11.3 Solvay SA Net Income 2014-2018
4.11.4 Solvay SA Business Segments
4.11.5 Solvay SA Building Thermal Insulation Market Products / Services
4.11.6 Solvay SA Primary Market Competitors 2018
4.11.7 Solvay SA Overview
4.11.8 Solvay SA Key Financial Ratios
4.11.9 Solvay SA Financial Outlook
4.11.10 Solvay SA SWOT Analysis
4.12 Eastman Chemical Co.
4.12.1 Eastman Chemical Co. Key Developments 2017-2019
4.12.2 Eastman Chemical Co. Sales 2014-2018
4.12.3 Eastman Chemical Co. Industry Group Net Income 2014-2018
4.12.4 Eastman Chemical Co. Segment Information
4.12.5 Eastman Chemical Co. Building Thermal Insulation Market Products / Services
4.12.6 Eastman Chemical Co. Primary Market Competitors 2018
4.12.7 Eastman Chemical Co. Overview
4.12.8 Eastman Chemical Co. Key Financial Ratios
4.12.9 Eastman Chemical Co. Financial Outlook
4.12.10 Eastman Chemical Co. SWOT Analysis
4.13 Arkema SA
4.13.1 Arkema SA Key Developments 2017-2019
4.13.2 Arkema SA Sales 2014-2018
4.13.3 Arkema SA Net Income 2014-2018
4.13.4 Arkema SA Organisational Structure
4.13.5 Arkema SA Building Thermal Insulation Market Products / Services
4.13.6 Arkema SA Primary Market Competitors 2018
4.13.7 Arkema SA Overview
4.13.8 Arkema SA Key Financial Ratios
4.13.9 Arkema SA Financial Outlook
4.13.10 Arkema SA SWOT Analysis
4.14 Wanhua Chemical Group Co. Ltd.
4.14.1 Wanhua Chemical Group Co. Ltd. Key Developments 2015-2018
4.14.2 Wanhua Chemical Group Co. Ltd. Sales 2014-2018
4.14.3 Wanhua Chemical Group Co. Ltd. Net Income 2014-2018
4.14.4 Wanhua Chemical Group Co. Ltd. Business Segment
4.14.5 Wanhua Chemical Group Co. Ltd. Building Thermal Insulation Market Products / Services
4.14.6 Wanhua Chemical Group Co. Ltd. Primary Market Competitors 2018
4.14.7 Wanhua Chemical Group Co. Ltd. Overview
4.14.8 Wanhua Chemical Group Co. Ltd. Key Financial Ratios
4.14.9 Wanhua Chemical Group Co. Ltd. Financial Outlook
4.14.10 Wanhua Chemical Group Co. Ltd. SWOT Analysis
4.15 Masco Corp.
4.15.1 Masco Corp. Key Developments 2016-2018
4.15.2 Masco Corp. Sales 2014-2014
4.15.3 Masco Corp. Net Income 2014-2018
4.15.4 Masco Corp. Company Structure
4.15.5 Masco Corp. Building Thermal Insulation Market Products / Services
4.15.6 Masco Corp. Primary Market Competitors 2018
4.15.7 Masco Corp. Overview
4.15.8 Masco Corp. Key Financial Ratios
4.15.9 Masco Corp. Financial Outlook
4.16 Clariant AG
4.16.1 Clariant AG Key Developments 2016-2019
4.16.2 Clariant AG Sales 2014-2018
4.16.3 Clariant AG Net Income 2014-2018
4.16.4 Clariant AG Business Segments
4.16.5 Clariant AG Building Thermal Insulation Market Products / Services
4.16.6 Clariant AG Primary Market Competitors 2018
4.16.7 Clariant AG Overview
4.16.8 Clariant AG Key Financial Ratios
4.16.9 Clariant AG Financial Outlook
4.16.10 Clariant AG SWOT Analysis
4.17 Sika AG
4.17.1 Sika AG Key Developments 2016-2018
4.17.2 Sika AG Sales 2014-2018
4.17.3 Sika AG Net Income 2014-2018
4.17.4 Sika AG Building Thermal Insulation Market Products / Services
4.17.5 Sika AG Primary Market Competitors 2018
4.17.6 Sika AG Overview
4.17.7 Sika AG Key Financial Ratios
4.17.8 Sika AG Financial Outlook
4.17.9 Sika AG SWOT Analysis
4.18 Fletcher Building Ltd.
4.18.1 Fletcher Building Ltd. Key Developments 2016-2018
4.18.2 Fletcher Building Ltd. Sales 2014-2018
4.18.3 Fletcher Building Ltd. Net Income 2014-2018
4.18.4 Fletcher Building Ltd. Business Divisions
4.18.5 Fletcher Building Ltd. Building Thermal Insulation Market Products / Services
4.18.6 Fletcher Building Ltd. Primary Market Competitors 2018
4.18.7 Fletcher Building Ltd. Overview
4.18.8 Fletcher Building Ltd. Key Financial Ratios
4.18.9 Fletcher Building Ltd. Financial Outlook
4.18.10 Fletcher Building Ltd. SWOT Analysis
4.19 GAF Industries Inc.
4.19.1 GAF Industries Inc. Key Developments 2013-2019
4.19.2 GAF Industries Inc. Building Thermal Insulation Market Products / Services
4.19.3 GAF Industries Inc. Primary Market Competitors 2018
4.19.4 GAF Industries Inc. Overview
4.19.5 GAF Industries Inc. SWOT Analysis
4.20 Beijing New Building Material (Group) Co. Ltd.
4.20.1 Beijing New Building Material (Group) Co. Ltd. Key Developments 2013-2018
4.20.2 Beijing New Building Material (Group) Co. Ltd. Building Thermal Insulation Market Products / Services
4.20.3 Beijing New Building Material (Group) Co. Ltd. Primary Market Competitors 2018
4.20.4 Beijing New Building Material (Group) Co. Ltd. Overview
4.20.5 Beijing New Building Material (Group) Co. Ltd. SWOT Analysis
5 Other Leading Players in the Value Chain
6 Porter’s Five Forces Analysis
6.1 Bargaining Power of Suppliers
6.2 Bargaining Power of Buyers
6.3 Threat of Substitutes
6.4 The Threat of New Entrants
6.5 Intensive Competitive Rivalry
7 SWOT Analysis of the Building Thermal Insulation Market
8 Conclusion
Glossary
Associated Visiongain Reports
Visiongain Report Sales Order Form
Appendix A
About Visiongain
Appendix B
Visiongain Report Evaluation Form
List of Figures
Figure 2.1 Global Building Thermal Insulation Market Segmentation Overview
Figure 2.2 Building Thermal Insulation Value Chain Analysis 2019
Figure 3.1 Top 20 Companies in the Building Thermal Insulation Market FY2018 (% Share)
Figure 3.2 Top 20 Companies in the Building Thermal Insulation Market FY2018 (Company, Sales US$m)
Figure 3.3 Market Shares of Top 5 Vs. Remaining 15 Building Thermal Insulation Companies 2018 (Company Ranking, Market Share %)
Figure 3.4 Market Shares of Top 10 Vs. Remaining 10 Building Thermal Insulation Companies 2018 (Company Ranking, Market Share %)
Figure 4.1 BASF SE Sales 2015-2018 (US$m, AGR %)
Figure 4.2 BASF SE Net Income 2015-2018 (US$m, AGR %)
Figure 4.3 BASF SE Organisational Structure 2018
Figure 4.4 BASF SE Primary Market Competitors 2018
Figure 4.5 Rockwool International Sales 2015-2018 (US$m, AGR %)
Figure 4.6 Rockwool International Net Income 2015-2018 (US$m, AGR %)
Figure 4.7 Rockwool International Organisational Structure 2018
Figure 4.8 Rockwool International Primary Market Competitors 2018
Figure 4.9 Saint-Gobain SA Sales 2015-2018 (US$m, AGR %)
Figure 4.10 Saint-Gobain SA Net Income 2015-2018 (US$m, AGR %)
Figure 4.11 Saint-Gobain SA Organisational Structure 2018
Figure 4.12 Saint-Gobain SA Primary Market Competitors 2018
Figure 4.13 Owens Corning Corporation Sales 2015-2018 (US$m, AGR %)
Figure 4.14 Owens Corning Corporation Net Income 2015-2018 (US$m, AGR %)
Figure 4.15 Owens Corning Corporation Market Sectors 2018
Figure 4.16 Owens Corning Corporation Primary Market Competitors 2018
Figure 4.17 Kingspan Group PLC Sales 2014-2018 (US$m, AGR %)
Figure 4.18 Kingspan Group PLC Net Income 2014-2018 (US$m, AGR %)
Figure 4.19 Kingspan Group PLC Company Structure 2018
Figure 4.20 Kingspan Group PLC Primary Market Competitors 2018
Figure 4.21 DowDuPont, Inc. Sales 2014-2018 (US$m, AGR %)
Figure 4.22 DowDuPont, Inc. Net Income 2014-2018 (US$m, AGR %)
Figure 4.23 DowDuPont, Inc. Business Divisions 2018
Figure 4.24 DowDuPont, Inc. Primary Market Competitors 2018
Figure 4.25 Knauf Insulation Primary Market Competitors 2018
Figure 4.26 Johns Manville Corp. Business Divisions 2018
Figure 4.27 Johns Manville Corp. Primary Market Competitors 2018
Figure 4.28 Evonik Industries AG Sales 2014-2018 (US$m, AGR %)
Figure 4.29 Evonik Industries AG Net Income 2014-2018 (US$m, AGR %)
Figure 4.30 Evonik Industries AG Business Segments 2018
Figure 4.31 Evonik Industries AG Primary Market Competitors 2018
Figure 4.32 Covestro AG Sales 2014-2018 (US$m, AGR %)
Figure 4.33 Covestro AG Net Income 2014-2018 (US$m, AGR %)
Figure 4.34 Covestro AG Business Sectors 2018
Figure 4.35 Covestro AG Primary Market Competitors 2018
Figure 4.36 Solvay SA Sales 2014-2018 (US$m, AGR %)
Figure 4.37 Solvay SA Net Income 2014-2018 (US$m, AGR %)
Figure 4.38 Solvay SA Business Segments 2018
Figure 4.39 Solvay SA Primary Market Competitors 2018
Figure 4.40 Eastman Chemical Co. Sales 2014-2018 (US$m, AGR %)
Figure 4.41 Eastman Chemical Co. Industry Group Share 2014-2018 (%)
Figure 4.42 Eastman Chemical Co. Segment Information 2018
Figure 4.43 Eastman Chemical Co. Primary Market Competitors 2018
Figure 4.44 Arkema SA Sales 2014-2018 (US$m, AGR %)
Figure 4.45 Arkema SA Net Income 2014-2018 (US$m, AGR %)
Figure 4.46 Arkema SA Organisational Structure 2018
Figure 4.47 Arkema SA Primary Market Competitors 2018
Figure 4.48 Wanhua Chemical Group Co. Ltd. Sales 2014-2018 (US$m, AGR %)
Figure 4.49 Wanhua Chemical Group Co. Ltd. Net Income 2014-2018 (US$m, AGR %)
Figure 4.50 Wanhua Chemical Group Co. Ltd. Business Segments 2018
Figure 4.51 Wanhua Chemical Group Co. Ltd. Primary Market Competitors 2018
Figure 4.52 Masco Corp. Sales 2014-2018 (US$m, AGR %)
Figure 4.53 Masco Corp. Net Income 2014-2018 (US$m, AGR %)
Figure 4.54 Masco Corp. Company Structure 2018
Figure 4.55 Masco Corp. Primary Market Competitors 2018
Figure 4.56 Clariant AG Sales 2014-2018 (US$m, AGR %)
Figure 4.57 Clariant AG Net Income 2014-2018 (US$m, AGR %)
Figure 4.58 Clariant AG Business Segments 2018
Figure 4.59 Clariant AG Primary Market Competitors 2018
Figure 4.60 Sika AG Sales 2014-2018 (US$m, AGR %)
Figure 4.61 Sika AG Net Income 2014-2018 (US$m, AGR %)
Figure 4.62 Sika AG Primary Market Competitors 2018
Figure 4.63 Fletcher Building Ltd. Sales 2014-2018 (US$m, AGR %)
Figure 4.64 Fletcher Building Ltd. Net Income 2014-2018 (US$m, AGR %)
Figure 4.65 Fletcher Building Ltd. Business Divisions 2018
Figure 4.66 Fletcher Building Ltd. Primary Market Competitors 2018
Figure 4.67 GAF Industries Inc. Primary Market Competitors 2018
Figure 4.68 Beijing New Building Material (Group) Co. Ltd. Primary Market Competitors 2018
Figure 6.1 Porter’s Five Forces in the Building Thermal Insulation Market Analysis
List of Tables
Table 3.1 Leading 20 Building Thermal Insulation Companies Shares in 2018 (Ranking, Company, FY2018 Total / Parent Company Sales US$m, FY2018 Sales in the Building Thermal Insulation Market US$m, Building Thermal Insulation Market Share (%) 2018)
Table 4.1 BASF SE Profile 2018 (Building Thermal Insulation Market Ranking, Building Thermal Insulation Market Share %, CEO, Parent Company Sales US$m, Sales in the Market US$m, Share of Company Sales from the Market %, Business Segment in the Market, HQ, Founded, No. of Employees, Website)
Table 4.2 Selected Recent BASF SE Building Thermal Insulation Market Developments 2014-2018 (Date, Strategy, Details)
Table 4.3 BASF SE Sales 2015-2018 (US$m, AGR %)
Table 4.4 BASF SE Net Income 2015-2018 (US$m, AGR %)
Table 4.5 BASF SE Building Thermal Insulation Market Products / Services (Product, Specification / Features)
Table 4.6 BASF SE: Key Financial Ratios 2018
Table 4.7 BASF SE SWOT Analysis 2018
Table 4.8 Rockwool International Profile 2018 (Building Thermal Insulation Market Ranking, Building Thermal Insulation Market Share %, CEO, Parent Company Sales US$m, Sales in the Market US$m, Share of Company Sales from the Market %, Business Segment in the Market, HQ, Founded, No. of Employees, Website)
Table 4.9 Selected Recent Rockwool International Building Thermal Insulation Market Developments 2013-2018 (Date, Strategy, Details)
Table 4.10 Rockwool International Sales 2015-2018 (US$m, AGR %)
Table 4.11 Rockwool International Net Income 2015-2018 (US$m, AGR %)
Table 4.12 Rockwool International Building Thermal Insulation Market Products / Services (Product, Specification / Features)
Table 4.13 Rockwool International: Key Financial Ratios 2018
Table 4.14 Rockwool International SWOT Analysis 2018
Table 4.15 Saint-Gobain SA Profile 2018 (Building Thermal Insulation Market Ranking, Building Thermal Insulation Market Share %, CEO, Parent Company Sales US$m, Sales in the Market US$m, Share of Company Sales from the Market %, Business Segment in the Market, HQ, Founded, No. of Employees, Website)
Table 4.16 Selected Recent Saint-Gobain SA Building Thermal Insulation Market Developments 2014-2018 (Date, Strategy, Details)
Table 4.17 Saint-Gobain SA Sales 2015-2018 (US$m, AGR %)
Table 4.18 Saint-Gobain SA Net Income 2015-2018 (US$m, AGR %)
Table 4.19 Saint-Gobain SA Building Thermal Insulation Market Products / Services (Product, Specification / Features)
Table 4.20 Saint-Gobain SA: Key Financial Ratios 2018
Table 4.21 Saint-Gobain SA SWOT Analysis 2018
Table 4.22 Owens Corning Corporation Profile 2018 (Building Thermal Insulation Market Ranking, Building Thermal Insulation Market Share %, CEO, Parent Company Sales US$m, Sales in the Market US$m, Share of Company Sales from the Market %, Business Segment in the Market, HQ, Founded, No. of Employees, Website)
Table 4.23 Selected Recent Owens Corning Corporation Building Thermal Insulation Market Developments 2013-2018 (Date, Strategy, Details)
Table 4.24 Owens Corning Corporation Sales 2015-2018 (US$m, AGR %)
Table 4.25 Owens Corning Corporation Net Income 2015-2018 (US$m, AGR %)
Table 4.26 Owens Corning Corporation Building Thermal Insulation Market Products / Services (Product, Specification / Features)
Table 4.27 Owens Corning Corporation: Key Financial Ratios 2018
Table 4.28 Owens Corning Corporation SWOT Analysis 2018
Table 4.29 Kingspan Group PLC Profile 2018 (Building Thermal Insulation Market Ranking, Building Thermal Insulation Market Share %, CEO, Parent Company Sales US$m, Sales in the Market US$m, Share of Company Sales from the Market %, Business Segment in the Market, HQ, Founded, No. of Employees, Website)
Table 4.30 Selected Recent Kingspan Group PLC Building Thermal Insulation Market Developments 2015-2018 (Date, Strategy, Details)
Table 4.31 Kingspan Group PLC Sales 2014-2018 (US$m, AGR %)
Table 4.32 Kingspan Group PLC Net Income 2014-2018 (US$m, AGR %)
Table 4.33 Kingspan Group PLC Building Thermal Insulation Market Products / Services (Product, Specification / Features)
Table 4.34 Kingspan Group PLC: Key Financial Ratios, 2018
Table 4.35 Kingspan Group PLC SWOT Analysis 2018
Table 4.36 DowDuPont, Inc. Profile 2018 (Building Thermal Insulation Market Ranking, Building Thermal Insulation Market Share %, CEO, Parent Company Sales US$m, Sales in the Market US$m, Share of Company Sales from the Market %, Business Segment in the Market, HQ, Founded, No. of Employees, Website)
Table 4.37 Selected Recent DowDuPont, Inc. Building Thermal Insulation Market Developments 2017-2019 (Date, Strategy, Details)
Table 4.38 DowDuPont, Inc. Sales 2014-2018 (US$m, AGR %)
Table 4.39 DowDuPont, Inc. Net Income 2014-2018 (US$m, AGR %)
Table 4.40 DowDuPont, Inc. Building Thermal Insulation Market Products / Services (Major product line, Applications/ Market Segments, Major Products/ Technologies)
Table 4.41 DowDuPont, Inc. Number of Manufacturing Sites 2018 (Geographic Region, Agriculture, Perf. Materials & Coatings, Ind. Interm. & Infrast., Pack. & Spec. Plastics, Elect. & Imaging, Nutrition & Biosciences, Transp. & Adv. Polymers, Safety & Const., Total)
Table 4.42 DowDuPont, Inc. Key Financial Ratios 2018
Table 4.43 DowDuPont, Inc. SWOT Analysis 2018
Table 4.44 Knauf Insulation Profile 2018 (Building Thermal Insulation Market Ranking, Building Thermal Insulation Market Share %, CEO, Parent Company Sales US$m, Sales in the Market US$m, Share of Company Sales from the Market %, Business Segment in the Market, HQ, Founded, No. of Employees, Website)
Table 4.45 Selected Recent Knauf Insulation Building Thermal Insulation Market Developments 2014-2019 (Date, Strategy, Details)
Table 4.46 Knauf Insulation Building Thermal Insulation Market Products / Services
Table 4.47 Knauf Insulation SWOT Analysis 2018
Table 4.48 Johns Manville Corp. Profile 2018 (Building Thermal Insulation Market Ranking, Building Thermal Insulation Market Share %, CEO, Parent Company Sales US$m, Sales in the Market US$m, Share of Company Sales from the Market %, Business Segment in the Market, HQ, Founded, No. of Employees, Website)
Table 4.49 Selected Recent Johns Manville Corp. Building Thermal Insulation Market Developments 2014-2019 (Date, Strategy, Details)
Table 4.50 Johns Manville Corp. Building Thermal Insulation Market Products / Services (Product, Specification / Features)
Table 4.51 Johns Manville Corp. SWOT Analysis 2018
Table 4.52 Evonik Industries AG Profile 2018 (Building Thermal Insulation Market Ranking, Building Thermal Insulation Market Share %, CEO, Parent Company Sales US$m, Sales in the Market US$m, Share of Company Sales from the Market %, Business Segment in the Market, HQ, Founded, No. of Employees, Website)
Table 4.53 Selected Recent Evonik Industries AG Building Thermal Insulation Market Developments 2016-2018 (Date, Strategy, Details)
Table 4.54 Evonik Industries AG Sales 2014-2018 (US$m, AGR %)
Table 4.55 Evonik Industries AG Net Income 2014-2018 (US$m, AGR %)
Table 4.56 Evonik Industries AG Building Thermal Insulation Market Products / Services (Markets, Specification / Features)
Table 4.57 Evonik Industries AG: Key Financial Ratios 2018
Table 4.58 Evonik Industries AG SWOT Analysis 2018
Table 4.59 Covestro AG Profile 2018 (Building Thermal Insulation Market Ranking, Building Thermal Insulation Market Share %, CEO, Parent Company Sales US$m, Sales in the Market US$m, Share of Company Sales from the Market %, Business Segment in the Market, HQ, Founded, No. of Employees, Website)
Table 4.60 Selected Recent Covestro AG Building Thermal Insulation Market Developments 2017-2019 (Date, Strategy, Details)
Table 4.61 Covestro AG Sales 2014-2018 (US$m, AGR %)
Table 4.62 Covestro AG Net Income 2014-2018 (US$m, AGR %)
Table 4.63 Covestro AG Building Thermal Insulation Market Products / Services (Product, Specification / Features)
Table 4.64 Covestro AG: Key Financial Ratios 2018
Table 4.65 Covestro AG SWOT Analysis 2018
Table 4.66 Solvay SA Profile 2018 (Building Thermal Insulation Market Ranking, Building Thermal Insulation Market Share %, CEO, Parent Company Sales US$m, Sales in the Market US$m, Share of Company Sales from the Market %, Business Segment in the Market, HQ, Founded, No. of Employees, Website)
Table 4.67 Selected Recent Solvay SA Building Thermal Insulation Market Developments 2018-2019 (Date, Strategy, Details)
Table 4.68 Solvay SA Sales 2014-2018 (US$m, AGR %)
Table 4.69 Solvay SA Net Income 2014-2018 (US$m, AGR %)
Table 4.70 Solvay SA Building Thermal Insulation Market Products / Services (Segment of Business, Specification / Features)
Table 4.71 Solvay SA: Key Financial Ratios 2018
Table 4.72 Solvay SA SWOT Analysis 2018
Table 4.73 Eastman Chemical Co. Profile 2018 (Building Thermal Insulation Market Ranking, Building Thermal Insulation Market Share %, CEO, Parent Company Sales US$m, Sales in the Market US$m, Share of Company Sales from the Market %, Business Segment in the Market, HQ, Founded, No. of Employees, Website)
Table 4.74 Selected Recent Eastman Chemical Co. Building Thermal Insulation Market Developments 2017-2019 (Date, Strategy, Details)
Table 4.75 Eastman Chemical Co. Sales 2015-2018 (US$m, AGR %)
Table 4.76 Eastman Chemical Co. Net Income 2014-2018 (US$m, AGR %)
Table 4.77 Eastman Chemical Co. Building Thermal Insulation Market Products / Services (Product, Specification/ Features)
Table 4.78 Eastman Chemical Co.: Key Financial Ratios 2018
Table 4.79 Eastman Chemical Co. SWOT Analysis 2018
Table 4.80 Arkema SA Profile 2018 (Building Thermal Insulation Market Ranking, Building Thermal Insulation Market Share %, CEO, Parent Company Sales US$m, Sales in the Market US$m, Share of Company Sales from the Market %, Business Segment in the Market, HQ, Founded, No. of Employees, Website)
Table 4.81 Selected Recent Arkema SA Building Thermal Insulation Market Developments 2017-2019 (Date, Strategy, Details)
Table 4.82 Arkema SA Sales 2014-2018 (US$m, AGR %)
Table 4.83 Arkema SA Net Income 2014-2018 (US$m, AGR %)
Table 4.84 Arkema SA Building Thermal Insulation Market Products / Services (Product, Specification / Features)
Table 4.85 Arkema SA: Key Financial Ratios 2018
Table 4.86 Arkema SA SWOT Analysis 2018
Table 4.87 Wanhua Chemical Group Co. Ltd. Profile 2018 (Building Thermal Insulation Market Ranking, Building Thermal Insulation Market Share %, CEO, Parent Company Sales US$m, Sales in the Market US$m, Share of Company Sales from the Market %, Business Segment in the Market, HQ, Founded, No. of Employees, Website)
Table 4.88 Selected Recent Wanhua Chemical Group Co. Ltd. Building Thermal Insulation Market Developments 2015-2018 (Date, Strategy, Details)
Table 4.89 Wanhua Chemical Group Co. Ltd. Sales 2014-2018 (US$m, AGR %)
Table 4.90 Wanhua Chemical Group Co. Ltd. Net Income 2014-2018 (US$m, AGR %)
Table 4.91 Wanhua Chemical Group Co. Ltd. Building Thermal Insulation Market Products / Services (Product, Specification / Features)
Table 4.92 Arkema SA: Key Financial Ratios 2018
Table 4.93 Wanhua Chemical Group Co. Ltd. SWOT Analysis 2018
Table 4.94 Masco Corp. Profile 2018 (Building Thermal Insulation Market Ranking, Building Thermal Insulation Market Share %, CEO, Parent Company Sales US$m, Sales in the Market US$m, Share of Company Sales from the Market %, Business Segment in the Market, HQ, Founded, No. of Employees, Website)
Table 4.95 Selected Recent Masco Corp. Building Thermal Insulation Market Developments 2016-2018 (Date, Strategy, Details)
Table 4.96 Masco Corp. Sales 2014-2018 (US$m, AGR %)
Table 4.97 Masco Corp. Net Income 2014-2018 (US$m, AGR %)
Table 4.98 Masco Corp. Building Thermal Insulation Market Products / Services (Specification/ Features)
Table 4.99 Masco Corp.: Key Financial Ratios 2018
Table 4.100 Clariant AG Profile 2018 (Building Thermal Insulation Market Ranking, Building Thermal Insulation Market Share %, CEO, Parent Company Sales US$m, Sales in the Market US$m, Share of Company Sales from the Market %, Business Segment in the Market, HQ, Founded, No. of Employees, Website)
Table 4.101 Selected Recent Clariant AG Building Thermal Insulation Market Developments 2016-2019 (Date, Strategy, Details)
Table 4.102 Clariant AG Sales 2014-2018 (US$m, AGR %)
Table 4.103 Clariant AG Net Income 2014-2018 (US$m, AGR %)
Table 4.104 Clariant AG Building Thermal Insulation Market Products / Services (Product, Specification / Features)
Table 4.105 Clariant AG: Key Financial Ratios 2018
Table 4.106 Clariant AG SWOT Analysis 2018
Table 4.107 Sika AG Profile 2018 (Building Thermal Insulation Market Ranking, Building Thermal Insulation Market Share %, CEO, Parent Company Sales US$m, Sales in the Market US$m, Share of Company Sales from the Market %, Business Segment in the Market, HQ, Founded, No. of Employees, Website)
Table 4.108 Selected Recent Sika AG Building Thermal Insulation Market Development 2017-2018 (Date, Strategy, Details)
Table 4.109 Sika AG Sales 2014-2018 (US$m, AGR %)
Table 4.110 Sika AG Net Income 2014-2018 (US$m, AGR %)
Table 4.111 Sika AG Building Thermal Insulation Market Products / Services (Products/ Specification)
Table 4.112 Sika AG: Key Financial Ratios 2018
Table 4.113 Sika AG SWOT Analysis 2018
Table 4.114 Fletcher Building Ltd. Profile 2018 (Building Thermal Insulation Market Ranking, Building Thermal Insulation Market Share %, CEO, Parent Company Sales US$m, Sales in the Market US$m, Share of Company Sales from the Market %, Business Segment in the Market, HQ, Founded, No. of Employees, Website)
Table 4.115 Selected Recent Fletcher Building Ltd. Building Thermal Insulation Market Developments 2016-2018 (Date, Strategy, Details)
Table 4.116 Fletcher Building Ltd. Sales 2014-2018 (US$m, AGR %)
Table 4.117 Fletcher Building Ltd. Net Income 2014-2018 (US$m, AGR %)
Table 4.118 Fletcher Building Ltd. Building Thermal Insulation Market Products / Services (Segment, Specification / Features)
Table 4.119 Fletcher Building Ltd.: Key Financial Ratios 2018
Table 4.120 Fletcher Building Ltd. SWOT Analysis 2018
Table 4.121 GAF Industries Inc. Profile 2018 (Building Thermal Insulation Market Ranking, Building Thermal Insulation Market Share %, CEO, Parent Company Sales US$m, Sales in the Market US$m, Share of Company Sales from the Market %, Business Segment in the Market, HQ, Founded, No. of Employees, Website)
Table 4.122 Selected Recent GAF Industries Inc. Building Thermal Insulation Market Developments 2013-2019 (Date, Strategy, Details)
Table 4.123 GAF Industries Inc. Building Thermal Insulation Market Products / Services (Product, Specification / Features)
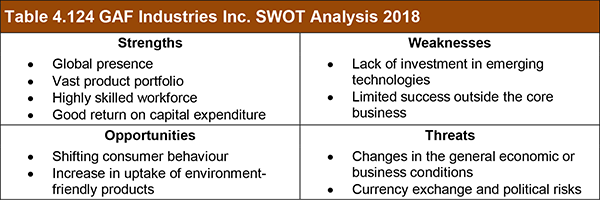
Table 4.124 GAF Industries Inc. SWOT Analysis 2018
Table 4.125 Beijing New Building Material (Group) Co. Ltd. Profile 2018 (Building Thermal Insulation Market Ranking, Building Thermal Insulation Market Share %, CEO, Parent Company Sales US$m, Sales in the Market US$m, Share of Company Sales from the Market %, Business Segment in the Market, HQ, Founded, No. of Employees, Website)
Table 4.126 Selected Recent Beijing New Building Material (Group) Co. Ltd. Building Thermal Insulation Market Developments 2013-2018 (Date, Strategy, Details)
Table 4.127 Beijing New Building Material (Group) Co. Ltd. Building Thermal Insulation Market Products / Services (Product, Specification / Features)
Table 4.128 Beijing New Building Material (Group) Co. Ltd. SWOT Analysis 2018
Table 5.1 Other Leading Companies in the Building Thermal Insulation Market Value Chain 2018 (Company, Revenue, Employee, Location)
Table 7.1 SWOT Analysis of the Building Thermal Insulation Market 2018
Air Products
Alghanim Industries
Andersen Corporation
Arkema SA
Arrmaz
Aspen Aerogels, Inc.
Atlas Roofing Corporation
Balex Metal Sp. z.o.o.
BASF SE
Beijing New Building Material (Group) Co. Ltd.
Big bloc Construction Ltd.
Boise Cascade Co.
Bremhove NV
Certain Teed Corporation
Chicago Metallic
Clariant AG
Compagnie de Saint-Gobain SA
Component Hardware Group Inc.
Construction Products Association
Constructive UPRAVLENIE №155 AO
Covestro AG
CSR Ltd.
Deceuninck NV
Defence Construction (1951) Limited
Distribution International Inc.
DowDuPont, Inc.
Eastman Chemical Co.
Eidai Co., Ltd.
Emseal Joint Systems, Ltd.
Ergon Capital Partners II NV
Etex Sa
Everest Industries Ltd.
Evonik Industries AG
Firestone Building Products Company LLC
Fletcher Building Ltd.
Flumroc AG
GAF Industries Inc.
GAF Materials Corporation
Gibraltar Industries, Inc.
Green Energy Group Ltd.
Habitat
Haier
Hangzhou GreatStar Industrial Co., Ltd
Hebel Haus Gmbh
HECK wall Systems
Henkel Adhesive Technologies
Hess Corporation
Hexcel
HIL Ltd.
Huurre Iberica S.A.
Hyundai Development Co.
Implenia AG
Index Construction Systems and Products
Industrial insulation Group LLC
Industrial Nanotech, Inc.
J.M. Huber Corp.
JELD-WEN Holding, Inc.
Jindal Mectec Private Limited
Johns Manville Corp.
Joris Ide Group
Kaycan Ltée
KCC Corp.
Kichler Lighting
Kingspan Group PLC
Kingspan Tarec Industrial Insulation, Ltd.
Knauf Insulation
Lakehouse Ltd.
LG Hausys, Ltd.
Masco Corp.
Mcconnell Dowell Corporation Limited
National Gypsum Company
NBCC (India) Ltd.
Nu-Wool Inc
Oldcastle Architectural Inc.
Omega Flex, Inc.
Owens Corning Corporation
Paroc Group Oy
Peninsula Publishing
Per Strand AS
Pittsburgh Corning
Ply Gem Holdings, Inc.
Poliuretanos S.A.
Recticel SA
RMAX operating, LLC
Rockwool International
Safran
Saint-Gobain SA
Saudi Binladin Group Limited.
Setra Group AB
Siemens
Sika AG
Skamol A/S
SoCalGas
Solvay SA
Southern California Edison
Steel partners NV
Stormking Plastics Limited
Stratasys
Synthesia Group
Taiwan Glass Industry Corp.
Teraplast SA
The Dow Chemical
Thermafiber inc
Unifrax I LLC
va-Q-tec AG
Wanhua Chemical Group Co. Ltd.
Watts Water Technologies, Inc.
XL Brands
YKK Corporation
List of Other Organisations Mentioned in this Report
China Petroleum and Chemical Industry Association (CPCIA)
Delta College
European manufacturers of Expanded Polystyrene (EUMEPS)
European Union
Government of Denmark
Intergovernmental Panel on Climate Change (IPCC)
RWTH Aachen University
The Business of Council for Sustainable Energy
U.S. Energy Information Administration (EIA)
U.S. Environmental Protection Agency (EPA)
University of Michigan (U-M)
US Department of Energy Studies

