The latest report from business intelligence provider, Visiongain offers a comprehensive analysis of the global Recycled Packaging Materials market. Visiongain assesses that this market will generate revenues of $153,303mn in 2019.
Now: Many major players are continuously focusing on the expansion of the business by acquisition and collaboration. Major player have adopted the organic strategy of acquisition and collaboration to minimise the competition and expand the market. This is an example of the business strategies that you need to know about – and more importantly, you need to read Visiongain’s objective analysis of how this will impact your company and the industry more broadly. How are you and your company reacting to this news? Are you sufficiently informed?
How this report will benefit you
Read on to discover how you can exploit the future business opportunities emerging in this sector. Visiongain’s new study tells you and tells you NOW. In this brand-new report, you find 82 in-depth tables,80 charts and graphs; the 168-page report provides clear, detailed insight into the global Recycled Packaging Materials market. Discover the key drivers and challenges affecting the market.
By ordering and reading our brand-new report today, you stay better informed and ready to act.
Featured content
• Global, Regional and National Recycled Packaging Materials market forecasts and analysis from 2019-2029 illustrate the market progression
• Recycled Packaging Materials Submarkets by Type forecasts from 2019-2029
– Recycled Packaging Materials Market Forecast for Metal 2019-2029
– Recycled Packaging Materials Market Forecast for Paper & Paperboard 2019-2029
– Recycled Packaging Materials Market Forecast for Glass 2019-2029
– Recycled Packaging Materials Market Forecast for Plastic 2019-2029
• Regional and national Recycled Packaging Materials Market Forecasts from 2019-2029
• North America Recycled Packaging Materials Market Forecast 2019-2029
– US Recycled Packaging Materials Market Forecast 2019-2029
– Canada Recycled Packaging Materials Market Forecast 2019-2029
– Mexico Recycled Packaging Materials Market Forecast 2019-2029
• Europe Recycled Packaging Materials Market Forecast 2019-2029
– Germany Recycled Packaging Materials Market Forecast 2019-2029
– France Recycled Packaging Materials Market Forecast 2019-2029
– UK Recycled Packaging Materials Market Forecast 2019-2029
– Russia Recycled Packaging Materials Market Forecast 2019-2029
– Italy Recycled Packaging Materials Market Forecast 2019-2029
– Rest of Europe Recycled Packaging Materials Market Forecast 2019-2029
• Asia Pacific Recycled Packaging Materials Market Forecast 2019-2029
– Japan Recycled Packaging Materials Market Forecast 2019-2029
– Australia Recycled Packaging Materials Market Forecast 2019-2029
– China Recycled Packaging Materials Market Forecast 2019-2029
– India Recycled Packaging Materials Market Forecast 2019-2029
– South Korea Recycled Packaging Materials Market Forecast 2019-2029
– Rest of Asia Pacific Recycled Packaging Materials Market Forecast 2019-2029
• RoW Recycled Packaging Materials Market Forecast 2019-2029
– Brazil Recycled Packaging Materials Market Forecast 2019-2029
– South Africa Recycled Packaging Materials Market Forecast 2019-2029
– Saudi Arabia Recycled Packaging Materials Market Forecast 2019-2029
– Algeria Recycled Packaging Materials Market Forecast 2019-2029
– Rest of RoW Recycled Packaging Materials Market Forecast 2019-2029
• Recycled Packaging Materials Submarkets by End-user forecasts from 2019-2029
– Recycled Packaging Materials Market Forecast for Food & Beverages 2019-2029
– Recycled Packaging Materials Market Forecast for Personal Care 2019-2029
– Recycled Packaging Materials Market Forecast for Healthcare 2019-2029
– Recycled Packaging Materials Market Forecast for Others 2019-2029
• Profiles of the Leading 16 Recycled Packaging Materials Companies
• Albea SA
• Amcor
• Berkley International Packaging
• Berry Global Group, Inc.
• Biopac UK Ltd.
• DS Smith Plc
• International Paper
• Kruger Inc.
• Mondi Group
• PPG Industries, Inc.
• Ranpak Corporation
• Reynolds Group Holdings Ltd.
• Sealed Air Corp.
• Smurfit Kappa Group
• Tetra Pak
• Valmet Corp.
How will you benefit from this report?
• Keep your knowledge base up to speed. Don’t get left behind
• Reinforce your strategic decision-making with definitive and reliable market data
• Learn how to exploit new technological trends
• Realise your company’s full potential within the market
• Understand the competitive landscape and identify potential new business opportunities & partnerships
Who should read this report?
• Anyone within the packaging value chain
• Business development managers
• Marketing managers
• Technologists
• Suppliers
• Investors
• Banks
• Government agencies
• Contractors
Visiongains’s study is intended for anyone requiring commercial analyses for the Recycled Packaging Materials market and leading companies. You find data, trends and predictions.
Buy our report today Recycled Packaging Materials Market Report 2019-2029. Avoid missing out by staying informed – get our report now.
Visiongain is a trading partner with the US Federal Government
CCR Ref number: KD4R6
1. Report Overview
1.1 Global Recycled Packaging Materials Market Overview
1.2 Why You Should Read This Report
1.3 Key Questions Answered by This Analytical Report
1.4 Who is This Report For?
1.5 Methodology
1.5.1 Primary Research
1.5.2 Secondary Research
1.5.3 Market Evaluation & Forecasting Methodology
1.6 Frequently Asked Questions (FAQ)
1.7 Associated Visiongain Reports
1.8 About Visiongain
2. Introduction to Recycled Packaging Materials Market
2.1 What are Recycled Packaging Materials?
2.2 Classification of Recycled Packaging Materials
3. Recycled Packaging Materials: Global Market Forecast by Type 2019-2029
3.1 Metal Recycled Packaging Materials Submarket Forecast & Analysis 2019-2029
3.2 Paper & Paperboard Recycled Packaging Materials Submarket Forecast & Analysis 2019-2029
3.3 Glass Recycled Packaging Materials Submarket Forecast & Analysis 2019-2029
3.4 Plastic Recycled Packaging Materials Submarket Forecast & Analysis 2019-2029
4. Recycled Packaging Materials: Global Market Forecast by End User 2019-2029
4.1 Food & Beverages Recycled Packaging Materials Submarket Forecast & Analysis 2019-2029
4.2 Personal Care Recycled Packaging Materials Submarket Forecast & Analysis 2019-2029
4.3 Healthcare Recycled Packaging Materials Submarket Forecast & Analysis 2019-2029
4.4 Others Recycled Packaging Materials Submarket Forecast & Analysis 2019-2029
5. Regional and Leading National Recycled Packaging Materials Market Forecasts 2019-2029
5.1 North America Recycled Packaging Materials Market Forecast 2019-2029
5.1.1 U.S. Recycled Packaging Materials Market Forecast 2019-2029
5.1.2 Canada Recycled Packaging Materials Market Forecast 2019-2029
5.1.3 Mexico Recycled Packaging Materials Market Forecast 2019-2029
5.2 Europe Recycled Packaging Materials Market Forecast 2019-2029
5.2.1 UK Recycled Packaging Materials Market Forecast 2019-2029
5.2.2 Russia Recycled Packaging Materials Market Forecast 2019-2029
5.2.3 France Recycled Packaging Materials Market Forecast 2019-2029
5.2.4 Germany Recycled Packaging Materials Market Forecast 2019-2029
5.2.5 Italy Recycled Packaging Materials Market Forecast 2019-2029
5.2.6 Rest of Europe Recycled Packaging Materials Market Forecast 2019-2029
5.3 Asia-Pacific Recycled Packaging Materials Market Forecast 2019-2029
5.3.1 China Recycled Packaging Materials Market Forecast 2019-2029
5.3.2 Japan Recycled Packaging Materials Market Forecast 2019-2029
5.3.3 India Recycled Packaging Materials Market Forecast2019-2029
5.3.4 Australia Recycled Packaging Materials Market Forecast 2019-2029
5.3.5 South Korea Recycled Packaging Materials Market Forecast 2019-2029
5.3.6 Rest of Asia-Pacific Recycled Packaging Materials Market Forecasts 2019-2029
5.4 RoW Recycled Packaging Materials Market Forecasts 2019-2029
5.4.1 Brazil Recycled Packaging Materials Market Forecast 2019-2029
5.4.2 Saudi Arabia Recycled Packaging Materials Market Forecast 2019-2029
5.4.3 South Africa Recycled Packaging Materials Market Forecast 2019-2029
5.4.4 Algeria Recycled Packaging Materials Market Forecast 2019-2029
5.4.5 Rest of RoW Recycled Packaging Materials Market Forecast 2019-2029
6. Drivers & Restraints of the Recycled Packaging Materials Market
6.1 Drivers of the Recycled Packaging Materials Market 2019-2029
6.1.1 Product Innovation and Technological Advancements
6.1.2 Growing Demand for Lightweight Packaging Materials
6.1.3 Increasing Plastic Waste
6.2 Restraints of the Recycled Packaging Materials Market 2019-2029
6.2.1 High Manufacturing Costs of Recycled Packaging Materials
6.2.2 Stringent Regulatory Issues Associated with Recycled Packaging Materials
7. Leading Companies in the Recycled Packaging Materials Market
7.1 Amcor Limited
7.1.1 Amcor Limited Product Portfolio
7.1.2 Amcor Ltd. Sales Analysis
7.2 Albea SA.
7.2.1 Albea SA Product Portfolio
7.2.2 Albea SA Sales Analysis
7.3 Biopak
7.3.1 Biopak Product Portfolio
7.3.2 Biopak Sales Analysis
7.4 Berkley International Packaging
7.4.1 Berkley International Packaging Product Portfolio
7.5 Berry Global Group, Inc.
7.5.1 Berry Global Group Product Portfolio
7.5.2 Berry Global Group Sales Analysis
7.6 DS Smith Plc
7.6.1 DS Smith Plc Product Portfolio
7.6.2 DS Smith Plc Sales Analysis
7.7 International Paper
7.7.1 International Paper Product Portfolio
7.7.2 International Paper Sales Analysis
7.8 Kruger
7.8.1 Kruger Product Portfolio
7.8.2 Kruger Inc. Sales Analysis
7.9 Mondi Plc
7.9.1 Mondi Plc Product Portfolio
7.9.2 Mondi Plc Sales Analysis
7.10 PPG Industries, Inc.
7.10.1 PPG Industries, Inc. Product Portfolio
7.10.2 PPG Industries Inc Sales Analysis
7.11 Reynolds Group Holdings Limited
7.11.1 Reynolds Group Holdings Limited Product Portfolio
7.11.2 Reynolds Group Holdings Limited Sales Analysis
7.12 Ranpak Corporation
7.12.1 Ranpak Product Portfolio
7.12.2 Ranpak Corp Sales Analysis
7.13 Smurfit Kappa Group
7.13.1 Smurfit Kappa Group Product Portfolio
7.13.2 Smurfit Kappa Sales Analysis
7.14 Sealed Air Corp.
7.14.1 Sealed Air Corp Product Portfolio
7.14.2 Sealed Air Corp Sales Analysis
7.15 Tetra Pak
7.15.1 Tetra Pak Product Portfolio
7.15.2 Tetra Pak Sales Analysis
7.16 Valmet Corp.
7.16.1 Valmet Corp Product Portfolio
7.16.2 Valmet Corp Sales Analysis
7.17 Other Companies of Interest in the Recycled Packaging Market
8. Qualitative Analysis of the Recycled Packaging Materials Market
8.1 Porter’s Five Forces Analysis of the Recycled Packaging Materials Market
8.1.1 Rivalry among Competitors
8.1.2 The Threat of New Entrants
8.1.3 Power of Suppliers
8.1.4 Power of Buyers
8.1.5 The Threat of Substitutes
9. Conclusion
Glossary
Associated Visiongain Reports
Visiongain Report Sales Order Form
Appendix A
About Visiongain
Appendix B
Visiongain Report Evaluation Form
List of Figures
Figure 1.1 Leading Recycled Packaging Materials Market Players
Figure 2.1 Global Recycled Packaging Materials Market Segmentation Overview 2019
Figure 3.1 Global Recycled Packaging Materials Market Forecast 2019-2029 ($m, AGR%)
Figure 3.2 Global Recycled Packaging Materials Market Forecast 2019-2029 ($m)
Figure 3.3 Global Recycled Packaging Materials Market Share Forecast 2019, 2024, 2029 (%)
Figure 3.4 China Steel Scrap Used and Purchased for Steel Production 2014-2017 (Million Tons)
Figure 3.5 Global Metal Recycled Packaging Materials Market Forecast 2019-2029 ($m, AGR%)
Figure 3.6 Global Metal Recycled Packaging Materials Market Forecast by Region 2019-2029 ($m)
Figure 3.7 Global Paper & Paperboard Recycled Packaging Materials Market Forecast 2019-2029 ($m, AGR%)
Figure 3.8 Global Paper & Paperboard Recycled Packaging Materials Market Forecast by Region 2019-2029 ($m)
Figure 3.9 Global Glass Recycled Packaging Materials Market Forecast 2019-2029 ($m, AGR%)
Figure 3.10 Global Glass Recycled Packaging Materials Market Forecast by Region 2019-2029 ($m)
Figure 3.11 Global Plastic Recycled Packaging Materials Market Forecast 2019-2029 ($m, AGR%)
Figure 3.12 Global Plastic Recycled Packaging Materials Market Forecast by Region 2019-2029 ($m)
Figure 4.1 Global Recycled Packaging Materials Market Share Forecast By End User 2019, 2024, 2029 (%)
Figure 4.2 Global Recycled Packaging Materials Market Forecast for Food & Beverages 2019-2029 ($m, AGR%)
Figure 4.3 Global Recycled Packaging Materials Market Forecast for Food & Beverages by Region 2019-2029 ($m)
Figure 4.4 Global Recycled Packaging Materials Market Forecast for Personal Care 2019-2029 ($m, AGR%)
Figure 4.5 Global Recycled Packaging Materials Market Forecast for Personal Care by Region 2019-2029 ($m)
Figure 4.6 U.S. Health Expenditure Per Capita 2014-2017 ($ U.S.)
Figure 4.7 Global Recycled Packaging Materials Market Forecast for Healthcare 2019-2029 ($m, AGR%)
Figure 4.8 Global Recycled Packaging Materials Market Forecast for Healthcare by Region 2019-2029 ($m)
Figure 4.9 Global Recycled Packaging Materials Market Forecast for Other End-Uses 2019-2029 ($m, AGR%)
Figure 4.10 Global Recycled Packaging Materials Market Forecast for Other End-Uses by Region 2019-2029 ($m)
Figure 5.1 Global Recycled Packaging Materials Market Share Forecast for Regions 2019, 2024, and 2029 (%)
Figure 5.2 North America Recycled Packaging Materials Market Forecast by Country 2019-2029 ($m)
Figure 5.3 US Recycled Packaging Materials Market Forecast 2019-2029 ($m, AGR%)
Figure 5.4 Canada Recycled Packaging Materials Market Forecast 2019-2029 ($m, AGR%)
Figure 5.5 Mexico Recycled Packaging Materials Market Forecast 2019-2029 ($m, AGR%)
Figure 5.6 Europe Recycled Packaging Materials Market Forecast 2019-2029 ($m, AGR%)
Figure 5.7 Europe Recycled Packaging Materials Market Forecast by Country 2019-2029 ($m)
Figure 5.8 UK Recycled Packaging Materials Market Forecast 2019-2029 ($m, AGR%)
Figure 5.9 Russia Recycled Packaging Materials Market Forecast 2019-2029 ($m, AGR%)
Figure 5.10 France Recycled Packaging Materials Market Forecast 2019-2029 ($m, AGR%)
Figure 5.11 Germany Recycled Packaging Materials Market Forecast 2019-2029 ($m, AGR%)
Figure 5.12 Italy Recycled Packaging Materials Market Forecast 2019-2029 ($m, AGR%)
Figure 5.13 Rest of Europe Recycled Packaging Materials Market Forecast 2019-2029 ($m, AGR%)
Figure 5.14 Asia-Pacific Recycled Packaging Materials Market Forecast 2019-2029 ($m, AGR%)
Figure 5.15 Asia-Pacific Recycled Packaging Materials Market Forecast by Country 2019-2029 ($Mn)
Figure 5.16 China Recycled Packaging Materials Market Forecast 2019-2029 ($m, AGR%)
Figure 5.17 Japan Recycled Packaging Materials Market Forecast 2019-2029 ($m, AGR%)
Figure 5.18 India Recycled Packaging Materials Market Forecast 2019-2029 ($m, AGR%)
Figure 5.19 Australia Recycled Packaging Materials Market Forecast 2019-2029 ($m, AGR%)
Figure 5.20 South Korea Recycled Packaging Materials Market Forecast 2019-2029 ($m, AGR%)
Figure 5.21 Rest of Asia Pacific Recycled Packaging Materials Market Forecast 2019-2029 ($m, AGR%)
Figure 5.22 Rest of World Recycled Packaging Materials Market Forecast 2019-2029 ($m, AGR%)
Figure 5.23 Rest of World Recycled Packaging Materials Market Forecast by Country 2019-2029 ($Mn)
Figure 5.24 Brazil Recycled Packaging Materials Market Forecast 2019-2029 ($m, AGR%)
Figure 5.25 Saudi Arabia Recycled Packaging Materials Market Forecast 2019-2029 ($m, AGR%)
Figure 5.26 South Africa Recycled Packaging Materials Market Forecast 2019-2029 ($m, AGR%)
Figure 5.27 Algeria Recycled Packaging Materials Market Forecast 2019-2029 ($m, AGR%)
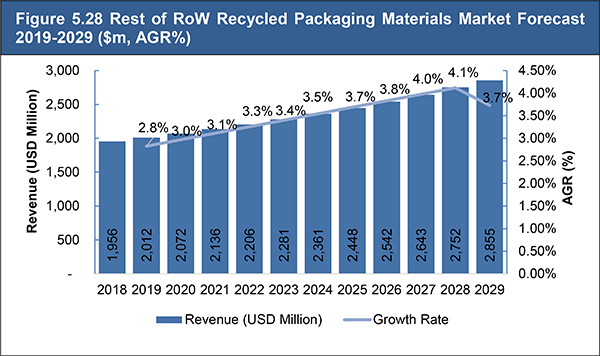
Figure 5.28 Rest of RoW Recycled Packaging Materials Market Forecast 2019-2029 ($m, AGR%)
Figure 6.1 Market: Drivers and Restraints 2019-2029
Figure 7.1 Amcor Ltd Sales 2016-2018 (USD Million)
Figure 7.2 Amcor Ltd Sales by Business Segments 2018 (% Share)
Figure 7.3 Amcor Limited Sales by Geography 2018 (% Share)
Figure 7.4 Albea SA Sales 2015-2017 (USD Million)
Figure 7.5 Biopak Sales 2016-2018 (USD Million)
Figure 7.6 Berry Global Group Sales 2016-2018 (USD Million)
Figure 7.7 DS Smith Plc Sales 2016-2018 (USD Million)
Figure 7.8 International Paper Sales 2016-2018 (USD Million)
Figure 7.9 International Paper Sales by Business Segments 2018 (% Share)
Figure 7.10 Kruger Inc. Sales 2016-2018 (USD Million)
Figure 7.11 Kruger Inc Sales by Business Segments 2018 (% Share)
Figure 7.12 Mondi Plc Sales 2015-2017 (USD Million)
Figure 7.13 Mondi Plc Sales by Business Segments 2017 (% Share)
Figure 7.14 Mondi Plc Sales by Region 2017 (% Share)
Figure 7.15 PPG Industries Sales 2016-2018 (USD Million)
Figure 7.16 Reynolds Group Holdings Limited Sales 2016-2018 (USD Million)
Figure 7.17 Reynolds Group Holdings Limited Sales by Business Segments 2018 (% Share)
Figure 7.18 Smurfit Kappa Sales 2016-2018 (USD Million)
Figure 7.19 Smurfit Kappa Sales by Region 2018 (% Share)
Figure 7.20 Smurfit Kappa Sales by Country 2018 (% Share)
Figure 7.21 Sealed Air Corp Sales Analysis 2015-2017 (USD Million)
Figure 7.22 Tetra Pak Sales 2015-2017 (USD Million)
Figure 7.23 Tetra Pak Sales by Business Segments 2017 (% Share)
Figure 7.24 Tetra Pak Sales by Region 2017 (% Share)
Figure 7.25 Valmet Corp Sales 2016-2018 (USD Million)
Figure 7.26 Valmet Corp Sales by Segment 2018 (%)
Figure 8.1 Porter’s Five Forces Analysis of the Recycled Packaging Materials Market 2019-2029
List of Tables
Table 3.1 Global Recycled Packaging Materials Market Forecast by Type 2019-2023 ($m, AGR%, CAGR%)
Table 3.2 Global Recycled Packaging Materials Market Forecast by Type 2024-2029 ($m, AGR%, CAGR%)
Table 3.3 Global Metal Recycled Packaging Materials Market Forecast by Region 2018-2023 ($m, AGR%, CAGR%)
Table 3.4 Global Metal Recycled Packaging Materials Market Forecast by Region 2024-2029 ($m, AGR%, CAGR%)
Table 3.5 Global Paper & Paperboard Recycled Packaging Materials Market Forecast by Region 2018-2023 ($m, AGR%, CAGR%)
Table 3.6 Global Paper & Paperboard Recycled Packaging Materials Market Forecast by Region 2024-2029 ($m, AGR%, CAGR%)
Table 3.7 Global Glass Recycled Packaging Materials Market Forecast by Region 2018-2023 ($m, AGR%, CAGR%)
Table 3.8 Global Glass Recycled Packaging Materials Market Forecast by Region 2024-2029 ($m, AGR%, CAGR%)
Table 3.9 Global Plastic Recycled Packaging Materials Market Forecast by Region 2018-2023 ($m, AGR%, CAGR%)
Table 3.10 Global Plastic Recycled Packaging Materials Market Forecast by Region 2024-2029 ($m, AGR%, CAGR%)
Table 4.1 Global Recycled Packaging Materials Market Forecast by End User 2018-2023 ($m, AGR%, CAGR%)
Table 4.2 Global Recycled Packaging Materials Market Forecast by End User 2024-2029 ($m, AGR%, CAGR%)
Table 4.3 Global Recycled Packaging Materials Market Forecast for Food & Beverages by Region 2018-2023 ($m, AGR%, CAGR%)
Table 4.4 Global Recycled Packaging Materials Market Forecast for Food & Beverages by Region 2024-2029 ($m, AGR%, CAGR%)
Table 4.5 Global Recycled Packaging Materials Market Forecast for Personal Care by Region 2018-2023 ($m, AGR%, CAGR%)
Table 4.6 Global Recycled Packaging Materials Market Forecast for Personal Care by Region 2024-2029 ($m, AGR%, CAGR%)
Table 4.7 Global Recycled Packaging Materials Market Forecast for Healthcare by Region 2018-2023 ($m, AGR%, CAGR%)
Table 4.8 Global Recycled Packaging Materials Market Forecast for Healthcare by Region 2024-2029 ($m, AGR%, CAGR%)
Table 4.9 Global Recycled Packaging Materials Market Forecast for Other End-Uses by Region 2018-2023 ($m, AGR%, CAGR%)
Table 4.10 Global Recycled Packaging Materials Market Forecast for Other End-Uses by Region 2024-2029 ($m, AGR%, CAGR%)
Table 5.1 Global Recycled Packaging Materials Market Forecast by Region 2018-2023 ($m, AGR%, CAGR%)
Table 5.2 Global Recycled Packaging Materials Market Forecast by Region 2024-2029 ($m, AGR%, CAGR%)
Table 5.3 North America Recycled Packaging Materials Market Forecast by Type 2018-2023 ($m, AGR%, CAGR%)
Table 5.4 North America Recycled Packaging Materials Market Forecast byType 2024-2029 ($m, AGR%, CAGR%)
Table 5.5 North America Recycled Packaging Materials Market Forecast by End User 2018-2023 ($m, AGR%, CAGR%)
Table 5.6 North America Recycled Packaging Materials Market Forecast by End User 2024-2029 ($m, AGR%, CAGR%)
Table 5.7 North America Recycled Packaging Materials Market Forecast by Country 2018-2023 ($m, AGR%, CAGR%)
Table 5.8 North America Recycled Packaging Materials Market Forecast by Country 2024-2029 ($m, AGR%, CAGR%)
Table 5.9 Europe Recycled Packaging Materials Market Forecast by Type 2018-2023 ($m, AGR%, CAGR%)
Table 5.10 Europe Recycled Packaging Materials Market Forecast by Type 2024-2029 ($m, AGR%, CAGR%)
Table 5.11 Europe Recycled Packaging Materials Market Forecast by End User 2018-2023 ($m, AGR%, CAGR%)
Table 5.12 Europe Recycled Packaging Materials Market Forecast by End User 2024-2029 ($m, AGR%, CAGR%)
Table 5.13 Europe Recycled Packaging Materials Market Forecast by Country 2018-2023 ($m, AGR%, CAGR%)
Table 5.14 Europe Recycled Packaging Materials Market Forecast by Country 2024-2029 ($m, AGR%, CAGR%)
Table 5.15 Asia-Pacific Recycled Packaging Materials Market Forecast by Type 2018-2023 ($m, AGR%, CAGR%)
Table 5.16 Asia-Pacific Recycled Packaging Materials Market Forecast by Type 2024-2029 ($m, AGR%, CAGR%)
Table 5.17 Asia-Pacific Recycled Packaging Materials Market Forecast by End User 2018-2023 ($m, AGR%, CAGR%)
Table 5.18 Asia-Pacific Recycled Packaging Materials Market Forecast by End User 2024-2029 ($m, AGR%, CAGR%)
Table 5.19 Asia-Pacific Recycled Packaging Materials Market Forecast by Country 2018-2023 ($m, AGR%, CAGR%)
Table 5.20 Asia-Pacific Recycled Packaging Materials Market Forecast by Country 2024-2029 ($m, AGR%, CAGR%)
Table 5.21 RoW Recycled Packaging Materials Market Forecast by Type 2018-2023 ($m, AGR%, CAGR%)
Table 5.22 RoW Recycled Packaging Materials Market Forecast by Type 2024-2029 ($m, AGR%, CAGR%)
Table 5.23 RoW Recycled Packaging Materials Market Forecast by End User 2018-2023 ($m, AGR%, CAGR%)
Table 5.24 RoW Recycled Packaging Materials Market Forecast by End User 2024-2029 ($m, AGR%, CAGR%)
Table 5.25 RoW Recycled Packaging Materials Market Forecast by Country 2018-2023 ($m, AGR%, CAGR%)
Table 5.26 RoW Recycled Packaging Materials Market Forecast by Country 2024-2029 ($m, AGR%, CAGR%)
Table 7.1 Amcor Limited Product Range (Product, Product Type)
Table 7.2 Amcor Ltd Sales 2016-2018 (USD Million)
Table 7.3 Amcor Limited Sales by Geography 2018 (% Share)
Table 7.4 Albea SA Product Range (Product Segment, Product)
Table 7.5 Albea SA Sales 2015-2017 (USD Million)
Table 7.6 Biopak Product Range (Product. Type)
Table 7.7 Biopak Sales 2016-2018 (USD Million)
Table 7.8 Berkley International Packaging Product Range (Product, Product Type)
Table 7.9 Berry Global Group Product Range (Product Segment, Application)
Table 7.10 Berry Global Group Sales 2016-2018 (USD Million)
Table 7.11 DS Smith Plc Product Range (Product Segment, Products Offering)
Table 7.12 DS Smith Plc Sales 2016-2018 (USD Million)
Table 7.13 International Paper Product Range (Product Segment, Application)
Table 7.14 International Paper Sales Analysis 2016-2018 (USD Million)
Table 7.15 Kruger Product Range (Products, Type)
Table 7.16 Kruger Inc Sales 2016-2018 (USD Million)
Table 7.17 Mondi Plc Product Range (Product, Type)
Table 7.18 Mondi Plc Sales 2015-2017 (USD Million)
Table 7.19 Mondi Plc Sales by Region 2016 Vs 2017 (% Share)
Table 7.20 PPG Industries, Inc. Product Range (product Segment, Application)
Table 7.21 PPG Industries Sales 2016-2018 ($m)
Table 7.22 Reynolds Group Holdings Limited Product Range (Product, Type)
Table 7.23 Reynolds Group Holdings Limited Sales 2016-2018 (Year, Revenue)
Table 7.24 Ranpak Corporation Product Range (Application, Product Type)
Table 7.25 Ranpak Corp Sales 2015-2017 (USD Million)
Table 7.26 Smurfit Kappa Group Product Range (Product, Product Type)
Table 7.27 Smurfit Kappa Sales 2016-2018 (USD Million)
Table 7.28 Smurfit Kappa Sales by Region 2018 (% Share)
Table 7.29 Sealed Air Corp Product Range Product Segment, Product)
Table 7.30 Sealed Air Corp Sales 2015-2017 (USD Million)
Table 7.31 Tetra Pak Product Range (Brand, Product Type)
Table 7.32 Tetra Pak Sales Analysis 2015-2017 (USD Million)
Table 7.33 Tetra Pak Sales by Region 2016 vs 2017 (% Share)
Table 7.34 International Paper Product Range (Product Segment, Product)
Table 7.35 Valmet Corp Sales 2016-2018 (USD Million)
Table 7.36 Other Companies of Interest in the Recycled Packaging Market
Å&R Carton Ab
Allied Glass Containers Limited
Amcor Limited
Amcor Rigid Plastics Usa Llc
American Forest & Paper Association Inc.
American Packaging Corporation
Ampac Holdings Llc
Anchor Packaging Inc.
Asahi Glass Co., Ltd.
Ball Corporation
Biopak
Bowler Metcalf Ltd.
Cellmark Ab
Chuo Kagaku Co., Ltd.
Confederation Of Paper Industries Limited
Corning, Inc.
Cosmo Films Ltd.
CPMC Holdings Ltd.
Crown Holdings, Inc.
Ctl Packaging Sas
Custom Building Products Inc.
DS Smith Plc
Ennis, Inc.
Graham Packaging Company Europe Llc
Groupe Guillin SA
Helesi Plc
Hindusthan National Glass & Industries Ltd.
Hop Fung Group Holdings Ltd.
Huangshan Novel Co., Ltd.
Innovia Films Limited
Intertape Polymer Group, Inc.
Kruger Inc.
Lecta SA
Longhorn Glass Manufacturing L.P.
Lush cosmetics
Maynard & Harris Group Limited
Mondi Consumer Goods Packaging Uk Ltd
Mondi Plc
Mould & Matic Solutions Gmbh
Natura Cosméticos
Nihon Yamamura Glass Co., Ltd.
Nine Dragons Paper Holdings Ltd.
Owens-Illinois, Inc.
Pact Group Holdings Ltd.
Pactiv Llc
Papeles y Cartones de Europa SA
Parksons Packaging Limited
Pilkington Group Limited
Plascore, Inc
Plastic Systems Inc
Plastipak Holdings Inc.
Printpack Inc.
Procter & Gamble
PT Fajar Surya Wisesa Tbk
PT Trias Sentosa Tbk
Remcon Plastics Inc.
Rexam Plc
Reynolds Group Holdings Ltd.
Rigolleau SA
Ruchira Papers Ltd.
S. D. Warren Company
Sealed Air Corp.
Sequana SA
Smurfit Kappa Group Plc
Starlite Holdings Ltd.
Storopack Hans Reichenecker GmbH
SvenskaCellulosa AB
Tetra Pak
The Bryce Corporation
Toscana Ondulati Spa
Uflex Ltd.
Unilever
Verallia Deutschland AG
Vidrala SA
Wisconsin Film & Bag Inc.
ZignagoVetro SpA
List of Other Organisations Mentioned in this Report
Brazilian Aluminium Association (ABAL)
Brazilian Association of Can Manufacturers (ABRALATAS)
Consumer Specialty Products Association (CSPA)
Environmental Protection Agency (EPA)
European Corrugated Packaging Association
Food and Drug Administration (FDA)
Government of China
ONG Evoluir
Steel Recycling Institute
Taiwanese Environmental Protection Agency
The Government of Vietnam
The Packaging Covenant Body in Australia
The Taiwanese Government

