Industries > Packaging > PET Packaging Market Forecast 2018-2028
PET Packaging Market Forecast 2018-2028
By Pack Type (Bottles & Jars, Bags & Pouches, Trays, Lids, Caps & Closures); by Filling Technology (Hot Fill, Cold Fill, and Aseptic Fill); by Packaging Type (Rigid and Flexible); by Application (Carbonated Soft Drinks, Water, Juices, Beer, Food Bottles & Jars, Non-food Bottles & Jars); by End-User Industries (Food, Beverage, Personal Care & Cosmetic, Household Products, Pharmaceuticals)
Now: Why is the PET Packaging market important right now?
As part of the broader $798bn packaging market space, there are massive revenue streams within PET Packaging to tap into. This report shows you where these business opportunities are.
What are the PET Packaging market prospects?
Visiongain’s definitive new report assesses that the PET Packaging market will exceed $56bn in 2017.
Visiongain’s timely 309-page report reveals how best to compete in this lucrative market space and maximize your company’s potential.
Read on to discover how this report can help you develop your business.
This report addresses the pertinent issues:
• Where are the most lucrative market prospects?
• Who are the leadings companies and what does the competitive landscape look like?
• What are the regional, technical and regulatory barriers to market entry?
• What are the technological issues and roadmap driving the market?
• Why is the market prospering and how can you fully exploit this?
• When will the market fully mature and why?
Research and analysis highlights
• Independent, impartial and objective analysis
• 226 tables, charts and graphs illustrating the PET Packaging market prospects
• Global PET Packaging market forecast and analysis by value and volume 2018-2028
• 5 PET Packaging submarket forecasts by pack type (by value and volume) covering the period 2018-2028
• 4 PET Packaging submarket forecasts by filling technology (by value and volume) from 2018-2028
• 2 PET Packaging submarket forecasts by packaging type (by value and volume) from 2018-2028
• 8 PET Packaging submarket forecasts by application (by value and volume) from 2018-2028
• 6 PET Packaging submarket forecasts by end user industries (by value and volume) from 2018-2028
• 4 leading regional PET Packaging market forecasts from 2018-2028
• 15 leading national PET Packaging market forecasts from 2018-2028
• Profiles of 10 leading companies, involved with PET Packaging with key financial metrics
• SWOT / PEST analysis
And there’s more.
How this report will benefit you
• You have almost certainly an excess of conflicting and yet unclear information – you want one definitive report to base your business decisions upon – this visiongain report provides that clarity
• Our insightful report speaks to your needs for definitive market data, objective impartial analysis and immediate clear conclusions – to allow you to formulate clear decisive business strategies
• You need the information now in an easily digestible form – this is where this visiongain reports excels
• Forecasts give you a crucial advantage. That knowledge of the future is central to your strategic decision making.
• Knowledge is vital to you and your business. You need every piece of evidence to inform your crucial investment decisions – let visiongain give you that clear advantage
• Without this vital report, you will fall behind your competitors
Who should read this report?
• Contractors
• Suppliers
• Technologists
• Business development managers
• Marketing managers
• Investors
• Consultancies
Don’t miss out on this business advantage
This information is not available elsewhere. With our report you are less likely to fall behind in knowledge or miss opportunity. Discover how the report benefits your research, analyses, and decisions. Also see how you save time and receive recognition for commercial insight.
Visiongain’s PET Packaging Market Analysis: By Pack Type (Bottles & Jars, Bags & Pouches, Trays, Lids, Caps & Closures, and Others); by Filling Technology (Hot Fill, Cold Fill, and Aseptic Fill & Others); by Packaging Type (Rigid and Flexible); by Application (Carbonated Soft Drinks, Water, Juices, Beer, Food Bottles & Jars, Non-food Bottles & Jars, Thermoforming, and Others); by End-User Industries (Food, Beverage, Personal Care & Cosmetic, Household Products, Pharmaceuticals, and Others). Please order our report now.
Visiongain is a trading partner with the US Federal Government
CCR Ref number: KD4R6
1. Report Overview
1.1 Global PET Packaging Market
1.2 Why You Should Read This Report
1.3 How This Report Delivers
1.4 Key Questions Answered by This Analytical Report
1.5 Who is This Report For?
1.6 Methodology
1.7 Frequently Asked Questions (FAQ)
1.8 Associated Visiongain Reports
1.9 About Visiongain
2. Introduction To PET Packaging
2.1 Segmentation of PET Packaging Market
3. PET Packaging: Global Market By Pack Type, 2017-2028
3.1 PET Bottles & Jars Market Forecast & Analysis 2017-2028
3.1.1 PET Bottles & Jars Market Forecast & Analysis By Region, 2017-2028
3.2 PET Bags & Pouches Market Forecast & Analysis 2017-2028
3.2.1 PET Bags & Pouches Market Forecast & Analysis By Region, 2017-2028
3.3 PET Trays Market Forecast & Analysis 2017-2028
3.3.1 PET Trays Market Forecast & Analysis By Region, 2017-2028
3.4 PET Lids, Caps & Closure Market Forecast & Analysis 2017-2028
3.4.1 PET Lids, Caps & Closure Market Forecast & Analysis by Region, 2017-2028
3.5 Other PET Pack Type Market Forecast & Analysis 2017-2028
3.5.1 Other PET Pack Type Market Forecast & Analysis By Region, 2017-2028
4. PET Packaging: Global Market By Packaging Type, 2017-2028
4.1 Rigid PET Packaging Market Forecast & Analysis 2017-2028
4.1.1 Rigid PET Packaging Market Forecast & Analysis By Region, 2017-2028
4.2 Flexible PET Packaging Market Forecast & Analysis 2017-2028
4.2.1 Flexible PET Packaging Market Forecast & Analysis by Region, 2017-2028
5. PET Packaging: Global Market By Filling Technology, 2017-2028
5.1 Hot Fill PET Packaging Market Forecast & Analysis 2017-2028
5.1.1 Hot fill PET Packaging Market Forecast & Analysis by Region, 2017-2028
5.2 Cold Fill PET Packaging Market Forecast & Analysis 2017-2028
5.2.1 Cold Fill PET packaging Market Forecast & Analysis by Region, 2017-2028
5.3 Aseptic Fill PET Packaging Market Forecast & Analysis 2017-2028
5.3.1 Aseptic Fill PET Packaging Market Forecast & Analysis by Region, 2017-2028
6. PET Packaging: Global Market By Application, 2017-2028
6.1 PET Carbonated Soft Drinks Packaging Market Forecast & Analysis 2017-2028
6.1.1 PET Carbonated Soft drinks packaging Market Forecast & Analysis by Region, 2017-2028
6.2 PET Water Packaging Market Forecast & Analysis 2017-2028
6.2.1 PET Water Packaging Market Forecast & Analysis by Region, 2017-2028
6.3 PET Fruit Juice Packaging Market Forecast & Analysis 2017-2028
6.3.1 PET Fruit Juice Packaging Market Forecast & Analysis by Region, 2017-2028
6.4 PET Beer Packaging Market Forecast & Analysis 2017-2028
6.4.1 PET Beer Packaging Market Forecast & Analysis by Region, 2017-2028
6.5 PET Other Drinks Packaging Market Forecast & Analysis 2017-2028
6.5.1 PET Other Drinks Packaging Market Forecast & Analysis by Region, 2017-2028
6.6 PET Food Bottles & Jars Packaging Market Forecast & Analysis 2017-2028
6.6.1 PET Food Bottles & Jars Packaging Market Forecast & Analysis by Region, 2017-2028
6.7 PET Non Food Bottles & Jars Packaging Market Forecast & Analysis 2017-2028
6.7.1 PET Non Food Bottles & Jars Packaging Market Forecast & Analysis by Region, 2017-2028
6.8 PET Thermoform Packaging Market Forecast & Analysis 2017-2028
6.8.1 PET Thermoform Packaging Market Forecast & Analysis by Region, 2017-2028
7. PET Packaging: Global Market By End User Industries, 2017-2028
7.1 PET Food Packaging Market Forecast & Analysis 2017-2028
7.1.1 PET Food Packaging Market Forecast & Analysis by Region, 2017-2028
7.2 PET Beverage Packaging Market Forecast & Analysis 2017-2028
7.2.1 PET Beverage Packaging Market Forecast & Analysis by Region, 2017-2028
7.3 PET Personal Care & Cosmetic Packaging Market Forecast & Analysis 2017-2028
7.3.1 PET Personal Care & Cosmetic Packaging Market Forecast & Analysis by Region, 2017-2028
7.4 PET Household Products Packaging Market Forecast & Analysis 2017-2028
7.4.1 PET Household Products Packaging Market Forecast & Analysis by Region, 2017-2028
7.5 PET Pharmaceuticals Packaging Market Forecast & Analysis 2017-2028
7.5.1 PET Pharmaceuticals Packaging Market Forecast & Analysis by Region, 2017-2028
7.6 PET Packaging in Others Market Forecast & Analysis 2017-2028
7.6.1 PET Packaging in Others Market Forecast & Analysis by Region, 2017-2028
8. PET Packaging: Global Market By Geography, 2017-2028
8.1 North America PET Packaging Market Forecasts 2017-2028
8.1.1 North America PET Packaging Market Forecast & Analysis By Pack Type, 2017-2028
8.1.2 North America PET Packaging Market Forecast & Analysis By Packaging Type, 2017-2028
8.1.3 North America PET Packaging Market Forecast & Analysis By Filling technology, 2017-2028
8.1.4 North America PET Packaging Market Forecast & Analysis By Application, 2017-2028
8.1.5 North America PET Packaging Market Forecast & Analysis By End User, 2017-2028
8.1.6 North America PET Packaging Market Forecast & Analysis By Country, 2017-2028
8.1.6.1 U.S. PET Packaging Market Forecasts 2018-28
8.1.6.2 Canada PET Packaging Market Forecasts 2018-28
8.1.6.3 Mexico PET Packaging Market Forecasts 2018-28
8.2 Europe PET Packaging Market Forecasts 2018-2028
8.2.1 Europe PET Packaging Market Forecast & Analysis By Pack Type, 2017-2028
8.2.2 Europe PET Packaging Market Forecast & Analysis By Packaging Type, 2017-2028
8.2.3 Europe PET Packaging Market Forecast & Analysis By Filling technology, 2017-2028
8.2.4 Europe PET Packaging Market Forecast & Analysis By Application, 2017-2028
8.2.5 Europe PET Packaging Market Forecast & Analysis By End User, 2017-2028
8.2.6 Europe PET Packaging Market Forecast & Analysis By Country, 2017-2028
8.2.6.1 UK PET Packaging Market Forecasts 2018-28
8.2.6.2 Germany PET Packaging Market Forecasts 2018-28
8.2.6.3 France PET Packaging Market Forecasts 2018-28
8.2.6.4 Spain PET Packaging Market Forecasts 2018-28
8.2.6.5 Italy PET Packaging Market Forecasts 2018-28
8.2.6.6 Russia PET Packaging Market Forecasts 2018-28
8.2.6.7 Rest Of Europe PET Packaging Market Forecasts 2018-28
8.3 Asia-Pacific PET Packaging Market Forecasts 2018-28
8.3.1 Asia-Pacific PET Packaging Market Forecast & Analysis By Pack Type, 2017-2028
8.3.2 Asia-Pacific PET Packaging Market Forecast & Analysis By Packaging Type, 2017-2028
8.3.3 Asia-Pacific PET Packaging Market Forecast & Analysis By Filling technology, 2017-2028
8.3.4 Asia-Pacific PET Packaging Market Forecast & Analysis By Application, 2017-2028
8.3.5 Asia-Pacific PET Packaging Market Forecast & Analysis By End User, 2017-2028
8.3.6 Asia-Pacific PET Packaging Market Forecast & Analysis By Country, 2017-2028
8.3.6.1 China PET Packaging Market Forecasts 2018-28
8.3.6.2 Japan PET Packaging Market Forecasts 2018-28
8.3.6.3 India PET Packaging Market Forecasts 2018-28
8.3.6.4 Rest Of Asia-Pacific PET Packaging Market Forecasts 2018-28
8.4 LAMEA PET Packaging Market Forecasts 2018-28
8.4.1 LAMEA PET Packaging Market Forecast & Analysis By Pack Type, 2017-2028
8.4.2 LAMEA PET Packaging Market Forecast & Analysis By Packaging Type, 2017-2028
8.4.3 LAMEA PET Packaging Market Forecast & Analysis By Filling technology, 2017-2028
8.4.4 LAMEA PET Packaging Market Forecast & Analysis By Application, 2017-2028
8.4.5 LAMEA PET Packaging Market Forecast & Analysis By End User, 2017-2028
8.4.6 LAMEA PET Packaging Market Forecast & Analysis By Country, 2017-2028
8.4.6.1 South Africa PET Packaging Market Forecasts 2018-28
8.4.6.2 Brazil PET Packaging Market Forecasts 2018-28
8.4.6.3 Turkey PET Packaging Market Forecasts 2018-28
8.4.6.4 Rest Of LAMEA PET Packaging Market Forecasts 2018-28
9. Qualitative Analysis: PET Packaging
9.1 Market Dynamics
9.1.1 Drivers
9.1.1.1 Increasing Population & Growing Per Capita Income in Developing Economies
9.1.1.2 Replacement of Traditional Packaging Materials
9.1.1.3 Expanding Application Areas of PET Packaging
9.1.2 Restraints
9.1.2.1 Lack of Appropriate Recycling Infrastructures
9.1.2.2 Volatility In Raw Material Prices
9.1.3 Opportunities
9.1.3.1 Growing Demand from Emerging Economies
9.1.3.2 Premium and Value-add Opportunities
9.2 Porter’s Five Forces Analysis for the PET Packaging
9.2.1 Bargaining Power Of Suppliers:
9.2.2 Bargaining Power Of Buyers
9.2.3 Threat Of Substitutes
9.2.4 Threat Of New Entrants
9.2.5 Intensity Of Competitive Rivalry
10. Leading Companies In The PET Packaging Market
10.1 Amcor Limited
10.1.1 Amcor Limited Product Portfolio
10.1.2 AMCOR Limited Financial Performance Overview
10.1.3 Amcor Limited Financial Performance
10.1.4 Amcor Limited Segment Information
10.1.5 Amcor Limited Geographic Analysis
10.2 Gerresheimer AG
10.2.1 Gerresheimer AG Product Portfolio
10.2.2 Gerresheimer AG Financial Performance Overview
10.2.3 Gerresheimer AG Financial Performance
10.2.4 Gerresheimer AG Segment Information
10.2.5 Gerresheimer AG Geographic Analysis
10.3 RPC GROUP PLC
10.3.1 RPC GROUP PLC Product Portfolio
10.3.2 RPC GROUP PLC Financial Performance Overview
10.3.3 RPC GROUP PLC Financial Performance
10.3.4 RPC GROUP -PLC Segment Information
10.3.5 RPC GROUP PLC Geographic Analysis
10.4 Silgan Holdings
10.4.1 Silgan Holdings Product Portfolio
10.4.2 Silgan Holdings Financial Performance Overview
10.4.3 Silgan Holdings Financial Performance
10.4.4 Silgan Holdings Segment Information
10.4.5 Silgan Holdings Geographic Analysis
10.5 Tetra Laval International S.A.
10.5.1 Tetra Laval International S.A. Product Portfolio
10.5.2 Tetra Laval International S.A. Financial Performance Overview
10.5.3 Tetra Laval International S.A. Financial Performance
10.5.4 Tetra Laval International S.A. Segment Information
10.5.5 Tetra Laval International S.A. Geographic Analysis
10.5.6 Tetra Laval International S.A. Geographic Analysis
10.5.7 Tetra Laval International S.A. Geographic Analysis
10.6 Graham Packaging Company
10.6.1 Graham Packaging Company Product Portfolio
10.7 Resilux NV
10.7.1 Resilux NV Product Portfolio
10.7.2 Resilux NV Financial Performance Overview
10.7.3 Resilux NV Financial Performance
10.7.4 Resilux NV Segment Information
10.8 Plastipak Holdings, Inc.
10.8.1 Plastipak Holdings, Inc. Product Portfolio
10.8.2 Plastipak Holdings, Inc. Financial Performance Overview
10.9 CKS Packaging, Inc.
10.9.1 CKS Packaging, Inc. Product Portfolio
10.9.2 CKS Packaging, Inc. Financial Performance Overview
10.10 Berry Global Inc.
10.10.1 Berry Global Inc. Product Portfolio
10.10.2 Berry Global Inc. Financial Performance Overview
10.10.3 Berry Global Inc. Financial Performance
10.10.4 Berry Global Inc. Segment Information
10.10.5 Berry Global Inc. Geographic Analysis
10.11 Huhtamaki Group
10.11.1 Huhtamaki Group Product Portfolio
10.11.2 Huhtamaki Group Financial Performance Overview
10.11.3 Huhtamaki Group Financial Performance
10.11.4 Huhtamaki Group Segment Information
10.11.5 Huhtamaki Group Geographic Analysis
10.12 ALPLA
10.12.1 ALPLA Product Portfolio
10.12.2 ALPLA Financial Performance Overview
11. Conclusion & Recommendation
12. Glossary
Associated Visiongain Reports
Visiongain Report Sales Order Form
Appendix A
About Visiongain
Appendix B
Visiongain report evaluation form
Visiongain report evaluation form
List of Figures
Figure 1.1 Leading Market Players PET Packaging Industry
Figure 2.1. Global PET Packaging Market Segmentation Overview, 2017
Figure 3.1. Global PET Packaging Market Volume by Pack Type, 2016, (% Share)
Figure 3.2. Global PET Packaging Market Revenue by Type, 2016, (% Share)
Figure 4.1. Global PET Packaging Market Volume by Packaging Type, 2016, (% Share)
Figure 4.2. Global PET Packaging Market Revenue by Packaging Type, 2016, (% Share)
Figure 5.1 Global PET Packaging Market Volume by Filling Technology, 2016, (% Share)
Figure 5.2. Global PET Packaging Market Revenue by Filling Technology, 2016, (% Share)
Figure 6.1. Global PET Packaging Market Volume by Application, 2016, (% Share)
Figure 6.2. Global PET Packaging Market Revenue by Application, 2016, (% Share)
Figure 7.1. Global PET Packaging Market Volume by End User Industries, 2016, (% Share)
Figure 7.2. Global PET Packaging Market Revenue by End User Industries, 2016, (% Share)
Figure 8.1. Global PET Packaging Market Volume, By Geography, 2016 (% share)
Figure 8.10 North America PET Packaging Market Revenue, by Application, 2016, (% Share)
Figure 8.11. North America PET Packaging Market Volume by End User, 2016, (% Share)
Figure 8.12. North America PET Packaging Market Revenue by End User, 2016, (% Share)
Figure 8.13. North America PET Packaging Market Volume by Country, 2016, (% Share)
Figure 8.14. North America PET Packaging Market Revenue by Country, 2016, (% Share)
Figure 8.15. U.S. PET Packaging Market, Forecast (Kt, $mn) 2018-28
Figure 8.16. Canada PET Packaging Market, Forecast (Kt, $mn) 2018-28
Figure 8.17. Mexico PET Packaging Market, Forecast (Kt, $mn) 2018-28
Figure 8.18. Europe PET Packaging Market Volume by Pack Type, 2016, (% Share)
Figure 8.19. Europe PET Packaging Market Revenue by Pack Type, 2016, (% Share)
Figure 8.2. Global PET Packaging Market Revenue, By Geography, 2016 (% share)
Figure 8.20. Europe PET Packaging Market Volume by Packaging Type, 2016, (% Share)
Figure 8.21. Europe PET Packaging Market Revenue by Packaging Type, 2016, (% Share)
Figure 8.22. Europe PET Packaging Market Volume by Filling Technology, 2016, (% Share)
Figure 8.23. Europe PET Packaging Market Revenue by Filling Technology, 2016, (% Share)
Figure 8.24. Europe PET Packaging Market Volume by Application, 2016, (% Share)
Figure 8.25. Europe PET Packaging Market Revenue, by Application, 2016, (% Share)
Figure 8.26. Europe PET Packaging Market Volume by End User, 2016, (% Share)
Figure 8.27. Europe PET Packaging Market Revenue by End User, 2016, (% Share)
Figure 8.28. Europe PET Packaging Market Volume by Country, 2016, (% Share)
Figure 8.29. Europe PET Packaging Market Revenue by Country, 2016, (% Share)
Figure 8.3. North America PET Packaging Market Volume by Pack Type, 2016, (% Share)
Figure 8.30. UK PET Packaging Market, Forecast (Kt, $mn) 2018-28
Figure 8.31. Germany PET Packaging Market, Forecast (Kt, $mn) 2018-28
Figure 8.32. France PET Packaging Market, Forecast (Kt, $mn) 2018-28
Figure 8.33. Spain PET Packaging Market, Forecast (Kt, $mn) 2018-28
Figure 8.34. Italy PET Packaging Market, Forecast (Kt, $mn) 2018-28
Figure 8.35. Russia PET Packaging Market, Forecast (Kt, $mn) 2018-28
Figure 8.36. Rest of Europe PET Packaging Market, Forecast (Kt, $mn) 2018-28
Figure 8.37. Asia-Pacific PET Packaging Market Volume by Pack Type, 2016, (% Share)
Figure 8.38. Asia-Pacific PET Packaging Market Revenue by Pack Type, 2016, (% Share)
Figure 8.39. Asia-Pacific PET Packaging Market Volume by Packaging Type, 2016, (% Share)
Figure 8.4. North America PET Packaging Market Revenue by Pack Type, 2016, (% Share)
Figure 8.40. Asia-Pacific PET Packaging Market Revenue by Packaging Type, 2016, (% Share)
Figure 8.41. Asia-Pacific PET Packaging Market Volume by Filling Technology, 2016, (% Share)
Figure 8.42. Asia-Pacific PET Packaging Market Revenue by Filling Technology, 2016, (% Share)
Figure 8.43. Asia-Pacific PET Packaging Market Volume by Application, 2016, (% Share)
Figure 8.44. Asia-Pacific PET Packaging Market Revenue, by Application, 2016, (% Share)
Figure 8.45. Asia-Pacific PET Packaging Market Volume by End User, 2016, (% Share)
Figure 8.46. Asia-Pacific PET Packaging Market Revenue by End User, 2016, (% Share)
Figure 8.47. Asia-Pacific PET Packaging Market Volume by Country, 2016, (% Share)
Figure 8.48. Asia-Pacific PET Packaging Market Revenue by Country, 2016, (% Share)
Figure 8.49. China PET Packaging Market, Forecast (Kt, $mn) 2018-28
Figure 8.5. North America PET Packaging Market Volume by Packaging Type, 2016, (% Share)
Figure 8.50. Japan PET Packaging Market, Forecast (Kt, $mn) 2018-28
Figure 8.51. India PET Packaging Market, Forecast (Kt, $mn) 2018-28
Figure 8.52. Rest of Asia-Pacific PET Packaging Market, Forecast (Kt, $mn) 2018-28
Figure 8.53. LAMEA PET Packaging Market Volume by Pack Type, 2016, (% Share)
Figure 8.54. LAMEA PET Packaging Market Revenue by Pack Type, 2016, (% Share)
Figure 8.55. Europe PET Packaging Market Volume by Packaging Type, 2016, (% Share)
Figure 8.56. LAMEA PET Packaging Market Revenue by Packaging Type, 2016, (% Share)
Figure 8.57. LAMEA PET Packaging Market Volume by Filling Technology, 2016, (% Share)
Figure 8.58. LAMEA PET Packaging Market Revenue by Filling Technology, 2016, (% Share)
Figure 8.59. LAMEA PET Packaging Market Volume by Application, 2016, (% Share)
Figure 8.6. North America PET Packaging Market Revenue by Packaging Type, 2016, (% Share)
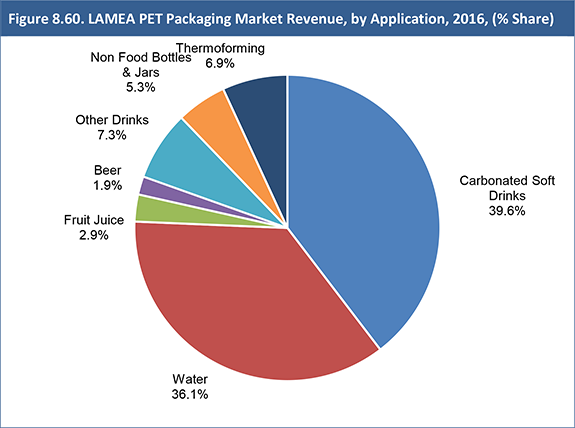
Figure 8.60. LAMEA PET Packaging Market Revenue, by Application, 2016, (% Share)
Figure 8.61. LAMEA PET Packaging Market Volume by End User, 2016, (% Share)
Figure 8.62. LAMEA PET Packaging Market Revenue by End User, 2016, (% Share)
Figure 8.63. LAMEA PET Packaging Market Volume by Country, 2016, (% Share)
Figure 8.64. LAMEA PET Packaging Market Revenue by Country, 2016, (% Share)
Figure 8.65. South Africa PET Packaging Market, Forecast (Kt, $mn) 2018-28
Figure 8.66. Brazil PET Packaging Market, Forecast (Kt, $mn) 2018-28
Figure 8.67. Turkey PET Packaging Market, Forecast (Kt, $mn) 2018-28
Figure 8.68. Rest of LAMEA PET Packaging Market, Forecast (Kt, $mn) 2018-28
Figure 8.7. North America PET Packaging Market Volume by Filling Technology, 2016, (% Share)
Figure 8.8. North America PET Packaging Market Revenue by Filling Technology, 2016, (% Share)
Figure 8.9. North America PET Packaging Market Volume by Application, 2016, (% Share)
Figure 9.1 Market Dynamics: PET Packaging Market 2016-2027
Figure 9.2 Porter’s Five Forces Analysis for PET Packaging Market, 2017-2028
Figure 10.1. Amcor Limited Revenue 2016-2017 ($mn)
Figure 10.2. Amcor Limited Segment Performance 2016 (% Share of Revenue)
Figure 10.3. Amcor Limited Geographic Analysis 2016 (% Share of Revenue)
Figure 10.4. Gerresheimer AG Revenue 2015-2016 ($mn)
Figure 10.5. Gerresheimer AG Segment Performance 2016 (% Share of Revenue)
Figure 10.6. Gerresheimer AG Geographic Analysis 2016 (% Share of Revenue)
Figure 10.7. RPC GROUP PLC Corporation Revenue 2015-2016 ($mn)
Figure 10.8. RPC GROUP PLC Segment Performance 2016 (% Share of Revenue)
Figure 10.9. RPC GROUP PLC Geographic Analysis 2016 (% Share of Revenue)
Figure 10.10. Silgan Holdings Revenue 2015-2016 ($mn)
Figure 10.11. Silgan Holdings Segment Performance 2016 (% Share of Revenue)
Figure 10.12. Silgan Holdings Geographic Analysis 2016 (% Share of Revenue)
Figure 10.13. Tetra Laval International S.A. Revenue 2015-2016 ($mn)
Figure 10.14. Tetra Laval International S.A. Segment Performance 2016 (% Share of Revenue)
Figure 10.15. Tetra Pak Geographic Analysis 2016 (% Share of Revenue)
Figure 10.16. Sidel Geographic Analysis 2016 (% Share of Revenue)
Figure 10.17. DeLaval Geographic Analysis 2016 (% Share of Revenue)
Figure 10.18. Resilux NV Revenue 2014-2016 ($mn)
Figure 10.19. Resilux NV Geographic Analysis 2016 (% Share of Revenue)
Figure 10.20. Berry Global Inc. Revenue 2015-2016 ($Mn)
Figure 10.21. Berry Global Inc. Segment Performance 2016 (% Share of Revenue)
Figure 10.22. Berry Global Inc. Geographic Analysis 2016 (% Share of Revenue)
Figure 10.23. Huhtamaki Group Revenue 2015-2016 ($Mn)
Figure 10.24. Huhtamaki Group Segment Performance 2016 (% Share of Revenue)
Figure 10.25. Huhtamaki Group Geographic Analysis 2016 (% Share of Revenue)
List of Tables
Table 3.1. PET Packaging Market by Pack Type Market Forecast, 2017-2028 (Kt, AGR %, Cumulative)
Table 3.2. PET Packaging Market by Pack Type Market Forecast, 2017-2028 ($Mn, AGR %, Cumulative)
Table 3.3. PET Bottles & Jars Market by Regional Market Forecast 2017-2028 (Kt, AGR %, Cumulative)
Table 3.4. PET Bottles & Jars Market by Regional Market Forecast 2017-2028 ($Mn, AGR %, Cumulative)
Table 3.5. PET Bags & Pouches Market by Regional Market Forecast 2017-2028 (Kt, AGR %, Cumulative)
Table 3.6. PET Bags & Pouches Market by Regional Market Forecast 2017-2028 ($Mn, AGR %, Cumulative)
Table 3.7. PET Trays Market by Regional Market Forecast 2017-2028 (Kt, AGR %, Cumulative)
Table 3.8. PET Trays Market by Regional Market Forecast 2017-2028 ($Mn, AGR %, Cumulative)
Table 3.9. PET Lids, Caps & Closure Market by Regional Market Forecast 2017-2028 (Kt, AGR %, Cumulative)
Table 3.10. PET Lids, Caps & Closure Market by Regional Market Forecast 2017-2028 ($mn, AGR %, Cumulative)
Table 3.11. Other PET Pack Type Market by Regional Market Forecast 2017-2028 (Kt, AGR %, Cumulative)
Table 3.12. Other PET Pack Type Market by Regional Market Forecast 2017-2028 ($mn, AGR %, Cumulative)
Table 4.1. PET Packaging Market by Packaging Type Market Forecast, 2017-2028 (Kt, AGR %, Cumulative)
Table 4.2. PET Packaging Market by Packaging Type Market Forecast, 2017-2028 ($Mn, AGR %, Cumulative)
Table 4.3. Rigid PET Packaging Market by Regional Market Forecast 2017-2028 (Kt, AGR %, Cumulative)
Table 4.4. Rigid PET Packaging Market by Regional Market Forecast 2017-2028 ($mn, AGR %, Cumulative)
Table 4.5. Flexible PET Packaging Market by Regional Market Forecast 2017-2028 (Kt, AGR %, Cumulative)
Table 4.6. Flexible PET Packaging Market by Regional Market Forecast 2017-2028 ($mn, AGR %, Cumulative)
Table 5.1. PET Packaging Market by Filling Technology Market Forecast, 2017-2028 (Kt, AGR %, Cumulative)
Table 5.2. PET Packaging Market by Filling Technology Market Forecast, 2017-2028 ($Mn, AGR %, Cumulative)
Table 5.3. Hot Fill PET Packaging Market by Regional Market Forecast 2017-2028 (Kt, AGR %, Cumulative)
Table 5.4. Hot Fill PET Packaging Market by Regional Market Forecast 2017-2028 ($mn, AGR %, Cumulative)
Table 5.5. Cold Fill PET Packaging Market by Regional Market Forecast 2017-2028 (Kt, AGR %, Cumulative)
Table 5.6. Cold Fill PET Packaging Market by Regional Market Forecast 2017-2028 ($mn, AGR %, Cumulative)
Table 5.7. Aseptic Fill PET Packaging Market by Regional Market Forecast 2017-2028 (Kt, AGR %, Cumulative)
Table 5.8. Aseptic Fill PET Packaging Market by Regional Market Forecast 2017-2028 ($mn, AGR %, Cumulative)
Table 6.1. PET Packaging Market by Application 2017-2028 (Kt, AGR %, Cumulative)
Table 6.2. PET Packaging Market by Application 2017-2028 ($mn, AGR %, Cumulative)
Table 6.3. PET Carbonated Soft Drinks Packaging Market by Regional Market Forecast 2017-2028 (Kt, AGR %, Cumulative)
Table 6.4. PET Carbonated Soft Drinks Packaging Market by Regional Market Forecast 2017-2028 ($mn, AGR %, Cumulative)
Table 6.5. PET Water Packaging Market by Regional Market Forecast 2017-2028 (Kt, AGR %, Cumulative)
Table 6.6. PET Water Packaging Market by Regional Market Forecast 2017-2028 ($mn, AGR %, Cumulative)
Table 6.7. PET Fruit Juice Packaging Market by Regional Market Forecast 2017-2028 (Kt, AGR %, Cumulative)
Table 6.8. PET Fruit Juice Packaging Market by Regional Market Forecast 2017-2028 ($mn, AGR %, Cumulative)
Table 6.9. PET Beer Packaging Market by Regional Market Forecast 2017-2028 (Kt, AGR %, Cumulative)
Table 6.10. PET Beer Packaging Market by Regional Market Forecast 2017-2028 ($mn, AGR %, Cumulative)
Table 6.11. PET Other Drinks Packaging Market by Regional Market Forecast 2017-2028 (Kt, AGR %, Cumulative)
Table 6.12. PET Other Drinks Packaging Market by Regional Market Forecast 2017-2028 ($mn, AGR %, Cumulative)
Table 6.13 PET Food Bottles & Jars Packaging Market by Regional Market Forecast 2017-2028 (Kt, AGR %, Cumulative)
Table 6.14. PET Food Bottles & Jars Packaging Market by Regional Market Forecast 2017-2028 ($mn, AGR %, Cumulative)
Table 6.15. PET Non Food Bottles & Jars Packaging Market by Regional Market Forecast 2017-2028 (Kt, AGR %, Cumulative)
Table 6.16. PET Non Food Bottles & Jars Packaging Market by Regional Market Forecast 2017-2028 ($mn, AGR %, Cumulative)
Table 6.17. PET Thermoform Packaging Market by Regional Market Forecast 2017-2028 (Kt, AGR %, Cumulative)
Table 6.18. PET Thermoform Packaging Market by Regional Market Forecast 2017-2028 ($mn, AGR %, Cumulative)
Table 7.1. PET Packaging Market by End User 2017-2028 (Kt, AGR %, Cumulative)
Table 7.2. PET Packaging Market by End User 2017-2028 ($mn, AGR %, Cumulative)
Table 7.3. PET Food Packaging Market by Regional Market Forecast 2017-2028 (Kt, AGR %, Cumulative)
Table 7.4. PET Food Packaging Market by Regional Market Forecast 2017-2028 ($mn, AGR %, Cumulative)
Table 7.5. PET Beverage Packaging Market by Regional Market Forecast 2017-2028 (Kt, AGR %, Cumulative)
Table 7.6. PET Beverage Packaging Market by Regional Market Forecast 2017-2028 ($mn, AGR %, Cumulative)
Table 7.7. PET Personal Care & Cosmetic Packaging Market by Regional Market Forecast 2017-2028 (Kt, AGR %, Cumulative)
Table 7.8. PET Personal Care & Cosmetic Packaging Market by Regional Market Forecast 2017-2028 ($mn, AGR %, Cumulative)
Table 7.9. PET Household Products Market by Regional Market Forecast 2017-2028 (Kt, AGR %, Cumulative)
Table 7.10. PET Household Products Market by Regional Market Forecast 2017-2028 ($mn, AGR %, Cumulative)
Table 7.11. PET Pharmaceuticals Packaging Market by Regional Market Forecast 2017-2028 (Kt, AGR %, Cumulative)
Table 7.12. PET Pharmaceuticals Packaging Market by Regional Market Forecast 2017-2028 ($mn, AGR %, Cumulative)
Table 7.13. PET Packaging in Others Market by Regional Market Forecast 2017-2028 (Kt, AGR %, Cumulative)
Table 7.14. PET Packaging in Others Market by Regional Market Forecast 2017-2028 ($mn, AGR %, Cumulative)
Table 8.1 PET Packaging Market Forecast by Region & Country, 2017-2028 (Kt, AGR %, Cumulative)
Table 8.2. PET Packaging Market Forecast by Region & Country, 2017-2028 ($mn, AGR %, Cumulative)
Table 8.3. North America PET Packaging Market by Pack Type Market Forecast, 2017-2028 (Kt, AGR %, Cumulative)
Table 8.4. North America PET Packaging Market by Pack Type Market Forecast, 2017-2028 ($Mn, AGR %, Cumulative)
Table 8.5. North America PET Packaging Market by Packaging Type Market Forecast, 2017-2028 (Kt, AGR %, Cumulative)
Table 8.6. North America PET Packaging Market by Packaging Type Market Forecast, 2017-2028 ($Mn, AGR %, Cumulative)
Table 8.7. North America PET Packaging Market by Filling Technology Market Forecast, 2017-2028 (Kt, AGR %, Cumulative)
Table 8.8. North America PET Packaging Market by Filling Technology Market Forecast, 2017-2028 ($Mn, AGR %, Cumulative)
Table 8.9. North America PET Packaging Market by Application 2017-2028 (Kt, AGR %, Cumulative)
Table 8.10. North America PET Packaging Market by Application 2017-2028 ($mn, AGR %, Cumulative)
Table 8.11. North America PET Packaging Market by End User 2017-2028 (Kt, AGR %, Cumulative)
Table 8.12. North America PET Packaging Market by End User 2017-2028 ($mn, AGR %, Cumulative)
Table 8.13. North America PET Packaging Market by Country 2017-2028 (Kt, AGR %, Cumulative)
Table 8.14. North America PET Packaging Market by Country 2017-2028 ($mn, AGR %, Cumulative)
Table 8.15. Europe PET Packaging Market by Pack Type Market Forecast, 2017-2028 (Kt, AGR %, Cumulative)
Table 8.16. Europe PET Packaging Market by Pack Type Market Forecast, 2017-2028 ($Mn, AGR %, Cumulative)
Table 8.17. Europe PET Packaging Market by Packaging Type Market Forecast, 2017-2028 (Kt, AGR %, Cumulative)
Table 8.18. Europe PET Packaging Market by Packaging Type Market Forecast, 2017-2028 ($Mn, AGR %, Cumulative)
Table 8.19. Europe PET Packaging Market by Filling Technology Market Forecast, 2017-2028 (Kt, AGR %, Cumulative)
Table 8.20. Europe PET Packaging Market by Filling Technology Market Forecast, 2017-2028 ($Mn, AGR %, Cumulative)
Table 8.21. Europe PET Packaging Market by Application 2017-2028 (Kt, AGR %, Cumulative)
Table 8.22. Europe PET Packaging Market by Application 2017-2028 ($mn, AGR %, Cumulative)
Table 8.23. Europe PET Packaging Market by End User 2017-2028 (Kt, AGR %, Cumulative)
Table 8.24. Europe PET Packaging Market by End User 2017-2028 ($mn, AGR %, Cumulative)
Table 8.25. Europe PET Packaging Market by Country 2017-2028 (Kt, AGR %, Cumulative)
Table 8.26. Europe PET Packaging Market by Country 2017-2028 ($mn, AGR %, Cumulative)
Table 8.27. Asia-Pacific PET Packaging Market by Pack Type Market Forecast, 2017-2028 (Kt, AGR %, Cumulative)
Table 8.28. Asia-Pacific PET Packaging Market by Pack Type Market Forecast, 2017-2028 ($Mn, AGR %, Cumulative)
Table 8.29. Asia-Pacific PET Packaging Market by Packaging Type Market Forecast, 2017-2028 (Kt, AGR %, Cumulative)
Table 8.30. Asia-Pacific PET Packaging Market by Packaging Type Market Forecast, 2017-2028 ($Mn, AGR %, Cumulative)
Table 8.31. Asia-Pacific PET Packaging Market by Filling Technology Market Forecast, 2017-2028 (Kt, AGR %, Cumulative)
Table 8.32. Europe PET Packaging Market by Filling Technology Market Forecast, 2017-2028 ($Mn, AGR %, Cumulative)
Table 8.33. Asia-Pacific PET Packaging Market by Application 2017-2028 (Kt, AGR %, Cumulative)
Table 8.34. Asia-Pacific PET Packaging Market by Application 2017-2028 ($mn, AGR %, Cumulative)
Table 8.35. Asia-Pacific PET Packaging Market by End User 2017-2028 (Kt, AGR %, Cumulative)
Table 8.36. Asia-Pacific PET Packaging Market by End User 2017-2028 ($mn, AGR %, Cumulative)
Table 8.37. Asia-Pacific PET Packaging Market by Country 2017-2028 ($m, AGR %, Cumulative)
Table 8.37. Asia-Pacific PET Packaging Market by Country 2017-2028 (Kt, AGR %, Cumulative)
Table 8.39. LAMEA PET Packaging Market by Pack Type Market Forecast, 2017-2028 (Kt, AGR %, Cumulative)
Table 8.40. LAMEA PET Packaging Market by Pack Type Market Forecast, 2017-2028 ($Mn, AGR %, Cumulative)
Table 8.41. LAMEA PET Packaging Market by Packaging Type Market Forecast, 2017-2028 (Kt, AGR %, Cumulative)
Table 8.42. LAMEA PET Packaging Market by Packaging Type Market Forecast, 2017-2028 ($Mn, AGR %, Cumulative)
Table 8.43. LAMEA PET Packaging Market by Filling Technology Market Forecast, 2017-2028 (Kt, AGR %, Cumulative)
Table 8.44. LAMEA PET Packaging Market by Filling Technology Market Forecast, 2017-2028 ($mn, AGR %, Cumulative)
Table 8.45. LAMEA PET Packaging Market by Application 2017-2028 (Kt, AGR %, Cumulative)
Table 8.46. LAMEA PET Packaging Market by Application 2017-2028 ($mn, AGR %, Cumulative)
Table 8.47. LAMEA PET Packaging Market by End User 2017-2028 (Kt, AGR %, Cumulative)
Table 8.48. LAMEA PET Packaging Market by End User 2017-2028 ($mn, AGR %, Cumulative)
Table 8.49. LAMEA PET Packaging Market by Country 2017-2028 (Kt, AGR %, Cumulative)
Table 8.50. LAMEA PET Packaging Market by Country 2017-2028 ($mn, AGR %, Cumulative)
Table 10.1. Amcor Limited Product Portfolio
Table 10.2. Gerresheimer AG Product Portfolio
Table 10.3. RPC GROUP PLC Product Portfolio
Table 10.4. Silgan Holdings Product Portfolio
Table 10.5. Tetra Laval International S.A. Product Portfolio
Table 10.6. Graham Packaging Company Product Portfolio
Table 10.7. Plastipak Holdings, Inc. Product Portfolio
Table 10.8. CKS Packaging, Inc. Product Portfolio
Table 10.9. Berry Global Inc. Product Portfolio
Table 10.10. Huhtamaki Group Product Portfolio
Table 10.10. Huhtamaki Group Product Portfolio
Table 10.11. ALPLA Product Portfolio
ACE Corporation
AEP Industries Inc.
Alfa Level
Alpha Group
ALPLA
Amcor Limited
Artenius PET Packaging France S.A.S.
Astrapack
AVI Global Plast
Berlin Packaging L.L.C.
Berry Global Inc.
British Polythene Industries PLC (BPI)
Chemco
CKS Packaging, Inc.
Consolidated Container Co LLC
Continental Plastics
Coveris Group
Crown Holdings
DowDuPont Inc.
Dunmore
Duropack Industries
ELIPSO
ESE World
Exopackaging
Gerresheimer AG
Global Closure Systems
GRAFCO PET Packaging
Graham Packaging Company
Greiner Packaging
GTX Hanex Plastic Sp. Z O.O.
Himalayan Group
Himalayan Group of Industries
Huhtamaki
Imperial Plastics
INOAC
INPACK
Kaufman Container
Kian Joo Group
Klöckner Pentaplast GmbH & Co. Kg
Letica
Logoplaste
M&H Plastics
Maynard & Harris Plastics
Pact Group
Pactiv Corporation
Parker Plastics
Parket Plastics
Parkway Plastics
PET Packaging Network
PET Power
PET-Egypt
Plastipak Holdings, Inc.
Promens Group AS
Reedpack Containers
RESILUX
Resilux NV
Retal Industries
Rexam PLC
RPC Containers
RPC GROUP PLC
Sidel International
Silgan Holdings
SKS Bottle & Packaging
Smurfit Kappa Group PLC
Snapware
Sonoco Plastics
Southeastern Container
Southeastern Container Inc.
Sunrise Containers
Superfos
Tekni-Plex
Temkin Plastics
Tetra Laval International S.A.
Tetra Pak
The AMD Group
Toyo Seikan Kaisha, Ltd
Toyo Seikan Kaisha, Ltd
Uflex Ltd.
Ultrapak
Government Agencies and Other Organisations Mentioned
Consumer Specialty Products Association
European Union
United States Food & Drug Administration
Download sample pages
Complete the form below to download your free sample pages for PET Packaging Market Forecast 2018-2028
Related reports
-
Sterile Medical Packaging Market Report 2018-2028
The global Sterile Medical packaging market is expected to reach $31.2bn in 2018 and develop dynamically over the forecast period,...Full DetailsPublished: 19 September 2018 -
Rigid Plastic Packaging Market Report 2018-2028
The latest report from business intelligence provider Visiongain offers comprehensive analysis of the global Rigid Plastic Packaging market. Visiongain assesses...
Full DetailsPublished: 21 February 2018 -
Rigid Plastic Packaging Market Report 2020-2030
Global rigid plastic packaging market is anticipated to surpass USD 300 billion by 2030 while growing at a CAGR of...
Full DetailsPublished: 10 February 2020 -
Healthcare Packaging Market Report 2018-2028
The latest report from business intelligence provider Visiongain offers comprehensive analysis of the global healthcare packaging market. Visiongain assesses that...
Full DetailsPublished: 03 April 2018 -
Recycled Packaging Materials Market Report 2018-2028
Developments in recycled packaging materials have had a significant impact on the recycled packaging materials market. Visiongain’s report on this...
Full DetailsPublished: 24 January 2018 -
Global 20 Leading Glass Packaging Companies 2018-2028
Visiongain consulted widely with industry experts and full transcripts from these exclusive interviews are included in the report. As such,...
Full DetailsPublished: 12 June 2018 -
Post-Consumer Recycled Plastic Market Report 2019-2029
With global, national/regional, and submarket estimates for the Post-Consumer Recycled Plastics Market, this report covers key aspects of this market....
Full DetailsPublished: 22 March 2019 -

Paper Packaging Market Report 2018-2028
Visiongain’s comprehensive new 209-page report reveals that the global paper packaging market will reach a value of $303.8 billion in...Full DetailsPublished: 30 July 2018 -
Top 20 Cosmetics Packaging Companies 2019
The top 20 cosmetics packaging companies accounted for for $11,091m, or 32.6% of the total cosmetics packaging market (2017). Albea...Full DetailsPublished: 24 April 2019 -
Personal Care Packaging Market Report 2018-2028
The global personal care packaging market is expected to reach $28.1bn in 2018 and develop dynamically over the forecast period,...Full DetailsPublished: 03 August 2018
Download sample pages
Complete the form below to download your free sample pages for PET Packaging Market Forecast 2018-2028
Do you have any custom requirements we can help you with?
Any specific country, geo region, market segment or specific company information?
Email us today, we can discuss your needs and see how we can help: jamie.roberts@visiongain.com
Would you like a free report overview of the report of your choice?
If so, please drop an email to Jamie Roberts stating your chosen report title to jamie.robertsvisiongain.com
Visiongain packaging related reports are compiled using a broad and rich mixture of both primary and secondary information to produce an overall industry outlook. In order to provide our clients with the best product possible product, visiongain analysts reach out to market-leading vendors and industry experts but also review a wealth of financial data and product information from a vast range of sources. To find out more about our reports methodology, please email jamie.roberts@visiongain.com
Would you like to get the latest Visiongain packaging reports catalogue?
What are the dynamic growth sectors? where are the regional business opportunities?
Which technologies will prevail and who are the leading companies succeeding in these sectors and why?
If you want definitive answers to business critical questions, discover Visiongain’s full range of business intelligence reports.
If so, please email Jamie Roberts on jamie.roberts@visiongain.com or call her today on +44 207 336 6100
Adhesive & Sealant Council
Alliance of Foam Packaging Recyclers
American Bakers Association
American Chemistry Council
American Forest & Paper Association
American Frozen Food Institute
American Institute of Food Distributors
American Iron and Steel Institute
American Management Association
American National Standards Institute
American Plastics Council (APC)
American Society for Testing and Materials
Association for Suppliers of Printing, Publishing
AICC, The Independent Packaging Association
Association of Industrial Metallizers, Coaters and Laminators (AIMCAL)
Automated Identification Manufacturer
Automated Imaging Association
Can Manufacturers Institute
Chocolate Manufacturers Association of the U.S.A.
Consumer Healthcare Products Association
Contract Manufacturing and Packaging Association
Converting Equipment Manufacturers Association
Corrugated Packaging Council
Drug, Chemical & Allied Trade Association
Envelope Manufacturers Association
Fibre Box Association
Flexible Packaging Association
Flexographic Technical AssociationFlexographic Technical Association
Foil Stamping and Embossing Association
Food and Drug Law Institute
Food Institute
Food Marketing Institute
Food Processing Machinery & Supplies Association
Foodservice & Packaging Institute
Glass Packaging Institute
Graphic Arts Technical Foundation
Gravure Association of America
Grocery Manufacturers of America
Healthcare Compliance Packaging Council
High Definition Flexo Consortium
Institute of Food Technologists
Institute of Packaging Professionals
International Association of Food Industry Suppliers
International Bottled Water Association
International Dairy Foods Association
International Foodservice Manufacturers Association
International Safe Transit Association
Label Printing Industries of America
Material Handling Industry of America
National Association of Container Distributors
National Association of Manufacturers
National Chicken Council
National Coil Coating Association
National Confectioners Association of the U.S.A.
National Freight Claim & Security
National Institute of Packaging, Handling & Logistics Engineers
National Paper Trade Association
National Wooden Pallet & Container
Open Modular Architecture Controls (OMAC) Packaging Workgroup
Packaging Association of Canada
Paperboard Packaging Council
Petroleum Packaging Council
Pharmaceutical Research and Manufacturers of America
PMMI: The Association for Packaging and Processing Technologies
Polystyrene Packaging Council
Pressure Sensitive Tape Council
Printing Industries of America
Processing and Packaging Machinery Association (PPMA)
Produce Marketing Association, Inc.
Research & Development Associates for Military Food & Packaging Systems
Robotic Industries Association (RIA)
Snack Food Association
Soap & Detergent Association
Society of Glass and Ceramic Decorators
Society of Manufacturing Engineers
Society of Plastics Engineers (SPE)
Society of the Plastics Industry (SPI)
Steel Recycling Institute
Steel Shipping Containers Institute
Tag and Label Manufacturers Institute
Technical Association of the Pulp & Paper Industry
The Aluminum Association
Transportation Consumer Protection Council
Transportation Loss Prevention & Security Association
Tube Council of North America
Uniform Code Council, Inc.
Western Packaging Association (WPA)
World Packaging Organisation
Latest Packaging news
Visiongain Publishes Caps & Closures Market Report 2024-2034
The global caps & closures market was valued at US$80.8 billion in 2023 and is projected to grow at a CAGR of 9% during the forecast period 2024-2034.
22 February 2024
Visiongain Publishes Flexible (Converted) Plastic Packaging Market Report 2024-2034
The global Flexible (Converted) Plastic Packaging market was valued at US$157.3 billion in 2023 and is projected to grow at a CAGR of 5.4% during the forecast period 2024-2034.
04 January 2024
Visiongain Publishes Beverage Packaging Market Report 2023-2033
The global Beverage Packaging market was valued at US$144.3 billion in 2022 and is projected to grow at a CAGR of 4.6% during the forecast period 2023-2033.
28 September 2023
Visiongain Publishes Cosmetics Packaging Market Report 2023-2033
The global Cosmetics Packaging market is projected to grow at a CAGR of 4.3% by 2033
21 July 2023
