Industries > Packaging > Returnable Packaging Market Report 2019-2029
Returnable Packaging Market Report 2019-2029
Forecasts by Product (IBCs, Pallets, Crates, Drums, Dunnage Bags, Others), by Material (Plastics, Metals, Wood, Other), and End-User (Food and Beverage, Automotive, Healthcare, Others) PLUS Profiles of Leading Companies and Regional and Leading National Market Analysis
With an incredible amount of attention devoted to the returnable packaging market, deriving market prospects and opportunities can be difficult. Visiongain has looked beyond the attention-grabbing headlines to create an accurate market research report that will help you arrive at logical, valuable conclusions that are grounded in reality- not media headlines.
With global, national/regional, and submarket estimates for the returnable packaging market, this report covers key aspects of this market. Also, the report profiles the leading companies in the market, and drivers and restraints analysis of the market.
Reasons to buy
• Learn where the returnable packaging market is headed
• See where the business opportunities are
• Compare your evaluations with a second opinion
• Discover who the first movers are within this market space
• See what the barriers to entry are likely to be
Featured content
• Global Returnable Packaging market forecasts and analysis from 2019-2029 illustrate the market progression
• Returnable Packaging Market Forecasts by Product from 2019-2029
– IBCs Returnable Packaging Market Forecast 2019-2029
– Pallets Returnable Packaging Market Forecast 2019-2029
– Crates Returnable Packaging Market Forecast 2019-2029
– Drums Returnable Packaging Market Forecast 2019-2029
– Dunnage Bags Returnable Packaging Market Forecast 2019-2029
– Other Materials Returnable Packaging Market Forecast 2019-2029
• Regional and National Returnable Packaging Market Forecasts from 2019-2029
• North America Returnable Packaging Market Forecast 2019-2029
– US Returnable Packaging Market Forecast 2019-2029
– Canada Returnable Packaging Market Forecast 2019-2029
• Europe Returnable Packaging Market Forecast 2019-2029
– Germany Returnable Packaging Market Forecast 2019-2029
– France Returnable Packaging Market Forecast 2019-2029
– UK Returnable Packaging Market Forecast 2019-2029
– Spain Returnable Packaging Market Forecast 2019-2029
– Italy Returnable Packaging Market Forecast 2019-2029
– Rest of Europe Returnable Packaging Market Forecast 2019-2029
• Asia Pacific Returnable Packaging Market Forecast 2019-2029
– Japan Returnable Packaging Market Forecast 2019-2029
– China Returnable Packaging Market Forecast 2019-2029
– India Returnable Packaging Market Forecast 2019-2029
– Rest of Asia Pacific Returnable Packaging Market Forecast 2019-2029
• MEA Returnable Packaging Market Forecast 2019-2029
– GCC Countries Returnable Packaging Market Forecast 2019-2029
– South Africa Returnable Packaging Market Forecast 2019-2029
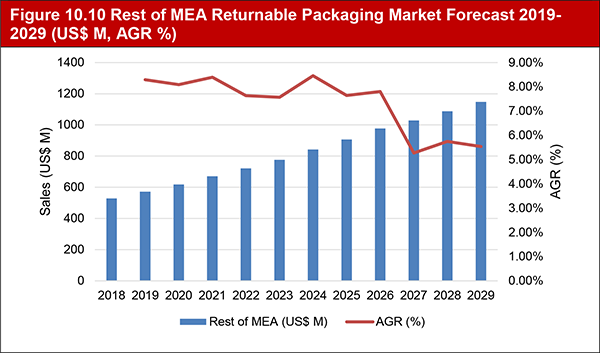
– Rest of MEA Returnable Packaging Market Forecast 2019-2029
• Latin America Returnable Packaging Market Forecast 2019-2029
– Brazil Countries Returnable Packaging Market Forecast 2019-2029
– Mexico Africa Returnable Packaging Market Forecast 2019-2029
– Rest of Latin America Returnable Packaging Market Forecast 2019-2029
• Returnable Packaging Market Forecasts by Material from 2019-2029
– Returnable Packaging Market Forecast for Plastic 2019-2029
– Returnable Packaging Market Forecast for Metal 2019-2029
– Returnable Packaging Market Forecast for Wood 2019-2029
– Returnable Packaging Market Forecast for Others 2019-2029
• Returnable Packaging Market Forecasts by End-User 2019-2029
– Food and Beverage Market Forecast 2019-2029
– Automotive Market Forecast 2019-2029
– Healthcare Market Forecast 2019-2029
– Others Market Forecast 2019-2029
• Profiles of the leading 10 Returnable Packaging Companies
– Amatech Inc.
– Brambles
– DS Smith
– GWP Group
– Menasha Corporation
– Nefab Group
– Rehrig Pacific Company, Inc.
– RPP Containers
– Schoeller Allibert
– Schütz GmbH & Co. KGaA
The returnable packaging market is forecasted for moderate growth. With a Visiongain report, you can learn just how the development of this market could affect you. With 178 charts, tables and graphs, this 136-page report will be of interest to you.
Visiongain is a trading partner with the US Federal Government
CCR Ref number: KD4R6
Do you have any custom requirements we can help you with? Any need for specific country, geo region, market segment or specific company information? Contact us today, we can discuss your needs and see how we can help: sara.peerun@visiongain.com
1.1 Global Returnable Packaging Market Overview
1.2 Why You Should Read This Report
1.3 How This Report Delivers
1.4 Key Questions Answered by This Analytical Report Include:
1.5 Who is This Report For?
1.6 Methodology
1.6.1 Primary Research
1.6.2 Secondary Research
1.6.3 Market Evaluation & Forecasting Methodology
1.7 Frequently Asked Questions (FAQ)
1.8 Associated Visiongain Reports
1.9 About Visiongain
2. Introduction to the Returnable Packaging Market
2.1 Returnable Packaging Market Structure
2.2 Returnable Packaging Market Definition
2.3 Returnable Packaging Submarkets Definition
2.3.1 Returnable Packaging IBCs Submarket Definition
2.3.2 Returnable Packaging Pallets Submarket Definition
2.3.3 Returnable Packaging Crates Submarket Definition
2.3.4 Returnable Packaging Drums Submarket Definition
2.3.5 Returnable Packaging Dunnage Bags Submarket Definition
2.4 Returnable Packaging Material Submarkets Definition
2.4.1 Returnable Packaging Plastic Material Submarket Definition
2.4.2 Returnable Packaging Metal Material Submarket Definition
2.4.3 Returnable Packaging Wood Material Submarket Definition
2.4.4 Returnable Packaging Others Material Submarket Definition
2.5 Returnable Packaging End-User Submarkets Definition
2.5.1 Returnable Packaging Food and Beverage Submarket Definition
2.5.2 Returnable Packaging Automotive Submarket Definition
2.5.3 Returnable Packaging Healthcare Submarket Definition
2.5.4 Returnable Packaging Others Submarket Definition
3. Returnable Packaging Market Overview
3.1 What is Returnable Packaging?
3.2 Significance of Returnable Packaging in Worldwide Packaging Market and Key Trends
3.3 Returnable Packaging Market Supply Chain
4. The Global Returnable Packaging Market Forecast 2019-2029
4.1 Global Returnable Packaging Market by National Market Share Forecast 2019-2029
4.2 Global Returnable Packaging Market Forecast 2019-2029
4.3 Global Returnable Packaging Submarket Forecast by Regional Markets 2019-2029
4.4 Global Returnable Packaging Market Forecast by Product Type 2019-2029
4.5 Global Returnable Packaging Material Submarket 2019-2029
4.6 Global Returnable Packaging End-User Submarket 2019-2029
4.7 Global Returnable Packaging Market Drivers & Restraints
5. Returnable Packaging Submarket Forecast 2019-2029
5.1 Returnable Packaging Submarket Forecast by Packaging 2019-2029
5.1.1 Intermediate Bulk Containers (IBCs) Submarket Forecast 2019-2029
5.1.2 Pallets Submarket Forecast 2019-2029
5.1.3 Crates Submarket Forecast 2019-2029
5.1.4 Drums Submarket Forecast 2019-2029
5.1.5 Dunnage Bags Submarket Forecast 2019-2029
5.1.6 Others Submarket Forecast 2019-2029
5.2 Returnable Packaging Submarket Forecast by Material 2019-2029
5.2.1 Plastics Submarket Forecast 2019-2029
5.2.2 Metal Submarket Forecast 2019-2029
5.2.3 Wood Submarket Forecast 2019-2029
5.2.4 Others Submarket Forecast 2019-2029
5.3 Returnable Packaging Submarket Forecast by End User 2019-2029
5.3.1 Food and Beverage Submarket Forecast 2019-2029
5.3.2 Automotive Submarket Forecast 2019-2029
5.3.3 Healthcare Submarket Forecast 2019-2029
5.3.4 Others Submarket Forecast 2019-2029
6. North America Returnable Packaging Market Forecasts 2019-2029
6.1 North America Returnable Packaging Submarket Forecast 2019-2029
6.2 North America Returnable Packaging Market by Material Forecast 2019-2029
6.3 North America Returnable Packaging Market by End-User Forecast 2019-2029
6.4 North America Returnable Packaging Market by Country Forecast 2019-2029
6.4.1 U.S. Returnable Packaging Market Forecast 2019-2029
6.4.2 Canada Returnable Packaging Market Forecast 2019-2029
7. Latin America Returnable Packaging Market Forecasts 2019-2029
7.1 Latin America Returnable Packaging Submarket Forecast 2019-2029
7.2 Latin America Returnable Packaging Market by Material Forecast 2019-2029
7.3 Latin America Returnable Packaging Market by End-User Forecast 2019-2029
7.4 Latin America Returnable Packaging Market by Country Forecast 2019-2029
7.4.1 Brazil Returnable Packaging Market Forecast 2019-2029
7.4.2 Mexico Returnable Packaging Market Forecast 2019-2029
7.4.3 Rest of Latin America Returnable Packaging Market Forecast 2019-2029
8. Europe Returnable Packaging Market Forecasts 2019-2029
8.1 Europe Returnable Packaging Submarket Forecast 2019-2029
8.2 Europe Returnable Packaging Market by Material Forecast 2019-2029
8.3 Europe Returnable Packaging Market by End-User Forecast 2019-2029
8.4 Europe Returnable Packaging Market Forecast by Country 2019-2029
8.4.1 Germany Returnable Packaging Market Forecast 2019-2029
8.4.2 France Returnable Packaging Market Forecast 2019-2029
8.4.3 U.K. Returnable Packaging Market Forecast 2019-2029
8.4.4 Italy Returnable Packaging Market Forecast 2019-2029
8.4.5 Spain Returnable Packaging Market Forecast 2019-2029
8.4.6 Rest of Europe Returnable Packaging Market Forecast 2019-2029
9. Asia-Pacific Returnable Packaging Market Forecasts 2019-2029
9.1 Asia-Pacific Returnable Packaging Submarket Forecast 2019-2029
9.2 Asia-Pacific Returnable Packaging Market by Material Forecast 2019-2029
9.3 Asia-Pacific Returnable Packaging Market by End-User Forecast 2019-2029
9.4 Asia-Pacific Returnable Packaging Market Forecast by Country 2019-2029
9.4.1 China Returnable Packaging Market Forecast 2019-2029
9.4.2 Japan Returnable Packaging Market Forecast 2019-2029
9.4.3 India Returnable Packaging Market Forecast 2019-2029
9.4.4 Rest of Asia-Pacific Returnable Packaging Market Forecast 2019-2029
10. Middle- East and Africa (MEA) Returnable Packaging Market Forecasts 2019-2029
10.1 MEA Returnable Packaging Submarket Forecast 2019-2029
10.2 MEA Returnable Packaging Market by Material Forecast 2019-2029
10.3 MEA Returnable Packaging Market by End-User Forecast 2019-2029
10.4 MEA Returnable Packaging Market Forecast by Country 2019-2029
10.4.1 South Africa Returnable Packaging Market Forecast 2019-2029
10.4.2 GCC Countries Returnable Packaging Market Forecast 2019-2029
10.4.3 Rest of MEA Returnable Packaging Market forecast 2019-2029
11. Competitive Landscape of the Returnable Packaging Market
11.1 SWOT Analysis
11.2 Key Recent Developments Mapping
12. Leading Companies in the Returnable Packaging Market
12.1 Amatech Inc.
12.1.1 Introduction
12.1.2 Amatech Inc. Future Outlook
12.1.3 Competitors of Amatech Inc.
12.1.4 Regional Emphasis / Focus of Amatech Inc.
12.2 Brambles
12.2.1 Introduction
12.2.2 Brambles Corporation Total Company Sales 2013-2017
12.2.3 Brambles Sales by Geographical Segment of Business 2015-2018
12.2.4 Brambles Sales by Operating Segment of Business 2017-2018
12.2.5 Brambles Selected Recent Development 2019
12.2.6 Brambles Future Outlook
12.2.7 Competitors of Brambles
12.2.8 Regional Emphasis / Focus of Brambles
12.3 DS Smith
12.3.1 Introduction
12.3.2 DS Smith Corporation Total Company Sales 2014-2018
12.3.3 DS Smith Sales by Geographical Segment of Business 2017-2018
12.3.4 DS Smith Selected Recent Development 2019
12.3.5 DS Smith Future Outlook
12.3.6 Competitors of DS Smith
12.3.7 Regional Emphasis / Focus of DS Smith
12.4 GWP Group
12.4.1 Introduction
12.4.2 GWP Group Selected Recent Developments
12.4.3 GWP Group Future Outlook
12.4.4 Competitors of GWP Group
12.4.5 Regional Emphasis/Focus of GWP Group
12.5 Menasha Corporation
12.5.1 Introduction
12.5.2 Menasha Corporation Selected Recent Developments
12.5.3 Menasha Corporation Future Outlook
12.5.4 Competitors of Menasha Corporation
12.5.5 Regional Emphasis / Focus of Menasha Corporation
12.6 Nefab Group
12.6.1 Introduction
12.6.2 Nefab Group Selected Recent Development
12.6.3 Nefab Group Future Outlook
12.6.4 Competitors of Nefab Group
12.6.5 Regional Emphasis / Focus of Nefab Group
12.7 Rehrig Pacific Company, Inc.
12.7.1 Introduction
12.7.2 Rehrig Pacific Company, Inc. Future Outlook
12.7.3 Competitors of Rehrig Pacific Company, Inc.
12.7.4 Regional Emphasis / Focus of Rehrig Pacific Company, Inc.
12.8 RPP Containers
12.8.1 Introduction
12.8.2 RPP Containers Future Outlook
12.8.3 Competitors of RPP Containers
12.8.4 Regional Emphasis / Focus of RPP Containers
12.9 Schoeller Allibert
12.9.1 Schoeller Allibert Total Company Sales 2015-2018
12.9.2 Schoeller Allibert Sales by Geographical Segment of Business 2015-2018
12.9.3 Schoeller Allibert Selected Recent Development
12.9.4 Schoeller Allibert Future Outlook
12.9.5 Competitors of Schoeller Allibert
12.9.6 Regional Emphasis / Focus of Schoeller Allibert
12.10 Schütz GmbH & Co. KGaA
12.10.1 Introduction
12.10.2 Schütz GmbH & Co. KGaA Selected Recent Key Development
12.10.3 Schütz GmbH & Co. KGaA Future Outlook
12.10.4 Competitors of Schütz GmbH & Co. KGaA
12.10.5 Regional Emphasis / Focus of Schütz GmbH & Co. KGaA
12.11 Other Companies of Interest in the Market
13. Conclusion
Glossary
Associated Visiongain Reports
Visiongain Report Sales Order Form
Appendix A
Appendix B
Visiongain Report Evaluation Form
List of Figures
Figure 2.1 Global Returnable Packaging Market Segmentation Overview
Figure 3.1 Returnable Packaging Market Supply Chain
Figure 4.1 Global Returnable Packaging Forecast by National Market Forecast 2019-2029 (US$ M)
Figure 4.2 Leading National Returnable Packaging Market CAGR Forecast 2019-2024 (CAGR %)
Figure 4.3 Leading National Returnable Packaging Market CAGR Forecast 2024-2029 (CAGR %)
Figure 4.4 Leading National Returnable Packaging Market CAGR Forecast 2019-2029 (CAGR %)
Figure 4.5 Global Returnable Packaging Market by National Market Share Forecast 2019 (% Share)
Figure 4.6 Global Returnable Packaging Market by National Market Share Forecast 2024 (% Share)
Figure 4.7 Global Returnable Packaging Market by National Market Share Forecast 2029 (% Share)
Figure 4.8 Global Returnable Packaging Market Forecast by Product Type 2019-2029 (US$ M)
Figure 4.9 Global Returnable Packaging Market Share Forecast by Product Type 2019, 2024 and 2029 (% Share)
Figure 4.10 Global Returnable Packaging Material Submarket Forecast 2019-2029 (US$ M)
Figure 4.11 Global Returnable Packaging Material Submarket Share Forecast 2019, 2024 and 2029 (% Share)
Figure 4.12 Global Returnable Packaging End-User Submarket Forecasts 2019-2029 (US$ M)
Figure 4.13 Global Returnable Packaging End-User Submarket Forecast 2019, 2024 and 2029 (% Share)
Figure 5.1 IBCs Submarket Forecast by Regional Market 2019-2029 (US$ M)
Figure 5.2 Pallets Market Forecast by Regional Market 2019-2029 (US$ M)
Figure 5.3 Crates Market Forecast by Regional Market 2019-2029 (US$ M)
Figure 5.4 Drums Market Forecast by Regional Market 2019-2029 (US$ M)
Figure 5.5 Dunnage Bags Submarket Forecast by Regional Market 2019-2029 (US$ M)
Figure 5.6 Others Submarket Forecast by Regional Market 2019-2029 (US$ M)
Figure 5.7 Plastics Submarket Forecast by Regional Market 2019-2029 (US$ M)
Figure 5.8 Metal Market Forecast by Regional Market 2019-2029 (US$ M)
Figure 5.9 Wood Market Forecast by Regional Market 2019-2029 (US$ M)
Figure 5.10 Others Market Forecast by Regional Market 2019-2029 (US$ M)
Figure 5.11 Food and Beverage Submarket Forecast by Regional Market 2019-2029 (US$ M)
Figure 5.12 Automotive Market Forecast by Regional Market 2019-2029 (US$ M)
Figure 5.13 Healthcare Market Forecast by Regional Market 2019-2029 (US$ M)
Figure 5.14 Others Market Forecast by Regional Market 2019-2029 (US$ M)
Figure 6.1 North America Returnable Packaging Submarket Forecasts 2019-2029 (US$ M)
Figure 6.2 North America Returnable Packaging Submarket Share Forecast 2019, 2024 and 2029 (% Share)
Figure 6.3 North America Returnable Packaging Submarket Forecast by Material 2019-2029 (US$ M)
Figure 6.4 North America Returnable Packaging Submarket Share Forecast by Material 2019, 2024 and 2029 (% Share)
Figure 6.5 North America Returnable Packaging Submarket Forecast by End-User 2019-2029 (US$ M)
Figure 6.6 North America Returnable Packaging Submarket Share Forecast by End-User 2019, 2024 and 2029 (% Share)
Figure 6.7 North America Returnable Packaging Market Forecast by Country 2019-2029 (US$ M)
Figure 6.8 U.S. Returnable Packaging Market Forecast 2019-2029 (US$ M, AGR %)
Figure 6.9 Canada Returnable Packaging Market Forecast 2019-2029 (US$ M, AGR %)
Figure 7.1 Latin America Returnable Packaging Submarket Forecast 2019-2029 (US$ M)
Figure 7.2 Latin America Returnable Packaging Submarket Share Forecast 2019, 2024 and 2029 (% Share)
Figure 7.3 Latin America Returnable Packaging Submarket Forecast by Material 2019-2029 (US$ M)
Figure 7.4 Latin America Returnable Packaging Submarket Share Forecast by Material 2019, 2024 and 2029 (% Share)
Figure 7.5 Latin America Returnable Packaging Submarket Forecast by End-User 2019-2029 (US$ M)
Figure 7.6 Latin America Returnable Packaging Submarket Share Forecast by End-User 2019, 2024 and 2029 (% Share)
Figure 7.7 Latin America Returnable Packaging Market Forecast by Country 2019-2029 (US$ M)
Figure 7.8 Brazil Returnable Packaging Market Forecast 2019-2029 (US$ M, AGR %)
Figure 7.9 Mexico Returnable Packaging Market Forecast 2019-2029 (US$ M, AGR %)
Figure 7.10 Rest of Latin America Returnable Packaging Market Forecast 2019-2029 (US$ M, AGR%)
Figure 8.1 Europe Returnable Packaging Submarket Forecast 2019-2029 (US$ M)
Figure 8.2 Europe Returnable Packaging Submarket Share Forecast 2019, 2024 and 2029 (% Share)
Figure 8.3 Europe Returnable Packaging Submarket Forecast by Material 2019-2029 (US$ M)
Figure 8.4 Europe Returnable Packaging Submarket Share Forecast by Material 2019, 2024 and 2029 (% Share)
Figure 8.5 Europe Returnable Packaging Submarket Forecast by End-User 2019-2029 (US$ M)
Figure 8.6 Europe Returnable Packaging Submarket Share Forecast by End-User 2019, 2024 and 2029 (% Share)
Figure 8.7 Europe Returnable Packaging Market Forecast by Country 2019-2029 (US$ M)
Figure 8.8 Germany Returnable Packaging Market Forecast 2019-2029 (US$ M, AGR %)
Figure 8.9 France Returnable Packaging Market Forecast 2019-2029 (US$ M, AGR %)
Figure 8.10 U.K. Returnable Packaging Market Forecast 2019-2029 (US$ M, AGR %)
Figure 8.11 Italy Returnable Packaging Market Forecast 2019-2029 (US$ M, AGR %)
Figure 8.12 Spain Returnable Packaging Market Forecast 2019-2029 (US$ M, AGR %)
Figure 8.13 Rest of Europe Returnable Packaging Market Forecast 2019-2029 (US$ M, AGR %)
Figure 9.1 Asia-Pacific Returnable Packaging Submarket Forecast 2019-2029 (US$ M)
Figure 9.2 Asia-Pacific Returnable Packaging Submarket Share Forecast 2019, 2024 and 2029 (% Share)
Figure 9.3 Asia-Pacific Returnable Packaging Submarket Forecast by Material 2019-2029 (US$ M)
Figure 9.4 Asia-Pacific Returnable Packaging Submarket Share Forecast by Material 2019, 2024 and 2029 (% Share)
Figure 9.5 Asia-Pacific Returnable Packaging Submarket Forecast by End-User 2019-2029 (US$ M)
Figure 9.6 Asia-Pacific Returnable Packaging Submarket Share Forecast by End-User 2019, 2024 and 2029 (% Share)
Figure 9.7 Asia-Pacific Returnable Packaging Market Forecast by Country 2019-2029 (US$ M)
Figure 9.8 China Returnable Packaging Market Forecast 2019-2029 (US$ M, AGR %)
Figure 9.9 Japan Returnable Packaging Market Forecast 2019-2029 (US$ M, AGR %)
Figure 9.10 India Returnable Packaging Market Forecast 2019-2029 (US$ M, AGR %)
Figure 9.11 Rest of Asia-Pacific Returnable Packaging Market Forecast 2019-2029 (US$ M, AGR %)
Figure 10.1 MEA Returnable Packaging Submarket Forecast 2019-2029 (US$ M)
Figure 10.2 MEA Returnable Packaging Submarket Share Forecast 2019, 2024 and 2029 (% Share)
Figure 10.3 MEA Returnable Packaging Submarket Forecast by Material 2019-2029 (US$ M)
Figure 10.4 MEA Returnable Packaging Submarket Share Forecast by Material 2019, 2024 and 2029 (% Share)
Figure 10.5 MEA Returnable Packaging Submarket Forecast by End-User 2019-2029 (US$ M)
Figure 10.6 MEA Returnable Packaging Submarket Share Forecast by End-User 2019, 2024 and 2029 (% Share)
Figure 10.7 MEA Returnable Packaging Market Forecast by Country 2019-2029 (US$ M)
Figure 10.8 South Africa Returnable Packaging Market Forecast 2019-2029 (US$ M, AGR %)
Figure 10.9 GCC Countries Returnable Packaging Market Forecast 2019-2029 (US$ M, AGR %)
Figure 10.10 Rest of MEA Returnable Packaging Market Forecast 2019-2029 (US$ M, AGR %)
Figure 11.1 Key Recent Development Mapping
Figure 12.1 Amatech Inc. Portfolio Structure
Figure 12.2 Brambles Total Company Sales 2013-2017 (US$ M, AGR %)
Figure 12.3 Brambles Sales by Geographical Segment of Business 2015-2018 (US$ M, Total Company Sales AGR %)
Figure 12.4 Brambles Sales AGR by Geographical Segment of Business 2016-2018 (AGR %)
Figure 12.5 Brambles Sales by Operating Segment of Business 2017-2018 (US$ M)
Figure 12.6 Brambles Portfolio Structure
Figure 12.7 DS Smith Total Company Sales 2014-2018 (US$ M, AGR %)
Figure 12.8 DS Smith Sales by Geographical Segment of Business 2017-2018 (US$ M)
Figure 12.9 DS Smith Portfolio Structure
Figure 12.10 GWP Group Portfolio Structure
Figure 12.11 Menasha Corporation Portfolio Structure
Figure 12.12 Nefab Group Portfolio Structure
Figure 12.13 Rehrig Pacific Company, Inc. Portfolio Structure
Figure 12.14 RPP Containers Portfolio Structure
Figure 12.15 Schoeller Allibert Total Company Sales 2015-2018 (US$ M, AGR %)
Figure 12.16 Schoeller Allibert Sales by Geographical Segment of Business 2015-2018 (US$ M)
List of Tables
Table 4.1 Leading National Returnable Packaging Market Forecast 2019-2029 (US $bn, Global AGR %, CAGR)
Table 4.2 Global Returnable Packaging Market CAGR Forecast 2019-2024, 2024-2029, 2019-2029 (CAGR %)
Table 4.3 Global Returnable Packaging Market Forecast 2019-2029 (US $bn, AGR %, CAGR%, Cumulative)
Table 4.4 Global Returnable Packaging Submarket Forecast by Regional Market 2019-2029 (US$ bn)
Table 5.1 IBCs Submarket Forecast by Regional Market 2019-2029 (US $bn, AGR %, CAGR %)
Table 5.2 Pallets Market Forecast by Regional Market 2019-2029 (US $bn, AGR %, CAGR %)
Table 5.3 Crates Market Forecast by Regional Market 2019-2029 (US $bn, AGR %, CAGR %)
Table 5.4 Drums Market Forecast by Regional Market 2019-2029 (US $bn, AGR %, CAGR %)
Table 5.5 Dunnage Bags Submarket Forecast by Regional Market 2019-2029 (US $bn, AGR %, CAGR %)
Table 5.6 Others Submarket Forecast by Regional Market 2019-2029 (US$ bn, AGR %, CAGR %)
Table 5.7 Plastics Submarket Forecast by Regional Market 2019-2029 (US $bn, AGR %, CAGR %)
Table 5.8 Metal Market Forecast by Regional Market 2019-2029 (US $bn, AGR %, CAGR %)
Table 5.9 Wood Market Forecast by Regional Market 2019-2029 (US $bn, AGR %, CAGR %)
Table 5.10 Others Market Forecast by Regional Market 2019-2029 (US $m, AGR %, CAGR %)
Table 5.11 Food and Beverage Submarket Forecast by Regional Market 2019-2029 (US $bn, AGR %, CAGR %)
Table 5.12 Automotive Market Forecast by Regional Market 2019-2029 (US $bn, AGR %, CAGR %)
Table 5.13 Healthcare Market Forecast by Regional Market 2019-2029 (US $bn, AGR %, CAGR %)
Table 5.14 Others Market Forecast by Regional Market 2019-2029 (US $bn, AGR %, CAGR %)
Table 6.1 North America Returnable Packaging Submarket Forecast 2019-2029 (US $bn, AGR %, CAGR %)
Table 6.2 North America Returnable Packaging Submarket Forecast by Material 2019-2029 (US $bn, AGR %, CAGR %)
Table 6.3 North America Returnable Packaging Submarket Forecast by End-User 2019-2029 (US$ bn, AGR %, CAGR %)
Table 6.4 North America Returnable Packaging Market Forecast by Country 2019-2029 (US $bn, AGR %, CAGR %)
Table 6.5 U.S. Returnable Packaging Market Forecast 2019-2029 (US$ bn, AGR %, CAGR %, Cumulative)
Table 6.6 Canada Returnable Packaging Market Forecast 2019-2029 (US$ bn, AGR %, CAGR %, Cumulative)
Table 7.1 Latin America Returnable Packaging Submarket Forecast 2019-2029 (US $mn, AGR %, CAGR %)
Table 7.2 Latin America Returnable Packaging Submarket Forecast by Material 2019-2029 (US $bn, AGR %, CAGR %)
Table 7.3 Latin America Returnable Packaging Submarket Forecast by End-User 2019-2029 (US $bn, AGR %, CAGR %)
Table 7.4 Latin America Returnable Packaging Market Forecast by Country 2019-2029 (US $bn, AGR %, CAGR %)
Table 7.5 Brazil Returnable Packaging Market Forecast 2019-2029 (US$ bn, AGR %, CAGR %, Cumulative)
Table 7.6 Mexico Returnable Packaging Market Forecast 2019-2029 (US$ bn, AGR %, CAGR %, Cumulative)
Table 7.7 Rest of Latin America Returnable Packaging Market Forecast 2019-2029 (US$ bn, AGR %, CAGR %, Cumulative)
Table 8.1 Europe Returnable Packaging Submarket Forecast 2019-2029 (US $bn, AGR %, CAGR %)
Table 8.2 Europe Returnable Packaging Submarket Forecast by Material 2019-2029 (US $bn, AGR %, CAGR %)
Table 8.3 Europe Returnable Packaging Submarket Forecast by End-User 2019-2029 (US $bn, AGR %, CAGR %)
Table 8.4 Europe Returnable Packaging Market Forecast by Country 2019-2029 (US $bn, AGR %, CAGR %)
Table 8.5 Germany Returnable Packaging Market Forecast 2019-2029 (US$ bn, AGR %, CAGR %, Cumulative)
Table 8.6 France Returnable Packaging Market Forecast 2019-2029 (US$ bn, AGR %, CAGR %, Cumulative)
Table 8.7 U.K. Returnable Packaging Market Forecast 2019-2029 (US$ bn, AGR %, CAGR %, Cumulative)
Table 8.8 Italy Returnable Packaging Market Forecast 2019-2029 (US$ bn, AGR %, CAGR %, Cumulative)
Table 8.9 Spain Returnable Packaging Market Forecast 2019-2029 (US$ bn, AGR %, CAGR %, Cumulative)
Table 8.10 Rest of Europe Returnable Packaging Market Forecast 2019-2029 (US$ bn, AGR %, CAGR %, Cumulative)
Table 9.1 Asia-Pacific Returnable Packaging Submarket Forecast 2019-2029 (US $bn, AGR %, CAGR %)
Table 9.2 Asia-Pacific Returnable Packaging Submarket Forecast by Material 2019-2029 (US $bn, AGR %, CAGR %)
Table 9.3 Asia-Pacific Returnable Packaging Submarket Forecast by End-User 2019-2029 (US $bn, AGR %, CAGR %)
Table 9.4 Asia-Pacific Returnable Packaging Market Forecast by Country 2019-2029 (US $bn, AGR %, CAGR %)
Table 9.5 China Returnable Packaging Market Forecast 2019-2029 (US$ bn, AGR %, CAGR %)
Table 9.6 Japan Returnable Packaging Market Forecast 2019-2029 (US$ bn, AGR %, CAGR %, Cumulative)
Table 9.7 India Returnable Packaging Market Forecast 2019-2029 (US$ bn, AGR %, CAGR %, Cumulative)
Table 9.8 Rest of Asia-Pacific Returnable Packaging Market Forecast 2019-2029 (US$ bn, AGR %, CAGR %, Cumulative)
Table 10.1 MEA Returnable Packaging Submarket Forecast 2019-2029 (US $bn, AGR %, CAGR %)
Table 10.2 MEA Returnable Packaging Submarket Forecast by Material 2019-2029 (US $bn, AGR %, CAGR %)
Table 10.3 MEA Returnable Packaging Submarket Forecast by End-User 2019-2029 (US $bn, AGR %, CAGR %)
Table 10.4 MEA Returnable Packaging Market Forecast by Country 2019-2029 (US $bn, AGR %, CAGR %)
Table 10.5 South Africa Returnable Packaging Market Forecast 2019-2029 (US$ bn, AGR %, CAGR %, Cumulative)
Table 10.6 GCC Countries Returnable Packaging Market Forecast 2019-2029 (US$ bn, AGR %, CAGR %, Cumulative)
Table 10.7 Rest of MEA Returnable Packaging Market Forecast 2019-2029 (US$ bn, AGR %, CAGR %, Cumulative)
Table 12.1 Amatech Inc. Profile 2019 (HQ, Founded, No. of Employees, Website)
Table 12.2 Brambles Profile 2019 (HQ, Founded, Website)
Table 12.3 Brambles Total Company Sales 2013-2017 (US$ M, AGR %)
Table 12.4 Brambles by Geographical Segment of Business 2015-2018 (US$ M, AGR %)
Table 12.5 Brambles by Operating Segment of Business 2017-2018 (US$ M, AGR %)
Table 12.6 Selected Recent Brambles Recent Development 2019 (Year, Type, Details)
Table 12.7 DS Smith Profile 2019 (HQ, CEO, No of Employees, Founded, Website)
Table 12.8 DS Smith Total Company Sales 2015-2018 (US$ M, AGR %)
Table 12.9 Selected DS Smith Recent Developments 2019 (Year, Type, Details)
Table 12.10 GWP Group Profile 2019 (CEO, HQ, Founded, No. of Employees, Website)
Table 12.11 Selected Recent GWP Group Key Development 2018 (Year, Type, Details)
Table 12.12 Menasha Corporation Profile 2019 (CEO, HQ, Founded, Website)
Table 12.13 Selected Recent Menasha Corporation Developments 2017-2018 (Year, Type, Details)
Table 12.14 Nefab Group Profile 2019 (CEO, HQ, Founded, No. of Employees, Website)
Table 12.15 Selected Nefab Group Recent Developments 2017-2019 (Year, Type, Details)
Table 12.16 Rehrig Pacific Company, Inc. Profile 2019 (CEO, HQ, Founded, Website)
Table 12.17 RPP Containers Profile 2019 (HQ, Founded, Website)
Table 12.18 Schoeller Allibert Profile 2019 (CEO, HQ, Founded, No. of Employees, Website)
Table 12.19 Schoeller Allibert Total Company Sales 2015-2018 (US$ M, AGR %)
Table 12.20 Selected Schoeller Allibert Recent Development 2016 (Year, Type, Details)
Table 12.21 Schütz GmbH & Co. KGaA Profile 2019 (CEO, HQ, Founded, No. of Employees, Website)
Table 12.22 Selected Recent Schütz GmbH & Co. KGaA Key Development 2019 (Year, Type, Details)
Table 12.23 Other Companies of Interest in the Market
All Plastic Pallets Ltd
Amatech Inc.
Apex Drum Company
AUER Packaging
Brambles
Bronstein Container Company, Inc.
Cabka Group
Carolina Drum LLC
Ckdpack Packaging Inc.
Consolidated Container Company, LLC
Custom Metalcraft
Dayton Industrial Drum, Inc.
DS Smith
Encore Container
Greif, Inc.
Grey Mountain Partners
GWP Group
Hengxin Plastic Co., Ltd
Hoover Ferguson Group
IPL Plastics
Jones Barrel Company
Kearny Steel Container
Linpac Allibert Ltd
Loadhog Ltd
M. J. Systems
Matcon IBC
MAUSER Group
MBC, Inc.
Menasha Corporation
Mitchell Container Services, Inc.
Mjsolpac Ltd.
Monoflo International
Mpact Limited
Multipac Systems
Myers Industries
Nefab Group
Orbis Corporation
Pacific Cost Packaging
Plasmix Private Ltd.
Plymouth Industries
PPS East Ltd
Precision IBC
Rahway Steel Drum Co., Inc.
Rehrig Pacific Company, Inc.
Responsible Container, LLC
Reusable Transport Packaging
RPP Containers
Schoeller Allibert
Schütz GmbH & Co. KGaA
Speed Group
Thielmann US
Tri-Wall Limited
UFP Technologies
Weir & Carmichael Ltd
Wiegand-Glas GmbH
Download sample pages
Complete the form below to download your free sample pages for Returnable Packaging Market Report 2019-2029
Related reports
-
Post-Consumer Recycled Plastic Market Report 2019-2029
With global, national/regional, and submarket estimates for the Post-Consumer Recycled Plastics Market, this report covers key aspects of this market....
Full DetailsPublished: 22 March 2019 -
Active, Smart and Intelligent Packaging Market Report 2019-2029
With an incredible amount of attention devoted to active, smart and intelligent packaging market, deriving market prospects and opportunities can...Full DetailsPublished: 14 January 2019 -

Recycled Packaging Materials Market Report 2019-2029
The latest report from business intelligence provider, Visiongain offers a comprehensive analysis of the global Recycled Packaging Materials market. Visiongain...Full DetailsPublished: 29 March 2019 -
Security Paper Market Report 2019-2029
With an incredible amount of attention devoted to the security paper market, deriving market prospects and opportunities can be difficult....Full DetailsPublished: 29 May 2019 -
Tobacco Packaging Market Report 2018-2028
The global tobacco packaging market is expected to reach $14.9bn in 2018 and develop dynamically over the forecast period, driven...Full DetailsPublished: 10 October 2018
Download sample pages
Complete the form below to download your free sample pages for Returnable Packaging Market Report 2019-2029
Do you have any custom requirements we can help you with?
Any specific country, geo region, market segment or specific company information?
Email us today, we can discuss your needs and see how we can help: jamie.roberts@visiongain.com
Would you like a free report overview of the report of your choice?
If so, please drop an email to Jamie Roberts stating your chosen report title to jamie.robertsvisiongain.com
Visiongain packaging related reports are compiled using a broad and rich mixture of both primary and secondary information to produce an overall industry outlook. In order to provide our clients with the best product possible product, visiongain analysts reach out to market-leading vendors and industry experts but also review a wealth of financial data and product information from a vast range of sources. To find out more about our reports methodology, please email jamie.roberts@visiongain.com
Would you like to get the latest Visiongain packaging reports catalogue?
What are the dynamic growth sectors? where are the regional business opportunities?
Which technologies will prevail and who are the leading companies succeeding in these sectors and why?
If you want definitive answers to business critical questions, discover Visiongain’s full range of business intelligence reports.
If so, please email Jamie Roberts on jamie.roberts@visiongain.com or call her today on +44 207 336 6100
Adhesive & Sealant Council
Alliance of Foam Packaging Recyclers
American Bakers Association
American Chemistry Council
American Forest & Paper Association
American Frozen Food Institute
American Institute of Food Distributors
American Iron and Steel Institute
American Management Association
American National Standards Institute
American Plastics Council (APC)
American Society for Testing and Materials
Association for Suppliers of Printing, Publishing
AICC, The Independent Packaging Association
Association of Industrial Metallizers, Coaters and Laminators (AIMCAL)
Automated Identification Manufacturer
Automated Imaging Association
Can Manufacturers Institute
Chocolate Manufacturers Association of the U.S.A.
Consumer Healthcare Products Association
Contract Manufacturing and Packaging Association
Converting Equipment Manufacturers Association
Corrugated Packaging Council
Drug, Chemical & Allied Trade Association
Envelope Manufacturers Association
Fibre Box Association
Flexible Packaging Association
Flexographic Technical AssociationFlexographic Technical Association
Foil Stamping and Embossing Association
Food and Drug Law Institute
Food Institute
Food Marketing Institute
Food Processing Machinery & Supplies Association
Foodservice & Packaging Institute
Glass Packaging Institute
Graphic Arts Technical Foundation
Gravure Association of America
Grocery Manufacturers of America
Healthcare Compliance Packaging Council
High Definition Flexo Consortium
Institute of Food Technologists
Institute of Packaging Professionals
International Association of Food Industry Suppliers
International Bottled Water Association
International Dairy Foods Association
International Foodservice Manufacturers Association
International Safe Transit Association
Label Printing Industries of America
Material Handling Industry of America
National Association of Container Distributors
National Association of Manufacturers
National Chicken Council
National Coil Coating Association
National Confectioners Association of the U.S.A.
National Freight Claim & Security
National Institute of Packaging, Handling & Logistics Engineers
National Paper Trade Association
National Wooden Pallet & Container
Open Modular Architecture Controls (OMAC) Packaging Workgroup
Packaging Association of Canada
Paperboard Packaging Council
Petroleum Packaging Council
Pharmaceutical Research and Manufacturers of America
PMMI: The Association for Packaging and Processing Technologies
Polystyrene Packaging Council
Pressure Sensitive Tape Council
Printing Industries of America
Processing and Packaging Machinery Association (PPMA)
Produce Marketing Association, Inc.
Research & Development Associates for Military Food & Packaging Systems
Robotic Industries Association (RIA)
Snack Food Association
Soap & Detergent Association
Society of Glass and Ceramic Decorators
Society of Manufacturing Engineers
Society of Plastics Engineers (SPE)
Society of the Plastics Industry (SPI)
Steel Recycling Institute
Steel Shipping Containers Institute
Tag and Label Manufacturers Institute
Technical Association of the Pulp & Paper Industry
The Aluminum Association
Transportation Consumer Protection Council
Transportation Loss Prevention & Security Association
Tube Council of North America
Uniform Code Council, Inc.
Western Packaging Association (WPA)
World Packaging Organisation
Latest Packaging news
Visiongain Publishes Caps & Closures Market Report 2024-2034
The global caps & closures market was valued at US$80.8 billion in 2023 and is projected to grow at a CAGR of 9% during the forecast period 2024-2034.
22 February 2024
Visiongain Publishes Flexible (Converted) Plastic Packaging Market Report 2024-2034
The global Flexible (Converted) Plastic Packaging market was valued at US$157.3 billion in 2023 and is projected to grow at a CAGR of 5.4% during the forecast period 2024-2034.
04 January 2024
Visiongain Publishes Beverage Packaging Market Report 2023-2033
The global Beverage Packaging market was valued at US$144.3 billion in 2022 and is projected to grow at a CAGR of 4.6% during the forecast period 2023-2033.
28 September 2023
Visiongain Publishes Cosmetics Packaging Market Report 2023-2033
The global Cosmetics Packaging market is projected to grow at a CAGR of 4.3% by 2033
21 July 2023
