Industries > Packaging > Security Paper Market Report 2019-2029
Security Paper Market Report 2019-2029
Forecasts by Component (Substrates, Watermarks, Threads and Holograms), by Application (Bank Notes, Passports, Identity Cards, Certificates, Legal and Government Documents, Cheques and Stamps) Plus Profiles of Leading Companies and Regional and Leading National Market Analysis
With an incredible amount of attention devoted to the security paper market, deriving market prospects and opportunities can be difficult. Visiongain has looked beyond the attention-grabbing headlines to create an accurate market research report that will help you arrive at logical, valuable conclusions that are grounded in reality- not media headlines.
With global, national/regional, and submarket estimates for security paper market, this report covers key aspects of this market. Also, the report profiles the leading companies in the market, and drivers and restraints analysis of the market.
Reasons to Buy
• Learn where the security paper market is headed
• See where the business opportunities are
• Compare your evaluations with a second opinion
• Discover who the first movers are within this market space
• See what the barriers to entry are likely to be
Featured content
• Global Security Paper market forecasts and analysis from 2019-2029 illustrate the market progression
• Security Paper Market Forecasts by Component from 2019-2029
– Security Paper Market Forecast for Substrates 2019-2029
– Security Paper Market Forecast for Threads 2019-2029
– Security Paper Market Forecast for Watermarks 2019-2029
– Security Paper Market Forecast for Holograms 2019-2029
– Security Paper Market Forecast for Others 2019-2029
• Security Paper market Forecasts by Application from 2019-2029
– Security Paper Market Forecast for Banknotes and Cheques 2019-2029
– Security Paper Market Forecast for Passports 2019-2029
– Security Paper Market Forecast for Legal and Government Documents 2019-2029
– Security Paper Market Forecast for Stamps 2019-2029
– Security Paper Market Forecast for Identity Cards 2019-2029
– Security Paper Market Forecast for Certificates 2019-2029
– Security Paper Market Forecast for Others 2019-2029
• Regional and Leading National Security Paper Market Forecasts from 2019-2029
• North America Security Paper Market Forecast 2019-2029
– US Security Paper Market Forecast 2019-2029
– Canada Security Paper Market Forecast 2019-2029
• Europe Security Paper Market Forecast 2019-2029
– Germany Security Paper Market Forecast 2019-2029
– United Kingdom Security Paper Market Forecast 2019-2029
– France Security Paper Market Forecast 2019-2029
– Russia Security Paper Market Forecast 2019-2029
– Rest of Europe Security Paper Market Forecast 2019-2029
• Asia Pacific Security Paper Market Forecast 2019-2029
– China Security Paper Market Forecast 2019-2029
– India Security Paper Market Forecast 2019-2029
– Japan Security Paper Market Forecast 2019-2029
– Rest of Asia Pacific Security Paper Market Forecast 2019-2029
• Latin America Security Paper Market Forecast 2019-2029
– Brazil Security Paper Market Forecast 2019-2029
– Argentina Security Paper Market Forecast 2019-2029
– Mexico Security Paper Market Forecast 2019-2029
– Rest of Latin America Security Paper Market Forecast 2019-2029
• MEA Security Paper Market Forecast 2019-2029
– United Arab Emirates Security Paper Market Forecast 2019-2029
– Saudi Arabia Security Paper Market Forecast 2019-2029
– South Africa Security Paper Market Forecast 2019-2029
– Rest of MEA Security Paper Market Forecast 2019-2029
• Profiles of the leading 10 Security Paper Companies
– China Banknote Printing and Minting Corporation (CBPM)
– De La Rue PLC
– Document Security Systems
– Drewsen Spezialpapiere GmbH & Co. Kg
– Fedrigoni Group
– Giesecke+Devrient
– Goznak
– Real Casa De La Moneda (FNMT-RCM)
– Security Paper Limited
– Security Printing and Minting Corporation of India Limited (SPMCIL)
Security Paper market is forecasted for healthy growth. With a Visiongain report, you can learn just how the development of this market could affect you. With 172 charts and graphs, this 159-page report will be of interest to you.
Visiongain is a trading partner with the US Federal Government
CCR Ref number: KD4R6
Do you have any custom requirements we can help you with? Any need for specific country, geo region, market segment or specific company information? Contact us today, we can discuss your needs and see how we can help: sara.peerun@visiongain.com
1.1 Global Security Paper Market Overview
1.2 Global Security Paper Market Segmentation
1.3 Why You Should Read This Report
1.4 How This Report Delivers
1.5 Key Questions Answered by This Analytical Report Include:
1.6 Who is This Report For?
1.7 Methodology
1.7.1 Secondary Research
1.7.2 Market Evaluation & Forecasting Methodology
1.8 Frequently Asked Questions (FAQ)
1.9 Associated Visiongain Reports
1.10 About Visiongain
2. Introduction to the Global Security Paper Market
2.1 Global Security Paper Market Structure
2.2 Security Paper Market Definition
2.3 Security Paper Market Supply Chain
3. Global Security Paper Market 2019-2029
3.1 Global Security Paper Market Forecast 2019-2029
3.2 Global Security Paper Market Analysis
3.3 Global Security Paper Market Drivers & Restraints 2019
3.3.1 Drivers
3.3.1.1 Increase in and Rise in Awareness About Frauds Among Consumers and Authorities
3.3.1.2 Printing, Circulation and Reprinting Of Banknotes, Passports and Other Legal Documents
3.3.2 Restraints
3.3.2.1 Rise in Digitisation Remains a Hurdle For The Growth of Security Paper Demand
3.3.2.2 Increasing Online Banking Activities
4. Global Security Paper Market Forecast by Component 2019-2029
4.1 Substrates Market Forecast 2019-2029
4.2 Threads Market Forecast 2019-2029
4.3 Watermarks, Holograms and Others Market Forecast 2019-2029
5. Global Security Paper Market and Forecasts by Application 2019-2029
5.1 Introduction
5.2 Bank Notes and Cheques Market Forecast 2019-2029
5.3 Passports Market Forecast 2019-2029
5.4 Legal and Government Documents Market Forecast 2019-2029
5.5 Stamps Market Forecast 2019-2029
5.6 Identity Cards Market Forecast 2019-2029
5.7 Certificates and Others Market Forecast 2019-209
6. Leading Regional Security Paper Market Forecasts 2019-2029
6.1 Asia Pacific Security Paper Market Forecast 2019-2029
6.1.1 China Security Paper Market Forecast 2019-2029
6.1.2 India Security Paper Market Forecast 2019-2029
6.1.3 Japan Security Paper Market Forecast 2019-2029
6.1.4 Rest of Asia Pacific Security Paper Market Forecast 2019-2029
6.2 North America Security Paper Market Forecast 2019-2029
6.2.1 USA Security Paper Market Forecast 2019-2029
6.2.2 Canada Security Paper Market Forecast 2019-2029
6.3 Europe Security Paper Market Forecast 2019-2029
6.3.1 Germany Security Paper Market Forecast 2019-2029
6.3.2 United Kingdom Security Paper Market Forecast 2019-2029
6.3.3 France Security Paper Market Forecast 2019-2029
6.3.4 Russia Security Paper Market Forecast 2019-2029
6.3.5 Rest of Europe Security Paper Market Forecast 2019-2029
6.4 Latin American Security Paper Market Forecast 2019-2029
6.4.1 Brazil Security Paper Market Forecast 2019-2029
6.4.2 Argentina Security Paper Market Forecast 2019-2029
6.4.3 Mexico Security Paper Market Forecast 2019-2029
6.4.4 Rest of Latin America Security Paper Market Forecast 2019-2029
6.5 Middle East and Africa Security Paper Market Forecast 2019-2029
6.5.1 United Arab Emirates Security Paper Market Forecast 2019-2029
6.5.2 Saudi Arabia Security Paper Market Forecast 2019-2029
6.5.3 South Africa Security Paper Market Forecast 2019-2029
6.5.4 Rest of the Middle East and Africa Security Paper Market Forecast 2019-2029
7. SWOT Analysis of the Global Security Paper Market 2019-2029
8. Leading Companies in the Global Security Paper Market 2019
8.1 Global Security Paper Market Companies 2019
8.2 China Banknote Printing and Minting Corporation (CBPM)
8.2.1 China Banknote Printing and Minting Corporation (CBPM) Key Developments 2016-2018
8.2.2 China Banknote Printing and Minting Corporation (CBPM) Business Divisions
8.2.3 China Banknote Printing and Minting Corporation (CBPM) Company Overview
8.2.4 China Banknote Printing and Minting Corporation (CBPM) History and Business Overview
8.2.5 China Banknote Printing and Minting Corporation (CBPM) SWOT Analysis
8.3 De La Rue Plc
8.3.1 De La Rue Plc Key Developments 2017-2019
8.3.2 De La Rue Plc Sales 2014-2018
8.3.3 De La Rue Plc Net Income 2014-2018
8.3.4 De La Rue Plc Business Divisions
8.3.5 De La Rue Plc Overview
8.3.6 De La Rue Plc History
8.3.7 De La Rue Plc Key Financial Ratios
8.3.8 De La Rue Plc Financial Outlook
8.3.9 De La Rue Plc SWOT Analysis
8.4 Document Security Systems
8.4.1 Document Security Systems Key Developments
8.4.2 Document Security Systems Sales 2014-2018
8.4.3 Document Security Systems Net Income 2014-2018
8.4.4 Document Security Systems Business Divisions
8.4.5 Document Security Systems Company Overview
8.4.6 Document Security Systems History and Business Overview
8.4.7 Document Security Systems Key Financial Ratios
8.4.8 Document Security Systems Financial Outlook
8.4.9 Document Security Systems SWOT Analysis
8.5 Drewsen Special Papers GmbH & Co. Kg
8.5.1 Drewsen Special Papers Key Developments 2016-2018
8.5.2 Drewsen Special Papers Business Divisions
8.5.3 Drewsen Special Papers Company Overview
8.5.4 Drewsen Special Papers Company History
8.5.5 Drewsen Special Papers Company SWOT Analysis
8.6 Fedrigoni Group
8.6.1 Fedrigoni Group Key Developments
8.6.2 Fedrigoni Group Sales 2013-2017
8.6.3 Fedrigoni Group Net Income 2013-2017
8.6.4 Fedrigoni Group Business Divisions
8.6.5 Fedrigoni Group Overview
8.6.6 Fedrigoni Group History
8.6.7 Fedrigoni Group Financial outlook
8.6.8 Fedrigoni Group SWOT Analysis
8.7 Giesecke+Devrient
8.7.1 Giesecke+Devrient Selected Recent Key Developments 2014-2018
8.7.2 Giesecke+Devrient Sales 2014-2017
8.7.3 Giesecke+Devrient Net Income 2014-2017
8.7.4 Giesecke+Devrient Business Divisions
8.7.5 Giesecke+Devrient Company Overview
8.7.6 Giesecke+Devrient History and Business Overview
8.7.7 Giesecke+Devrient Key Financial Ratios
8.7.8 Giesecke+Devrient Financial Outlook
8.7.9 Giesecke+Devrient SWOT Analysis
8.8 Goznak
8.8.1 Goznak Key Developments 2016-2017
8.8.2 Goznak Sales 2013-2017
8.8.3 Goznak Net Income 2013-2017
8.8.4 Goznak Business Divisions
8.8.5 Goznak Company Overview
8.8.6 Goznak History and Business Overview
8.8.7 Goznak Key Financial Ratios
8.8.8 Goznak Financial Outlook
8.8.9 Goznak SWOT Analysis
8.9 Real Casa De La Moneda (FNMT-RCM)
8.9.1 Real Casa De La Moneda (FNMT-RCM) Security Paper Market Key Developments 2017-2018
8.9.2 Real Casa De La Moneda (FNMT-RCM) Sales 2013-2017
8.9.3 Real Casa De La Moneda (FNMT-RCM) Net Income 2013-2017
8.9.4 Real Casa De La Moneda (FNMT-RCM) Business Divisions
8.9.5 Real Casa De La Moneda (FNMT-RCM) Company Overview
8.9.6 Real Casa De La Moneda (FNMT-RCM) History and Business Overview
8.9.7 Real Casa De La Moneda (FNMT-RCM) Key Financial Ratios
8.9.8 Real Casa De La Moneda (FNMT-RCM) Financial Outlook
8.9.9 Real Casa De La Moneda (FNMT-RCM) SWOT Analysis
8.10 Security Papers Ltd.
8.10.1 Security Papers Ltd. Key Developments 2015-2018
8.10.2 Security Papers Ltd. Sales 2013-2017
8.10.3 Security Papers Ltd. Net Income 2013-2017
8.10.4 Security Papers Ltd. Business Divisions
8.10.5 Security Papers Ltd. Company Overview
8.10.6 Security Papers Ltd. History and Business Overview
8.10.7 Security Papers Ltd. Key Financial Ratios
8.10.8 Security Papers Ltd. Financial Outlook
8.10.9 Security Papers Ltd. SWOT Analysis
8.11 Security Printing and Minting Corporation of India Limited (SPMCIL)
8.11.1 SPMCIL Company Key Strategies
8.11.2 SPMCIL Company Sales 2013-2017
8.11.3 SPMCIL Company Net Income / Loss 2013-2017
8.11.4 SPMCIL Business Divisions
8.11.5 SPMCIL Company Overview
8.11.6 SPMCIL History and Business Overview
8.11.7 SPMCIL Key Financial Ratio
8.11.8 SPMCIL Financial Outlook
8.11.9 SPMCIL SWOT Analysis
8.12 Other Leading Companies in the Value Chain
9. Conclusions
10. Glossary
Associated Visiongain Reports
Visiongain Report Sales Order Type
Appendix A
About Visiongain
Appendix B
Visiongain Report Evaluation Form
List of Figures
Figure 1.1 Global Security Paper Market Segmentation
Figure 2.1 Global Security Paper Market Segmentation Overview
Figure 2.2 Security Paper Market Supply Chain
Figure 3.1 Global Security Paper Market Forecast 2019-2029 (US$m, AGR %)
Figure 4.1 Global Security Paper Market Forecast by Component 2019-2029 (US$m, AGR %)
Figure 4.2 Global Security Paper Market Forecast by Component 2019, 2024, and 2029 (% Share)
Figure 4.3 Substrates Market Forecast 2019-2029 ($Mn, AGR %)
Figure 4.4 Global Threads Market Forecast 2019-2029 ($Mn, AGR %)
Figure 4.5 Watermarks, Holograms and Others Market Forecasts 2019-2029 ($Mn)
Figure 5.1 Global Security Paper Market Share by Application 2019, 2024, 2029 (% Share)
Figure 5.2 Bank Notes and Cheques Market Forecast 2019-2029 ($Mn, AGR %)
Figure 5.3 Passports Market Forecast 2019-2029 ($Mn, AGR %)
Figure 5.4 Legal and Government Documents Market Forecast 2019-2029 ($Mn, AGR %)
Figure 5.5 Stamps Market Forecast 2019-2029 ($Mn, AGR %)
Figure 5.6 Identity Cards Market Forecast 2019-2029 ($Mn, AGR %)
Figure 5.7 Certificates and Others Market Forecast 2019-2029 ($Mn, AGR %)
Figure 6.1 Regional Security Paper Market Share 2019, 2024, 2029 (% Share)
Figure 6.2 Asia Pacific Security Paper Market Share Forecast by Country 2019, 2024, 2029 (% Share)
Figure 6.3 Asia Pacific Security Paper Market Forecast 2019-2029 (US$m, AGR%)
Figure 6.4 China Security Paper Market Forecast 2019-2029 (US$m, AGR%)
Figure 6.5 India Security Paper Market Forecast 2019-2029 (US$m, AGR%)
Figure 6.6 Japan Security Paper Market Forecast 2019-2029 (US$m, AGR%)
Figure 6.7 Rest of Asia Pacific Security Paper Market Forecast 2019-2029 (US$m, AGR%)
Figure 6.8 North America Security Paper Market Share Forecast by Country 2019, 2024, 2029 (% Share)
Figure 6.9 North America Security Paper Market Forecast 2019-2029 (US$m, AGR%)
Figure 6.10 USA Security Paper Market Forecast 2019-2029 (US$m, AGR%)
Figure 6.11 Volume of Counterfeit Canadian Bank Notes passed from 2008-17
Figure 6.12 Canada Security Paper Market Forecast 2019-2029 (US$m, AGR%)
Figure 6.13 Europe Security Paper Market Share Forecast by Country 2019, 2024, 2029 (% Share)
Figure 6.14 Europe Security Paper Market Forecast 2019-2029 (US$m, AGR%)
Figure 6.15 Germany Security Paper Market Forecast 2019-2029 (US$m, AGR%)
Figure 6.16 UK Security Paper Market Forecast 2019-2029 (US$m, AGR%)
Figure 6.17 France Security Paper Market Forecast 2019-2029 (US$m, AGR%)
Figure 6.18 Russia Security Paper Market Forecast 2019-2029 (US$m, AGR%)
Figure 6.19 Rest of Europe Security Paper Market Forecast 2019-2029 (US$m, AGR%)
Figure 6.20 Latin America Security Paper Market Share Forecast by Country 2019, 2024, 2029 (% Share)
Figure 6.21 Latin America Security Paper Market Forecast 2019-2029 (US$m, AGR%)
Figure 6.22 Brazil Security Paper Market Forecast 2019-2029 (US$m, AGR%)
Figure 6.23 Argentina Introduced new 1,000 peso note in December 2017
Figure 6.24 Argentina Security Paper Market Forecast 2019-2029 (US$m, AGR%)
Figure 6.25 Mexico Introduces New 500 Peso Note
Figure 6.26 Mexico Security Paper Market Forecast 2019-2029 (US$m, AGR%)
Figure 6.27 Rest of Latin America Security Paper Market Forecast 2019-2029 (US$m, AGR%)
Figure 6.28 The Middle East and Africa Security Paper Market Share Forecast by Country 2019, 2024, 2029 (% Share)
Figure 6.29 The Middle East and Africa Security Paper Market Forecast 2019-2029 (US$m, AGR%)
Figure 6.30 The UAE introduced new notes in October 2018
Figure 6.31 United Arab Emirates Security Paper Market Forecast 2019-2029 (US$m, AGR%)
Figure 6.32 Saudi Arabia Security Paper Market Forecast 2019-2029 (US$m, AGR%)
Figure 6.33 South Africa Security Paper Market Forecast 2019-2029 (US$m, AGR%)
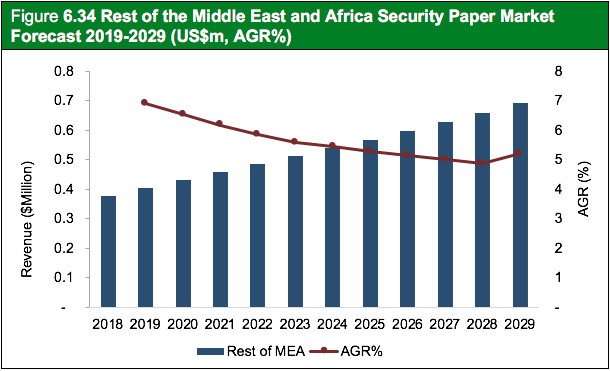
Figure 6.34 Rest of the Middle East and Africa Security Paper Market Forecast 2019-2029 (US$m, AGR%)
Figure 8.1 China Banknote Printing and Minting Corporation (CBPM) Business Divisions 2017
Figure 8.2 De La Rue Plc Sales 2014-2018 (US$m, AGR %)
Figure 8.3 De La Rue Plc Net Income 2013-2017 (US$m)
Figure 8.4 De La Rue Plc Business Divisions 2017
Figure 8.5 WestRock Company Sales 2014-2018 (US$m, AGR %)
Figure 8.6 Document Security Systems Net Income 2014-2018 (US$m)
Figure 8.7 Document Security Systems Business Divisions 2017
Figure 8.8 Drewsen Special Papers Business Divisions 2017
Figure 8.9 Fedrigoni Group Sales 2013-2017 (US$m, AGR %)
Figure 8.10 Fedrigoni Group Net Income 2013-2017 (US$m, AGR %)
Figure 8.11 Fedrigoni Group Business Divisions 2017
Figure 8.12 Giesecke+Devrient Sales 2014-2017 (US$m, AGR %)
Figure 8.13 Giesecke+Devrient Net Income 2014-2017 (US$m, AGR %)
Figure 8.14 Giesecke+Devrient Business Divisions 2017
Figure 8.15 Goznak Sales 2013-2017 (US$m, AGR %)
Figure 8.16 Goznak Net Income 2013-2017 (US$m)
Figure 8.17 Goznak Business Divisions 2017
Figure 8.18 Real Casa De La Moneda (FNMT-RCM) Sales 2013-2017 (US$m, AGR %)
Figure 8.19 Real Casa De La Moneda (FNMT-RCM) Net Income 2013-2017 (US$m, AGR %)
Figure 8.20 Real Casa De La Moneda (FNMT-RCM) Business Divisions 2017
Figure 8.21 Security Papers Ltd. Sales 2013-2017 (US$m, AGR %)
Figure 8.22 Security Papers Ltd. Net Income 2013-2017 (US$m)
Figure 8.23 Security Papers Ltd. Business Divisions 2017
Figure 8.24 SPMCIL Sales 2013-2017 (US$m, AGR %)
Figure 8.25 SPMCIL Net Income / Loss 2013-2017 (US$m)
Figure 8.26 SPMCIL Business Divisions 2017
Figure 8.27 SPMCIL Segment Performance 2017 (%)
List of Tables
Table 2.1 Security Paper Market Segmentation (Component and Application)
Table 3.1 Global Security Paper Market Forecast 2019-2029 (US$m, AGR%, CAGR %, Cumulative)
Table 4.1 Global Security Paper Market Forecast by Component 2019-2029 (US$m, AGR%, Cumulative)
Table 4.2 Substrates in Security Paper Market Forecast 2019-2029 (US$m, AGR%, CAGR %, Cumulative)
Table 4.3 Threads in Security Paper Market Forecast 2019-2029 (US$m, AGR%, CAGR %, Cumulative)
Table 5.1 Global Security Paper Market Forecast by Application 2019-2029 (US$m, AGR%, Cumulative)
Table 5.2. Bank Notes and Cheques in Security Paper Market Forecast 2019-2029 (US$m, AGR%, CAGR %, Cumulative)
Table 5.3 Passports in Security Paper Market Forecast 2019-2029 (US$m, AGR%, CAGR %, Cumulative)
Table 5.4 Legal and Government Documents in Security Paper Market Forecast 2019-2029 (US$m, AGR%, CAGR %, Cumulative)
Table 5.5 Stamps in Security Paper Market Forecast 2019-2029 (US$m, AGR%, CAGR %, Cumulative)
Table 5.6 Identity Cards in Security Paper Market Forecast 2019-2029 (US$m, AGR%, CAGR %, Cumulative)
Table 5.7 Certificates and Others in Security Paper Market Forecast 2019-2029 (US$m, AGR%, CAGR %, Cumulative)
Table 6.1 Regional Security Paper Market Forecast 2019-2029 (US$m, AGR%, Cumulative)
Table 6.2 Asia Pacific in Security Paper Market Forecast 2019-2029 (US$m, AGR%, CAGR %, Cumulative)
Table 6.3 Asia Pacific Security Paper Market Forecast 2019-2029 (US$m, AGR%, CAGR %, Cumulative)
Table 6.4 China in Security Paper Market Forecast 2019-2029 (US$m, AGR%, CAGR %, Cumulative)
Table 6.5 India in Security Paper Market Forecast 2019-2029 (US$m, AGR%, CAGR %, Cumulative)
Table 6.6 Japan in Security Paper Market Forecast 2019-2029 (US$m, AGR%, CAGR %, Cumulative)
Table 6.7 Rest of Asia Pacific in Security Paper Market Forecast 2019-2029 (US$m, AGR%, CAGR %, Cumulative)
Table 6.8 North America Security Paper Market Forecast 2019-2029 (US$m, AGR%, CAGR %, Cumulative)
Table 6.9 USA in Security Paper Market Forecast 2019-2029 (US$m, AGR%, CAGR %, Cumulative)
Table 6.10 Canada in Security Paper Market Forecast 2019-2029 (US$m, AGR%, CAGR %, Cumulative)
Table 6.11 Europe Security Paper Market Forecast 2019-2029 (US$m, AGR%, CAGR %, Cumulative)
Table 6.12 Germany in Security Paper Market Forecast 2019-2029 (US$m, AGR%, CAGR %, Cumulative)
Table 6.13 United Kingdom in Security Paper Market Forecast 2019-2029 (US$m, AGR%, CAGR %, Cumulative)
Table 6.14 France in Security Paper Market Forecast 2019-2029 (US$m, AGR%, CAGR %, Cumulative)
Table 6.15 Russia in Security Paper Market Forecast 2019-2029 (US$m, AGR%, CAGR %, Cumulative)
Table 6.16 Rest of Europe in Security Paper Market Forecast 2019-2029 (US$m, AGR%, CAGR %, Cumulative)
Table 6.17 Latin America Security Paper Market Forecast 2019-2029 (US$m, AGR%, CAGR %, Cumulative)
Table 6.18 Brazil in Security Paper Market Forecast 2019-2029 (US$m, AGR%, CAGR %, Cumulative)
Table 6.19 Argentina in Security Paper Market Forecast 2019-2029 (US$m, AGR%, CAGR %, Cumulative)
Table 6.20 Mexico in Security Paper Market Forecast 2019-2029 (US$m, AGR%, CAGR %, Cumulative)
Table 6.21 Rest of Latin America in Security Paper Market Forecast 2019-2029 (US$m, AGR%, CAGR %, Cumulative)
Table 6.22 Middle East and Africa Security Paper Market Forecast 2019-2029 (US$m, AGR%, CAGR %, Cumulative)
Table 6.23 UAE in Security Paper Market Forecast 2019-2029 (US$m, AGR%, CAGR %, Cumulative)
Table 6.24 Saudi Arabia in Security Paper Market Forecast 2019-2029 (US$m, AGR%, CAGR %, Cumulative)
Table 6.25 South Africa in Security Paper Market Forecast 2019-2029 (US$m, AGR%, CAGR %, Cumulative)
Table 6.26 Rest of the MEA in Security Paper Market Forecast 2019-2029 (US$m, AGR%, CAGR %, Cumulative)
Table 7.1 Global Security Paper Market SWOT Analysis 2019-2029
Table 8.1 Leading Security Paper Market Companies 2019
Table 8.2 China Banknote Printing and Minting Corporation (CBPM) Profile 2019 (CEO, Parent Company Sales US$m, Business Segment in the Market, HQ, Founded, No. of Employees, Website)
Table 8.3 Selected Recent China Banknote Printing and Minting Corporation (CBPM) Security Paper Market Developments 2016-2018 (Date, Strategy, Details)
Table 8.4 China Banknote Printing and Minting Corporation SWOT Analysis 2018
Table 8.5 De La Rue Plc Profile 2019 (CEO, Parent Company Sales US$m, Business Segment in the Market, HQ, Founded, No. of Employees, Website)
Table 8.6 Selected Recent De La Rue Plc Security Paper Market Developments 2017-2019 (Date, Strategy, Details)
Table 8.7 De La Rue Plc Sales 2014-2018 (US$m, AGR %)
Table 8.8 De La Rue Plc Net Income 2013-2017 (US$m)
Table 8.9 De La Rue Plc Key Financial Ratios 2017
Table 8.10 De La Rue Plc SWOT Analysis 2018
Table 8.11 Document Security Systems Company Profile 2019 (CEO, Parent Company Sales US$m, Business Segment in the Market, HQ, Founded, No. of Employees, Website)
Table 8.12 Selected Document Security Systems Company Active, Smart and Intelligent Packaging Market Developments 2017-2019 (Date, Strategy, Details)
Table 8.13 Document Security Systems Sales 2014-2018 (US$m, AGR %)
Table 8.14 Document Security Systems Net Income 2013-2017 (US$m)
Table 8.15 Document Security Systems: Key Financial Ratios 2018
Table 8.16 Document Security Systems SWOT Analysis 2018
Table 8.17 Drewsen Special Papers GmbH & Co. Kg Profile 2019 (CEO, Parent Company Sales US$m, Industry Group in the Market, HQ)
Table 8.18 Selected Recent Tetra Laval Active, Smart and Intelligent Packaging Market Developments 2016-2018 (Date, Strategy, Details)
Table 8.19 Drewsen Special Papers SWOT Analysis 2018
Table 8.20 Fedrigoni Group Profile 2019 (CEO, Parent Company Sales US$m, Net Income, Business Segment in the Market, HQ, Founded, Website)
Table 8.21 Fedrigoni Group Key Developments (Date, Strategy, Details)
Table 8.22 Fedrigoni Group Sales 2013-2017 (US$m, AGR %)
Table 8.23 Fedrigoni Group Net Income 2013-2017 (US$m, AGR %)
Table 8.24 Febrigoni Group SWOT Analysis 2018
Table 8.25 Giesecke+Devrient Profile 2019 (CEO, Parent Company Sales US$m, Net Income, Business Segment in the Market, HQ, Founded, Website)
Table 8.26 Giesecke+Devrient Key Developments 2014-2018 (Date, Strategy, Details)
Table 8.27 Giesecke+Devrient Sales 2014-2017 (US$m, AGR %)
Table 8.28 Giesecke+Devrient Net Income 2014-2017 (US$m, AGR %)
Table 8.29 Giesecke+Devrient: Key Financial Ratios 2017
Table 8.30 Giesecke+Devrient SWOT Analysis 2018
Table 8.31 Goznak Profile 2019 (CEO, Parent Company Sales US$m, Business Segment in the Market, HQ, Founded, No. of Employees, Website)
Table 8.32 Selected Goznak Security Paper Market Developments 2016-2017 (Date, Strategy, Details)
Table 8.33 Goznak Sales 2013-2017 (US$m, AGR %)
Table 8.34 Goznak Net Income 2013-2017 (US$m)
Table 8.35 Goznak: Key Financial Ratios 2017
Table 8.36 Goznak SWOT Analysis 2018
Table 8.37 Real Casa De La Moneda (FNMT-RCM) Profile 2019 (CEO, Parent Company Sales US$m, Net Income, HQ, Founded, No. of Employees, Website)
Table 8.38 Real Casa De La Moneda (FNMT-RCM) Key Developments 2017-2018 (Date, Strategy, Details)
Table 8.39 Real Casa De La Moneda (FNMT-RCM) Sales 2013-2017 (US$m, AGR %)
Table 8.40 Real Casa De La Moneda (FNMT-RCM) Net Income 2013-2017 (US$m, AGR %)
Table 8.41 Real Casa De La Moneda (FNMT-RCM): Key Financial Ratios 2017
Table 8.42 Real Casa De La Moneda (FNMT-RCM) SWOT Analysis 2018
Table 8.43 Security Papers Ltd. Profile 2019 (CEO, Parent Company Sales US$m, Business Segment in the Market, HQ, Founded, No. of Employees, Website)
Table 8.44 Selected Recent Security Papers Ltd. Security Paper Market Developments 2015-2018 (Date, Strategy, Details)
Table 8.45 Security Papers Ltd. Sales 2013-2017 (US$m, AGR %)
Table 8.46 Security Papers Ltd. Net Income 2013-2017 (US$m, AGR %)
Table 8.47 Security Papers Ltd.: Key Financial Ratios 2017
Table 8.48 Security Papers Ltd. SWOT Analysis 2018
Table 8.49 SPMCIL Company Profile 2019 (CEO, Parent Company Sales US$m, Net Income, Business Segment in the Market, HQ, Founded, No. of employees, Website)
Table 8.50 SPMCIL Company Key Strategies (Date, Strategy, Details)
Table 8.51 SPMCIL Company Sales 2013-2017 (US$m, AGR %)
Table 8.52 SPMCIL Company Net Income / Loss 2013-2017 (US$m)
Table 8.53 SPMCIL: Key Financial Ratios 2017
Table 8.54 SPMCIL SWOT Analysis 2018
Table 8.55 Other Leading Companies in the Market
Any Security Printing Company PLC
Bain Capital Private Equity
Banner Plasticard, Inc.
Bundesdruckerei GmbH
Canadian Bank Note Company, Limited
Cetis D.D
China Banknote Printing and Minting Corporation (CBPM)
Ciotola SRL
Crane Co.
De La Rue PLC
Dipa ZRT.
Document Security Systems
Drewsen Spezialpapiere GmbH & Co. Kg
DSS Asia Ltd.
E-Kart Elektronik Kart Sistemleri Sanayi ve Ticaret A.S.
EPL House
Fedrigoni Group
G+D Currency Technology
Gemalto Oy
Gemini Graphics Pvt. Ltd.
Giesecke+Devrient
Goznak
Guangzhou HotApp Technology Ltd.
HG Technology SDN BHD.
Innovia
Louisenthal
MDM (Münzhandelsgesellschaft mbH & Co. KG Deutsche Münze)
Pakistan Security Printing Corporation (PSPC)
Polish Security Printing Works S.A.
Pura Group
Real Casa De La Moneda (FNMT-RCM)
Security Paper Limited
Security Paper Mill, Inc.
Security Printing and Minting Corporation of India Limited (SPMCIL)
Shandong Hirun Paper Co., Ltd
Simpson Security Papers
Uganda Security Printing Company (USPC)
Veridos
List of Other Organisations Mentioned in this Report
Bank of Canada
Bank of England
Bank of Mexico
Bharatiya Reserve Bank Note Mudran
Bocconi University
Central Bank of Egypt
Central Bank of the UAE
Central Office for the Suppression of Counterfeiting (OCFRM)
China Banknote Printing and Minting Corporation
Deutsche Bundesbank
Economic Cooperation Organisation (ECO)
European Union (EU)
Federal Reserve Bank of San Francisco
Government of India
Government of Uganda
Nepal Rashtra Bank
Ohio Department of Public Safety
Regional Cooperation for Development (RCD)
Reserve Bank of India
Security Paper and Minting Corporation of India
Security Printing & Minting Corporation of India Limited (SPMCIL)
The Office for National Statistics
The Royal Mint of Spain
Uganda Printing and Publishing Corporation (UPPC)
United Nations World Tourism Organisation (UNWTO)
World Health Organisation (WHO)
Download sample pages
Complete the form below to download your free sample pages for Security Paper Market Report 2019-2029
Related reports
-

Recycled Packaging Materials Market Report 2019-2029
The latest report from business intelligence provider, Visiongain offers a comprehensive analysis of the global Recycled Packaging Materials market. Visiongain...Full DetailsPublished: 29 March 2019 -

Post-Consumer Recycled Plastic Market Report 2019-2029
With global, national/regional, and submarket estimates for the Post-Consumer Recycled Plastics Market, this report covers key aspects of this market....
Full DetailsPublished: 22 March 2019 -

Returnable Packaging Market Report 2019-2029
With an incredible amount of attention devoted to the returnable packaging market, deriving market prospects and opportunities can be difficult....Full DetailsPublished: 13 June 2019 -

Tobacco Packaging Market Report 2018-2028
The global tobacco packaging market is expected to reach $14.9bn in 2018 and develop dynamically over the forecast period, driven...Full DetailsPublished: 10 October 2018 -

Flexible (Converted) Plastic Packaging Market Report 2019-2029
Visiongain’s new 235-page report assesses that the global flexible (converted) plastic packaging market will reach $204.89 billion in 2019. ...Full DetailsPublished: 14 November 2018 -

Active, Smart and Intelligent Packaging Market Report 2019-2029
With an incredible amount of attention devoted to active, smart and intelligent packaging market, deriving market prospects and opportunities can...Full DetailsPublished: 14 January 2019 -

Pharmaceutical Packaging Market Report 2018-2028
Visiongain’s definitive new report assesses that the pharmaceutical packaging market will exceed $94bn in 2018. ...Full DetailsPublished: 09 October 2018 -

Phase Change Materials Market Report 2019-2029
The USD 283 million Phase Change Materials Market is expected to flourish in the next few years because of several...
Full DetailsPublished: 01 May 2019
Download sample pages
Complete the form below to download your free sample pages for Security Paper Market Report 2019-2029
Do you have any custom requirements we can help you with?
Any specific country, geo region, market segment or specific company information?
Email us today, we can discuss your needs and see how we can help: jamie.roberts@visiongain.com
Would you like a free report overview of the report of your choice?
If so, please drop an email to Jamie Roberts stating your chosen report title to jamie.robertsvisiongain.com
Visiongain packaging related reports are compiled using a broad and rich mixture of both primary and secondary information to produce an overall industry outlook. In order to provide our clients with the best product possible product, visiongain analysts reach out to market-leading vendors and industry experts but also review a wealth of financial data and product information from a vast range of sources. To find out more about our reports methodology, please email jamie.roberts@visiongain.com
Would you like to get the latest Visiongain packaging reports catalogue?
What are the dynamic growth sectors? where are the regional business opportunities?
Which technologies will prevail and who are the leading companies succeeding in these sectors and why?
If you want definitive answers to business critical questions, discover Visiongain’s full range of business intelligence reports.
If so, please email Jamie Roberts on jamie.roberts@visiongain.com or call her today on +44 207 336 6100
Adhesive & Sealant Council
Alliance of Foam Packaging Recyclers
American Bakers Association
American Chemistry Council
American Forest & Paper Association
American Frozen Food Institute
American Institute of Food Distributors
American Iron and Steel Institute
American Management Association
American National Standards Institute
American Plastics Council (APC)
American Society for Testing and Materials
Association for Suppliers of Printing, Publishing
AICC, The Independent Packaging Association
Association of Industrial Metallizers, Coaters and Laminators (AIMCAL)
Automated Identification Manufacturer
Automated Imaging Association
Can Manufacturers Institute
Chocolate Manufacturers Association of the U.S.A.
Consumer Healthcare Products Association
Contract Manufacturing and Packaging Association
Converting Equipment Manufacturers Association
Corrugated Packaging Council
Drug, Chemical & Allied Trade Association
Envelope Manufacturers Association
Fibre Box Association
Flexible Packaging Association
Flexographic Technical AssociationFlexographic Technical Association
Foil Stamping and Embossing Association
Food and Drug Law Institute
Food Institute
Food Marketing Institute
Food Processing Machinery & Supplies Association
Foodservice & Packaging Institute
Glass Packaging Institute
Graphic Arts Technical Foundation
Gravure Association of America
Grocery Manufacturers of America
Healthcare Compliance Packaging Council
High Definition Flexo Consortium
Institute of Food Technologists
Institute of Packaging Professionals
International Association of Food Industry Suppliers
International Bottled Water Association
International Dairy Foods Association
International Foodservice Manufacturers Association
International Safe Transit Association
Label Printing Industries of America
Material Handling Industry of America
National Association of Container Distributors
National Association of Manufacturers
National Chicken Council
National Coil Coating Association
National Confectioners Association of the U.S.A.
National Freight Claim & Security
National Institute of Packaging, Handling & Logistics Engineers
National Paper Trade Association
National Wooden Pallet & Container
Open Modular Architecture Controls (OMAC) Packaging Workgroup
Packaging Association of Canada
Paperboard Packaging Council
Petroleum Packaging Council
Pharmaceutical Research and Manufacturers of America
PMMI: The Association for Packaging and Processing Technologies
Polystyrene Packaging Council
Pressure Sensitive Tape Council
Printing Industries of America
Processing and Packaging Machinery Association (PPMA)
Produce Marketing Association, Inc.
Research & Development Associates for Military Food & Packaging Systems
Robotic Industries Association (RIA)
Snack Food Association
Soap & Detergent Association
Society of Glass and Ceramic Decorators
Society of Manufacturing Engineers
Society of Plastics Engineers (SPE)
Society of the Plastics Industry (SPI)
Steel Recycling Institute
Steel Shipping Containers Institute
Tag and Label Manufacturers Institute
Technical Association of the Pulp & Paper Industry
The Aluminum Association
Transportation Consumer Protection Council
Transportation Loss Prevention & Security Association
Tube Council of North America
Uniform Code Council, Inc.
Western Packaging Association (WPA)
World Packaging Organisation
Latest Packaging news
Visiongain Publishes Caps & Closures Market Report 2024-2034
The global caps & closures market was valued at US$80.8 billion in 2023 and is projected to grow at a CAGR of 9% during the forecast period 2024-2034.
22 February 2024
Visiongain Publishes Flexible (Converted) Plastic Packaging Market Report 2024-2034
The global Flexible (Converted) Plastic Packaging market was valued at US$157.3 billion in 2023 and is projected to grow at a CAGR of 5.4% during the forecast period 2024-2034.
04 January 2024
Visiongain Publishes Beverage Packaging Market Report 2023-2033
The global Beverage Packaging market was valued at US$144.3 billion in 2022 and is projected to grow at a CAGR of 4.6% during the forecast period 2023-2033.
28 September 2023
Visiongain Publishes Cosmetics Packaging Market Report 2023-2033
The global Cosmetics Packaging market is projected to grow at a CAGR of 4.3% by 2033
21 July 2023
