Industries > Aviation > Aerospace Composites Market Report 2018-2028
Aerospace Composites Market Report 2018-2028
Forecasts by Fibre Type (Carbon Fibre, Glass Fibre, Aramid Fibre, Others), by Resin Type (Epoxy, Phenolic, Polyester, Polyimide, Other Resins), by Application (Interior, Exterior), and by Region and Key National Markets, Including the U.S., China, France, and Germany
Aerospace composites represent a key part of the aerospace sector. This is due to the integral role they are currently playing in next-generation aircrafts in both the civil and defence aviation sectors. As a result, the market outlook for this area of the aerospace sector is positive. Visiongain assesses the market to be valued at $19.16bn in 2018 and with continued advancement and sustained market demand, Visiongain has forecasted growth for the aerospace composites market.
Key benefits of purchasing this report
• Learn About the Future Aerospace Composites Industry Outlook– The Aerospace Composites regional market forecasts will confirm and underpin your analysis
• Keep Up to Speed with Aerospace Composites submarkets– Find three sets of submarkets forecast
• Be Informed About Aerospace Composites– Read Visiongain’s analysis of the Aerospace Composites market
• Save Time Researching– See the market landscape with profiles of the leading companies
• Reinforce Your Business Case for Aerospace Composites– Substantiate your research proposal with our regional forecasts for Asia-Pacific, North America, Europe, and Rest of The World
• Enhance Your Aerospace Composites Presentations– Find 205 tables & charts that you can utilise to illustrate your point in your Aerospace Composites investment proposal.
Segmentation (all from 2018-2028) in terms of value and volume:
• By Fibre Type:
• Carbon Fibre
• Glass Fibre
• Aramid Fibre
• Others
• By Resin Type:
• Epoxy
• Phenolic
• Polyester
• Polyimide
• Other Resins
• By Application:
• Interior
• Exterior
Regional segmentation (all from 2018-2028):
• North America
• US
• Canada
• Mexico
• Asia-Pacific
• China
• Japan
• Singapore
• Malaysia
• Rest of Asia-Pacific
• Europe
• France
• Germany
• Italy
• The UK
• Austria
• Rest of Europe
• Rest of the World
• Latin America
• Middle East
• Africa
• Other Countries
With 205 tables and charts, Visiongain’s Aerospace Composites Market Report 2018-2028: Forecasts by Fibre Type (Carbon Fibre, Glass Fibre, Aramid Fibre, Others), by Resin Type (Epoxy, Phenolic, Polyester, Polyimide, Other Resins), by Application (Interior, Exterior), and by Region and Key National Markets, Including the U.S., China, France, and Germany will be of use to those involved in this market.
Visiongain is a trading partner with the US Federal Government
CCR Ref number: KD4R6
1. Report Overview
1.1 Global Aerospace Composites Market Overview
1.2 Global Aerospace Composites Market Segmentation
1.3 Why You Should Read This Report
1.4 How This Report Delivers
1.5 Key Questions Answered by This Analytical Report Include:
1.6 Who is This Report For?
1.7 Methodology
1.7.1 Secondary Research
1.7.2 Market Evaluation & Forecasting Methodology
1.8 Frequently Asked Questions (FAQ)
1.9 Associated Visiongain Reports
1.10 About Visiongain
2. Summary
2.1 Introduction
2.2 Market Insight
2.2.1 Emerging Economies Will Offer Lucrative Growth in the Aerospace Composites Market
2.2.2 Epoxy segment Will Continue to Dominate the Global Aerospace Composites Market
2.2.3 North America To Grow at The Fastest CAGR till 2028 in the Global Aerospace Composites Market
2.2.4 Use of Composites in the Exterior of Aircrafts Will Expect to Dominate the Market till 2028
2.3 Introduction to Aerospace Composites Technology
2.3.1 Prepreg and Autoclave Cure
2.3.2 Automated Fibre Placement and Automated Tape Laying
2.3.3 Out of Autoclave Processing
2.4 Composite Usage in Aerospace Applications
2.4.1 Commercial Aerospace
2.4.2 Military Aerospace
3. Global Aerospace Composites Market Overview
3.1 Global Aerospace Composites Market Forecast 2018-2028
3.2 Global Aerospace Composites Drivers & Restraints 2018
3.3 Global Aerospace Composites Market Segmentation
3.3.1 Aerospace Composite Market by Fibre Type
3.3.2 Aerospace Composite Market by Resin Type
3.3.3 Aerospace Composite Market by Application
3.3.4 Aerospace Composite Market by Region
4. Global Aerospace Composites by Fibre Type 2018-2028
4.1 Summary
4.2 Introduction
4.3 Carbon Fibre Market Forecast 2018-2028
4.4 Glass Fibre Market Forecast 2018-2028
4.5 Aramid Fibre Market Forecast 2018-2028
4.6 Others Market Forecast 2018-2028
5. Global Aerospace Composites by Resin Type 2018-2028
5.1 Summary
5.2 Introduction
5.3 Epoxy Market Forecast 2018-2028
5.4 Phenolic Market Forecast 2018-2028
5.5 Polyester Market Forecast 2018-2028
5.6 Polyimide Market Forecast 2018-2028
5.7 Thermoplastic Market Forecast 2018-2028
5.8 Other Resins Market Forecast 2018-2028
6. Global Aerospace Composites Market by Application 2018-2028
6.1 Summary
6.2 Introduction
6.3 Exterior Application Market Forecast 2018-2028
6.4 Interior Application Market Forecast 2018-2028
7. Aerospace Composites Market by Geographical Analysis 2018-2028
7.1 Summary
7.2 Introduction
7.3 North America Aerospace Composites Market Forecast 2018-2028
7.3.1 The U.S. Aerospace Composites Market Forecast 2018-2028
7.3.2 Canada Aerospace Composites Market Forecast 2018-2028
7.3.3 Mexico Aerospace Composites Market Forecast 2018-2028
7.3.4 North American Aerospace Composites Market Select Contracts & Programmes 2015-2018
7.4 Asia-Pacific Aerospace Composites Market Forecast 2018-2028
7.4.1 China Aerospace Composites Market Forecast 2018-2028
7.4.2 Japan Aerospace Composites Market Forecast 2018-2028
7.4.3 Singapore Aerospace Composites Market Forecast 2018-2028
7.4.4 Malaysia Aerospace Composites Market Forecast 2018-2028
7.4.5 Rest of Asia-Pacific Aerospace Composites Market Forecast 2018-2028
7.4.6 Asia Pacific Aerospace Composites Market Select Contracts & Programmes 2014-2018
7.5 Europe Aerospace Composites Market Forecast 2018-2028
7.5.1 France Aerospace Composites Market Forecast 2018-2028
7.5.2 Germany Aerospace Composites Market Forecast 2018-2028
7.5.3 Italy Aerospace Composites Market Forecast 2018-2028
7.5.4 The U.K. Aerospace Composites Market Forecast 2018-2028
7.5.5 Austria Aerospace Composites Market Forecast 2018-2028
7.5.6 Rest of Europe Aerospace Composites Market Forecast 2018-2028
7.5.7 European Aerospace Composites Market Select Contracts & Programmes 2015-2018
7.6 Rest of the World Aerospace Composites Market Forecast 2018-2028
7.6.1 Latin America Aerospace Composites Market Forecast 2018-2028
7.6.2 Middle East Aerospace Composites Market Forecast 2018-2028
7.6.3 Africa Aerospace Composites Market Forecast 2018-2028
7.6.4 Other Countries Aerospace Composites Market Forecast 2018-2028
7.6.5 Rest of the World Aerospace Composites Market Select Contracts & Programmes 2014-2018
8. SWOT Analysis of the Aerospace Composites Market 2018-2028
9. Leading Aerospace Composites Companies 2018-2028
9.1 Celanese Corporation
9.1.1 Introduction
9.1.2 Financial Performance of Celanese Corporation
9.1.3 Extensive Portfolio of Materials for Aerospace Applications
9.1.4 Celanese Corporation Aerospace Composites Market Selected Recent Contracts / Projects / Programmes 2012-2018
9.1.5 Celanese Corporation Future Outlook
9.1.6 Celanese Corporation Performance Analysis
9.2 Toray Industries, Inc.
9.2.1 Introduction
9.2.2 Financial Performance of Toray Industries, Inc.
9.2.3 Toray Industries, Inc. Future Outlook
9.2.4 Toray Industries, Inc. Selected Recent Contracts / Projects / Programmes 2012-2016
9.2.5 Toray Industries, Inc. and Carbon Fibre Composite Materials
9.2.6 Toray Industries, Inc. Performance Analysis
9.3 Gurit Holding AG
9.3.1 Introduction
9.3.2 Financial Performance of Gurit Holding AG
9.3.3 Gurit Holding AG Aerospace Composites Market Selected Recent Contracts / Projects / Programmes 2012-2014
9.3.4 Gurit Holding AG Future Outlook
9.3.5 Prepreg Focus for Aerospace
9.3.6 Gurit Holding AG Performance Analysis
9.4 GKN Aerospace
9.4.1 Introduction
9.4.2 Financial Performance of GKN Aerospace
9.4.3 GKN Aerospace Composites Market Selected Recent Contracts / Projects / Programmes 2013-2018
9.4.4 GKN Aerospace Future Outlook
9.4.5 GKN Aerospace Company Highlights
9.4.6 GKN Aerospace Performance Analysis
9.5 Hexcel Corporation
9.5.1 Introduction
9.5.2 Financial Performance of Hexcel Corporation
9.5.3 Hexcel Corporation Aerospace Composites Market Selected Recent Contracts / Projects / Programmes 2012-2018
9.5.4 Hexcel Corporation Future Outlook
9.5.5 Key Aerospace Programmes Are Helping to Drive Growth
9.5.6 Hexcel Corporation Performance Analysis
9.6 Huntsman Corporation
9.6.1 Introduction
9.6.2 Financial Performance of Huntsman Corporation
9.6.3 Huntsman Corporation Aerospace Composites Market Selected Recent Contracts / Projects / Programmes 2011-2018
9.6.4 Huntsman Corporation Future Outlook
9.6.5 Huntsman Corporation and the Aerospace Market
9.6.6 Huntsman Corporation Performance Analysis
9.7 Senior Plc
9.7.1 Introduction
9.7.2 Financial Performance of Senior Plc
9.7.3 Senior Plc Aerospace Composites Market Selected Recent Contracts / Projects / Programmes 2014-2018
9.7.4 Senior Plc Future Outlook
9.7.5 Senior Plc Activities in Aerospace Composites
9.7.6 Senior Plc Performance Analysis
9.8 Spirit AeroSystems Holdings Inc
9.8.1 Introduction
9.8.2 Financial Performance of Spirit AeroSystems Holdings Inc
9.8.3 Spirit AeroSystems Holdings Inc Selected Recent Contracts / Projects / Programmes 2012-2018
9.8.4 Spirit AeroSystems Holdings Inc Future Outlook
9.8.5 Spirit AeroSystems and Composite Structures
9.8.6 Spirit AeroSystems Holdings Inc Performance Analysis
9.9 Solvay SA
9.9.1 Introduction
9.9.2 Financial Performance of Solvay SA
9.9.3 Solvay SA Aerospace Composites Market Selected Recent Contracts / Projects / Programmes 2012-2018
9.9.4 Solvay Future Outlook
9.9.5 Acquisition of Cytec Industries
9.9.6 Solvay SA Performance Analysis
9.10 Teijin Ltd
9.10.1 Introduction
9.10.2 Financial Performance of Teijin Ltd
9.10.3 Teijin Ltd Aerospace Composites Market Selected Recent Contracts / Projects / Programmes 2012-2018
9.10.4 Toho Tenax and Teijin Innovation
9.10.5 Teijin Ltd Future Outlook
9.10.6 Teijin Ltd Performance Analysis
9.11 Koninklijke TenCate NV
9.11.1 Introduction
9.11.2 Koninklijke TenCate NV Aerospace Composites Market Selected Recent Contracts / Projects / Programmes 2013-2018
9.11.3 Financial Performance of Koninklijke TenCate NV
9.11.4 TenCate Advanced Textiles & Composites
9.11.5 Koninklijke TenCate NV Future Outlook
9.11.6 Koninklijke TenCate NV Performance Analysis
9.12 Other Companies in the Aerospace Composites Market
10. Conclusions
11. Glossary
Associated Visiongain Reports
Visiongain Report Sales Order Form
Appendix A
About Visiongain
Appendix B
Visiongain report evaluation form
List of Figures
Figure 1.1 Global Aerospace Composites Market Segmentation Overview
Figure 2.1 Aerospace Composites Market by Resin 2018 & 2028 (%)
Figure 2.2 Global Aerospace Composites Market Size by Region 2018-2028 (US$ billion)
Figure 2.3 Aerospace Composites Market Size by Application 2018-2028 (USD Billion)
Figure 2.4 Primary Applications of Aerospace Composite Materials
Figure 3.1 Global Aerospace Composites Market Forecast 2018-2028 (US$ Bn, AGR%)
Figure 3.2 Global Aerospace Composites Market Segmentation
Figure 4.1 Global Aerospace Composites Submarket AGR Forecast 2018-2028 (AGR%)
Figure 4.2 Global Aerospace Composites Submarket Forecast 2018-2028 (US$ Bn, AGR%)
Figure 4.3 Global Aerospace Composites Submarket Volume AGR Forecast 2018-2028 (AGR %)
Figure 4.4 Global Aerospace Composites Submarket Volume Forecast 2018-2028 (Kilotons, AGR %)
Figure 4.5 Carbon Fibre Composite Market Forecast 2018-2028 (USD Billion, AGR %)
Figure 4.6 Carbon Fibre Composite Market Value Share 2018 2023, 2028 (%)
Figure 4.7 Glass Fibre Composite Market Value Forecast 2018-2028 (USD Billion, AGR %)
Figure 4.8 Glass Fibre Composite Market Value Share 2018, 2023, 2028 (%)
Figure 4.9 Aramid Fibre Composite Market Value Forecast 2018-2028 (USD Billion, AGR %)
Figure 4.10 Aramid Fibre Composite Market Value Share 2018, 2023, 2028 (%)
Figure 4.11 Others Fibre Composite Market Value Forecast 2018-2028 (USD Billion, AGR %)
Figure 4.12 Others Fibre Composite Market Value Share 2018, 2023, 2028 (%)
Figure 5.1 Global Aerospace Composites Market by Resin Type AGR Forecast 2018-2028 (AGR %)
Figure 5.2 Global Aerospace Composites Market by Resin Type Forecast 2018-2028 (US$ Bn, AGR %)
Figure 5.3 Global Aerospace Composites Resin Type Volume AGR Forecast 2018-2028 (AGR %)
Figure 5.4 Global Aerospace Composites Market by Resin Type Volume Forecast 2018-2028 (Kilotons, AGR %)
Figure 5.5 Epoxy Resin Market Forecast 2018-2028 (USD Billion, AGR %)
Figure 5.6 Epoxy Resin Market Share 2018, 2023, 2028 (%)
Figure 5.7 Phenolic Resin Market Forecast 2018-2028 (USD Billion, AGR %)
Figure 5.8 Phenolic Resin Market Share 2018, 2023, 2028 (%)
Figure 5.9 Polyester Resin Market Forecast 2018-2028 (USD Billion, AGR %)
Figure 5.10 Polyester Resin Market Share 2018, 2023, 2028 (%)
Figure 5.11 Polyimide Resin Market Forecast 2018-2028 (USD Billion, AGR %)
Figure 5.12 Polyimide Resin Market Share 2018, 2023, 2028 (%)
Figure 5.13 Thermoplastic Resin Market Forecast 2018-2028 (USD Billion, AGR %)
Figure 5.14 Thermoplastic Resin Market Share 2018, 2023, 2028 (%)
Figure 5.15 Other Resins Market Forecast 2018-2028 (USD Billion, AGR %)
Figure 5.16 Other Resins Market Share 2018, 2023, 2028 (%)
Figure 6.1 Global Aerospace Composites Market by Application AGR Forecast 2018-2028 (AGR %)
Figure 6.2 Global Aerospace Composites Market by Application Forecast 2018-2028 (US$ Bn, AGR %)
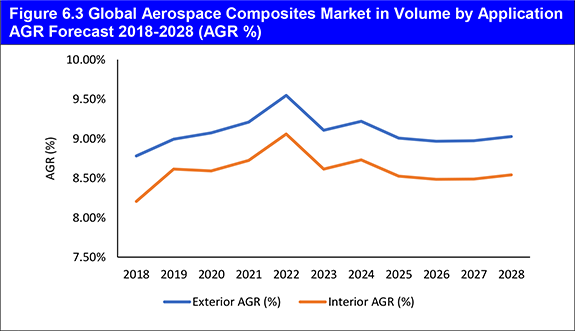
Figure 6.3 Global Aerospace Composites Market in Volume by Application AGR Forecast 2018-2028 (AGR %)
Figure 6.4 Global Aerospace Composites Market in Volume by Application Forecast 2018-2028 (Kilotons, AGR %)
Figure 6.5 Exterior Application Market Forecast 2018-2028 (USD Billion, AGR %)
Figure 6.6 Exterior Application Market Share 2018, 2023, 2028 (%)
Figure 6.7 Interior Application Market Forecast 2018-2028 (USD Billion, AGR %)
Figure 6.8 Interior Application Market Share 2018, 2023, 2028 (%)
Figure 7.1 Global Aerospace Composites Market by Regional Markets AGR Forecast 2018-2028 (AGR %)
Figure 7.2 Global Aerospace Composites Market by Regional Market Volume’s AGR Forecast 2018-2028 (AGR %)
Figure 7.3 North America Aerospace Composites Market by Fibre Type, Volume Share 2018, 2023, 2028 (%)
Figure 7.4 North America Aerospace Composites Market by Fibre Type, Value Share 2018, 2023, 2028 (%)
Figure 7.5 North America Aerospace Composites Market by Resin Type, Volume Share 2018, 2023, 2028 (%)
Figure 7.6 North America Aerospace Composites Market by Resin Type, Value Share 2018, 2023, 2028 (%)
Figure 7.7 North America Aerospace Composites Market by Application, Volume Share 2018, 2023, 2028 (%)
Figure 7.8 North America Aerospace Composites Market by Application, Value Share 2018, 2023, 2028 (%)
Figure 7.9 Aerospace Composites Market in the U.S. 2018-2028 (US$ Bn, AGR %)
Figure 7.10 Aerospace Composites Market in Canada 2018-2028 (US$ bn, AGR %)
Figure 7.11 Aerospace Composites Market in Mexico 2018-2028 (US$ bn, AGR %)
Figure 7.12 Asia-Pacific Aerospace Composites Market by Fibre Type, Volume Share 2018, 2023, 2028 (%)
Figure 7.13 Asia-Pacific Aerospace Composites Market by Fibre Type, Value Share 2018, 2023, 2028 (%)
Figure 7.14 Asia-Pacific Aerospace Composites Market by Resin Type, Volume Share 2018, 2023, 2028 (%)
Figure 7.15 Asia-Pacific Aerospace Composites Market by Resin Type, Value Share 2018, 2023, 2028 (%)
Figure 7.16 Asia-Pacific Aerospace Composites Market by Application, Volume Share 2018, 2023, 2028 (%)
Figure 7.17 Asia-Pacific Aerospace Composites Market by Application, Volume Share 2018, 2023, 2028 (%)
Figure 7.18 Aerospace Composite Market in China 2018-2028
(US$ bn, AGR %)
Figure 7.19 Aerospace Composite Market in Japan 2018-2028 (US$ bn, AGR %)
Figure 7.20 Aerospace Composites Market in Singapore 2018-2028 (US$ Bn, AGR %)
Figure 7.21 Aerospace Composites Market in Malaysia 2018-2028 (US$ bn, AGR %)
Figure 7.22 Aerospace Composite Market in Rest of Asia-Pacific 2018-2028 (US$ bn, AGR %)
Figure 7.23 Europe Aerospace Composites Market by Fibre Type, Volume Share 2018, 2023, 2028 (%)
Figure 7.24 Europe Aerospace Composites Market by Fibre Type, Value Share 2018, 2023, 2028 (%)
Figure 7.25 Europe Aerospace Composites Market by Resin Type, Volume Share 2018, 2023, 2028 (%)
Figure 7.26 Europe Aerospace Composites Market by Resin Type, Value Share 2018, 2023, 2028 (%)
Figure 7.27 Europe Aerospace Composites Market by Application, Volume Share 2018, 2023, 2028 (%)
Figure 7.28 Europe Aerospace Composites Market by Application, Value Share 2018, 2023, 2028 (%)
Figure 7.29 Aerospace Composites Market in France 2018-2028 (US$ bn, AGR %)
Figure 7.30 Aerospace Composites Market in Germany 2018-2028 (US$ bn, AGR %)
Figure 7.31 Aerospace Composites Market in Italy 2018-2028 (US$ bn, AGR %)
Figure 7.32 Aerospace Composites Market in the U.K. 2018-2028 (US$ bn, AGR %)
Figure 7.33 Aerospace Composites Market in Austria 2018-2028 (US$ bn, AGR %)
Figure 7.34 Aerospace Composites Market in Rest of the Europe 2018-2028 (US$ bn, AGR %)
Figure 7.35 Rest of World Aerospace Composites Market by Fibre Type, Volume Share 2018, 2023, 2028 (%)
Figure 7.36 Rest of World Aerospace Composites Market by Fibre Type, Value Share 2018, 2023, 2028 (%)
Figure 7.37 Rest of World Aerospace Composites Market by Resin Type, Volume Share 2018, 2023, 2028 (%)
Figure 7.38 Rest of World Aerospace Composites Market by Resin Type, Value Share 2018, 2023, 2028 (%)
Figure 7.39 Rest of Europe Aerospace Composites Market by Application, Volume Share 2018, 2023, 2028 (%)
Figure 7.40 Rest of Europe Aerospace Composites Market by Application, Value Share 2018, 2023, 2028 (%)
Figure 7.41 Aerospace Composites Market in Latin America 2018-2028 (US$ bn, AGR %)
Figure 7.42 Aerospace Composites Market in the Middle East 2018-2028 (US$ bn, AGR %)
Figure 7.43 Aerospace Composites Market in Africa 2018-2028 (US$ bn, AGR %)
Figure 7.44 Aerospace Composites Market in Other Countries 2018-2028 (US$ bn, AGR %)
Figure 9.1 Celanese Corporation Revenue 2013-2017 (US$ Mn, AGR (%))
Figure 9.2 Celanese Corporation Revenue By Business Segments 2017 (%)
Figure 9.3 Celanese Corporation Revenue By Geography 2017 (%)
Figure 9.4 Toray Industries, Inc. Revenue 2013-2017 (US$ Mn, AGR (%))
Figure 9.5 Toray Industries Revenue By Business Segments 2017 (%)
Figure 9.6 Toray Industries Revenue By Geography 2017 (%)
Figure 9.7 Gurit Holding AG Revenue 2013-2017 (US$ Mn, AGR (%))
Figure 9.8 Gurit Holding AG Revenue By Business Segments 2017 (%)
Figure 9.9 Gurit Holding AG Revenue By Geography 2017 (%)
Figure 9.10 GKN Aerospace Revenue 2013-2017 (US$ Mn, AGR (%))
Figure 9.11 GKN Aerospace Revenue By Business Segments 2017 (%)
Figure 9.12 GKN Aerospace Revenue By Geography 2017 (%)
Figure 9.13 Hexcel Corporation Revenue 2013-2017 (US$ Mn, AGR (%))
Figure 9.14 Hexcel Corporation Revenue By Business Segments 2017 (%)
Figure 9.15 Hexcel Corporation Revenue By Geography 2017 (%)
Figure 9.16 Huntsman Corporation Revenue 2013-2017 (US$ Mn, AGR (%))
Figure 9.17 Huntsman Corporation Revenue By Business Segments 2017 (%)
Figure 9.18 Huntsman Corporation Revenue By Geography 2017 (%)
Figure 9.19 Senior PLC Revenue 2013-2017 (US$ Mn, AGR (%))
Figure 9.20 Senior PLC Revenue By Business Segments 2017 (%)
Figure 9.21 Senior PLC Revenue By Geography 2017 (%)
Figure 9.22 Spirit AeroSystems Revenue 2013-2017 (US$ Mn, AGR (%))
Figure 9.23 Spirit AeroSystems Revenue By Business Segments 2017 (%)
Figure 9.24 Spirit AeroSystems Revenue By Geography 2017 (%)
Figure 9.25 Solvay SA Financial Snapshot
Figure 9.26 Solvay SA Revenue By Business Segments 2017 (%)
Figure 9.27 Solvay SA Revenue By Geography 2017 (%)
Figure 9.28 Teijin Ltd Revenue 2013-2017 (US$ Mn, AGR (%))
Figure 9.29 Teijin Ltd Revenue By Business Segments 2017 (%)
Figure 9.30 Teijin Ltd Revenue By Geography 2017 (%)
Figure 9.31 Koninklijke TenCate NV Revenue 2012-2016 (US$ Mn, AGR (%))
Figure 9.32 Koninklijke TenCate NV Revenue By Business Segments 2016 (%)
Figure 9.33 Koninklijke TenCate NV Revenue By Geography 2016 (%)
List of Tables
Table 1.1 Example Global Aerospace Composites Submarket Value Forecast 2018-2028 (US$ Billion, AGR%, CAGR%, Cumulative)
Table 3.1 Global Aerospace Composites Market Forecast 2018-2028 (US$ Billion, AGR %, CAGR%, Cumulative)
Table 3.2 Global Aerospace Composites Market Drivers & Restraints 2018
Table 4.1 Global Aerospace Composites Submarket Forecast 2018-2028 (US$ Billion, AGR%, CAGR%, Cumulative)
Table 4.2 Global Aerospace Composites Submarket Volume Forecast 2018-2028 (Kilotons, AGR%, CAGR%, Cumulative)
Table 4.3 Carbon Fibre Composite Market Forecast 2018-2028 (USD Billion, AGR %, CAGR %, Cumulative)
Table 4.4 Glass Fibre Composite Market Value Forecast 2018-2028 (USD Billion, AGR %, CAGR %, Cumulative)
Table 4.5 Aramid Fibre Composite Market Value Forecast 2018-2028 (USD Billion, AGR %, CAGR %, Cumulative)
Table 4.6 Others Composite Market Value Forecast 2018-2028 (USD Billion, AGR %, CAGR %, Cumulative)
Table 5.1 Global Aerospace Composites Market by Resin Type Forecast 2018-2028 (US$ Billion, AGR %, CAGR%, Cumulative)
Table 5.2 Global Aerospace Composites Resin Type Volume Forecast 2018-2028 (Kilotons, AGR%, CAGR%, Cumulative)
Table 5.3 Epoxy Resin Market Forecast 2018-2028 (USD Billion, AGR %, CAGR %, Cumulative)
Table 5.4 Phenolic Resin Market Forecast 2018-2028 (USD Billion, AGR %, CAGR %, Cumulative)
Table 5.5 Polyester Resin Market Forecast 2018-2028 (USD Billion, AGR %, CAGR %, Cumulative)
Table 5.6 Polyimide Resin Market Forecast 2018-2028 (USD Billion, AGR %, CAGR %, Cumulative)
Table 5.7 Thermoplastic Resin Market Forecast 2018-2028 (USD Billion, AGR %, CAGR %, Cumulative)
Table 5.8 Other Resins Market Forecast 2018-2028 (USD Billion, AGR %, CAGR %, Cumulative)
Table 6.1 Global Aerospace Composites Market by Application Forecast 2018-2028 (US$ Billion, AGR %, CAGR%, Cumulative)
Table 6.2 Global Aerospace Composites Market in Volume by Application Forecast 2018-2028 (Kilotons, AGR%, CAGR%, Cumulative)
Table 6.3 Global Aerospace Composite for Exterior Application Market Forecast 2018-2028 (USD Billion, AGR %, CAGR %, Cumulative)
Table 6.4 Global Aerospace Composites Market by Interior Application Forecast 2018-2028 (USD Billion, AGR %, CAGR %, Cumulative)
Table 7.1 Global Aerospace Composites Market by Regional Markets Forecast 2018-2028 (US$ Bn, AGR %, CAGR %, Cumulative)
Table 7.2 Global Aerospace Composites Market by Regional Market Volume Forecast 2018-2028 (Kilotons, AGR %, CAGR %, Cumulative)
Table 7.3 North America Aerospace Composites Market by Country Forecast 2018-2028 (US$ Billion, CAGR %, Cumulative)
Table 7.4 North America Aerospace Composites Market by Country Forecast 2018-2028 (Kilotons, CAGR %, Cumulative)
Table 7.5 North America Aerospace Composites Market by Fibre Type Forecast 2018-2028 (US$ Bn, CAGR %, Cumulative)
Table 7.6 North America Aerospace Composites Volume Market by Fibre Type Forecast 2018-2028 (Kilotons, CAGR %, Cumulative)
Table 7.7 North America Aerospace Composites Market by Resin Type Forecast 2018-2028 (US$ Bn, CAGR %, Cumulative)
Table 7.8 North America Aerospace Composites Market by Resin Type Forecast 2018-2028 (Kilotons, CAGR %, Cumulative)
Table 7.9 North America Aerospace Composites Market by Application Forecast 2018-2028 (US$ Bn, CAGR %, Cumulative)
Table 7.10 North America Aerospace Composites Market by Application Forecast 2018-2028 (Kilotons, CAGR %, Cumulative)
Table 7.11 North American Aerospace Composites Market Select Contracts & Programmes 2015-2018 (Date, Company, Value US$ m, Details)
Table 7.12 Asia-Pacific Aerospace Composites Market by Country Forecast 2018-2028 (US$ bn, CAGR %, Cumulative)
Table 7.13 Asia-Pacific Aerospace Composites Volume Market by Country Forecast 2018-2028 (Kilotons, CAGR %, Cumulative)
Table 7.14 Asia-Pacific Aerospace Composites Market by Fibre Type Forecast 2018-2028 (US$ bn, CAGR %, Cumulative)
Table 7.15 Asia-Pacific Aerospace Composites Volume Market by Fibre Type Forecast 2018-2028 (Kilotons, CAGR %, Cumulative)
Table 7.16 Asia-Pacific Aerospace Composites Market by Resin Type Forecast 2018-2028 (US$ bn, CAGR %, Cumulative)
Table 7.17 Asia-Pacific Aerospace Composites Market by Resin Type Forecast 2018-2028 (Kilotons, CAGR %, Cumulative)
Table 7.18 Asia-Pacific Aerospace Composites Market by Application Forecast 2018-2028 (US$ bn, CAGR %, Cumulative)
Table 7.19 Asia-Pacific Aerospace Composites Market by Application Forecast 2018-2028 (Kilotons, CAGR %, Cumulative)
Table 7.20 Asia Pacific Aerospace Composites Market Select Contracts & Programmes 2014-2018 (Date, Company, Value US $m, Details)
Table 7.21 Europe Aerospace Composites Market by Country Forecast 2018-2028 (US$ bn, CAGR %, Cumulative)
Table 7.22 Europe Aerospace Composites Volume Market by Country Forecast 2018-2028 (Kilotons, CAGR %, Cumulative)
Table 7.23 Europe Aerospace Composites Market by Fibre Type Forecast 2018-2028 (US$ bn, CAGR %, Cumulative)
Table 7.24 Europe Aerospace Composites Volume Market by Fibre Type Forecast 2018-2028 (Kilotons, CAGR %, Cumulative)
Table 7.25 Europe Aerospace Composites Market by Resin Type Forecast 2018-2028 (US$ Bn, CAGR %, Cumulative)
Table 7.26 Europe Aerospace Composites Volume Market by Resin Type Forecast 2018-2028 (Kilotons, CAGR %, Cumulative)
Table 7.27 Europe Aerospace Composites Market by Application Forecast 2018-2028 (US$ bn, CAGR %, Cumulative)
Table 7.28 Europe Aerospace Composites Market by Application Forecast 2017-2027 (Kilotons, CAGR %, Cumulative)
Table 7.29 European Aerospace Composites Market Select Contracts & Programmes 2015-2018 (Date, Company, Value US $m, Details)
Table 7.30 Rest of the World Aerospace Composites Market by Country Forecast 2018-2028 (US$ bn, CAGR %, Cumulative)
Table 7.31 Rest of the World Aerospace Composites Volume Market by Country Forecast 2018-2028 (Kilotons, CAGR %, Cumulative)
Table 7.32 Rest of the World Aerospace Composites Market by Fibre Type Forecast 2018-2028 (US$ bn, CAGR %, Cumulative)
Table 7.33 Rest of the World Aerospace Composites Volume Market by Fibre Type Forecast 2018-2028 (Kilotons, CAGR %, Cumulative)
Table 7.34 Rest of the World Aerospace Composites Market by Resin Type Forecast 2018-2028 (US$ bn, CAGR %, Cumulative)
Table 7.35 Rest of the World Aerospace Composites Volume Market by Resin Type Forecast 2018-2028 (Kilotons, CAGR %, Cumulative)
Table 7.36 Rest of the World Aerospace Composites Market by Application Forecast 2018-2028 (US$ bn, CAGR %, Cumulative)
Table 7.37 Rest of the World Aerospace Composites Market by Application Forecast 2018-2028 (Kilotons, CAGR %, Cumulative)
Table 7.38 Rest of the World Aerospace Composites Market Select Contracts & Programs 2014-2018 (Date, Company, Value US $m, Details)
Table 8.1 Global Aerospace Composites Market SWOT Analysis 2018-2028
Table 9.1 Celanese Corporation Company Profile
Table 9.2 Selected Recent Celanese Corporation Aerospace Composites Market Contracts / Projects / Programmes 2012-2018 (Date, Country / Region, Product, Details)
Table 9.3 Toray Industries Company Profile
Table 9.4 Selected Recent Toray Industries, Inc. Contracts / Projects / Programmes 2012-2018 (Date, Country / Region, Product, Details)
Table 9.5 Gurit Holding AG Company Profile
Table 9.6 Selected Recent Gurit Holding AG Aerospace Composites Market Contracts / Projects / Programmes 2012-2014 (Date, Country / Region, Value US $m, Product, Details)
Table 9.7 GKN Aerospace Company Profile
Table 9.8 Selected Recent GKN Aerospace Composites Market Contracts / Projects / Programmes 2013 -2018 (Date, Country / Region, Value US $m, Product, Details)
Table 9.9 Hexcel Corporation Company Profile
Table 9.10 Selected Recent Hexcel Corporation Aerospace Composites Market Contracts / Projects / Programmes 2012-2018 (Date, Country / Region, Value US $m, Product, Details)
Table 9.11 Huntsman Corporation Company Profile
Table 9.12 Selected Recent Huntsman Corporation Aerospace Composites Market Contracts / Projects / Programmes 2012-2018 (Date, Country / Region, Value US $m, Product, Details)
Table 9.13 Senior Plc Company Profile
Table 9.14 Selected Recent Senior Plc Aerospace Composites Market Contracts / Projects / Programmes 2014-2018 (Date, Country / Region, Value US $m, Product, Details)
Table 9.15 Spirit AeroSystems Holdings Inc Company Profile
Table 9.16 Selected Recent Spirit AeroSystems Holdings Inc Aerospace Composites Market Contracts / Projects / Programmes 2012-2018 (Date, Country / Region, Subcontractor, Value US $m, Product, Details)
Table 9.17 Solvay SA Company Profile
Table 9.18 Selected Recent Solvay SA Aerospace Composites Market Contracts / Projects / Programmes 2012-2018 (Date, Country / Region, Value US $m, Product, Details)
Table 9.19 Teijin Ltd Company Profile
Table 9.20 Selected Teijin Ltd Aerospace Composite Market Contracts / Projects / Programmes 2012-2018 (Date, Country / Region, Value US $m, Product, Details)
Table 9.21 Koninklije TenCate NV Ltd Company Profile
Table 9.22 Selected Recent Koninklijke TenCate NV Aerospace Composites Market Contracts / Projects / Programmes 2013-2018 (Date, Country / Region, Product, Details)
Table 9.23 Other Companies in the Aerospace Composites Market 2018 (Company, Product / Service)
3A Composites
Accudyne Systems Inc
Aernnova
Aerospace Composites Malaysia Sdn. Bhd. (ACM)
AGC AeroComposites Yeovil
AgustaWestland
Air Cargo Containers LLC
AirAsia
Airbus
Amphenol Pcd
Arevo Labs
ASL Airlines France
ATR
Azul Brazilian Airlines
Bell Helicopter
BGF Industries Inc
Boeing
Bombardier
Carbon Conversions Incorporated (CCI)
Celanese Corporation
Celanese Japan Ltd
Cessna Aircraft Company
CFM International
China Airlines
Composites Horizons LLC
Continental Structural Plastics
Cool Polymers Inc.
Coriolis Composites
Cytec Industries
DAHER
Dassault Aviation
Embraer
Eurocopter UK
European Carbon Fiber GmbH (ECF)
Faserinstitut Bremen eV
Fiberline Composites
Fokker Aerostructures
Formax UK Limited
GE Aviation
Geelong Composite Project
General Atomics Aeronautical Systems, Inc.
General Dynamics European Land Systems
General Dynamics UK
GKN Aerospace
GSE Industria Aeronautica srl
Gulfstream Aerospace Corporation
Gurit Holding AG
Hainan Airlines
Hexcel Corporation
Hindustan Technical Fabrics Ltd
Huntsman Corporation
Icon Polymer Group Ltd
Israel Aerospace Industries
Kaman Aerospace
Koninklijke TenCate NV
Lion Air
MACRO Industries
Marenco Swisshelicopter AG
Mitsubishi Heavy Industries, Ltd.
Mitsubishi Rayon
Northrop Grumman Corporation
Omni Plastics
OPM Aerospace & Industrial
Orbital ATK
Owens Corning
Oxford Performance Materials, Inc
Pacific American Corporation
Performance Polymer Solutions
Polynt
PolyOne Corporation
Polystrand
PPG Industries
Pratt & Whitney
Quantum Composites
Quickstep Holdings Ltd
Reichhold
RIBA Composites Srl
Rolls Royce Holdings PLC
RTP Company
Safran Group
Senior PLC
Setsunakasei Co Ltd
SGL Group
Sheets Manufacturing Inc
Sierra Nevada Corporation
Sigma Aeronautics Ltd.
Sikorsky Aircraft Corporation
SO.F.TER.
Solvay Group
Spintech Ventures
Spirit AeroSystems Holdings Inc
Steico Industries Inc
Strata Manufacturing PJSC
Structil
Taikoo Spirit AeroSystems (Jinjiang) Composite Co Ltd
Technifab Inc
Teijin Ltd
TenCate Advanced Composites
Thackersey Group
The Gill Corporation
Ticona Engineering Polymers
TIGHITCO, Inc
Toho Tenax
Toray Industries Inc
Toyota Motor Corporation
Triumph Group Inc
UK Composite Centre
Upeca Technologies
UTC Aerospace Systems
Victrex Plc
Vinnova
Web Industries
Wipro Enterprises
Zodiac Aerospace
Zoltek
Other Organisations Mentioned in the Report
Arabian Gulf Cooperation Council (AGCC)
Association of the United States Army (AUSA)
Durham University
Royal Australian Air Force (RAAF)
Southern Research Institute
State University of Campinas (Unicamp)
The Italian Aerospace Research Centre (CIRA)
The UK Government
UK’s Aerospace Technology Institute (ATI)
UK Ministry of Defence (MoD)
US Air Force (USAF)
US Department of Energy
Download sample pages
Complete the form below to download your free sample pages for Aerospace Composites Market Report 2018-2028
Related reports
-

Petroleum Resins Market Report 2017-2027
Visiongain’s new 168 page market intelligence report assesses that the global Petroleum Resins market will reach $1.96 billion in 2017....Full DetailsPublished: 10 February 2017 -

Military Aircraft Maintenance, Repair & Overhaul (MRO) Market Report 2019-2029
Maintenance, Repair and Overhaul capabilities are a key part of the defence sector and play an especially crucial role for...Full DetailsPublished: 07 November 2018 -

Carbon Fibre Reinforced Plastic (CFRP) Composites Market Report 2018-2028
With this definitive 204-page report you will receive a highly granular market analysis segmented by region, by application and by...Full DetailsPublished: 13 September 2018 -

Aerospace Adhesives and Sealants Market 2017-2027
The latest report from business intelligence provider Visiongain offers comprehensive analysis of the global aerospace adhesives and sealants market. Visiongain...
Full DetailsPublished: 07 November 2017 -

Commercial Aviation Sensors & Switches Market Report 2018-2028
The introduction of connected aircraft in the aerospace industry has led Visiongain to publish this timely report. The $685m commercial...
Full DetailsPublished: 01 June 2018 -

Automotive Lightweight Materials Market 2017-2027
Visiongain’s new 221 pages report assesses that the Automotive Lightweight Materials market will reach $78.6 billion in 2017....Full DetailsPublished: 25 April 2017 -

Aviation Cyber Security Market Report 2018-2028
The global aviation cyber security market will reach $2,691m in 2018.
...Full DetailsPublished: 25 September 2018 -

Connected Aircraft Market Report 2018-2028
Industry professionals: cut through media hype and exaggeration by reading an objective dispassionate Visiongain report on the connected aircraft market....
Full DetailsPublished: 22 May 2018 -

Commercial Aircraft Modernization, Upgrade and Retrofit Market Report 2018-2028
This brand new report on the commercial aircraft Modernisation upgrade and retrofit market features market sizing, forecasts and detailed contract...
Full DetailsPublished: 12 April 2018 -

Unmanned Cargo Aircraft (UCA) Systems Market Report 2019-2029
The latest report from business intelligence provider Visiongain offers comprehensive analysis of the global unmanned cargo aircraft market. Visiongain assesses...
Full DetailsPublished: 26 October 2018
Download sample pages
Complete the form below to download your free sample pages for Aerospace Composites Market Report 2018-2028
Do you have any custom requirements we can help you with?
Any specific country, geo region, market segment or specific company information?
Email us today, we can discuss your needs and see how we can help: jamie.roberts@visiongain.com
Visiongain aviation reports are compiled using a broad and rich mixture of both primary and secondary information to produce an overall industry outlook. In order to provide our clients with the best product possible product, we do not rely on any one single source of information. Visiongain analysts reach out to market-leading vendors and automotive industry experts but also review a wealth of financial data and product information from a vast range of sources. To find out more about our reports methodology please email jamie.roberts@visiongain.com
Would you like a free report overview of the report of your choice?
If so, please drop an email to Jamie Roberts stating your chosen report title to jamie.roberts@visiongain.com
Would you like to get the latest Visiongain aviation reports catalogue?
What are the dynamic growth sectors? where are the regional business opportunities?
Which technologies will prevail and who are the leading companies succeeding in these sectors and why?
If you want definitive answers to business critical questions, discover Visiongain’s full range of business intelligence reports.
If so, please email Jamie Roberts on jamie.roberts@visiongain.com or call her today on +44 207 336 6100
Airline Passenger Experience Association (APEX)
Airlines for America
Airport Consultants Council (ACC)
Airports Council International (ACI)
Airports Council International-North America
American Association of Airport Executives
Arab Air Carriers Organization (AACO)
European Aerospace Cluster Partnership
Global Business Travel Association (GBTA)
International Air Transport Association (IATA)
Security Industry Association (SIA)
Security Manufacturers Coalition
Women in Aviation
World Aviation Services
Latest Aviation news
Visiongain Publishes Space-Based Laser Communication Market Report 2024-2034
The global space-based laser communication market was valued at US$1,558.0 million in 2023 and is projected to grow at a CAGR of 13.6% during the forecast period 2024-2034.
13 March 2024
Visiongain Publishes Smart Airport Technologies Market Report 2024-2034
The global Smart Airport Technologies market was valued at US$9.4 billion in 2023 and is projected to grow at a CAGR of 13.8% during the forecast period 2024-2034.
05 February 2024
Visiongain Publishes Air Traffic Control Training Simulator Market Report 2024-2034
The global air traffic control training simulator market was valued at US$966.0 million in 2023 and is projected to grow at a CAGR of 6.5% during the forecast period 2024-2034.
01 February 2024
Visiongain Publishes Commercial Aircraft Maintenance, Repair & Overhaul (MRO) Market Report 2024-2034
The global commercial aircraft maintenance, repair & overhaul (MRO) market was valued at US$78.5 billion in 2023 and is projected to grow at a CAGR of 5.1% during the forecast period 2024-2034.
30 January 2024
