Visiongain’s new 168 page market intelligence report assesses that the global Petroleum Resins market will reach $1.96 billion in 2017.
Are you involved in the Petroleum Resins Market or need to understand its market dynamics? If so, then you must read this report
It’s vital that you keep your knowledge up to date. You need this report.
Market scope: This brand new report from Visiongain is a completely fresh market assessment of the Petroleum Resins market based upon the latest information. Our new market study contains forecasts, original analysis, company profiles and, most crucially, fresh conclusions. The report gives detailed forecasts and analysis of Petroleum Resins markets by region, application and end-use industry.
The Petroleum Resins Market Report 2017-2027 report responds to your need for definitive market data:
• Where are the Petroleum Resins market opportunities?
– 178 tables, charts, and graphs reveal market data allowing you to target your strategy more effectively
• When will the Petroleum Resins market grow?
– Global, national and Petroleum Resins submarket forecasts and analysis from 2017-2027 illustrate the market progression
• Which Petroleum Resins submarket types will develop from 2017-2027?
– C5 Resins Submarket Forecast 2017-2027
– C9 Resins Submarket Forecast 2017-2027
– Hydrogenated Hydrocarbon Resin Submarket Forecast 2017-2027
– C5/C9 Resins Submarket Forecast 2017-2027
• Which Petroleum Resins submarket applications will grow from 2017-2027?
– Adhesives & Sealants Submarket Forecast 2017-2027
– Printing Inks Submarket Forecast 2017-2027
– Paints & Coatings Submarket Forecast 2017-2027
– Other Petroleum Resins Application Submarket Forecast 2017-2027
• Which Petroleum Resins end-use submarkets will flourish from 2017-2027?
– Building & Construction Submarket Forecast 2017-2027
– Tire Submarket Forecast 2017-2027 Submarket Forecast 2017-2027
– Other Petroleum Industry End-Use Industry
• Where are the regional Petroleum Resins market opportunities from 2017-2027?
Focused regional forecasts and analysis explore the future opportunities:
– U.S. forecast 2017-2027
– Canada forecast 2017-2027
– Brazil forecast 2017-2027
– China forecast 2017-2027
– UK forecast 2017-2027
– France forecast 2017-2027
– Italy forecast 2017-2027
– Spain forecast 2017-2027
– Russia forecast 2017-2027
– Germany forecast 2017-2027
– Japan forecast 2017-2027
– India forecast 2017-2027
– ROW forecast 2017-2027
• What are the factors influencing Petroleum Resins market dynamics?
– SWOT analysis explores the factors.
– Research and development (R&D) strategy
– Supply and demand dynamics
– Advances in product quality
• Who are the leading 10 Petroleum Resins companies?
– We reveal competitive positioning, capabilities, product portfolios, R&D activity, services, focus, strategies, M&A activity, and future outlook.
– Eastman Chemical Company
– ExxonMobil Corporation
– Arakawa Chemical Industries Ltd.
– Total Cray Valley
– Lesco Chemical Limited
– Kolon Industries
– Zeon Corporation
– Neville Chemical Company
– Innova (Tianjin) Chemical Co., Ltd
– Puyang Ruisen Petroleum Resin Co., Ltd.
• Who should read this report?
– Anyone within the Petroleum Resins value chain, including
– Chemical companies
– Building & Construction Industry
– Tire Industry
– R&D specialists
– CEO’s
– COO’s
– CIO’s
– Business development managers
– Marketing managers
– Technologists
– Investors
– Banks
– Government agencies
– Contractors
Get our report today Petroleum Resins Market Report 2017-2027: Forecasts by Type (C5 Resins, C9 Resins, Hydrogenated Hydrocarbon Resin, C5/C9 Resins), by Application (Adhesives & Sealants, Printing Inks, Paints & Coatings), by End-Use Industry (Building & Construction, Tire) and by Regional Market. Avoid missing out – order our report now.
Visiongain is a trading partner with the US Federal Government
CCR Ref number: KD4R6
1. Report Overview
1.1 Global Petroleum Resin Market Overviews
1.2 Global Petroleum Resin Market Segmentation
1.3 Why You Should Read This Report
1.4 How This Report Delivers
1.5 Key Questions Answered by This Analytical Report
1.6 Who is This Report For?
1.7 Petroleum resin Market Definition
1.8 Methodology
1.9 Frequently Asked Questions (FAQ)
1.10 Associated Visiongain Reports
1.11 About Visiongain
2. Introduction to Petroleum Resins
2.1 What Are Petroleum Resins
2.2 Properties Of Petroleum Resins
2.3 Where Are Petroleum Resin Applied?
3. Global Petroleum Resin Market 2017-2027
3.1 How does petroleum Resin Demand Compare To GDP
3.2 The Global Economic Outlook 2017
3.3 The Global Petroleum Resins Forecast 2017-2027
3.3.1 The Global Petroleum Resins Consumption Forecast 2017-2027
3.3.2 The Global Petroleum Resins Value Forecast 2017-2027
3.4 Global Petroleum Resin Market Analysis 2017-2027
3.5 Global Petroleum Resins Drivers and Restraints 2017
3.5.1 How Growth of Emerging Markets Will Stimulate Demand for Petroleum Resin
3.5.2 How Currently Low Oil Prices are Affecting the Market for Petroleum Resins
4. Global Petroleum Resin Market by Application 2017-2027
4.1 Global Outlook for Petroleum Resin applications
4.2 Global Petroleum Resins Applications Consumption Forecasts 2017-2027
4.3 Global Petroleum Resins Applications Value Forecasts 2017-2027
4.4 Global Petroleum Resins Market for Applications Market Share Forecasts
4.5 Petroleum Resins Market for Adhesives & Sealants Application Forecast 2017-2027
4.5.1 Adhesives & Sealants Application Market Analysis 2017-2027
4.6 Petroleum Resin Market for Printing Inks Application Forecast 2017-2027
4.6.1 Printing Inks Application Market Analysis 2017-2027
4.7 Petroleum Resins market for Paints & Coatings Application Forecast 2017-2027
4.7.1 Paints & Coatings Application Market Analysis 2017-2027
4.8 Petroleum Resin Market for others Application Forecast 2017-2027
4.8.1 Others Application Market Analysis 2017-2027
5. Global Petroleum Resin Market by End-use Industry 2017-2027
5.1 Global Outlook for Petroleum Resin End-use Industries
5.2 Global Petroleum Resin End-use Industries Consumption Forecasts 2017-2027
5.3 Global Petroleum Resin Applications Value Forecasts 2017-2027
5.4 Global Petroleum Resins Market for Applications Market Share Forecasts
5.5 Petroleum Resins Market for Building & Construction End-use Industry Forecast 2017-2027
5.5.1 Building & Construction End-use Industry Market Analysis 2017-2027
5.6 Petroleum Resins Market for Tire Industry Forecast 2017-2027
5.6.1 Tire Industry Market Analysis 2017-2027
5.7 Petroleum Resin Market for Other Industry Forecast 2017-2027
5.7.1 Other End-use Industry Market Analysis 2017-2027
6. Global Petroleum Resin Market by Types 2017-2027
6.1 Global Outlook for Petroleum Resin types
6.2 Global Petroleum Resins Type Consumption Forecasts 2017-2027
6.3 Global Petroleum Resins Type Value Forecasts 2017-2027
6.4 Global Petroleum Resins Market for Types Market Share Forecasts
6.5 Petroleum Resins Market for C5 Resins Forecast 2017-2027
6.5.1 C5 Resins Type Market Analysis 2017-2027
6.6 Petroleum Resin Market for C9 Resins Forecast 2017-2027
6.6.1 C9 Resins Market Analysis 2017-2027
6.7 Petroleum Resins Market for Hydrogenated Hydrocarbon Resins Forecast 2017-2027
6.7.1 Hydrogenated Hydrocarbon Resins Market Analysis 2017-2027
6.8 Petroleum Resin Market for C5/C9 Type Forecast 2017-2027
6.8.1 C5/C9 Resins Market Analysis 2017-2027
7. Leading National Petroleum Resin Market Forecasts 2017-2027
7.1 An Overview of the Leading National Petroleum Resin Market 2017-2027
7.2 U.S. Petroleum Resin Market Forecast 2017-2027
7.2.1 U.S. Petroleum Resins Market Analysis 2017-2027
7.2.2 U.S. Petroleum Resins Market Outlook
7.2.2.1 Economic and Social Factors
7.3 Canadian Petroleum Resin Market Forecast 2017-2027
7.3.1 Canadian Petroleum Resin Market Analysis 2017-2027
7.3.2 Canadian Petroleum Resin Market Outlook
7.4 Brazilian Petroleum Resins Market Forecast 2017-2027
7.4.1 Brazilian Petroleum Resin Market Analysis 2017-2027
7.4.2 Brazilian Petroleum Resin Market Outlook
7.4.2.1 Economic and Social Factors
7.4.2.2 Growing Middle Class Will Increase the Demand for Petroleum Resin in Tire manufacturing for Automotive Sector
7.4.2.3 Large Investments in Infrastructure Will Drive the Demand for Petroleum Resin
7.5 Chinese Petroleum Resins Market Forecast 2017-2027
7.5.1 Chinese Petroleum Resin Market Analysis 2017-2027
7.5.2 Chinese Petroleum Resin Market Outlook
7.5.2.1 Enormous Potential for Automotive Industry Development in China
7.5.2.2 Building & Construction Industry will be the key driver for Petroleum Resin Market in China
7.6 UK Petroleum Resin Market Forecast 2017-2027
7.6.1 UK Petroleum Resin Market Analysis 2017-2027
7.6.2 UK Petroleum Resin Market Outlook
7.7 French Petroleum Resin Market Forecast 2017-2027
7.7.1 French Petroleum Resin Market Analysis 2017-2027
7.7.2 French Petroleum Resin Market Outlook
7.8 Italian Petroleum Resin Market Forecast 2017-2027
7.8.1 Italian Petroleum Resin Market Analysis 2017-2027
7.8.2 Italian Petroleum Resin Market Outlook
7.9 Spanish Petroleum Resin Market Forecast 2017-2027
7.9.1 Spanish Petroleum Resin Market Analysis 2017-2027
7.9.2 Spanish Petroleum Resin Market Outlook
7.10 Russian Petroleum Resin Market Forecast 2017-2027
7.10.1 Russian Petroleum Resin Market Analysis 2017-2027
7.10.2 Russian Petroleum Resin Market Outlook
7.11 German Petroleum Resin Market Forecast 2016-2026
7.11.1 German Petroleum Resin Market Analysis 2017-2027
7.11.2 German Petroleum Resin Market Outlook
7.11.2.1 German Leadership in the Automotive Industry will Drive The Petroleum Resin Market
7.12 Japanese Petroleum Resin Market Forecast 2017-2027
7.12.1 Japanese Petroleum Resin Market Analysis 2017-2027
7.12.2 Japanese Petroleum Resin Market Outlook
7.13 Indian Petroleum Resin Market Forecast 2017-2027
7.13.1 Indian Petroleum Resin Market Analysis 2017-2027
7.13.2 Indian Petroleum Resin Market Outlook
7.14 ROW Petroleum Resin Market Forecast 2017-2027
7.14.1 ROW Petroleum Resin Market Analysis 2017-2027
7.14.2 ROW Petroleum Resin Market Outlook
8. SWOT Analysis of the Petroleum Resin Market 2017-2027
8.1 SWOT Analysis of the Petroleum Resin Market
8.1.1 Strengths
8.1.1.1 Provides Superior Properties As Compared To Other Resins
8.1.1.2 Long Durability To The Products
8.1.1.3 Growing Demand From Hygiene Industry
8.1.2 Weaknesses
8.1.2.1 High Energy Requirement During The Manufacturing Process
8.1.2.2 Entering Into This Market Is Highly Capital Intensive
8.1.3 Opportunities
8.1.3.1 Growing Infrastructure Activities Into Emerging Economies
8.1.3.2 High Growth In Emerging Markets
8.1.4 Threats
8.1.4.1 Rosin Resins Are Replacing Petroleum Resins
9. Expert Opinion
9.1 Anhui Tongxin Chemical Industry Co.Ltd.
9.1.1 Key Trends
9.1.2 Drivers and Restraints
9.1.3 Challenges and Opportunities
9.1.4 Growth of the market
9.1.5 Plans and Developments
10. Leading Companies in the Petroleum Resin Market 2017
10.1 Eastman Chemical Company
10.1.1 Eastman Chemical Company Historical Performance and Analysis
10.1.2 Eastman Chemical Company Future Outlook
10.2 ExxonMobil Corporation
10.3 Arakawa Chemical Industries Ltd.
10.4 Total Cray Valley
10.4.1 Total Cray Valley M&A Activity
10.5 Lesco Chemical Limited
10.6 Kolon Industries
10.7 Zeon Corporation
10.7.1 Zeon Corporation Company Historical Performance and Analysis
10.7.2 Zeon Corporation M&A Activity
10.8 Neville Chemical Company
10.9 Innova (Tianjin) Chemical Co., Ltd.
10.10 Puyang Ruisen Petroleum Resins Co., Ltd.
10.11 Other Companies in the Petroleum Resin Market 2017
11. Conclusions
11.1 The Global Petroleum Resin Market Overview
11.2 Leading National Petroleum Resins Market Summary
12. Glossary
List of Tables
Table 1.4 Leading National & Regional Petroleum Resins Consumption Forecasts 2017-2027 ($bn, AGR%, Cumulative)
Table 3.1 Global Growth in Petroleum Resin Demand Vs. GDP 2017-2027 (AGR%, Difference)
Table 3.2 Global Petroleum Resins Consumption Forecast 2017-2027 (KT, AGR%, CAGR%, Cumulative)
Table 3.3 Global Petroleum Resin Market Value Forecast 2017-2027 ($Million, AGR%, CAGR%, Cumulative)
Table 4.1 Global Petroleum Resins Market Consumption Forecast by Application 2017-2027 (KT, AGR%, Cumulative)
Table 4.2 Global Petroleum Resins Consumption Forecast By Application 2017-2027 (CAGR%)
Table 4.3 Global Petroleum Resins Market Value Forecasts by Application 2017-2027 ($Mn, AGR%, Cumulative)
Table 4.4 Global Petroleum Resins Market Value Forecasts by Application 2017-2027 (CAGR%)
Table 4.5 Global Petroleum Resins Consumption for Adhesives & Sealants (KT, AGR%, CAGR%, Cumulative)
Table 4.6 Global Petroleum Resins Market for Adhesives & Sealants Application Value Forecasts 2017-2027 ($Mn, AGR%, Cumulative)
Table 4.7 Global Petroleum Resins Consumption for Printing Inks Application Forecasts 2017-2027 (KT, AGR%, CAGR%, Cumulative)
Table 4.8 Global Petroleum Resins Market for Printing Inks Application Value Forecasts 2017-2027 ($Mn, AGR%, CAGR%, Cumulative)
Table 4.9 Global Petroleum Resins for Paints & Coatings Application Consumption Forecasts 2017-2027 (KT, AGR%, CAGR%, Cumulative)
Table 4.10 Global Petroleum Resins Market for Paints & Coatings Application Value Forecasts 2017-2027 (Mt, AGR%, CAGR%, Cumulative)
Table 4.11 Global Petroleum Resins Market Consumption Forecasts for Others Application 2017-2027 (KT, AGR%, CAGR%, Cumulative)
Table 4.12 Global Petroleum Resins Market for Others Application Value Forecasts 2017-2027 ($Mn, AGR%, CAGR%, Cumulative)
Table 5.1 Global Petroleum Resins Market Consumption Forecast by End-use Industry 2017-2027 (KT, AGR%, CAGR%, Cumulative)
Table 5.2 Global Petroleum Resins Market Consumption Forecast By End-use Industry 2017-2027 (CAGR% 2017-2027, 2017-2022, and 2022-2027)
Table 5.3 Global Petroleum Resins Market by End-use Industry Value Forecasts 2017-2027 ($Mn, AGR%, Cumulative)
Table 5.4 Global Petroleum Resins Market Value Forecasts by End-use Industry 2017-2027 (CAGR% 2017-2027, 2017-2022, and 2022-2027)
Table 5.5 Global Petroleum Resins Market for Building & Construction End-use Industry Consumption Forecasts 2017-2027 (KT, AGR%, CAGR%, Cumulative)
Table 5.6 Global Petroleum Resins Market for Building & Construction Industry Value Forecasts 2017-2027 ($Mn, AGR%, CAGR%, Cumulative)
Table 5.7 Global Petroleum Resins Market for Tire Industry Consumption Forecasts 2017-2027 (KT, AGR%, CAGR%, Cumulative)
Table 5.8 Global Petroleum Resin Market for Tire Industry Value Forecasts 2017-2027 ($Mn, AGR%, CAGR%, Cumulative)
Table 5.9 Global Petroleum Resin Market for Other End-use Industry Consumption Forecasts 2017-2027 (KT, AGR%, CAGR%, Cumulative)
Table 5.10 Global Petroleum Resins Market for Other End-use Industry Value Forecasts 2017-2027 ($Mn, AGR%, CAGR%, Cumulative)
Table 6.1 Global Petroleum Resins Market Consumption Forecast By Type 2017-2027 (KT, AGR%, Cumulative)
Table 6.2 Global Petroleum Resins Consumption Forecast By Type 2017-2027 (CAGR%)
Table 6.3 Global Petroleum Resins Market Value Forecasts by Type 2017-2027 ($Mn, AGR%, Cumulative)
Table 4.4 Global Petroleum Resins Market Value Forecasts by Type 2017-2027 (CAGR%)
Table 6.5 Global Petroleum Resins Consumption for C5 Resins 2017-2027 (KT, AGR%, CAGR%, Cumulative)
Table 6.6 Global Petroleum Resins Market for C5 Resins Value Forecasts 2017-2027 ($mn, AGR%, CAGR%, Cumulative)
Table 6.7 Global Petroleum Resins Consumption for C9 Resins Forecasts 2017-2027 (KT, AGR%, CAGR%, Cumulative)
Table 6.8 Global Petroleum Resins Market for C9 Resins Value Forecasts 2017-2027 ($Mn, AGR%, CAGR%, Cumulative)
Table 6.9 Global Petroleum Resins for Hydrogenated Hydrocarbon Resins Consumption Forecasts 2017-2027 (KT, AGR%, CAGR%, Cumulative)
Table 6.10 Global Petroleum Resins Market for Hydrogenated Hydrocarbon Resins Value Forecasts 2017-2027 ($mn, AGR%, CAGR%, Cumulative)
Table 6.11 Global Petroleum Resins Market Consumption Forecasts for C5/C9 Type 2017-2027 (KT, AGR%, CAGR%, Cumulative)
Table 6.12 Global Petroleum Resins Market for C5/C9 Types Value Forecasts 2017-2027 ($Mn, AGR%, CAGR%, Cumulative)
Table 7.1 Leading National Petroleum Resin Market Value Forecasts 2017-2027 ($Mn, AGR%, and Cumulative)
Table 7.2 U.S. Petroleum Resin Market Value Forecast 2017-2027 ($Mn, AGR%, CAGR%, Cumulative)
Table 6.3 U.S. Petroleum Resin Market Share Forecast 2017-2027 (%)
Table 7.3 Canadian Petroleum Resins Market Value Forecast 2017-2027 ($Mn, AGR%, CAGR%, Cumulative)
Table 7.9 Canadian Petroleum Resins Market Share Forecast 2017-2027 (%)
Table 7.5 Brazilian Petroleum Resin Market Value Forecast 2017-2027 ($Mn, AGR%, CAGR%, Cumulative)
Table 7.6 Brazilian Petroleum Resin Market Share Forecast 2017-2027 (%)
Table 7.7 Chinese Petroleum Resin Market Value Forecast 2017-2027 ($Mn, AGR%, CAGR%, Cumulative)
Table 7.8 Chinese Petroleum Resin Market Share Forecast 2017-2027 (%)
Table 7.9 UK Petroleum Resin Market Value Forecast 2017-2027 ($Mn, AGR%, CAGR%, Cumulative)
Table 7.10 UK Petroleum Resins Market Share Forecast 2017-2027 (%)
Table 7.11 French Petroleum Resin Market Value Forecast 2017-2027 ($Mn, AGR%, CAGR%, Cumulative)
Table 7.12 French Petroleum Resin Market Share Forecast 2017-2027 (%)
Table 7.13 Italian Petroleum Resin Market Value Forecast 2017-2027 ($Mn, AGR%, CAGR%, Cumulative)
Table 7.14 Italian Petroleum Resin Market Share Forecast 2017-2027 (%)
Table 7.15 Spanish Petroleum Resin Market Value Forecast 2017-2027 ($Mn, AGR%, CAGR%, Cumulative)
Table 7.16 Spanish Petroleum Resin Market Share Forecast 2017-2027 (%)
Table 7.17 Russian Petroleum Resin Market Value Forecast 2017-2027 ($Mn, AGR%, CAGR%, Cumulative)
Table 7.18 Russian Petroleum Resin Market Share Forecast 2017-2027 (%)
Table 7.19 German Petroleum Resin Market Value Forecast 2017-2027 ($Mn, AGR%, CAGR%, Cumulative)
Table 7.20 German Petroleum Resin Market Share Forecast 2017-2027 (%)
Table 7.21 Japanese Petroleum Resin Market Value Forecast 2017-2027 ($Mn, AGR%, CAGR%, Cumulative)
Table 7.22 Japanese Petroleum Resin Market Share Forecast 2017-2027 (%)
Table 7.23 Indian Petroleum Resin Market Value Forecast 2017-2027 ($Mn, AGR%, CAGR%, Cumulative)
Table 7.24 Indian Petroleum Resin Market Share Forecast 2017-2027 (%)
Table 7.25 ROW Petroleum Resin Market Forecast 2017-2027 ($Mn, AGR%, CAGR%, Cumulative)
Table 7.26 Row Petroleum Resin Market Share Forecast 2017-2027 (%)
Table 8.1 SWOT Analysis of the Petroleum Resin Market, 2017-2027
Table 10.1 Eastman Chemical Company Overview: Total Company Revenue ($Mn), Segments, Headquarters, Foundation Year, Number of Employees, Ticker, IR Contact, Website
Table 10.2 Eastman Chemical Company Annual Revenues 2010-2015 ($Mn, AGR%)
Table 10.3 Eastman Chemical Company: Mergers & Acquisitions
Table 10.4 ExxonMobil Corporation Overview: Total Company Revenue ($bn), Headquarters, Foundation Year, Number of Employees, Ticker, IR Contact, Website
Table 10.5 Arakawa Chemical Industries Ltd. Overview: Total Company Revenue, Segment Revenue, Headquarters, Foundation Year, Number of Employees, Ticker, IR Contact, Website
Table 10.6 Total Cray Valley Overview: Headquarters, Foundation Year, Ticker, IR Contact, Website
Table 10.7 Total Cray Valley Merger & Acquisition
Table 10.8 Lesco Chemical Limited Overview: Headquarters, Foundation Year, Website
Table 10.9 Kolon Industries Overview: Total Company Revenue, Headquarters, Foundation Year, Ticker, IR Contact, Website
Table 10.10 Zeon Corporation Overview: Total Company Revenue, Headquarters, Foundation Year, Number of Employees, Ticker, IR Contact, Website
Table 10.11 Zeon Corporation Annual Revenues 2010-2015 ($Mn, AGR%)
Table 10.12 Zeon Corporation: Mergers and Acquisitions
Table 10.13 Neville Chemical Company Overview: Headquarters, Foundation Year, IR Contact, Website
Table 10.14 Innova (Tianjin) Chemical Co., Ltd. Overview: Total Company Revenue ($Mn), Headquarters, Number of Employees, IR Contact, Website
Table 10.15 Puyang Ruisen Petroleum Resin Co., Ltd. Overview: Total Company Revenue ($bn), Segment Revenue ($bn), Headquarters, Foundation Year, Number of Employees, Ticker, IR Contact, Website
Table 10.1 Global Petroleum Resins Market Forecast Summary 2017, 2022, and 2027 (KT, AGR%, CAGR%)
Table 10.2 Global Petroleum Resins Market Forecast Summary 2017, 2022, and 2027 ($Mn, AGR%, CAGR%)
Table 10.3 Global Petroleum Resins Market by Application Forecast Summary 2017, 2022, and 2027 (KT, CAGR%)
Table 10.4 Global Petroleum Resins Market by Application Forecast Summary 2017, 2022, and 2027 ($mn, CAGR%)
Table 10.1 Global Leading National Petroleum Resins Market Forecast Summary 2017, 2022, and 2027 ($Mn, CAGR%)
List of Figures
Figure 1.1 Global Petroleum Resins Market Segmentation Overview, 2017
Figure 2.1 Global Petroleum Resin Market By Application
Figure 3.1 Global Growth in Petroleum Resin Demand Vs. GDP 2017-2027 (AGR%, Difference %)
Figure 3.3 Global Petroleum Resins Consumption Forecast 2017-2027 (KT, AGR%)
Figure 3.3 Global Petroleum Resins Market Value Forecast 2017-2027 ($Mn, AGR%)
Figure 3.4 Petroleum Resins Market: Drivers and Restraints, 2017-2027
Figure 4.1 Global Petroleum Resins Consumption Forecast By Application 2017-2027 (KT)
Figure 4.1 Global Petroleum Resin Consumption Forecast By Application (CAGR%, 2017-2027, 2017-2022, 2022-2027
Figure 4.2 Global Petroleum Resins Consumption Forecast By Application 2017-2027 (%AGR)
Figure 4.3 Global Petroleum Resins Market Value Forecast By Application 2017-2027 ($Mn)
Figure 4.4 Global Petroleum Resins Market Value Forecast By Application (CAGR%, 2017-2027, 2017-2022, 2022-2027)
Figure 4.6 Global Petroleum Resins Market Value Forecast By Application (%AGR)
Figure 4.7 Global Petroleum Resins Market Share By Application Forecast, 2017 (% of Total Market Value)
Figure 4.8 Global Petroleum Resins Market Share By Application Forecast, 2022 (% of Total Market Value)
Figure 4.9 Global Petroleum Resins Market Share By Application Forecast, 2027 (% of Total Market Value)
Figure 4.10 Global Petroleum Resins Market for Adhesives & Sealants Application (KT, AGR%)
Figure 4.11 Global Petroleum Resins Market Share By Application Forecast, 2027 ($Mn, AGR%)
Figure 4.11 Global Printing Inks Application Consumption Forecast, 2017-2027 (KT, AGR%)
Figure 4.12 Global Petroleum Resins Market Value Forecast By Application, 2017-2027 ($Mn, AGR%)
Figure 4.14 Global Paints & Coatings Application Consumption Forecast, 2017-2027 (KT, AGR%)
Figure 4.15 Global Paints & Coatings Application Market Value Forecast, 2017-2027 ($Mn, AGR%)
Figure 4.16 Global Petroleum Resins Market Consumption Forecasts for Others Application 2017-2027 (KT, AGR%)
Figure 4.17 Global Others Application Forecast, 2017-2027 ($Mn, AGR%)
Figure 5.1 Global Petroleum Resin Market By End Industry Consumption Forecast 2017-2027 (KT)
Figure 5.2Global Petroleum Resin Consumption Forecast By End Industry (CAGR%, 2016-2016, 2016-2021, 2021-2026)
Figure 5.3 Global Petroleum Resins Market By End Industry Value Forecast 2017-2027 ($Mn)
Figure 5.4 Global Petroleum Resins Market Value Forecast By End Industry (CAGR%, 2017-2027, 2017-2022, and 2022-2027)
Figure 5.5 Global Petroleum Resin Market Share By End-Industry Forecast, 2017 (% of Total Market Value)
Figure 5.6 Global Petroleum Resins Market Share By End-Industry Forecast, 2022 (% of Total Market Value)
Figure 5.7Global Petroleum Resins Market Share By End-Industry Forecast, 2027 (% of Total Market Value)
Figure 5.8 Global Building & Construction Forecast, 2017-2027 (KT, AGR%)
Figure 5.9 Global Building & Construction Forecast, 2017-2027 ($Mn, AGR%)
Figure 5.10 Global Tire Forecast, 2017-2027 ($Mn, AGR%)
Figure 5.11 Global Tire Forecast, 2017-2027 ($Mn, AGR%)
Figure 5.13 Global Other Forecast, 2017-2027 (KT, AGR%)
Figure 5.13 Global Other Forecast, 2017-2027 ($Mn, AGR%)
Figure 6.1 Global Petroleum Resins Consumption Forecast By Type 2017-2027 (KT)
Figure 6.2 Global Petroleum Resin Consumption Forecast By Application (CAGR%, 2017-2027, 2017-2022, 2022-2027
Figure 6.3 Global Petroleum Resins Consumption Forecast By Type 2017-2027 (%AGR)
Figure 6.4 Global Petroleum Resins Market Value Forecast By Type 2017-2027 ($Mn)
Figure 6.5 Global Petroleum Resins Market Value Forecast By Type (CAGR%, 2017-2027, 2017-2022, 2022-2027)
Figure 6.6 Global Petroleum Resins Market Value Forecast By Type (%AGR) 2017-2027
Figure 6.7 Global Petroleum Resins Market Share By Type Forecast, 2017 (% of Total Market Value)
Figure 6.8 Global Petroleum Resins Market Share By Type Forecast, 2022 (% of Total Market Value)
Figure 6.9 Global Petroleum Resins Market Share By Type Forecast, 2027 (% of Total Market Value)
Figure 6.10 Global Petroleum Resins Market for C5 Resins Type (KT, AGR%) 2017-2027
Figure 6.11 Global Petroleum Resins Market for C5 Resins Forecast, 2027 ($Mn, AGR%)
Figure 6.12 Global C9 Resins Consumption Forecast, 2017-2027 (KT, AGR%)
Figure 6.13 Global Petroleum Resins Market Value Forecast By Type, 2017-2027 ($Mn, AGR%)
Figure 6.14 Global Hydrogenated Hydrocarbon Resins Consumption Forecast, 2017-2027 (KT, AGR%)
Figure 6.15 Global Hydrogenated Hydrocarbon Resins Market Value Forecast, 2017-2027 ($Mn, AGR%)
Figure 6.16 Global C5/C9 Types Consumption Forecast, 2017-2027 (KT, AGR%)
Figure 6.17 Global C5/C9 Types Forecast, 2017-2027 ($Mn, AGR%)
Figure 7.1 Leading National Petroleum Resin Market Value Forecast 2017-2027($Mn)
Figure 7.2 Leading National Petroleum Resins Market Share Forecast 2017 (%)
Figure 7.3 Leading National Petroleum Resin Market Share Forecast 2022 (%)
Figure 7.4 Leading National Petroleum Resins Market Share Forecast 2027 (%)
Figure 7.5 U.S. Petroleum Resin Market Forecast 2017-2027 (KT, AGR%)
Figure 7.6 U.S. Vs China Petroleum Resin Market Value 2017-2027 (% Share)
Figure 7.7 U.S. Vs China Petroleum Resin Market Value 2017-2027 ($Mn)
Figure 7.8 Canadian Petroleum Resin Market Value Forecast 2017-2027 ($Mn, AGR%)
Figure 7.10 Canada Vs China Petroleum Resin Market Share 2017-2027 (% Share)
Figure 7.11 Canada Vs China Petroleum Resin Market Value 2017-2027 ($Mn)
Figure 7.12 Brazilian Petroleum Resin Market Value Forecast 2017-2027 ($Mn, AGR%)
Figure 7.13 Brazil Vs China Petroleum Resin Market Value 2017-2027 (% Share)
Figure 7.14 Brazil Vs China Petroleum Resin Market Value 2017-2027 ($Mn)
Figure 7.15 Chinese Petroleum Resin Market Value Forecast 2017-2027 ($Mn, AGR%)
Figure 7.16 UK Petroleum Resin Market Value Forecast 2017-2027 ($Mn, AGR%)
Figure 7.17 UK Vs China Petroleum Resin Market Value 2017-2027 (% Share)
Figure 7.18 UK Vs China Petroleum Resin Market Value 2017-2027 ($Mn)
Figure 7.19 French Petroleum Resin Market Value Forecast 2017-2027 ($Mn, AGR%)
Figure 7.20 French Vs China Petroleum Resin Market Value 2017-2027 (% Share)
Figure 6.20 French Vs China Petroleum Resin Market Value 2017-2027 ($Mn)
Figure 7.21 Italian Petroleum Resin Market Value Forecast 2017-2027 ($Mn, AGR%)
Figure 7.22 Italy Vs China Petroleum Resin Market Value 2017-2027 (Share)
Figure 7.23 Italy Vs China Petroleum Resin Market Value 2017-2027 ($Mn)
Figure 7.24 Spanish Petroleum Resin Market Value Forecast 2017-2027 ($Mn, AGR%)
Figure 7.25 Spain Vs China Petroleum Resin Market Share 2017-2027 (% Share)
Figure 7.26 Spain Vs China Petroleum Resin Market Value 2017-2027 ($Mn)
Figure 7.27 Russian Petroleum Resin Market Value Forecast 2017-2027 ($Mn, AGR%)
Figure 7.28 Russia Vs China Petroleum Resin Market Share 2017-2027 (% Share)
Figure 7.29 Russia Vs China Petroleum Resin Market Value 2017-2027 ($Mn)
Figure 7.30 German Petroleum Resin Market Value Forecast 2017-2027 ($Mn, AGR%)
Figure 7.31 Germany Vs China Petroleum Resin Market Share 2017-2027 (% Share)
Figure 7.32 Germany Vs China Petroleum Resin Market Value 2017-2027 ($Mn)
Figure 7.33 Japanese Petroleum Resin Market Value Forecast 2017-2027 ($Mn, AGR%)
Figure 7.34 Japan Vs China Petroleum Resin Market Share 2017-2027 (% Share)
Figure 7.35 Japan Vs China Petroleum Resin Market Value 2017-2027 ($Mn)
Figure 7.36 Indian Petroleum Resin Market Value Forecast 2017-2027 ($Mn, AGR%)
Figure 7.37 India Vs China Petroleum Resin Market Share 2017-2027 (%Share)
Figure 7.38 India Vs China Petroleum Resin Market Value 2017-2027 ($Mn)
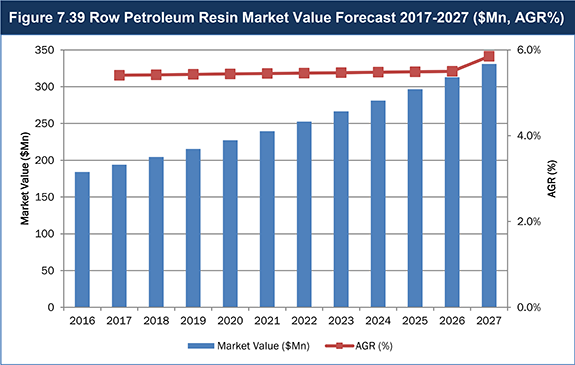
Figure 7.39 Row Petroleum Resin Market Value Forecast 2017-2027 ($Mn, AGR%)
Figure 7.40 Row Vs China Petroleum Resin Market Share 2017-2027 (% Share)
Figure 7.41 Row Vs China Petroleum Resin Market Value 2017-2027 ($Mn)
Figure 10.1 Eastman Chemical Company Revenue By Business Segment 2015 (% Share)
Figure 10.2 Eastman Chemical Company Revenue By Region 2015 (% Share)
Figure 10.3 Eastman Chemical Company Annual Revenue 2010-2015 ($Mn, AGR%)
Figure 10.4 ExxonMobil Corporation Revenue By Business Segment 2015 (% Share)
Figure 10.5 ExxonMobil Corporation Revenue By Region Segment 2015 (% Share)
Figure 10.6 Arakawa Chemical Industries Ltd. Annual Revenue 2010-2015 ($Mn, AGR%)
Figure 10.7 Arakawa Chemical Industries Ltd. Revenue By Business Segment 2015 (% Share)
Figure 10.8 Zeon Corporation Revenue By Business Segment 2015 (% Share)
Figure 10.9 Zeon Corporation Revenue By Region 2015 (% Share)
Figure 10.10 Zeon Corporation Annual Revenue 2010-2015 ($Mn, AGR%)