With an incredible amount of attention devoted to building thermal insulation market, deriving market prospects and opportunities can be difficult. Visiongain has looked beyond the attention-grabbing headlines to create an accurate market research report that will help you arrive at logical, valuable conclusions that are grounded in reality – not media headlines.
With global, national/regional, and submarket estimates for building thermal insulation market, this report covers key aspects of this market. In addition, the report profiles the leading companies in the market, and drivers and restraints analysis of the market.
Reasons to buy
• Learn where the building thermal insulation market is headed
• Understand how the technology can be monetised
• See where the business opportunities are
• Compare your evaluations with a second opinion
• Discover who the first movers are within this market space
• See what the barriers to entry are likely to be
Featured content
• Global Building Thermal Insulation market forecasts and analysis from 2019-2029 illustrate the market progression
• Building Thermal Insulation Market Forecasts by Material from 2019-2029
• Wool Insulation Submarket Forecast 2019-2029
– Glass Wool Submarket Forecast 2019-2029
– Stone Wool Submarket Forecast 2019-2029
• Plastic Foams Submarket Forecast 2019-2029
– EPS Submarket Forecast 2019-2029
– XPS Submarket Forecast 2019-2029
– PUR Foams Submarket Forecast 2019-2029
– Other (Plastic Forms) Applications Submarket Forecast 2019-2029
• Other Materials Submarket Forecast 2019-2029
• Building Thermal Insulation Market Forecasts by End-User from 2019-2029
– Residential Market Forecast 2019-2029
– Commercial Market Forecast 2019-2029
• Building Thermal Insulation Market Forecasts by Application 2019-2029
• Wall Insulation Submarket Forecast 2019-2029
– External Submarket Forecast 2019-2029
– Internal Submarket Forecast 2019-2029
– Cavity Submarket Forecast 2019-2029
• Roof Insulation Submarket Forecast 2019-2029
– Flat Roof Submarket Forecast 2019-2029
– Pitch Roof Submarket Forecast 2019-2029
• Floor Insulation Submarket Forecast 2019-2029
• Regional Building Thermal Insulation Market Forecasts from 2019-2029
– North America Building Thermal Insulation Market Forecast 2019-2029
– Western Europe Building Thermal Insulation Market Forecast 2019-2029
– Central and Eastern Europe Building Thermal Insulation Market Forecast 2019-2029
– Asia-Pacific Building Thermal Insulation Market Forecast 2019-2029
– Middle East & Africa Building Thermal Insulation Market Forecast 2019-2029
– South America Building Thermal Insulation Market Forecast 2019-2029
• Leading National Building Thermal Insulation Market Forecasts from 2019-2029
– US Building Thermal Insulation Market Forecast 2019-2029
– Canada Building Thermal Insulation Market Forecast 2019-2029
– Mexico Building Thermal Insulation Market Forecast 2019-2029
– Germany Building Thermal Insulation Market Forecast 2019-2029
– UK Building Thermal Insulation Market Forecast 2019-2029
– France Building Thermal Insulation Market Forecast 2019-2029
– Spain Building Thermal Insulation Market Forecast 2019-2029
– Italy Building Thermal Insulation Market Forecast 2019-2029
– Poland Building Thermal Insulation Market Forecast 2019-2029
– Russia Building Thermal Insulation Market Forecast 2019-2029
– Brazil Building Thermal Insulation Market Forecast 2019-2029
– Japan Building Thermal Insulation Market Forecast 2019-2029
– India Building Thermal Insulation Market Forecast 2019-2029
– China Building Thermal Insulation Market Forecast 2019-2029
– South Korea Building Thermal Insulation Market Forecast 2019-2029
– Philippines Building Thermal Insulation Market Forecast 2019-2029
– Indonesia Building Thermal Insulation Market Forecast 2019-2029
– Malaysia Building Thermal Insulation Market Forecast 2019-2029
– Vietnam Building Thermal Insulation Market Forecast 2019-2029
– Argentina Building Thermal Insulation Market Forecast 2019-2029
– MEA Building Thermal Insulation Market Forecast 2019-2029
– South Africa Building Thermal Insulation Market Forecast 2019-2029
• Profiles of the leading 14 Building Thermal Insulation Companies
– Arkema SA
– BASF SE
– Clariant AG
– Covestro AG
– DowDuPont, Inc.
– Eastman Chemical Co.
– Evonik Industries AG
– Fletcher Building Ltd.
– GAF Industries Inc.
– Johns Manville Corp.
– Kingspan Group PLC
– Knauf Insulation
– Masco Corp.
– Owens Corning Corporation
Building thermal insulation market is forecast for moderate growth. With a Visiongain report, you can learn just how the development of this market could affect you. With 325 charts and graphs, this 217-page report will be of interest to you.
Visiongain is a trading partner with the US Federal Government
CCR Ref number: KD4R6
Do you have any custom requirements we can help you with? Any need for specific country, geo region, market segment or specific company information? Contact us today, we can discuss your needs and see how we can help: sara.peerun@visiongain.com
1. Report Overview
1.1 Global Building Thermal Insulation Market Overview
1.1.1 Building Thermal Insulation Market Segmentation
1.2 Why You Should Read This Report
1.3 How This Report Delivers
1.4 Key Questions Answered by This Analytical Report Include:
1.5 Who is This Report For?
1.6 Methodology
1.6.1 Primary Research
1.6.2 Secondary Research
1.6.3 Market Evaluation & Forecasting Methodology
1.7 Frequently Asked Questions (FAQ)
1.8 Associated Visiongain Reports
1.9 About Visiongain
2 Introduction to the Building Thermal Insulation Market
2.1 What is Building Thermal Insulation
2.2 Opportunities
2.2.1 More Energy Requirements
2.3 Value Chain Analysis
2.3.1 Raw Materials
2.3.2 Building Insulation Material
2.3.3 Building Insulation Material Product Form
2.3.4 Distribution Network
2.3.5 End User
2.4 Policy and Regulations
3 Global Building Thermal Insulation Market 2019-2029
3.1 Global Building Thermal Insulation Production Forecast 2019-2029
3.2 Global Building Thermal Insulation Market Analysis 2019-2029
3.3 Global Building Thermal Insulation Market Drivers
3.3.1 Greenhouse Gas Emission Reduction
3.3.2 Cause Deficiency
3.4 Global Building Thermal Insulation Market Restraints
3.4.1 Slow Growth of the Construction Sector in Europe
3.4.2 Lack of Awareness
3.5 Opportunities
3.5.1 More Energy Requirements
3.6 Burning Issue
3.6.1 Withdrawal from Kyoto Protocol
4 Global Building Thermal Insulation Market Forecast by Application 2019-2029
4.1 Introduction
4.2 Roof Insulation Market Forecast 2019-2029
4.2.1 Overview
4.2.2 Flat Roof Analysis 2019-2029
4.2.3 Pitch Roof Analysis 2019-2029
4.3 Wall Insulation Market Forecast 2019-2029
4.3.1 Overview
4.3.2 External Walls Analysis 2019-2029
4.3.3 Internal Walls Analysis 2019-2029
4.3.4 Cavity Walls Analysis 2019-2029
4.4 Floor Insulation Market Forecast 2019-2029
5 Global Building Thermal Insulation Market Forecast by Material Type 2019-2029
5.1 Introduction
5.2 Wool Insulation Market Forecast 2019-2029
5.2.1 Glass Wool Analysis 2019-2029
5.2.2 Stone Wool Analysis 2019-2029
5.3 Plastic Foams Market Forecast 2019-2029
5.3.1 EPS Market Forecast 2019-2029
5.3.2 XPS Market Forecast 2019-2029
5.3.3 PUR Foams Market Forecast 2019-2029
5.3.4 Other Plastic Foams Market Forecast 2019-2029
5.3.4.1 Polyisocyanurate Insulation
5.3.4.2 Phenolic Foams Analysis
5.4 Other Materials Market Forecast 2019-2029
6 Global Building Thermal Insulation Market Forecast by End-User 2019-2029
6.1 Introduction
6.2 Residential Market Forecast 2019-2029
6.3 Commercial Market Forecast 2019-2029
7 Global Building Thermal Insulation Market Forecast by Region 2019-2029
7.1 The Global Economic Outlook
7.2 North America Building Thermal Insulation Market Forecast 2019-2029
7.3 Western Europe Building Thermal Insulation Market Forecast 2019-2029
7.4 Central and Eastern Europe Building Thermal Insulation Market Forecast 2019-2029
7.5 Asia Pacific Building Thermal Insulation Market Forecast 2019-2029
7.6 The Middle East & Africa Building Thermal Insulation Market Forecast 2019-2029
7.6.1 The Middle East Analysis
7.6.2 Africa Analysis
7.7 South America Building Thermal Insulation Market Forecast 2019-2029
8 Leading Countries in Building Thermal Insulation Market Forecasts 2019-2029
8.1 U.S. Building Thermal Insulation Market Forecast 2019-2029
8.2 Canada Building Thermal Insulation Market Forecast 2019-2029
8.3 Mexico Building Thermal Insulation Market Forecast 2019-2029
8.4 Germany Building Thermal Insulation Market Forecast 2019-2029
8.5 France Building Thermal Insulation Market Forecast 2019-2029
8.6 U.K Building Thermal Insulation Market Forecast 2019-2029
8.7 Italy Building Thermal Insulation Market Forecast 2019-2029
8.8 Spain Building Thermal Insulation Market Forecast 2019-2029
8.9 Poland Building Thermal Insulation Market Forecast 2019-2029
8.10 Russia Building Thermal Insulation Market Forecast 2019-2029
8.11 China Building Thermal Insulation Market Forecast 2019-2029
8.12 Japan Building Thermal Insulation Market Forecast 2019-2029
8.13 India Building Thermal Insulation Market Forecast 2019-2029
8.14 South Korea Building Thermal Insulation Market Forecast 2019-2029
8.15 Philippines Building Thermal Insulation Market Forecast 2019-2029
8.16 Indonesia Building Thermal Insulation Market Forecast 2019-2029
8.17 Malaysia Building Thermal Insulation Market Forecast 2019-2029
8.18 Vietnam Building Thermal Insulation Market Forecast 2019-2029
8.19 Brazil Building Thermal Insulation Market Forecast 2019-2029
8.20 Argentina Building Thermal Insulation Market Forecast 2019-2029
8.21 The Middle East Building Thermal Insulation Market Forecast 2019-2029
8.22 South Africa Building Thermal Insulation Market Forecast 2019-2029
9 Porter's Five Forces Analysis
9.1 Bargaining Power of Suppliers
9.2 Bargaining Power of Buyers
9.3 Threat of Substitutes
9.4 The Threat of New Entrants
9.5 Intensive of Competitive Rivalry
10 Leading Companies in the Building Thermal Insulation Market 2019
10.1 Arkema SA
10.1.1 Arkema SA Key Developments
10.1.2 Arkema SA Sales 2015-2018
10.1.3 Arkema SA Net Income 2015-2018
10.1.4 Arkema SA Organisational Structure
10.1.5 Arkema SA Building Thermal Insulation Market Products / Services
10.1.6 Arkema SA Primary Market Competitors 2018
10.1.7 Arkema SA Overview
10.1.8 Arkema SA Key Financial Ratios
10.1.9 Arkema SA SWOT Analysis
10.2 BASF SE
10.2.1 BASF SE Key Developments
10.2.2 BASF SE Sales 2015-2018
10.2.3 BASF SE Net Income 2015-2018
10.2.4 BASF SE Organisational Structure
10.2.5 BASF SE Building Thermal Insulation Market Products / Services
10.2.6 BASF SE Primary Market Competitors 2018
10.2.7 BASF SE Overview
10.2.8 BASF SE Key Financial Ratios
10.2.9 BASF SE SWOT Analysis
10.3 Clariant AG
10.3.1 Clariant AG Key Developments
10.3.2 Clariant AG Sales 2013-2017
10.3.3 Clariant AG Net Income 2013-2017
10.3.4 Clariant AG Business Segments
10.3.5 Clariant AG Building Thermal Insulation Market Products / Services
10.3.6 Clariant AG Primary Market Competitors 2018
10.3.7 Overview
10.3.8 Clariant AG Key Financial Ratios
10.3.9 Clariant AG SWOT Analysis
10.4 Covestro AG
10.4.1 Covestro AG Key Developments
10.4.2 Covestro AG Sales 2015-2018
10.4.3 Covestro AG Net Income 2015-2018
10.4.4 Covestro AG Business Sectors
10.4.5 Covestro AG Building Thermal Insulation Market Products / Services
10.4.6 Covestro AG Primary Market Competitors 2018
10.4.7 Covestro AG Overview
10.4.8 Covestro AG Key Financial Ratios
10.4.9 Covestro AG SWOT Analysis
10.5 DowDuPont, Inc.
10.5.1 DowDuPont, Inc. Key Developments
10.5.2 DowDuPont, Inc. Sales 2015-2018
10.5.3 DowDuPont, Inc. Net Income 2015-2018
10.5.4 DowDuPont, Inc. Business Divisions
10.5.5 DowDuPont, Inc. Building Thermal Insulation Market Products / Services
10.5.6 DowDuPont, Inc. Primary Market Competitors 2018
10.5.7 DowDuPont, Inc. Overview
10.5.7.1 DowDuPont, Inc. Number of Manufacturing Sites
10.5.8 DowDuPont, Inc. Key Financial Ratios
10.5.9 DowDuPont, Inc. SWOT Analysis
10.6 Eastman Chemical Co.
10.6.1 Eastman Chemical Co. Key Developments
10.6.2 Eastman Chemical Co. Sales 2015-2018
10.6.3 Eastman Chemical Co. Industry Group Net Income 2015-2018
10.6.4 Eastman Chemical Co. Segment Information
10.6.5 Eastman Chemical Co. Building Thermal Insulation Market Products / Services
10.6.6 Eastman Chemical Co. Primary Market Competitors 2018
10.6.7 Eastman Chemical Co. Overview
10.6.8 Eastman Chemical Co. Key Financial Ratios
10.6.9 Eastman Chemical Co. SWOT Analysis
10.7 Evonik Industries AG
10.7.1 Evonik Industries AG Key Developments
10.7.2 Evonik Industries AG Sales 2015-2018
10.7.3 Evonik Industries AG Net Income 2015-2018
10.7.4 Evonik Industries AG Business Segments
10.7.5 Evonik Industries AG Building Thermal Insulation Market Products / Services
10.7.6 Evonik Industries AG Primary Market Competitors 2018
10.7.7 Evonik Industries AG Overview
10.7.8 Evonik Industries AG Key Financial Ratios
10.7.9 Evonik Industries AG SWOT Analysis
10.8 Fletcher Building Ltd.
10.8.1 Fletcher Building Ltd. Key Developments
10.8.2 Fletcher Building Ltd. Sales 2015-2018
10.8.3 Fletcher Building Ltd. Net Income 2015-2018
10.8.4 Fletcher Building Ltd. Business Divisions
10.8.5 Fletcher Building Ltd. Building Thermal Insulation Market Products / Services
10.8.6 Fletcher Building Ltd. Primary Market Competitors 2018
10.8.7 Fletcher Building Ltd. Overview
10.8.8 Fletcher Building Ltd. Key Financial Ratios
10.8.9 Fletcher Building Ltd. SWOT Analysis
10.9 GAF Industries Inc.
10.9.1 GAF Industries Inc. Key Developments
10.9.2 GAF Industries Inc. Building Thermal Insulation Market Products / Services
10.9.3 GAF Industries Inc. Primary Market Competitors 2018
10.9.4 GAF Industries Inc. Overview
10.9.5 GAF Industries Inc. SWOT Analysis
10.10 Johns Manville Corp.
10.10.1 Johns Manville Corp. Key Developments
10.10.2 Johns Manville Corp. Business Divisions
10.10.3 Johns Manville Corp. Building Thermal Insulation Market Products / Services
10.10.4 Johns Manville Corp. Primary Market Competitors 2018
10.10.5 Johns Manville Corp. Overview
10.11 Kingspan Group PLC
10.11.1 Kingspan Group PLC Key Developments
10.11.2 Kingspan Group PLC Sales 2013-2017
10.11.3 Kingspan Group PLC Net Income 2013-2017
10.11.4 Kingspan Group PLC Company Structure
10.11.5 Kingspan Group PLC Building Thermal Insulation Market Products / Services
10.11.6 Kingspan Group PLC Primary Market Competitors 2018
10.11.7 Kingspan Group PLC Overview
10.11.8 Kingspan Group PLC Key Financial Ratios
10.11.9 Kingspan Group PLC SWOT Analysis
10.12 Knauf Insulation
10.12.1 Knauf Insulation Key Developments
10.12.2 Knauf Insulation Building Thermal Insulation Market Products / Services
10.12.3 Knauf Insulation Primary Market Competitors 2018
10.12.4 Knauf Insulation Overview
10.12.5 Knauf Insulation SWOT Analysis
10.13 Masco Corp.
10.13.1 Masco Corp. Key Developments
10.13.2 Masco Corp. Sales 2015-2018
10.13.3 Masco Corp. Net Income 2015-2018
10.13.4 Masco Corp. Company Structure
10.13.5 Masco Corp. Building Thermal Insulation Market Products / Services
10.13.6 Masco Corp. Overview
10.13.7 Masco Corp. Key Financial Ratios
10.14 Owens Corning Corporation
10.14.1 Owens Corning Corporation Key Developments
10.14.2 Owens Corning Corporation Sales 2013-2017
10.14.3 Owens Corning Corporation Net Income 2013-2017
10.14.4 Owens Corning Corporation Market Sectors
10.14.5 Owens Corning Corporation Building Thermal Insulation Market Products / Services
10.14.6 Owens Corning Corporation Primary Market Competitors 2018
10.14.7 Owens Corning Corporation Overview
10.14.8 Owens Corning Corporation Key Financial Ratios
10.14.9 Owens Corning Corporation Financial Outlook
10.14.10 Owens Corning Corporation SWOT Analysis
10.15 Other Companies from the Value Chain
11 Conclusion
12 Glossary
Associated Visiongain Reports
Visiongain Report Sales Order Form
Appendix A
About Visiongain
Appendix B
Visiongain Report Evaluation Form
List of Figures
Figure 2.1: Building Thermal Insulation Value Chain Analysis 2018
Figure 3.1 Global Building Thermal Insulation Market Forecast 2019-2029 (US$ Billion, AGR %)
Figure 4.1 Building Thermal Insulation Market Forecast by Application 2019-2029 (US$ Billion)
Figure 4.2 Building Thermal Insulation Market by Application Market Share Forecast 2019, 2024, 2029 (% Share)
Figure 4.3 Wall Insulation Application Captures the Major Market Share in the Building Thermal Insulation Market in 2019
Figure 4.4 Wall Insulation is Estimated to be the Largest Application in the Building Thermal Insulation Market from 2019 to 2029 (US$ Billion)
Figure 4.5: Flat Roof Accounts for the Largest Share of Roof Insulation Application During the Forecast Period (US$ Billion)
Figure 4.6 Global Building Thermal Insulation Market for Roof Insulation Sub-Segment Share Forecast 2019, 2024, 2029 (% Share)
Figure 4.7: External Wall will Continue to be the Largest Segment for Wall Insulation During the Forecast Period (US$ Billion)
Figure 4.8 Global Building Thermal Insulation Market for Wall Insulation Sub-Segment Share Forecast 2019, 2024, 2029 (% Share)
Figure 5.1: Market Segmentation for Key Building Insulation Materials
Figure 5.2: Wool Insulation will continue to Dominate the Building Thermal Insulation Consumption During the Forecast Period 2019-2029 (US$ Billion)
Figure 5.3 Building Thermal Insulation Market Share Forecast by Material Type 2019, 2024, 2029 (% Share)
Figure 5.4: Glass Wool to Dominate the Wool Insulation Market During the Forecast Period 2019-2029 (US$ Billion)
Figure 5.5 Global Building Thermal Insulation Market for Wool Insulation Sub- Segment Share Forecast 2019, 2024, 2029 (% Share)
Figure 6.1: Building Thermal Insulation Market Forecast by End-User 2019-2029 (USb)
Figure 6.2: Global Building Thermal Insulation Market Forecast for Residential Segment 2019-2029 (US$ Billion, AGR %)
Figure 6.3: Global Building Thermal Insulation Market Forecast for Commercial Segment 2019-2029 (US$ billion, AGR %)
Figure 6.4 Global Building Thermal Insulation Market Forecast by Region 2019-2029 (US$ Billion)
Figure 6.5 Building Thermal Insulation Market Share Forecast by Region 2019, 2024, 2029 (% Share)
Figure 7.1: North America Building Thermal Insulation Market Forecast 2019-2029 (US$ Billion, AGR %)
Figure 7.2 North America Building Thermal Insulation Market by Country Market Share Forecast 2019, 2024, 2029 (% Share)
Figure 7.3: North America Building Thermal Insulation Market Forecast by Country 2019-2029 (US$ Billion, AGR %)
Figure 7.4: Building Thermal Insulation Market by Plastic Foams Sub-Market Forecast in North-America 2019-2029 (US$ Billion, AGR%)
Figure 7.5: Western Europe Building Thermal Insulation Market Forecast 2019-2029 (US$ Billion, AGR %)
Figure 7.6 Western Europe Building Thermal Insulation Market Share Forecast by Country 2019, 2024, 2029 (% Share)
Figure 7.7: Western Europe Building Thermal Insulation Market by Country Forecast 2019-2029 (US$ Billion, AGR%)
Figure 7.8: Building Thermal Insulation Market by Plastic Foams Sub-Market Forecast in the Western Europe 2019-2029 (US$ billion, AGR %)
Figure 7.9: Central & Eastern Europe Building Thermal Insulation Market Forecast 2019-2029 (US$ Billion, AGR %)
Figure 7.10: Central & Eastern Europe Building Thermal Insulation Market Share Forecast by Country 2019, 2024, 2029 (% Share)
Figure 7.11: Central & Eastern Europe Building Thermal Insulation Market by Country Forecast 2019-2029 (US$ billion, AGR %)
Figure 7.12: Building Thermal Insulation Market by Plastic Foams Type Forecast in the Central & Eastern Europe 2019-2029 (US$ Billion, AGR%)
Figure 7.13: Asia-Pacific Building Thermal Insulation Market Forecast 2019-2029 (US$ Billion, AGR %)
Figure 7.14: Asia-Pacific Building Thermal Insulation Market by Country Market Share Forecast 2019, 2024, 2029 (% Share)
Figure 7.15: Asia-Pacific Building Thermal Insulation Market by Country Forecast 2019-2029 (US$ Billion, AGR %)
Figure 7.16: Building Thermal Insulation Market by Plastic Foams Sub-Market Forecast in Asia-Pacific 2019-2029 (US$ Billion, AGR %)
Figure 7.17: The Middle East & Africa Building Thermal Insulation Market Forecast 2019-2029 (US$ Billion, AGR %)
Figure 7.18: MEA Building Thermal Insulation Market Share Forecast by Region 2019, 2024, 2029 (% Share)
Figure 7.19: The Middle East & Africa Building Thermal Insulation Market by Region Forecast 2019-2029 (US$ Billion, AGR %)
Figure 7.20: Building Thermal Insulation Market by Plastic Foams Forecast in the Middle East and Africa 2019-2029 (US$ Billion, AGR%)
Figure 7.21: South America Building Thermal Insulation Market Forecast 2019-2029 (US$ Billion, AGR %)
Figure 7.22: South America Building Thermal Insulation Market by Country Market Share Forecast 2019, 2024, 2029 (% Share)
Figure 7.23: South America Building Thermal Insulation Market by Country Forecast 2019-2029 (US$ Billion, AGR %)
Figure 7.24: Building Thermal Insulation Market by Plastic Foams Forecast in South America 2019-2029 (US$ Billion, AGR %)
Figure 8.1: U.S. Building Thermal Insulation Market Forecast 2019-2029 (US$ Billion, AGR %)
Figure 8.2 U.S. Building Thermal Insulation Market Forecast by Type 2019-2029 (US$ Billion)
Figure 8.3: Canada Building Thermal Insulation Market Forecast 2019-2029 (US$ Billion, AGR %)
Figure 8.4 Wool Insulant Captures the Major Market Share in the Canada Building Thermal Insulation Market from 2019 to 2029 (US Billion)
Figure 8.5: Mexico Building Thermal Insulation Market Forecast 2019-2029 (US$ Billion, AGR %)
Figure 8.6 Wool Insulant Captures the Major Market Share in the Mexico Building Thermal Insulation Market from 2019 to 2029 (US Billion)
Figure 8.7: Germany Building Thermal Insulation Market Forecast 2019-2029 (US$ Billion, AGR %)
Figure 8.8: Wool Insulant Material Dominates the Building Thermal Insulation Material Market in Germany 2019-2029 (US Billion)
Figure 8.9: France Building Thermal Insulation Market Forecast 2019-2029 (US$ Billion, AGR %)
Figure 8.10: Wool Insulant Dominates the France Building Thermal Insulation Material Market During the Forecast Period (US Billion)
Figure 8.11: U.K. Building Thermal Insulation Market Forecast 2019-2029 (US$ Billion, AGR %)
Figure 8.12: Wool Insulant Dominates the U.K. Building Thermal Insulation Material Market During the Forecast Period (US Billion)
Figure 8.13: Italy Building Thermal Insulation Market Forecast 2019-2029 (US$ Billion, AGR %)
Figure 8.14: Wool Insulant Dominates the Italy Building Thermal Insulation Material Market During the Forecast Period (US Billion)
Figure 8.15: Spain Building Thermal Insulation Market Forecast 2019-2029 (US$ Billion, AGR %)
Figure 8.16: Wool Insulant Dominates the Spain Building Thermal Insulation Material Market During the Forecast Period (US Billion)
Figure 8.17: Poland Building Thermal Insulation Market Forecast 2019-2029 (US$ Billion, AGR %)
Figure 8.18: Wool Insulant Dominates the Poland Building Thermal Insulation Material Market During the Forecast Period (US Billion)
Figure 8.19: Russia Building Thermal Insulation Market Forecast 2019-2029 (US$ Billion, AGR %)
Figure 8.20: Wool Insulant Dominates the Russia Building Thermal Insulation Material Market During the Forecast Period (US Billion)
Figure 8.21: China Building Thermal Insulation Market Forecast 2019-2029 (US$ Billion, AGR %)
Figure 8.22: Plastic Foam Dominates the China Building Thermal Insulation Material Market During the Forecast Period (US Billion)
Figure 8.23: Japan Building Thermal Insulation Market Forecast 2019-2029 (US$ Billion, AGR %)
Figure 8.24: Plastic Foam Dominates the Japan Building Thermal Insulation Material Market During the Forecast Period (US Billion)
Figure 8.25: India Building Thermal Insulation Market Forecast 2019-2029 (US$ Billion, AGR %)
Figure 8.26: Plastic Foam is Estimated to be the Largest Building Thermal Insulant in India during the Forecast Period (US Billion)
Figure 8.27: South Korea Building Thermal Insulation Market Forecast 2019-2029 (US$ Billion, AGR %)
Figure 8.28: Plastic Foam is Estimated to be the Largest Building Thermal Insulant in South Korea during the Forecast Period (US Billion)
Figure 8.29: Philippines Building Thermal Insulation Market Forecast 2019-2029 (US$ Billion, AGR %)
Figure 8.30: Plastic Foam is Estimated to be the Largest Building Thermal Insulant in Philippines during the Forecast Period (US Billion)
Figure 8.31: Indonesia Building Thermal Insulation Market Forecast 2019-2029 (US$ Billion, AGR %)
Figure 8.32: Plastic Foam is Estimated to be the Largest Building Thermal Insulant in Indonesia during the Forecast Period (US Billion)
Figure 8.33: Malaysia Building Thermal Insulation Market Forecast 2019-2029 (US$ Billion, AGR %)
Figure 8.34: Plastic Foam is Estimated to be the Largest Building Thermal Insulant in Malaysia during the Forecast Period (US Billion)
Figure 8.35: Vietnam Building Thermal Insulation Market Forecast 2019-2029 (US$ Billion, AGR %)
Figure 8.36: Plastic Foam is Estimated to be the Largest Building Thermal Insulant in Vietnam during the Forecast Period (US Billion)
Figure 8.37: Brazil Building Thermal Insulation Market Forecast 2019-2029 (US$ Billion, AGR %)
Figure 8.38: Wool Insulant is Estimated to be the Largest Type of Insulant in the Brazilian Building Thermal Insulation Material Market (US Billion)
Figure 8.39: Argentina Building Thermal Insulation Market Forecast 2019-2029 (US$ Billion, AGR %)
Figure 8.40: Wool Insulant is Estimated to be the Largest Type of Insulant in the Argentina Building Thermal Insulation Material Market (US Billion)
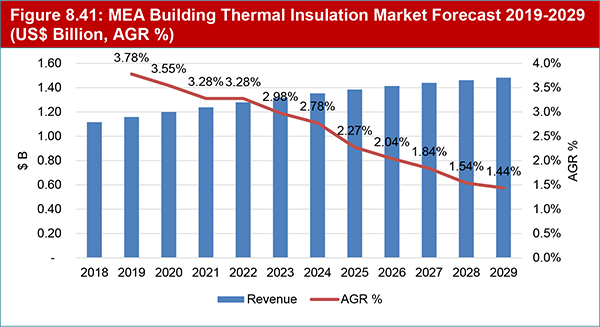
Figure 8.41: ME Building Thermal Insulation Market Forecast 2019-2029 (US$ Billion, AGR %)
Figure 8.42: Wool Insulant is Estimated to be the Largest Type of Insulant in the ME Building Thermal Insulation Material Market (US Billion)
Figure 8.43: South Africa Building Thermal Insulation Market Forecast 2019-2029 (US$ Billion, AGR %)
Figure 8.44: Wool Insulant is Estimated to be the Largest Type of Insulant in the South Africa Building Thermal Insulation Material Market (US Billion)
Figure 9.1 Porter’s Five Forces in Building Thermal Insulation Market Analysis
Figure 10.1 Arkema SA Sales 2015-2018 (US$m, AGR %)
Figure 10.2 Arkema SA Net Income 2015-2018 (US$m, AGR %)
Figure 10.3 Arkema SA Organizational Structure 2018
Figure 10.4 Arkema SA Primary Market Competitors 2018
Figure 10.5 BASF SE Sales 2015-2018 (US$m, AGR %)
Figure 10.6 BASF SE Net Income 2015-2018 (US$m, AGR %)
Figure 10.7 BASF SE Organisational Structure 2018
Figure 10.8 BASF SE Primary Market Competitors 2018
Figure 10.9 Clariant AG Sales 2013-2017 (US$m, AGR %)
Figure 10.10 Clariant AG Net Income 2013-2017 (US$m, AGR %)
Figure 10.11 Clariant AG Business Segments 2017
Figure 10.12 Clariant AG Primary Market Competitors 2018
Figure 10.13 Covestro AG Sales 2015-2018 (US$m, AGR %)
Figure 10.14 Covestro AG Net Income 2015-2018 (US$m, AGR %)
Figure 10.15 Covestro AG Business Sectors 2018
Figure 10.16 Covestro AG Primary Market Competitors 2018
Figure 10.17 DowDuPont, Inc. Sales 2015-2018 (US$m, AGR %)
Figure 10.18 DowDuPont, Inc. Net Income 2015-2018 (US$m, AGR %)
Figure 10.19 DowDuPont, Inc. Business Divisions 2018
Figure 10.20 DowDuPont, Inc. Primary Market Competitors 2018
Figure 10.21 Eastman Chemical Co. Sales 2015-2018 (US$m, AGR %)
Figure 10.22 Eastman Chemical Co. Net Income 2015-2018 (US$m, AGR %)
Figure 10.23 Eastman Chemical Co. Segment Information 2018
Figure 10.24 Eastman Chemical Co. Primary Market Competitors 2018
Figure 10.25 Evonik Industries AG Sales 2015-2018 (US$m, AGR %)
Figure 10.26 Evonik Industries AG Net Income 2015-2018(US$m, AGR %)
Figure 10.27 Evonik Industries AG Business Segments 2017
Figure 10.28 Evonik Industries AG Primary Market Competitors 2018
Figure 10.29 Fletcher Building Ltd. Sales 2015-2018 (US$m, AGR %)
Figure 10.30 Fletcher Building Ltd. Net Income 2015-2018 (US$m, AGR %)
Figure 10.31 Fletcher Building Ltd. Business Divisions 2018
Figure 10.32 Fletcher Building Ltd. Primary Market Competitors 2018
Figure 10.33 GAF Industries Inc. Primary Market Competitors 2018
Figure 10.34 Johns Manville Corp. Business Divisions 2018
Figure 10.35 Johns Manville Corp. Primary Market Competitors 2018
Figure 10.36 Kingspan Group PLC Sales 2013-2017 (US$m, AGR %)
Figure 10.37 Kingspan Group PLC Net Income 2013-2017 (US$m, AGR %)
Figure 10.38 Kingspan Group PLC Company Structure 2018
Figure 10.39 Kingspan Group PLC Primary Market Competitors 2018
Figure 10.40 Knauf Insulation Primary Market Competitors 2018
Figure 10.41 Masco Corp. Sales 2015-2018 (US$m, AGR %)
Figure 10.42 Masco Corp. Net Income 2015-2018 (US$m, AGR %)
Figure 10.43 Masco Corp. Company Structure 2018
Figure 10.44 Owens Corning Corporation Sales 2013-2017 (US$m, AGR %)
Figure 10.45 Owens Corning Corporation Net Income 2013-2017 (US$m, AGR %)
Figure 10.46 Owens Corning Corporation Market Sectors 2017
Figure 10.47 Owens Corning Corporation Primary Market Competitors 2018
List of Tables
Table 3.1 Global Building Thermal Insulation Market Forecast 2019-2029 (US$ Billion, AGR %, CAGR%, Cumulative)
Table 4.1 Building Thermal Insulation Market Forecast by Application 2019-2029 (US$ Billion, AGR %, CAGR %, Cumulative)
Table 4.2 Building Thermal Insulation Market by Application CAGR Forecast 2019-2024, 2024-2029, 2019-2029 (CAGR %)
Table 4.3 Roof Insulation Market Forecast by Application 2019-2029 (US$ Billion, AGR %, CAGR %, Cumulative)
Table 4.4 Global Roof Insulation Market by Application CAGR Forecast 2019-2024, 2024-2029, 2019-2029 (CAGR %)
Table 4.5 Wall Insulation Market Forecast by Application 2019-2029 (US$ Billion, AGR %, Cumulative)
Table 4.6 Global Wall Insulation Sub-Segments CAGR Forecast 2019-2024, 2024-2029, 2019-2029 (CAGR %)
Table 5.1: Key End Products & Applications of Building Insulations (Form, Insulation Material, Application)
Table 5.2: Temperature Ranges for Different Insulations Materials (Insulation Material, Low-Temperature Range, High-Temperature Range)
Table 5.3: R-Value by Type of Insulation (Insulation Material, R-Value Per Inch)
Table 5.4: Building Thermal Insulation Market Forecast by Material Type 2019-2029 (US$ Billion, AGR%, CAGR %, Cumulative)
Table 5.5 Global Building Thermal Insulation Market by Material Type CAGR Forecast 2019-2024, 2024-2029, 2019-2029 (CAGR %)
Table 5.6: Wool Insulation Market Forecast by Sub-Material Type 2019-2029 (US$ Billion, AGR%, CAGR %, Cumulative)
Table 5.7 Global Wool Insulation Market by Material Type CAGR Forecast 2019-2024, 2024-2029, 2019-2029 (CAGR %)
Table 5.8 Glass Wool Building Thermal Insulation Market by Regional Market Forecast 2019-2029 (US$ Billion, AGR %, CAGR %, Cumulative)
Table 5.9 Glass Wool Building Thermal Insulation Market by Region CAGR Forecast 2019-2024, 2024-2029, 2019-2029 (CAGR %)
Table 5.10 Stone Wool Building Thermal Insulation Market by Regional Market Forecast 2019-2029 (US$ Billion, AGR %, CAGR %, Cumulative)
Table 5.11 Stone Wool Building Thermal Insulation Market by Region CAGR Forecast 2019-2024, 2024-2029, 2019-2029 (CAGR %)
Table 5.12 Plastic Foam Building Thermal Insulation Market by Regional Market Forecast 2019-2029 (US$ Billion, AGR %, CAGR %, Cumulative)
Table 5.13 Plastic Foam Building Thermal Insulation Market by Region CAGR Forecast 2019-2024, 2024-2029, 2019-2029 (CAGR %)
Table 5.14 EPS Building Thermal Insulation Market by Regional Market Forecast 2019-2029 (US$ Billion, AGR %, CAGR %, Cumulative)
Table 5.15 XPS Building Thermal Insulation Market by Regional Market Forecast 2019-2029 (US$ Billion, AGR %, CAGR %, Cumulative)
Table 5.16 PUR Foams Building Thermal Insulation Market by Regional Market Forecast 2019-2029 (US$ Billion, AGR %, CAGR %, Cumulative)
Table 5.17 Other Materials Building Thermal Insulation Market by Regional Market Forecast 2019-2029 (US$ Billion, AGR %, CAGR %, Cumulative)
Table 5.18 Other Materials Building Thermal Insulation Market by Region CAGR Forecast 2019-2024, 2024-2029, 2019-2029 (CAGR %)
Table 6.1: Building Thermal Insulation Market Forecast by End-User 2019-2029 (US$ Billion, AGR%, CAGR %, Cumulative)
Table 6.2 Global Building Thermal Insulation Market by End-User CAGR Forecast 2019-2024, 2024-2029, 2019-2029 (CAGR %)
Table 6.3 Residential Building Thermal Insulation Market by Regional Market Forecast 2019-2029 (US$ Billion, AGR %, CAGR %, Cumulative)
Table 6.4 Residential Building Thermal Insulation Market by Region CAGR Forecast 2019-2024, 2024-2029, 2019-2029 (CAGR %)
Table 6.5 Commercial Building Thermal Insulation Market by Regional Market Forecast 2019-2029 (US$ Billion, AGR %, CAGR %, Cumulative)
Table 6.6 Commercial Building Thermal Insulation Market by Region CAGR Forecast 2019-2024, 2024-2029, 2019-2029 (CAGR %)
Table 7.1: Global Building Thermal Insulation Market by Regional Market Forecast 2019-2029 (US$ Billion, AGR %, CAGR %, Cumulative)
Table 7.2 Building Thermal Insulation Market by Region CAGR Forecast 2019-2024, 2024-2029, 2019-2029 (CAGR %)
Table 7.3 Building Thermal Insulation Market Forecast in North-America by Country 2019-2029 (US$ Billion, AGR %, Cumulative)
Table 7.4 Building Thermal Insulation Market Forecast in North-America by Country CAGR Forecast 2019-2024, 2024-2029, 2019-2029 (CAGR %)
Table 7.5 Building Thermal Insulation Market Forecast by Plastic Foams Sub-Market in North-America 2019-2029 (US$ Billion, AGR %, CAGR %, Cumulative)
Table 7.6 North America Building Thermal Insulation Market by Plastic Foams Sub-Market CAGR Forecast 2019-2024, 2024-2029, 2019-2029 (CAGR %)
Table 7.7: Western Europe Building Thermal Insulation Market Forecast by Country 2019-2029 (US$ Billion, AGR %, CAGR %, Cumulative)
Table 7.8 Western Europe Building Thermal Insulation Market by Country CAGR Forecast 2019-2024, 2024-2029, 2019-2029 (CAGR %)
Table 7.9 Building Thermal Insulation Market by Plastic Foams Sub-Market Forecast in Western Europe 2019-2029 (US$ Billion, AGR %, CAGR %, Cumulative)
Table 7.10 Western Europe Building Thermal Insulation Market by Plastic Foams Sub-Market CAGR Forecast 2019-2024, 2024-2029, 2019-2029 (CAGR %)
Table 7.11 Central & Eastern Europe Building Thermal Insulation Market by Leading Country Forecast 2019-2029 (US$ Billion, AGR %, CAGR %, Cumulative)
Table 7.12 Central & Eastern Europe Building Thermal Insulation Market by Country CAGR Forecast 2019-2024, 2024-2029, 2019-2029 (CAGR %)
Table 7.13 Central & Eastern Europe Building Thermal Insulation Market by Plastic Foams Type Forecast 2019-2029 (US$ Billion, AGR %, CAGR %, Cumulative)
Table 7.14 Central & Eastern Europe Building Thermal Insulation Market by Plastic Foams Sub-Market CAGR Forecast 2019-2024, 2024-2029, 2019-2029 (CAGR %)
Table 7.15 Asia-Pacific Building Thermal Insulation Market by Regional Market Forecast 2019-2029 (US$ Billion, AGR %, CAGR %, Cumulative)
Table 7.16 Glass Wool Building Thermal Insulation Market by Region CAGR Forecast 2019-2024, 2024-2029, 2019-2029 (CAGR %)
Table 7.17 Asia-Pacific Building Thermal Insulation Market Forecast by Plastic Foams Sub-Market 2019-2029 (US$ Billion, AGR %, CAGR %, Cumulative)
Table 7.18 MEA Building Thermal Insulation Market by Regional Market Forecast 2019-2029 (US$ Billion, AGR %, CAGR %, Cumulative)
Table 7.19 MEA Building Thermal Insulation Market by Region CAGR Forecast 2019-2024, 2024-2029, 2019-2029 (CAGR %)
Table 7.20 The Middle East and Africa Building Thermal Insulation Market by Plastic Foams Forecast 2019-2029 (US$ Billion, AGR %, Cumulative)
Table 7.21 South America Building Thermal Insulation by Country Market Forecast 2019-2029 (US$ Billion, AGR %, CAGR %, Cumulative)
Table 7.22 South America Building Thermal Insulation Market by Country CAGR Forecast 2019-2024, 2024-2029, 2019-2029 (CAGR %)
Table 7.23: South America Building Thermal Insulation Market by Plastic Foams Forecast 2019-2029 (US$ Billion, AGR %, Cumulative)
Table 7.24 South America Building Thermal Insulation Market by Plastic Foams CAGR Forecast 2019-2024, 2024-2029, 2019-2029 (CAGR %)
Table 8.1 U.S. Building Thermal Insulation Market Forecast by Type 2019-2029 (US$ Billion, AGR %, CAGR%, Cumulative)
Table 8.2 US Building Thermal Insulation Market by Type CAGR Forecast 2019-2024, 2024-2029, 2019-2029 (CAGR %)
Table 8.3 Canada Building Thermal Insulation Market Forecast by Type 2019-2029 (US$ Billion, AGR %, CAGR %, Cumulative)
Table 8.4 Canada Building Thermal Insulation Market by Type CAGR Forecast 2019-2024, 2024-2029, 2019-2029 (CAGR %)
Table 8.5 Mexico Building Thermal Insulation Market Forecast by Type 2019-2029 (US$ Billion, AGR %, CAGR%, Cumulative)
Table 8.6 Mexico Building Thermal Insulation Market by Type CAGR Forecast 2019-2024, 2024-2029, 2019-2029 (CAGR %)
Table 8.7 Germany Building Thermal Insulation Market Forecast by Type 2019-2029 (US$ Billion, AGR %, CAGR%, Cumulative)
Table 8.8 Germany Building Thermal Insulation Market by Type CAGR Forecast 2019-2024, 2024-2029, 2019-2029 (CAGR %)
Table 8.9 France Building Thermal Insulation Market Forecast by Type 2019-2029 (US$ Billion, AGR %, CAGR%, Cumulative)
Table 8.10 France Building Thermal Insulation Market by Type CAGR Forecast 2019-2024, 2024-2029, 2019-2029 (CAGR %)
Table 8.11 U.K. Building Thermal Insulation Market Forecast by Type 2019-2029 (US$ Billion, AGR %, CAGR%, Cumulative)
Table 8.12 UK Building Thermal Insulation Market by Type CAGR Forecast 2019-2024, 2024-2029, 2019-2029 (CAGR %)
Table 8.13 Italy Building Thermal Insulation Market by Type Forecast 2019-2029 (US$ Billion, AGR %, CAGR%, Cumulative)
Table 8.14 Italy Building Thermal Insulation Market by Type CAGR Forecast 2019-2024, 2024-2029, 2019-2029 (CAGR %)
Table 8.15 Spain Building Thermal Insulation Market Forecast by Type 2019-2029 (US$ Billion, AGR %, CAGR%, Cumulative)
Table 8.16 Spain Building Thermal Insulation Market by Type CAGR Forecast 2019-2024, 2024-2029, 2019-2029 (CAGR %)
Table 8.17 Poland Building Thermal Insulation Market Forecast by Type 2019-2029 (US$ Billion, AGR %, CAGR%, Cumulative)
Table 8.18 Poland Building Thermal Insulation Market by Type CAGR Forecast 2019-2024, 2024-2029, 2019-2029 (CAGR %)
Table 8.19 Russia Building Thermal Insulation Market Forecast by Type 2019-2029 (US$ Billion, AGR %, CAGR%, Cumulative)
Table 8.20 Russia Building Thermal Insulation Market by Type CAGR Forecast 2019-2024, 2024-2029, 2019-2029 (CAGR %)
Table 8.21 China Building Thermal Insulation Market by Type Forecast 2019-2029 (US$ Billion, AGR %, CAGR%, Cumulative)
Table 8.22 China Building Thermal Insulation Market by Type CAGR Forecast 2019-2024, 2024-2029, 2019-2029 (CAGR %)
Table 8.23 Japan Building Thermal Insulation Market Forecast by Type 2019-2029 (US$ Billion, AGR %, CAGR%, Cumulative)
Table 8.24 Japan Building Thermal Insulation Market by Type CAGR Forecast 2019-2024, 2024-2029, 2019-2029 (CAGR %)
Table 8.25 India Building Thermal Insulation Market Forecast by Type 2019-2029 (US$ Billion, AGR %, CAGR%, Cumulative)
Table 8.26 India Building Thermal Insulation Market by Type CAGR Forecast 2019-2024, 2024-2029, 2019-2029 (CAGR %)
Table 8.27 South Korea Building Thermal Insulation Market Forecast by Type 2019-2029 (US$ Billion, AGR %, CAGR%, Cumulative)
Table 8.28 South Korea Building Thermal Insulation Market by Type CAGR Forecast 2019-2024, 2024-2029, 2019-2029 (CAGR %)
Table 8.29 Philippine Building Thermal Insulation Market Forecast by Type 2019-2029 (US$ Billion, AGR %, CAGR%, Cumulative)
Table 8.30 Philippine Building Thermal Insulation Market by Type CAGR Forecast 2019-2024, 2024-2029, 2019-2029 (CAGR %)
Table 8.31 Indonesia Building Thermal Insulation Market Forecast by Type 2019-2029 (US$ Billion, AGR %, CAGR%, Cumulative)
Table 8.32 Indonesia Building Thermal Insulation Market by Type CAGR Forecast 2019-2024, 2024-2029, 2019-2029 (CAGR %)
Table 8.33 Malaysia Building Thermal Insulation Market Forecast by Type 2019-2029 (US$ Billion, AGR %, CAGR%, Cumulative)
Table 8.34 Malaysia Building Thermal Insulation Market by Type CAGR Forecast 2019-2024, 2024-2029, 2019-2029 (CAGR %)
Table 8.35 Vietnam Building Thermal Insulation Market by Type Forecast 2019-2029 (US$ Billion, AGR %, CAGR%, Cumulative)
Table 8.36 Vietnam Building Thermal Insulation Market by Type CAGR Forecast 2019-2024, 2024-2029, 2019-2029 (CAGR %)
Table 8.37 Brazil Building Thermal Insulation Market Forecast by Type 2019-2029 (US$ Billion, AGR %, CAGR%, Cumulative)
Table 8.38 Brazil Building Thermal Insulation Market by Type CAGR Forecast 2019-2024, 2024-2029, 2019-2029 (CAGR %)
Table 8.39 Argentina Building Thermal Insulation Market Forecast by Type 2019-2029 (US$ Billion, AGR %, CAGR%, Cumulative)
Table 8.40 Argentina Building Thermal Insulation Market by Type CAGR Forecast 2019-2024, 2024-2029, 2019-2029 (CAGR %)
Table 8.41 ME Building Thermal Insulation Market Forecast by Type 2019-2029 (US$ Billion, AGR %, CAGR%, Cumulative)
Table 8.42 ME Building Thermal Insulation Market by Type CAGR Forecast 2019-2024, 2024-2029, 2019-2029 (CAGR %)
Table 8.43 South Africa Building Thermal Insulation Market Forecast by Type 2019-2029 (US$ Billion, AGR %, CAGR%, Cumulative)
Table 8.44 South Africa Building Thermal Insulation Market by Type CAGR Forecast 2019-2024, 2024-2029, 2019-2029 (CAGR %)
Table 10.1 Arkema SA Profile 2019 (CEO, HQ, Founded, No. of Employees, Website)
Table 10.2 Selected Recent Arkema SA Building Thermal Insulation Market Developments 2017-2018 (Date, Strategy, Details)
Table 10.3 Arkema SA Sales 2015-2018 (US$m, AGR %)
Table 10.4 Arkema SA Net Income 2015-2018 (US$m, AGR %)
Table 10.5 Arkema SA Building Thermal Insulation Market Products / Services (Segment of Business, Product, Specification / Features)
Table 10.6 Arkema SA: Key Financial Ratios 2018
Table 10.7 Arkema SA SWOT Analysis 2018
Table 10.8 BASF SE Profile 2019 (Business Segment in the Market, HQ, Founded, No. of Employees, Website)
Table 10.9 Selected Recent BASF SE Building Thermal Insulation Market Developments 2014-2018 (Date, Strategy, Details)
Table 10.10 BASF SE Sales 2015-2018 (US$m, AGR %)
Table 10.11 BASF SE Net Income 2015-2018 (US$m, AGR %)
Table 10.12 BASF SE Building Thermal Insulation Market Products / Services (Segment of Business, Product, Specification / Features)
Table 10.13 BASF SE: Key Financial Ratios 2018
Table 10.14 BASF SE SWOT Analysis 2018
Table 10.15 Clariant AG Profile 2019 (CEO, Business Segment in the Market, HQ, Founded, No. of Employees, Website)
Table 10.16 Selected Recent Clariant AG Building Thermal Insulation Market Developments 2016-2018 (Date, Strategy, Details)
Table 10.17 Clariant AG Sales 2013-2017 (US$m, AGR %)
Table 10.18 Clariant AG Net Income 2013-2017 (US$m, AGR %)
Table 10.19 Clariant AG Building Thermal Insulation Market Products / Services (Segment of Business, Product, Specification / Features)
Table 10.20 Clariant AG: Key Financial Ratios 2018
Table 10.21 Clariant AG SWOT Analysis 2018
Table 10.22 Covestro AG Profile 2019 (CEO, Business Segment in the Market, HQ, Founded, No. of Employees, Website)
Table 10.23 Selected Recent Covestro AG Building Thermal Insulation Market Developments 2017-2018 (Date, Strategy, Details)
Table 10.24 Covestro AG Sales 2015-2018 (US$m, AGR %)
Table 10.25 Covestro AG Net Income 2013-2017 (US$m, AGR %)
Table 10.26 Covestro AG Building Thermal Insulation Market Products / Services (Segment of Business, Product, Specification / Features)
Table 10.27 Covestro AG: Key Financial Ratios 2018
Table 10.28 Covestro AG SWOT Analysis 2018
Table 10.29 DowDuPont, Inc. Profile 2019 (CEO, Business Segment in the Market, HQ, Founded, No. of Employees, Website)
Table 10.30 Selected Recent DowDuPont, Inc. Building Thermal Insulation Market Developments 2016-2018 (Date, Strategy, Details)
Table 10.31 DowDuPont, Inc. Sales 2015-2018 (US$m, AGR %)
Table 10.32 DowDuPont, Inc. Net Income 2015-2018 (US$m, AGR %)
Table 10.33 DowDuPont, Inc. Building Thermal Insulation Market Products / Services (Segment of Business, Product, Specification / Features)
Table 10.34 DowDuPont, Inc.: Number of Manufacturing Sites 2018
Table 10.35 DowDuPont, Inc.: Key Financial Ratios 2017
Table 10.36 DowDuPont, Inc. SWOT Analysis 2018
Table 10.37 Eastman Chemical Co. Profile 2019 (CEO, Business Segment in the Market, HQ, Founded, No. of Employees, Website)
Table 10.38 Selected Recent Eastman Chemical Co. Building Thermal Insulation Market Developments 2016-2018 (Date, Strategy, Details)
Table 10.39 Eastman Chemical Co. Sales 2015-2018 (US$m, AGR %)
Table 10.40 Eastman Chemical Co. Net Income 2015-2018 (US$m, AGR %)
Table 10.41 Eastman Chemical Co. Building Thermal Insulation Market Products / Services (Product, Specification/Features)
Table 10.42 Eastman Chemical Co.: Key Financial Ratios 2018
Table 10.43 Eastman Chemical Co. SWOT Analysis 2018
Table 10.44 Evonik Industries AG Profile 2017 (CEO, Business Segment in the Market, HQ, Founded, No. of Employees, Website)
Table 10.45 Selected Recent Evonik Industries AG Building Thermal Insulation Market Developments 2015-2018 (Date, Strategy, Details)
Table 10.46 Evonik Industries AG Sales 2015-2018 (US$m, AGR %)
Table 10.47 Evonik Industries AG Net Income 2015-2018 (US$m, AGR %)
Table 10.48 Evonik Industries AG Building Thermal Insulation Market Products / Services (Segment of Business, Product, Specification / Features)
Table 10.49 Evonik Industries AG: Key Financial Ratios 2018
Table 10.50 Evonik Industries AG SWOT Analysis 2018
Table 10.51 Fletcher Building Ltd. Profile 2019 (CEO, Business Segment in the Market, HQ, Founded, No. of Employees, Website)
Table 10.52 Selected Recent Fletcher Building Ltd. Building Thermal Insulation Market Developments 2017-2018 (Date, Strategy, Details)
Table 10.53 Fletcher Building Ltd. Sales 2015-2018 (US$m, AGR %)
Table 10.54 Fletcher Building Ltd. Net Income 2015-2018 (US$m, AGR %)
Table 10.55 Fletcher Building Ltd. Building Thermal Insulation Market Products / Services (Product, Specification / Features)
Table 10.56 Fletcher Building Ltd.: Key Financial Ratios 2018
Table 10.57 Fletcher Building Ltd. SWOT Analysis 2018
Table 10.58 GAF Industries Inc. Profile 2019 (CEO, Business Segment in the Market, HQ, Founded, No. of Employees, Website)
Table 10.59 Selected Recent GAF Industries Inc. Building Thermal Insulation Market Developments 2013-2017 (Date, Strategy, Details)
Table 10.60 GAF Industries Inc. Building Thermal Insulation Market Products / Services (Segment of Business, Product, Specification / Features)
Table 10.61 GAF Industries Inc. SWOT Analysis 2018
Table 10.62 Johns Manville Corp. Profile 2019 (CEO, Business Segment in the Market, HQ, Founded, No. of Employees, Website)
Table 10.63 Selected Recent Johns Manville Corp. Building Thermal Insulation Market Developments 2016-2017 (Date, Strategy, Details)
Table 10.64 Johns Manville Corp. Building Thermal Insulation Market Products / Services (Segment of Business, Product, Specification / Features)
Table 10.65 Johns Manville Corp. SWOT Analysis 2018
Table 10.66 Kingspan Group PLC Profile 2019 (CEO, Business Segment in the Market, HQ, Founded, No. of Employees, Website)
Table 10.67 Selected Recent Kingspan Group PLC Building Thermal Insulation Market Developments 2016-2017 (Date, Strategy, Details)
Table 10.68 Kingspan Group PLC Sales 2013-2017 (US$m, AGR %)
Table 10.69 Kingspan Group PLC Net Income 2013-2017 (US$m, AGR %)
Table 10.70 Kingspan Group PLC Building Thermal Insulation Market Products / Services (Segment of Business, Product, Specification / Features)
Table 10.71 Kingspan Group PLC: Key Financial Ratios 2018
Table 10.72 Kingspan Group PLC SWOT Analysis 2018
Table 10.73 Knauf Insulation Profile 2019 (CEO, Business Segment in the Market, HQ, Founded, No. of Employees, Website)
Table 10.74 Selected Recent Knauf Insulation Building Thermal Insulation Market Developments (Date, Strategy, Details)
Table 10.75 Knauf Insulation Building Thermal Insulation Market Products / Services (Segment of Business, Product, Specification / Features)
Table 10.76 Knauf Insulation SWOT Analysis 2018
Table 10.77 Masco Corp. Profile 2019 (CEO, Business Segment in the Market, HQ, Founded, No. of Employees, Website)
Table 10.78 Selected Recent Masco Corp. Building Thermal Insulation Market Developments 2016-2018 (Date, Strategy, Details)
Table 10.79 Masco Corp. Sales 2015-2018 (US$m, AGR %)
Table 10.80 Masco Corp. Net Income 2015-2018 (US$m, AGR %)
Table 10.81 Masco Corp. Building Thermal Insulation Market Products / Services (Segment of Business, Product)
Table 10.82 Masco Corp.: Key Financial Ratios 2018
Table 10.83 Owens Corning Corporation Profile 2019 (CEO, Business Segment in the Market, HQ, Founded, No. of Employees, Website)
Table 10.84 Selected Recent Owens Corning Corporation Building Thermal Insulation Market Developments 2016-2018 (Date, Strategy, Details)
Table 10.85 Owens Corning Corporation Sales 2013-2017 (US$m, AGR %)
Table 10.86 Owens Corning Corporation Net Income 2013-2017 (US$m, AGR %)
Table 10.87 Owens Corning Corporation Building Thermal Insulation Market Products / Services (Segment of Business, Product, Specification / Features)
Table 10.88 Owens Corning Corporation: Key Financial Ratios 2018
Table 10.89 Owens Corning Corporation SWOT Analysis 2018
Table 10.90: Other Leading Companies in Building Thermal Insulation Market (Company Name, Employees, Country/Region)
Andersen Corporation
Arkema SA
Arrow Fastener
Aspen Aerogels, Inc.
Atlas Roofing Corporation
BASF SE
Bigbloc Construction Ltd.
Boise Cascade Co.
Bremhove NV
CertainTeed Corporation
Clariant AG
coBuilder
Compagnie de Saint-Gobain SA
Component Hardware Group Inc.
Construction Products Association
Covestro AG
CSR Ltd.
Deceuninck NV
Defence Construction (1951) Limited
Distribution International Inc.
DowDuPont, Inc.
Eastman Chemical Co.
Ecofys
Eidai Co., Ltd.
Ergon Capital Partners II NV
Etex Sa
Everest Industries Ltd.
Evonik Industries AG
Firestone Building Products Company Llc
Fletcher Building Ltd.
GAF Industries Inc.
GAF Materials Corporation
Gesellschaft fur UmfassendeAnalysen GmbH (GUA)
Gibraltar Industries, Inc.
Green Energy Group Ltd.
Guardian insulation
Haier
Hangzhou GreatStar Industrial Co., Ltd.
Hebel Haus Gmbh
HIL Ltd.
Huurre Iberica S.A.
Hyundai Development Co.
Implenia AG
Industrial Insulation Group, LLC
Industrial Nanotech, Inc.
JELD-WEN Holding, Inc.
Johns Manville Corp.
Kaycan Ltée
KCC Corp.
Kichler Lighting
Kingspan Group Plc
Kingspan tarec industrial Insulation, Ltd.
Knauf Insulation
Lakehouse Ltd.
LG Hausys, Ltd.
Masco Corp.
Mcconnell Dowell Corporation Limited
NBCC (India) Ltd.
Oldcastle Architectural Inc.
Omega Flex, Inc.
Owens Corning Corporation
Pactiv
Paroc Group
Peninsula Publishing
Pittsburgh Corning
Ply Gem Holdings, Inc.
Poliuretanos S.A.
Rectial
Rockwool International
Saudi Binladin Group Limited.
Setra Group AB
Siemens
Sika AG
Skamol A/S
SoCalGas
Southern California Edison
Stormking Plastics Limited
Synthesia Espanola S.A.
Synthesia Group
Taiwan Glass Industry Corp.
Teraplast SA
The Dow Chemical
ThyssenKrupp Steel Europe AG
Unifrax I LLC
va-Q-tec AG
Vicwest inc.
Watts Water Technologies, Inc.
XL Brands
Ykk Corporation
List of Other Organisations Mentioned in this Report
European Chemicals Agency (ECHA)
European manufacturers of Expanded Polystyrene (EUMEPS)
International Monetary Fund (IMF)
The Russian centre of Energy Efficiency
University of Michigan
US Department of Energy Studies