Industries > Construction > Rare Earth Metals Market Report 2019-2029
Rare Earth Metals Market Report 2019-2029
Forecasts by Product Type (Cerium, Lanthanum, Neodymium, Praseodymium, Yttrium, Dysprosium, Samarium, Europium, Gadolinium, Terbium and others) and by Application (Permanent Magnets, Metal alloys, Catalysts, Polishing Rare, Phosphors, Glass Additives, Ceramics and Others) PLUS Profiles of Leading Companies and Regional and Leading National Market Analysis
• Do you need definitive Rare Earth Metals market data?
• Succinct Rare Earth Metals market analysis?
• Technological insight?
• Clear competitor analysis?
• Actionable business recommendations?
Read on to discover how this definitive report can transform your own research and save you time.
The recent news on the mining industry: China Is beating the US in the Rare-Earths Game”, has led Visiongain to publish this timely report. The $9 Bn industry is expected to flourish in the next few years because of wide range of end-user applications. Key strategies adopted by the key players in this industry such as product enhancement; acquisitions & mergers; agreements & collaborations; and expansion is expected to feed through in the latter part of the decade driving growth to new heights. If you want to be part of this growing industry, then read on to discover how you can maximise your investment potential.
Report highlights
• 192 quantitative tables, charts, and graphs
• Analysis of key players in rare earth metals technologies
• Alkane Resources Ltd
• Arafura Resources
• Avalon Advanced Materials Inc.
• Canada Rare Earth Corporation
• China Minmetals Rare Earth Co., Ltd.
• Critical Elements Corp
• Galaxy Resources Limited
• Iluka Resources Limited
• Indian Rare Earths Limited
• Inner Mongolia Baotou Steel and Rare Earth Co., Ltd
• Lynas Corporation Limited
• Neo Performance Materials Inc
• Global Rare Earth Metals market outlook and analysis from 2019-2029
• Rare Earth Metals Market by Application forecasts and analysis from 2019-2029
• Permanent Magnets forecast 2019-2029
• Metal alloys forecast 2019-2029
• Catalysts forecast 2019-2029
• Polishing Rare forecast 2019-2029
• Phosphors forecast 2019-2029
• Glass additives forecast 2019-2029
• Ceramics forecast 2019-2029
• Others forecast 2019-2029
• Rare Earth Metals Market by Product Type analysis and potential from 2019-2029
• Cerium forecast 2019-2029
• Lanthanum forecast 2019-2029
• Neodymium forecast 2019-2029
• Praseodymium forecast 2019-2029
• Yttrium forecast 2019-2029
• Dysprosium forecast 2019-2029
• Samarium forecast 2019-2029
• Europium forecast 2019-2029
• Gadolinium forecast 2019-2029
• Terbium forecast 2019-2029
• Others forecast 2019-2029
• Regional and Leading National Rare Earth Metals Market forecasts from 2019-2029
• North America Rare Earth Metals Forecast 2019-2029
• US Rare Earth Metals Forecast 2019-2029
• Canada Rare Earth Metals Forecast 2019-2029
• Rest of North America Rare Earth Metals Forecast 2019-2029
• Europe Rare Earth Metals Forecast 2019-2029
• Russia Rare Earth Metals Forecast 2019-2029
• Rest of Europe Rare Earth Metals Forecast 2019-2029
• Asia Pacific Rare Earth Metals Forecast 2019-2029
• China Rare Earth Metals Forecast 2019-2029
• India Rare Earth Metals Forecast 2019-2029
• Rest of Asia Pacific Rare Earth Metals Forecast 2019-2029
• Latin America Rare Earth Metals Forecast 2019-2029
• Brazil Rare Earth Metals Forecast 2019-2029
• Rest of the World Rare Earth Metals Forecast 2019-2029
• Key questions answered
• What does the future hold for the Rare Earth Metals industry?
• Where should you target your business strategy?
• Which applications should you focus upon?
• Which disruptive technologies should you invest in?
• Which companies should you form strategic alliances with?
• Which company is likely to success and why?
• What business models should you adopt?
• What industry trends should you be aware of?
• Target audience
• Leading Rare Earth Metals companies
• Suppliers
• Contractors
• Technologists
• R&D staff
• Consultants
• Analysts
• CEO’s
• CIO’s
• COO’s
• Business development managers
• Investors
• Governments
• Agencies
• Industry organisations
• Banks
Visiongain is a trading partner with the US Federal Government
CCR Ref number: KD4R6
1.1 Global Rare Earth Metal Market Overview
1.2 Research Methodology
1.2.1 Primary Research
1.2.2 Secondary Research
1.2.3 Market Evaluation & Forecasting Methodology
1.3 Global Rare Earth Metal Market Segment
1.4 Overview of Findings
1.5 Why You Should Read This Report
1.6 How This Report Delivers?
1.7 Key Questions Answered by This Analytical Report
1.8 Frequently Asked Questions (FAQ)
1.9 How Is The Report Delivered?
1.10 Who Is This Report For?
1.11 Associated Visiongain Reports
2. Introduction to Rare Earth Metals Market
2.1 What Are Rare Earth Metals?
2.2 Definition and Scope of Rare Earth Metals
2.3 Product Type of Rare Earth Metals
2.3.1 Lanthanum
2.3.2 Cerium
2.3.3 Praseodymium
2.3.4 Neodymium
2.3.5 Samarium
2.3.6 Europium
2.3.7 Gadolinium
2.3.8 Dysprosium
2.3.9 Yttrium
2.4 Application of Rare Earth Metals
3. Global Rare Earth Metals Market 2019-2029
3.1 Global Rare Earth Metals Market Forecast 2019-2029
3.2 Global Rare Earth Metals Market Forecast by Region 2019-2029
3.3 Global Rare Earth Metals Production Forecast by Region 2019-2029
3.4 Global Rare Earth Metals Market Drivers 2019
3.4.1 Growing Potential Applications of Rare Earth Metals is Augmenting the Growth of the Market
3.4.2 Increased Growth in Hybrid Electric Vehicles Industry Sector
3.5 Global Rare Earth Metals Market Restraints 2019
3.5.1 High Cost and Challenges in the Processing of Rare Earth Ores are Hampering the Growth of Rare Earth Metal Market
4. Global Rare Earth Metal Market Forecast by Product 2019-2029
4.1 Global Rare Earth Metal Market Forecast by Product 2019-2029
4.2 Rare Earth Metals Market Share Forecast by Type 2019, 2024 and 2029
4.3 Global Rare Earth Metal Production by Product Forecast 2019-2029
4.4 Rare Earth Metals Market Production Share Forecast by Type 2019, 2024 and 2029
4.5 Cerium Rare Earth Metals Market Forecast 2019-2029
4.5.1 Cerium Rare Earth Metals Market Analysis 2019-2029
4.6 Lanthanum Rare Earth Metals Market Forecast 2019-2029
4.6.1 Lanthanum Rare Earth Metals Market Analysis 2019-2029
4.7 Neodymium Rare Earth Metals Market Forecast 2019-2029
4.7.1 Neodymium Rare Earth Metals Market Analysis 2019-2029
4.8 Praseodymium Rare Earth Metals Market Forecast 2019-2029
4.8.1 Praseodymium Rare Earth Metals Market Analysis 2019-2029
4.9 Yttrium Rare Earth Metals Market Forecast 2019-2029
4.9.1 Yttrium Rare Earth Metals Market Analysis 2019-2029
4.10 Dysprosium Rare Earth Metals Market Forecast 2019-2029
4.10.1 Dysprosium Rare Earth Metals Market Analysis 2019-2029
4.11 Samarium Rare Earth Metals Market Forecast 2019-2029
4.11.1 Samarium Rare Earth Metals Market Analysis 2019-2029
4.12 Europium Rare Earth Metals Market Forecast 2019-2029
4.12.1 Europium Rare Earth Metals Market Analysis 2019-2029
4.13 Gadolinium Rare Earth Metals Market Forecast 2019-2029
4.13.1 Gadolinium Rare Earth Metals Market Analysis 2019-2029
4.14 Terbium Rare Earth Metals Market Forecast 2019-2029
4.14.1 Terbium Rare Earth Metals Market Analysis 2019-2029
4.15 Other Rare Earth Metals Market Forecast 2019-2029
4.15.1 Other Rare Earth Metals Market Analysis 2019-2029
5. Global Rare Earth Metals Market by Application 2019-2029
5.1 Rare Earth Metals Market Outlook by Application 2019-2029
5.2 Rare Earth Metals Market by Application Market Share Forecast 2019, 2024 and 2029
5.3 Rare Earth Metals Market Production Outlook by Application 2019-2029
5.4 Rare Earth Metals Production Share Forecast by Application 2019, 2024 and 2029
5.5 Permanent Magnets Application Rare Earth Metals Market Forecast 2019-2029
5.5.1 Permanent Magnets Rare Earth Metals Market Analysis 2019-2029
5.6 Metal Alloys Application Rare Earth Metals Market Forecast 2019-2029
5.6.1 Metal Alloys Rare Earth Metals Market Analysis 2019-2029
5.7 Catalysts Application Rare Earth Metals Market Forecast 2019-2029
5.7.1 Catalysts Rare Earth Metals Market Analysis 2019-2029
5.8 Polishing Application Rare Earth Metals Market Forecast 2019-2029
5.8.1 Polishing Application Rare Earth Metals Market Analysis 2019-2029
5.9 Phosphors Application Rare Earth Metals Market Forecast 2019-2029
5.9.1 Phosphors Rare Earth Metals Market Analysis 2019-2029
5.10 Glass Additives Application Rare Earth Metals Market Forecast 2019-2029
5.10.1 Glass additives Rare Earth Metals Market Analysis 2019-2029
5.11 Ceramics Application Rare Earth Metals Market Forecast 2019-2029
5.11.1 Ceramics Rare Earth Metals Market Analysis 2019-2029
5.12 Other Applications Rare Earth Metals Market Forecast 2019-2029
5.12.1 Other Application Rare Earth Metals Market Analysis 2019-2029
6. The Leading Regional and National Rare Earth Metals Markets 2019-2029
6.1 An Overview of the Leading Regional Rare Earth Metals Markets 2019-2029
6.2 North America Rare Earth Metals Market Forecast 2019-2029
6.2.1 North America Rare Earth Metals Market Analysis 2019-2029
6.3 U.S. Rare Earth Metals Market Forecast 2019-2029
6.4 Canada Rare Earth Metals Market Forecast 2019-2029
6.4.1 Canada Rare Earth Metals Market Analysis 2019-2029
6.5 Rest of North America Rare Earth Metals Market Forecast 2019-2029
6.5.1 Rest of North America Rare Earth Metals Market Analysis 2019-2029
6.6 Europe Rare Earth Metals Market Forecast 2019-2029
6.6.1 Europe Rare Earth Metals Market Analysis 2019-2029
6.7 Russia Rare Earth Metals Market Forecast 2019-2029
6.7.1 Russia Rare Earth Metals Market Analysis 2019-2029
6.8 Rest of Europe Rare Earth Metals Market Forecast 2019-2029
6.8.1 Rest of Europe Rare Earth Metals Market Analysis 2019-2029
6.9 Asia Pacific Rare Earth Metals Market Forecast 2019-2029
6.9.1 Asia pacific Rare Earth Metals Market Analysis 2019-2029
6.10 China Rare Earth Metals Market Forecast 2019-2029
6.10.1 China Rare Earth Metals Market Analysis 2019-2029
6.11 India Rare Earth Metals Market Forecast 2019-2029
6.11.1 India Rare Earth Metals Market Analysis 2019-2029
6.12 Rest of Asia Pacific Rare Earth Metals Market Forecast 2019-2029
6.12.1 Rest of Asia pacific Rare Earth Metals Market Analysis 2019-2029
6.13 Latin America Rare Earth Metals Market Forecast 2019-2029
6.13.1 Latin America Rare Earth Metals Market Analysis 2019-2029
6.14 Brazil Rare Earth Metals Market Forecast 2019-2029
6.14.1 Brazil Rare Earth Metals Market Analysis 2019-2029
6.15 Rest of Latin America Rare Earth Metals Market Forecast 2019-2029
6.15.1 Rest of Latin America Rare Earth Metals Market Analysis 2019-2029
6.16 Rest of the World Rare Earth Metals Market Forecast 2019-2029
6.16.1 Rest of the World Rare Earth Metals Market Analysis 2019-2029
7. Leading Companies in the Rare Earth Metals Market 2019
7.1 Alkane Resources Ltd
7.1.1 Alkane Resources Ltd Basic Company Information, Manufacturing Base and Competitors
7.1.2 Alkane Resources Ltd Rare Earth Metals Product Category, Description
7.1.3 Alkane Resources Ltd Business Overview
7.2 Arafura Resources
7.2.1 Arafura Resource Basic Company Information, Manufacturing Base and Competitors
7.2.2 Arafura Resource Rare Earth Metals Product Category, Application and Specification
7.2.3 Arafura Resource Business Overview
7.3 Avalon Advanced Materials Inc.
7.3.1 Avalon Advanced Materials Inc. Basic Company Information, Manufacturing Base and Competitors
7.3.2 Avalon Advanced Materials Inc. Rare Earth Metals Product Category, Application and Specification
7.3.3 Avalon Advanced Materials Inc. Business Overview
7.4 China Minmetals Rare Earth Co., Ltd.
7.4.1 China Minmetals Rare Earth Co., Ltd. Basic Company Information, Manufacturing Base and Competitors
7.4.2 China Minmetals Rare Earth Co., Ltd. Rare Earth Metals Product Category, Application and Specification
7.4.2 China Minmetals Rare Earth Co., Ltd. Business Overview
7.5 Canada Rare Earth Corporation
7.5.1 Canada Rare Earth Corporation Basic Company Information, Manufacturing Base and Competitors
7.5.2 Canada Rare Earth Corporation Rare Earth Metal Product Category, Application and Specification
7.5.3 Canada Rare Earth Corporation Business Overview
7.6 Critical Elements Corp
7.6.1 Critical Elements Corp. Basic Company Information, Manufacturing Base and Competitors
7.6.2 Critical Elements Corp. Rare Earth Metal Products
7.6.2 Critical Elements Corp. Business Overview
7.7 Galaxy Resources Limited
7.7.1 Galaxy Resources Limited. Basic Company Information, Manufacturing Base and Competitors
7.7.2 Galaxy Resources Limited Rare Earth Metal Products
7.7.2 Galaxy Resources Limited. Business Overview
7.8 Inner Mongolia Baotou Steel and Rare Earth Co., Ltd.
7.8.1 Inner Mongolia Baotou Steel and Rare Earth Co., Ltd. Company Profile, Manufacturing Base and Competitors
7.8.2 Inner Mongolia Baotou Steel and Rare Earth Co., Ltd. Rare Earth Metals Product Category, Application and Specification
7.8.3 Inner Mongolia Baotou Steel and Rare Earth Co., Ltd. Business Overview
7.9 Iluka Resources Limited
7.9.1 Iluka Resources Limited. Basic Company Information, Manufacturing Base and Competitors
7.9.2 Iluka Resources Limited Rare Earth Metal Products
7.9.2 Iluka Resources Limited. Business Overview
7.10 Lynas Corporation Limited
7.10.1 Lynas Corporation Ltd Basic Company Information, Manufacturing Base and Competitors
7.10.2 Lynas Corporation Ltd Rare Earth Metal Products
7.10.3 Lynas Corporation Ltd Business Overview
7.11 Neo Performance Materials Inc.
7.11.1 Neo Performance Materials Inc. Basic Company Information, Manufacturing Base and Competitors
7.11.2 Neo Performance Materials Inc. Rare Earth Metals Product Category, Application and Specification
7.11.3 Neo Performance Materials Inc. Business Overview
8. Conclusion
8.1 Key Findings
Associated Visiongain Reports
Appendix B
Visiongain Report Evaluation Form
List of Figures
Figure 1.1: Rare Earth Metal Market Segmentation
Figure 3.1: Global Rare Earth Metals Market Forecast 2019-2029 ($Mn, AGR%)
Figure 3.2 Rare Earth Metals Market Share Forecast by Region 2019, 2024 and 2029 (% Share)
Figure 3.3: Global Rare Earth Metals Production Forecast 2019-2029 (Thousand Ton, AGR%)
Figure 3.4 Rare Earth Metals Production Share Forecast by Region 2019, 2024 and 2029 (% Share)
Figure 3.5: Rare Earth Metal Market Application Share 2018 (%)
Figure 4.1 Rare Earth Metals Market Share Forecast by Type 2019, 2024 and 2029 (% Share)
Figure 4.2 Rare Earth Metals Production Share Forecast by Type 2019, 2024 and 2029 (% Share)
Figure 4.3: Cerium Rare Earth Metals Market Forecast 2019-2029 (USD Billion, AGR%)
Figure 4.4: Cerium Rare Earth Metals Production Forecast 2019-2029 (Thousand Ton, AGR%)
Figure 4.5: Lanthanum Rare Earth Metals Market Forecast 2019-2029 (USD Billion, AGR%)
Figure 4.6: Lanthanum Rare Earth Metals Production Forecast 2019-2029 (Thousand Ton, AGR%)
Figure 4.7: Neodymium Rare Earth Metals Market Forecast 2019-2029 (USD Billion, AGR%)
Figure 4.8: Neodymium Rare Earth Metals Production Forecast 2019-2029 (Thousand Ton, AGR%)
Figure 4.9: Praseodymium Rare Earth Metals Market Forecast 2019-2029 (USD Billion, AGR%)
Figure 4.10: Praseodymium Rare Earth Metals Production Forecast 2019-2029 (Thousand Ton, AGR%)
Figure 4.11: Yttrium Rare Earth Metals Market Forecast 2019-2029 (USD Billion, AGR%)
Figure 4.12: Cerium Rare Earth Metals Production Forecast 2019-2029 (Thousand Ton, AGR%)
Figure 4.13: Dysprosium Rare Earth Metals Market Forecast 2019-2029 (USD Billion, AGR%)
Figure 4.14: Dysprosium Rare Earth Metals Production Forecast 2019-2029 (Thousand Ton, AGR%)
Figure 4.15: Samarium Rare Earth Metals Market Forecast 2019-2029 (USD Billion, AGR%)
Figure 4.16: Samarium Rare Earth Metals Production Forecast 2019-2029 (Thousand Ton, AGR%)
Figure 4.17: Europium Rare Earth Metals Market Forecast 2019-2029 (USD Billion, AGR%)
Figure 4.18: Europium Rare Earth Metals Production Forecast 2019-2029 (Thousand Ton, AGR%)
Figure 4.19: Gadolinium Rare Earth Metals Market Forecast 2019-2029 (USD Billion, AGR%)
Figure 4.20: Gadolinium Rare Earth Metals Production Forecast 2019-2029 (Thousand Ton, AGR%)
Figure 4.21: Terbium Rare Earth Metals Market Forecast 2019-2029 (USD Billion, AGR%)
Figure 4.22: Terbium Rare Earth Metals Production Forecast 2019-2029 (Thousand Ton, AGR%)
Figure 4.23: Other Rare Earth Metals Market Forecast 2019-2029 (USD Billion, AGR%)
Figure 4.24: Other Rare Earth Metals Production Forecast 2019-2029 (Thousand Ton, AGR%)
Figure 5.1 Rare Earth Metals Market Share Forecast by Application 2019, 2024 and 2029 (% Share)
Figure 5.2 Rare Earth Metals Production Share Forecast by Application 2019, 2024 and 2029 (% Share)
Figure 5.3: Permanent Magnets Rare Earth Metals Market Forecast 2019-2029 (USD Billion, AGR%)
Figure 5.4: Permanent Magnets Rare Earth Metals Production Forecast 2019-2029 (Thousand Ton, AGR%)
Figure 5.5: Metal Alloys Rare Earth Metals Market Forecast 2019-2029 (USD Billion, AGR%)
Figure 5.6: Metal Alloys Rare Earth Metals Production Forecast 2019-2029 (Thousand Ton, AGR%)
Figure 5.7: Catalysts Rare Earth Metals Market Forecast 2019-2029 (USD Billion, AGR%)
Figure 5.8: Catalysts Rare Earth Metals Production Forecast 2019-2029 (Thousand Ton, AGR%)
Figure 5.9: Polishing Rare Earth Metals Market Forecast 2019-2029 (USD Billion, AGR%)
Figure 5.10: Polishing Rare Earth Metals Production Forecast 2019-2029 (Thousand Ton, AGR%)
Figure 5.11: Phosphors Rare Earth Metals Market Forecast 2019-2029 (USD Billion, AGR%)
Figure 5.12: Phosphors Rare Earth Metals Production Forecast 2019-2029 (Thousand Ton, AGR%)
Figure 5.13: Glass additives Rare Earth Metals Revenue Market Forecast 2019-2029 (USD Billion, AGR%)
Figure 5.14: Glass Additives Rare Earth Metals Production Forecast 2019-2029 (Thousand Ton, AGR%)
Figure 5.15: Ceramics Rare Earth Metals Market Forecast 2019-2029 (USD Billion, AGR%)
Figure 5.16: Ceramics Rare Earth Metals Production Forecast 2019-2029 (Thousand Ton, AGR%)
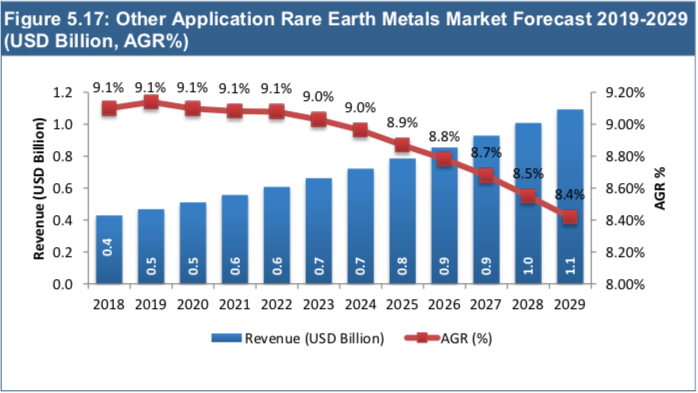
Figure 5.17: Other Application Rare Earth Metals Market Forecast 2019-2029 (USD Billion, AGR%)
Figure 5.18: Other Application Rare Earth Metals Production Forecast 2019-2029 (Thousand Ton, AGR%)
Figure 6.1: An Overview of the Leading Regional Rare Earth Metals Markets 2018 (USD Billion)
Figure 6.2: North America Rare Earth Metals Market Forecast 2019-2029 (USD Billion, AGR%)
Figure 6.3: North America Rare Earth Metals Production Forecast 2019-2029 (Thousand Ton, AGR%)
Figure 6.4 North America Rare Earth Metals Market Share Forecast by Country 2019, 2024 and 2029 (% Share)
Figure 6.5: U.S. Rare Earth Metals Market Forecast 2019-2029 (USD Million, AGR%)
Figure 6.6: U.S. Rare Earth Metals Production Forecast 2019-2029 (Tons, AGR%)
Figure 6.7: Canada Rare Earth Metals Market Forecast 2019-2029 (USD Million, AGR%)
Figure 6.8: Canada Rare Earth Metals Production Market Forecast 2019-2029 (Tons, AGR%)
Figure 6.9: Rest of North America Rare Earth Metals Market Forecast 2019-2029 (USD Million, AGR%)
Figure 6.10: Rest of North America Rare Earth Metals Production Forecast 2019-2029 (Tons, AGR%)
Figure 6.11: Europe Rare Earth Metals Revenue Market Forecast 2019-2029 (USD Billion, AGR%)
Figure 6.12: Europe Rare Earth Metals Production Market Forecast 2019-2029 (Thousand Ton, AGR%)
Figure 6.13: Europe Rare Earth Metals Market Share Forecast by Country 2019, 2024 and 2029 (% Share)
Figure 6.14: Russia Rare Earth Metals Market Forecast 2019-2029 (USD Million, AGR%)
Figure 6.15: Russia Rare Earth Metals Production Market Forecast 2019-2029 (Tons, AGR%)
Figure 6.16: Rest of Europe Rare Earth Metals Market Forecast 2019-2029 (USD Million, AGR%)
Figure 6.17: Rest of Europe Rare Earth Metals Production Forecast 2019-2029 (Tons, AGR%)
Figure 6.18: Asia Pacific Rare Earth Metals Market Forecast 2019-2029 (USD Billion, AGR%)
Figure 6.19: Asia Pacific Rare Earth Metals Production Forecast 2019-2029 (Thousand Ton, AGR%)
Figure 6.20: Asia Pacific Rare Earth Metals Market Share Forecast by Country 2019, 2024 and 2029 (% Share)
Figure 6.21: China Rare Earth Metals Revenue Market Forecast 2019-2029 (USD Million, AGR%)
Figure 6.22: China Rare Earth Metals Production Forecast 2019-2029 (Tons, AGR%)
Figure 6.23: India Rare Earth Metals Market Forecast 2019-2029 (USD Million, AGR%)
Figure 6.24: India Rare Earth Metals Production Forecast 2019-2029 (Tons, AGR%)
Figure 6.25: Rest of Asia Pacific Rare Earth Metals Market Forecast 2019-2029 (USD Million, AGR%)
Figure 6.26: Rest of Asia Pacific Rare Earth Metals Production Forecast 2019-2029 (Tons, AGR%)
Figure 6.27: Latin America Rare Earth Metals Market Forecast 2019-2029 (USD Billion, AGR%)
Figure 6.28: Latin America Rare Earth Metals Production Forecast 2019-2029 (Thousand Ton, AGR%)
Figure 6.29: Latin America Rare Earth Metals Market Share Forecast by Country 2019, 2024 and 2029 (% Share)
Figure 6.30: Brazil Rare Earth Metals Market Forecast 2019-2029 (USD MIllion, AGR%)
Figure 6.31: Brazil Rare Earth Metals Production Forecast 2019-2029 (Tons, AGR%)
Figure 6.32: Rest of Latin America Rare Earth Metals Market Forecast 2019-2029 (USD Million, AGR%)
Figure 6.33: Rest of Latin America Rare Earth Metals Production Market Forecast 2019-2029 (Tons, AGR%)
Figure 7.1: Alkane Resources Ltd., Revenue by Segment 2018 (% Share)
Figure 7.2: Alkane Resources Ltd., Revenue 2016-2018 (USD Million)
Figure 7.3: Arafura Resources Revenue 2015-2017 (USD Million, AGR%)
Figure 7.4: China Minmetals Rare Earth Co., Ltd., Revenue 2015-2017 (USD Million, AGR%)
Figure 7.5: Canada Rare Earth Corporation Revenue 2016-2018 (USD Million, AGR%)
Figure 7.6: Inner Mongolia Baotou Steel and Rare Earth Co., Ltd, Revenue 2015-2017 (USD Million, AGR%)
Figure 7.7: Iluka Resources Limited Revenue 2015-2017 (USD Million, AGR%)
Figure 7.8: Lynas Corporation, Ltd., Revenue 2016-2018 (USD Million, AGR%)
List of Tables
Table 3.1 Global Rare Earth Metals Market Forecast 2019-2029 ($Bn, AGR %, CAGR %, Cumulative)
Table 3.2 Global Rare Earth Metals Market Forecast by Region 2019-2029 ($Mn, AGR %, Cumulative)
Table 3.3: Global Rare Earth Metal Production Forecast 2019-2029 (Thousand Ton, AGR%, CAGR%, Cumulative)
Table 3.4 Global Rare Earth Metals Production Forecast by Region 2019-2029 (Thousands Ton, AGR %, Cumulative)
Table 4.1: Global Rare Earth Metals Market Forecast by Product 2019-2029 ($Bn, AGR %, Cumulative)
Table 4.2: Global Rare Earth Metals Production Forecast by Product 2019-2029 (Thousand Ton, AGR %, Cumulative)
Table 4.3 Cerium Rare Earth Metals Market Forecast 2019-2029 ($Bn, AGR %, CAGR %, Cumulative)
Table 4.4: Cerium Rare Earth Metal Production Forecast 2019-2029 (Thousand Ton, AGR%, CAGR%, Cumulative)
Table 4.5 Lanthanum Rare Earth Metals Market Forecast 2019-2029 ($Bn, AGR %, CAGR %, Cumulative)
Table 4.6: Lanthanum Rare Earth Metals Production Forecast 2019-2029 (Thousand Ton, AGR%, CAGR%, Cumulative)
Table 4.7 Neodymium Rare Earth Metals Market Forecast 2019-2029 ($Bn, AGR %, CAGR %, Cumulative)
Table 4.8: Neodymium Rare Earth Metals Production Forecast 2019-2029 (Thousand Ton, AGR%, CAGR%, Cumulative)
Table 4.9 Praseodymium Rare Earth Metals Market Forecast 2019-2029 ($Bn, AGR %, CAGR %, Cumulative)
Table 4.10: Praseodymium Rare Earth Metals Production Forecast 2019-2029 (Thousand Ton, AGR%, CAGR%, Cumulative)
Table 4.11 Yttrium Rare Earth Metals Market Forecast 2019-2029 ($Bn, AGR %, CAGR %, Cumulative)
Table 4.12: Yttrium Rare Earth Metals Production Forecast 2019-2029 (Thousand Ton, AGR%, CAGR%, Cumulative)
Table 4.13 Dysprosium Rare Earth Metals Market Forecast 2019-2029 ($Bn, AGR %, CAGR %, Cumulative)
Table 4.14: Dysprosium Rare Earth Metals Production Forecast 2019-2029 (Thousand Ton, AGR%, CAGR%, Cumulative)
Table 4.15 Samarium Rare Earth Metals Market Forecast 2019-2029 ($Bn, AGR %, CAGR %, Cumulative)
Table 4.16: Samarium Rare Earth Metals Production Forecast 2019-2029 (Thousand Ton, AGR%, CAGR%, Cumulative)
Table 4.17 Europium Rare Earth Metals Market Forecast 2019-2029 ($Bn, AGR %, CAGR %, Cumulative)
Table 4.18: Europium Rare Earth Metals Production Forecast 2019-2029 (Thousand Ton, AGR%, CAGR%, Cumulative)
Table 4.19 Gadolinium Rare Earth Metals Market Forecast 2019-2029 ($Bn, AGR %, CAGR %, Cumulative)
Table 4.20: Gadolinium Rare Earth Metals Production Forecast 2019-2029 (Thousand Ton, AGR%, CAGR%, Cumulative)
Table 4.21 Terbium Rare Earth Metals Market Forecast 2019-2029 ($Bn, AGR %, CAGR %, Cumulative)
Table 4.22: Terbium Rare Earth Metals Production Forecast 2019-2029 (Thousand Ton, AGR%, CAGR%, Cumulative)
Table 4.23 Other Rare Earth Metals Market Forecast 2019-2029 ($Bn, AGR %, CAGR %, Cumulative)
Table 4.24: Other Rare Earth Metals Production Forecast 2019-2029 (Thousand Ton, AGR%, CAGR%, Cumulative)
Table 5.1: Global Rare Earth Metals Market Revenue Forecast by Application 2019-2029 ($Bn, AGR %, Cumulative)
Table 5.2: Global Rare Earth Metals Market Production Forecast by Application 2019-2029 (Thousand Ton, AGR %, Cumulative)
Table 5.3 Permanent Magnets Rare Earth Metals Market Forecast 2019-2029 ($Bn, AGR %, CAGR %, Cumulative)
Table 5.4: Permanent Magnets Rare Earth Metals Production Forecast 2019-2029 (Thousand Ton, AGR%, CAGR%, Cumulative)
Table 5.5 Metal Alloys Rare Earth Metals Market Forecast 2019-2029 ($Bn, AGR %, CAGR %, Cumulative)
Table 5.6: Metal Alloys Rare Earth Metals Production Forecast 2019-2029 (Thousand Ton, AGR%)
Table 5.7 Catalysts Rare Earth Metals Market Forecast 2019-2029 ($Bn, AGR %, CAGR %, Cumulative)
Table 5.8: Catalysts Rare Earth Metals Production Forecast 2019-2029 (Thousand Ton, AGR%, CAGR%, Cumulative)
Table 5.9 Polishing Rare Earth Metals Market Forecast 2019-2029 ($Bn, AGR %, CAGR %, Cumulative)
Table 5.10: Polishing Rare Earth Metals Production Forecast 2019-2029 (Thousand Ton, AGR%, CAGR%, Cumulative)
Table 5.11 Phosphors Rare Earth Metals Market Forecast 2019-2029 ($Bn, AGR %, CAGR %, Cumulative)
Table 5.12: Phosphors Rare Earth Metals Production Forecast 2019-2029 (Thousand Ton, AGR%, CAGR%, Cumulative)
Table 5.13: Glass Additives Rare Earth Metals Market Revenue Forecast 2019-2029 ($Bn, AGR %, CAGR %, Cumulative)
Table 5.14 Glass Additives Rare Earth Metals Production Forecast 2019-2029 (Thousand Ton, AGR%, CAGR%, Cumulative)
Table 5.15 Ceramics Rare Earth Metals Market Forecast 2019-2029 ($Bn, AGR %, CAGR %, Cumulative)
Table 5.16: Ceramics Rare Earth Metals Production Forecast 2019-2029 (Thousand Ton, AGR%, CAGR%, Cumulative)
Table 5.17 Other Application Rare Earth Metals Market Forecast 2019-2029 ($Bn, AGR %, CAGR %, Cumulative)
Table 5.18: Other Application Rare Earth Metals Production Forecast 2019-2029 (Thousand Ton, AGR%, CAGR%, Cumulative)
Table 6.1: North America Rare Earth Metals Market Forecast 2019-2029 ($Bn, AGR %, CAGR %, Cumulative)
Table 6.2: North America Rare Earth Metals Production Forecast 2019-2029 (Thousand Ton, AGR%, CAGR%, Cumulative)
Table 6.3 U.S. Rare Earth Metals Market Forecast 2019-2029 ($mn, AGR %, CAGR %)
Table 6.4 U.S. Rare Earth Metals Production Forecast 2019-2029 (Tons, AGR%, CAGR%)
Table 6.5 Canada Rare Earth Metals Market Forecast 2019-2029 ($mn, AGR %, CAGR %)
Table 6.6 Canada Rare Earth Metals Production Forecast 2019-2029 (Ton, AGR%, CAGR%)
Table 6.7 Rest of North America Rare Earth Metals Market Forecast 2019-2029 ($mn, AGR %, CAGR %)
Table 6.8 Rest of North America Rare Earth Metals Production Forecast 2019-2029 (Tons, AGR%, CAGR%)
Table 6.9 Europe Rare Earth Metals Market Forecast 2019-2029 ($Bn, AGR %, CAGR %, Cumulative)
Table 6.10: Europe Rare Earth Metal Market Production Forecast 2019-2029 (Thousand Ton, AGR%, CAGR%, Cumulative)
Table 6.11 Russia Rare Earth Metals Market Revenue Forecast 2019-2029 ($mn, AGR %, CAGR %)
Table 6.12 Russia Rare Earth Metals Production Forecast 2019-2029 (Tons, AGR%, CAGR%)
Table 6.13 Rest of Europe Rare Earth Metals Market Forecast 2019-2029 ($Mn, AGR %, CAGR %)
Table 6.14 Rest of Europe Rare Earth Metals Production Forecast 2019-2029 (Tons, AGR%, CAGR%)
Table 6.15 Asia Pacific Rare Earth Metals Market Forecast 2019-2029 ($Bn, AGR %, CAGR %, Cumulative)
Table 6.16: Asia Pacific Rare Earth Metal Production Forecast 2019-2029 (Thousand Ton, AGR%, CAGR%, Cumulative)
Table 6.17: China Rare Earth Metals Market Forecast 2019-2029 ($Bn, AGR %, CAGR %)
Table 6.18: China Rare Earth Metals Production Forecast 2019-2029 (Thousand Ton, AGR%, CAGR%)
Table 6.19 India Rare Earth Metals Market Forecast 2019-2029 ($bn, AGR %, CAGR%)
Table 6.20 India Rare Earth Metals Production Forecast 2019-2029 (Tons, AGR%, CAGR%)
Table 6.21: Rest of Asia Rare Earth Metals Market Forecast 2019-2029 ($Bn, AGR %, CAGR %)
Table 6.22: Rest of Asia Rare Earth Metals Production Forecast 2019-2029 (Thousand Ton, AGR%, CAGR%, Cumulative)
Table 6.23: Latin America Rare Earth Metals Market Forecast 2019-2029 ($Bn, AGR %, CAGR %)
Table 6.24: Latin America Rare Earth Metals Production Forecast 2019-2029 Production (Thousand Ton, AGR%, CAGR%)
Table 6.25: Brazil Rare Earth Metals Market Forecast 2019-2029 ($Mn, AGR %, CAGR %)
Table 6.26: Brazil Rare Earth Metals Market Production Forecast 2019-2029 (Tona, AGR%, CAGR%)
Table 6.27: Rest of Latin America Rare Earth Metals Market Forecast 2019-2029 ($Mn, AGR %, CAGR %)
Table 6.28: Rest of Latin America Rare Earth Metals Production Forecast 2019-2029 (Tons, AGR%, CAGR%)
Table 7:1 Alkane Resources Ltd Profile 2019 (Website, Manufacturing Locations of Rare Earth Metals, Sales Area, Market Position or History, Economical Activities, Competitors, Contact Information)
Table 7.2 Alkane Resources Ltd. Rare Earth Metal Products (Product, Description)
Table 7.3: Alkane Resources Ltd Rare Earth Metal Market Revenue 2016-2018 ($m, AGR%)
Table 7.4 Arafura Resources Profile 2019 (Website, Manufacturing Locations of Rare Earth Metals, Sales Area, Market Position or History, Competitors, Contact Information)
Table 7.5: Arafura Resource Rare Earth Metal Products (Product, Applications)
Table 7.6: Arafura Resources Revenue 2015-2017 ($m, AGR%)
Table 7.7 Avalon Advanced Materials Inc. Profile 2019 (Website, Manufacturing Locations of Rare Earth Metals, Sales Area, Market Position or History, Competitors, Contact Information)
Table 7.8 Avalon Advanced Materials Inc Rare Earth Metal Products (Product, Description)
Table 7.9 China Minmetals Rare Earth Co., Ltd. Profile 2019 (Website, Manufacturing Locations of Rare Earth Metals, Sales Area, Market Position or History, Economical Activities, Competitors, Contact Information)
Table 7.10 China Minmetals Rare Earth Co., Ltd. Rare Earth Metal Products (Product, Product Category, Applications)
Table 7.11: China Minmetals Rare Earth Co., Ltd. Revenue 2015-2017 ($m, AGR%)
Table 7.12 Canada Rare Earth Corporation Profile 2019 (Website, Manufacturing Locations of Rare Earth Metals, Sales Area, Market Position or History, Economical Activities, Competitors, Contact Information)
Table 7.13 Canada Rare Earth Corporation Rare Earth Metal Products (Product, Description)
Table 7.14: Canada Rare Earth Corporation Company Revenue 2016-2018 ($m, AGR%)
Table 7.15 Critical Elements Corp. Profile 2019 (Website, Manufacturing Locations of Rare Earth Metals, Sales Area, Market Position or History, Economical Activities, Competitors, Contact Information)
Table 7.16 Critical Elements Corp. Rare Earth Metal Products (Product, Application)
Table 7.17 Galaxy Resources Limited. Profile 2019 (Website, Manufacturing Locations of Rare Earth Metals, Sales Area, Market Position or History, Economical Activities, Competitors, Contact Information)
Table 7.18 Galaxy Resources Limited Rare Earth Metal Products (Product, Application)
Table 7.19 Inner Mongolia Baotou Steel Hefa Rare Earth Co Ltd Profile 2019 (Website, Manufacturing Locations of Rare Earth Metals, Sales Area, Market Position or History, Economical Activities, Competitors, Contact Information)
Table 7.20 Inner Mongolia Baotou Steel and Rare Earth Co., Ltd. Rare Earth Metal Products (Product, Specifications, Description)
Table 7.21: Inner Mongolia Baotou Steel Hefa Rare Earth Co Ltd Revenue 2015-2017 ($m, AGR%)
Table 7.22 Iluka Resources Limited. Profile 2019 (Website, Manufacturing Locations of Rare Earth Metals, Sales Area, Market Position or History, Economical Activities, Competitors, Contact Information)
Table 7.23: Iluka Resources Limited Company Revenue 2015-2017 ($m, AGR%)
Table 7.24 Lynas Corporation Limited Profile 2019 (Website, Manufacturing Locations of Rare Earth Metals, Sales Area, Market Position or History, Competitors, Contact Information)
Table 7.25 Lynas Corporation Ltd Rare Earth Metal Products (Product, Application)
Table 7.26: Lynas Corporation, Ltd. Rare Earth Metal Market Revenue 2016-2018 ($m, AGR%)
Table 7.27 Neo Performance Materials Inc. Profile 2019 (Website, Manufacturing Locations of Rare Earth Metals, Sales Area, Market Position or History, Economical Activities, Competitors, Contact Information)
Table 7.28 Neo Performance Materials Inc. Rare Earth Metal Products (Product, Product Category, Applications)
Table 7.29 List of Other Companies in The Rare Earth Metals Market
Arafura Group Holdings Pty Ltd
Arafura Iron Pty Ltd
Arafura Rare Earths Pty Ltd
Arafura Resources
Arafura Uranium Pty Ltd
Arnold Magnetic Technologies
Avalon Advanced Materials Inc.
Avalon Rare Metal Incorporation
Baotou Damao Rare Earth Co., Ltd.
Baotou Hongtianyu Rare Earth Magnets Co.,Ltd
Baotou Huacheng Rare-earth
Baotou Huamei Rare Earth Hi-tech Co.,Ltd
Baotou Iron and Steel (Group) Co, Ltd
Baotou Iron and Steel and Rare Earths Corp
Baotou Jingrui New Materials Co.,Ltd
Baotou Rewin Rare Earth Metal Materials Co.,Ltd
Baotou Rhodia Rare Earth New Materials Co.,Ltd
Baotou Santoku Battery Materials Co.,Ltd
Baotou Tianjiao Seimi Polishing Powder Co.,Ltd
Baotou Xijun Rare Earth Co., Ltd.
Baotou Xinlong New Material Co., Ltd
Baotou Xinyuan Rare Earth Hi-Tech and New Material Co.,Ltd.
Canada Rare Earth Corporation
Canada Resources Co., Ltd
Changshu Shengchang Rare Earth Material Co.,Ltd
Changzhou Geoquin Nano New Material Co.Ltd
China Minmetals Rare Earth Co., Ltd.
China Minmetals Rare Earth Co., Ltd.
Conquest Mining Limited
Critical Elements Corp
Crucible Materials Corporation
Dandong JinLong Rare Earth Co., Ltd.
Deqing Xingbang New Materials Co., Ltd.
Deutsche Rohstoff
Dingnan Nanfang Rare Earth Co., Ltd.
Eck Industries
Eldorado Gold
Evolution Mining
Frontier Rare Earths
Funing Rare Earth Industry Co., Ltd
Galaxy Resources Limited
Gan County Jinying Rare Earth Industry Co., Ltd
Gansu Rare Earth New Material Limited-Liability Company
Ganzhou Bulaite New Material Co., Ltd
Ganzhou Chenguang Rare Earths New Material Co.,Ltd
Great Western Minerals Group Ltd
Greenland Minerals and Energy Ltd
Guangxi Hezhou Jinguang Rare Earth New Material Co., Ltd
Guangxi Non-ferrous Metal Group Jinyuan Rare Earth Co.,Ltd
Hohhot Rongxin New Metal Smelting Co., Ltd
Indian Rare Earths Limited (IREL)
Inner Mongolia Baotou Steel Hefa Rare Earth Co Ltd
Inner Mongolia Baotou Steel Rare-Earth (Group) Hi-Tech Co., Ltd
Japan Metals and Chemicals Ltd
Jiangsu Guosheng Rare Earth Co.,Ltd
Jiangxi Golden Century Advanced Materials Co.,Ltd
Kazakhstan National Mining Co. (Kazatomprom)
Kerala Minerals and Metals Limited
Landmark Alaska Limited Partnership
Landmark Minerals Inc
Landmark Minerals US
Lianyungang Ligang Rare Earth Industrial Co.,Ltd
Liyang Rhodia Rare Earth New Materials Co.,Ltd
Longnan Heli Rare Earth Smelter Co.,Ltd
Longnan Kaisheng Non-ferrous Metal Co., Ltd
Longnan Longyi Rare Earth Materials Co., Ltd.
Lovozersky Mining Company
Lynas Corporation, Ltd.
Magnesite Group
Matamec Explorations Inc
Mineral solutions LLC
Minerals and Metals Limited
Molycorp
Mt Weld Mining Pty Ltd
Mt Weld Rare Earths Pty Ltd
Neo Material Technologies Inc.
Northern Minerals
Premier Magnesia LLC
Qingyuan Jiahe Rare Metals Co., Ltd
Quannan Baotou Steel Jinghuan Rare Earth New Material Co., Ltd.
Quest Rare Minerals Ltd
Rare Earth One LLC
Rare Elements Resources Ltd
Renison Goldfields Consolidated
Sichuan Leshan Kebairui New Material Co., Ltd
Sichuan Leshan Ruifeng Co.,Ltd
Sichuan Mianning Fangxing Rare Earth Co., Ltd
Solikamsk Magnesium Works
Tantalus Rare Earths
Tasman Metals Ltd
Tesla
Thrace Gold Mines S.A
TUC Resources
Ucore Rare Metals Inc
Wanbao Rare Earth Separation Co.,Ltd
Westralian Sands
Xinfeng Baotou Steel Xinli Rare Earth Co., Ltd
Xinghua Rare Earth Co., Ltd
Xunwu Nanfang Rare Earth Co.,Ltd
Xuzhou Jinshi Pengyuan Rare Earth Material Factory
Yixing Xinwei Leeshing Rare Earth Co., Ltd.
Yiyang Hongyuan Rare Earth Co.,Ltd
List of Other Organisations Mentioned in this Report
Peking University
The Department of Energy
Download sample pages
Complete the form below to download your free sample pages for Rare Earth Metals Market Report 2019-2029
Related reports
-

Aerospace Composites Market Report 2018-2028
Aerospace composites represent a key part of the aerospace sector. This is due to the integral role they are currently...
Full DetailsPublished: 08 June 2018 -

Recycled Packaging Materials Market Report 2019-2029
The latest report from business intelligence provider, Visiongain offers a comprehensive analysis of the global Recycled Packaging Materials market. Visiongain...Full DetailsPublished: 29 March 2019 -

Carbon Fibre Reinforced Plastic (CFRP) Composites Market Report 2018-2028
With this definitive 204-page report you will receive a highly granular market analysis segmented by region, by application and by...Full DetailsPublished: 13 September 2018 -

3D Concrete Printing Market Report 2019-2029
Modern buildings and structures make fantastic use of defying convention and form and defying gravity at times. Because of the...Full DetailsPublished: 03 April 2019 -

Wearable Technology Market 2018-2028
Our 172-page report provides 134 tables, charts, and graphs. Read on to discover the most lucrative areas in the industry...
Full DetailsPublished: 16 January 2018 -

Top 20 Lithium-Ion Battery Manufacturing Companies 2018
The development of the automotive battery market is important for the automotive sector as batteries serve different automotive applications in...Full DetailsPublished: 09 August 2018 -

Geotextiles Market Report 2018-2028
Geotextiles are part of the geosynthetic group of materials which include geogrids, geomembranes, geopipes, geocomposites, geosynthetic clay liners, and geonets....
Full DetailsPublished: 24 October 2018 -

Top 20 Building Thermal Insulation Companies 2019
Visiongain assesses that the thermal insulation market is moderately concentrated with the top 20 companies accounting for just over 70%...Full DetailsPublished: 19 July 2019 -

Glass Packaging Market 2018-2028
Visiongain has calculated that the global Glass Packaging Market will see a capital expenditure (CAPEX) of $58.98 bn in 2018....
Full DetailsPublished: 20 February 2018 -

Automotive Composites Market Report 2019-2029
Visiongain has quantfied the automotive composites market at $18.51bn in 2019....Full DetailsPublished: 09 April 2019
Download sample pages
Complete the form below to download your free sample pages for Rare Earth Metals Market Report 2019-2029
Do you have any custom requirements we can help you with?
Any specific country, geo region, market segment or specific company information?
Email us today, we can discuss your needs and see how we can help: jamie.roberts@visiongain.com
Would you like a free report overview of the report of your choice?
If so, please drop an email to Jamie Roberts stating your chosen report title to jamie.roberts@visiongain.com
Visiongain construction reports are compiled using a broad and rich mixture of both primary and secondary information to produce an overall industry outlook. In order to provide our clients with the best product possible product, we do not rely on any one single source of information. Visiongain analysts reach out to market-leading vendors and automotive industry experts but also review a wealth of financial data and product information from a vast range of sources. To find out more about our reports methodology please email jamie.roberts@visiongain.com
Would you like to get the latest Visiongain construction reports catalogue?
What are the dynamic growth sectors? where are the regional business opportunities?
Which technologies will prevail and who are the leading companies succeeding in these sectors and why?
If you want definitive answers to business critical questions, discover Visiongain’s full range of business intelligence reports.
If so, please email Jamie Roberts on jamie.roberts@visiongain.com or call her today on +44 207 336 6100
Latest Construction news
Visiongain Publishes Carbon Fibre Reinforced Plastic (CFRP) Composites Market Report 2024-2034
The global Carbon Fibre Reinforced Plastic (CFRP) Composites market was valued at US$23.88 billion in 2024 and is projected to grow at a CAGR of 9.9% during the forecast period 2024-2034.
27 November 2023
Visiongain Publishes Magnesium Alloys Market Report 2023-2033
The global Magnesium Alloys market was valued at US$1,550.6 million in 2022 and is projected to grow at a CAGR of 7.3% during the forecast period 2023-2033
25 May 2023
Visiongain Publishes Steel Market Report 2021-2031
Growing urbanisation in emerging countries will aid infrastructure development in areas such as transportation and energy. The manufacturing and transportation sectors, which largely source and deliver raw materials for the fabrication of consumer goods, will benefit from economic success.
27 October 2021
Visiongain Publishes High Temperature Composite Resin Market Report 2021-2031
The penetration of lightweight composites in the development of advanced engine technology requiring high thermal stability fueled the growth of high temperature matrix systems.
19 July 2021
