Geotextiles are part of the geosynthetic group of materials which include geogrids, geomembranes, geopipes, geocomposites, geosynthetic clay liners, and geonets. A wide range of sectors have used geotextiles since 1950. The first geotextiles were woven industrial fabrics. Initially, they were used for waterfront structures, then the first nonwoven geotextiles for construction purposes were developed.
Visiongain calculates the global geotextile market is worth $7.05bn in 2018. China, India and the US are the biggest markets, each with a significant share in 2018. These are followed by the Danish and Dutch markets. Argentina, China and Germany have the most dynamic growth among the national markets, although this varies by process and application.
Visiongain’s report reveals where these market growth opportunities are, keeping you informed and ahead of your competitors. Gain that competitive advantage.
This report answers questions such as:
• How is the geotextiles market evolving?
• What are the drivers and restraints of the geotextiles market?
• What are the market shares of the materials, applications, delivery systems and products of the geotextiles market in 2018?
• How will each geotextiles submarket by material, applications and manufacturing process grow over the forecast period and how much revenue will these submarkets account for in 2028?
• Which trends and developments will prevail and how will these shifts be responded to?
• How will political factors influence the regional geotextiles markets and submarkets?
• Will leading national geotextiles markets broadly follow the macroeconomic dynamics, or will individual country sectors outperform the rest of the economy?
• How will the market shares of the geotextiles national markets change by 2028 and which geographical region will lead the market in 2028?
• Who are the leading geotextiles players and what are their prospects over the forecast period?
Reasons why you must order and read this report today:
• The report provides detailed profiles of 15 leading companies operating within the geotextile market:
– Agru America Inc.
– Belton Industries Inc.
– Carthage Mills, Inc.
– Contech Engineered Solutions LLC
– Don & Low Ltd
– E. I. Du Pont De Nemours & Company
– Fibertex Nonwoven A/S
– GSE Environmental/ Solmax GSE
– HOV Environment Solutions Pvt. Ltd.
– Huesker Synthetic GmbH & Co.
– Koninklijke Ten Cate bv
– Minerals Technologies Inc.
– Officine Maccaferri Spa
– Strata Systems, Inc.
– TERRAM Geosynthetics
• The study reveals the geotextile market forecast by regional and national markets from 2018 to 2028:
– North America Geotextile Market 2018-2028
– United States of America Geotextile Market 2018-2028
– Canada Geotextile Market 2018-2028
– Mexico Geotextile Market 2018-2028
– Europe Geotextile Market 2018-2028
– Russian Geotextile Market 2018-2028
– Italian Geotextile Market 2018-2028
– Denmark Geotextile Market 2018-2028
– Netherlands Geotextile Market 2018-2028
– UK Geotextile Market 2018-2028
– German Geotextile Market 2018-2028
– Rest of Europe Geotextile Market 2018-2028
– Asia Pacific Geotextile Market 2018-2028
– Chinese Geotextile Market 2018-2028
– Indian Geotextile Market 2018-2028
– Japanese Geotextile Market 2018-2028
– Rest of Asia Pacific Geotextile Market 2018-2028
– Latin America Geotextile Market 2018-2028
– Brazilian Geotextile Market 2018-2028
– Argentina Geotextile Market 2018-2028
– Rest of Latin America Geotextile Market 2018-2028
– MEA Geotextile Market 2018-2028
– United Arab Emirates (UAE) Geotextile Market 2018-2028
– Rest of MEA Geotextile Market 2018-2028
– South Africa Geotextile Market 2018-2028
• Our overview also forecasts geotextile applications from 2018 to 2028:
– Road Construction Submarket Forecast 2018-2028
– Waste and Landfill Submarket Forecast 2018-2028
– Water Construction Submarket Forecast 2018-2028
– Agriculture Submarket Forecast 2018-2028
– Railroad Sumarket Forecast 2018-2028
– Other Applications Submarket Forecast 2018-2028
• Our study also forecasts geotextile product type submarkets from 2018 to 2028:
– Nonwoven Submarket Forecast 2018-2028
– Woven Submarket Forecast 2018-2028
– Knitted Submarket Forecast 2018-2028
• Our analysis also forecasts geotextile material submarkets from 2018 to 2028:
– Polypropylene Submarket 2018-2028
– Polyethylene Submarket 2018-2028
– Polyester Submarket Forecast 2018-2028
How will you benefit from this report?
This comprehensive report will:
• Enhance your strategic decision making
• Full understanding and potential business opportunities in the geotextiles market
• Show which emerging market opportunities to focus upon.
• Increase your Industry knowledge and positioning in the geotextiles market
• Run a successfully a new marketing strategy
• Build new partnerships available in the geotextiles market
• Keep you up to date with crucial geotextiles market developments and issues
• Allow you to develop informed growth strategies
• Build your technical and management market insight
• Illustrate trends to develop new business opportunities
• Strengthen your analysis of competitors’ innovation and its market penetration.
• Provide risk analysis, helping you avoid the pitfalls other companies could make
• Ultimately. Engage effectively your internal and external stakeholders.
Competitive advantage
This independent 238-page report guarantees you will remain better informed than your competition. With 335 tables and figures examining the geotextile market space, leading market forecasts, as well as analysis from 2018-2028, the report will help you to design an effective sales strategy.
Don’t miss out
This report is essential reading for you or anyone with a desire to penetrate the geotextiles market analysis or increase sales. Purchasing this report today will help you to recognise those important market opportunities and understand the possibilities there. We look forward to receiving your order.
Visiongain is a trading partner with the US Federal Government
CCR Ref number: KD4R6
1. Report Overview
1.1 Global Geotextiles Market Definition and Research Scope
1.2 Geotextiles Market Segmentation
1.3 How this Report Delivers
1.4 Key Questions Answered by this Analytical Report Include
1.5 Why You Should Read This Report
1.6 Methodology
1.7 Frequently Asked Questions (FAQ)
1.8 Associated Visiongain Reports
1.9 About Visiongain
2. Introduction to Geotextiles Market
2.1 What are Geotextiles?
2.2 Types of Geotextiles
2.3 The Advantages of Geotextiles
2.4 Value Chain Analysis of Geotextiles Market
3. Analysis of Geotextiles Market 2018-2028
3.1 Geotextiles Market Overview
3.2 Global Geotextile Market Forecast 2018-2028
3.3 Drivers & Restraints of the Global Geotextile Market 2018-2028
3.4 Factors Driving the Demand of Geotextiles
3.5 Challenges in the Geotextiles Market
3.6 Opportunities for Growth of Geotextiles Market
3.7 Geotextiles Market Trends and Developments
3.8 SWOT Analysis of Geotextiles Market, 2018-2028
4. Global Geotextile Material Submarket Forecasts 2018-2028
4.1 An Overview of the Geotextile Material Submarkets 2018-2028
4.2 Polypropylene Market Forecast and Analysis 2018-2028
4.2.1 Polypropylene Market Forecast 2018-2028
4.2.2 Polypropylene Market Analysis 2018-2028
4.3 Polyethylene Market Forecast and Analysis 2018-2028
4.3.1 Polyethylene Market Forecast 2018-2028
4.3.2 Polyethylene Market Analysis 2018-2028
4.4 Polyester Market Forecast and Analysis 2018-2028
4.4.1 Polyester Market Forecast 2018-2028
4.4.2 Polyester Market Analysis 2018-2028
4.5 Other Materials Market Forecast and Analysis 2018-2028
4.5.1 Other Materials Market Forecast 2018-2028
4.5.2 Other Materials Market Analysis 2018-2028
5. Global Geotextile Product Type Submarket Forecasts 2018-2028
5.1 An Overview of the Geotextile Product Type Submarkets 2018-2028
5.2 Non-woven Product Type Market Forecast and Analysis 2018-2028
5.2.1 Non-woven Product Type Market Forecast 2018-2028
5.2.2 Non-woven Product Type Market Analysis 2018-2028
5.3 Woven Product Type Market Forecast and Analysis 2018-2028
5.3.1 Woven Product Type Market Forecast 2018-2028
5.3.2 Woven Product Type Market Analysis 2018-2028
5.4 Knitted Product Type Market Forecast and Analysis 2018-2028
5.4.1 Knitted Product Type Market Forecast 2018-2028
5.4.2 Knitted Product Type Market Analysis 2018-2028
6. Global Geotextile Application Submarket Forecasts 2018-2028
6.1 An Overview of the Geotextile Application Submarkets 2018-2028
6.2 Road Construction Market Forecast and Analysis 2018-2028
6.2.1 Road Construction Submarket Forecast 2018-2028
6.2.2 Road Construction Market Analysis 2018-2028
6.3 Waste and Landfill Market Forecast and Analysis 2018-2028
6.3.1 Waste and Landfill Market Forecast 2018-2028
6.3.2 Waste and Landfill Market Analysis 2018-2028
6.4 Water Construction Market Forecast and Analysis 2018-2028
6.4.1 Water Construction Market Forecast 2018-2028
6.4.2 Water Construction Market Analysis 2018-2028
6.5 Agriculture Market Forecast and Analysis 2018-2028
6.5.1 Agriculture Market Forecast 2018-2028
6.5.2 Agriculture Market Analysis 2018-2028
6.6 Railroad Market Forecast and Analysis 2018-2028
6.6.1 Railroad Market Forecast 2018-2028
6.6.2 Railroad Market Analysis 2018-2028
6.7 Other Applications Market Forecast and Analysis 2018-2028
6.7.1 Other Applications Market Forecast 2018-2028
6.7.2 Other Applications Market Analysis 2018-2028
7. North America Geotextile Market 2018-2028
7.1 An Overview of the North America Geotextile Market 2018-2028
7.2 North America Geotextile Market Share Forecasts by Country 2018-2028
7.3 The United States of America Geotextile Market 2018-2028
7.4 Canada Geotextile Market 2018-2028
7.5 Mexico Geotextile Market 2018-2028
8. Europe Geotextile Market 2018-2028
8.1 An Overview of the Europe Geotextile Market 2018-2028
8.2 Europe Geotextile Market Share Forecast by Country 2018-2028
8.3 UK Geotextile Market 2018-2028
8.4 Denmark Geotextile Market 2018-2028
8.5 Netherlands Geotextile Market 2018-2028
8.6 Germany Geotextile Market 2018-2028
8.7 Italy Geotextile Market 2018-2028
8.8 Russia Geotextile Market 2018-2028
8.9 Rest of Europe Geotextile Market 2018-2028
9. Asia-Pacific Geotextile Market 2018-2028
9.1 An Overview of the Asia-Pacific Geotextile Market 2018-2028
9.2 Asia-Pacific Geotextile Market Share Forecast by Country 2018-2028
9.3 China Geotextile Market 2018-2028
9.4 Japan Geotextile Market 2018-2028
9.5 India Geotextile Market 2018-2028
9.6 Rest of Asia-Pacific Geotextile Market 2018-2028
10. Latin America Geotextile Market 2018-2028
10.1 An Overview of the Latin America Geotextile Market 2018-2028
10.2 Latin America Geotextile Market Share Forecast by Country 2018-2028
10.3 Brazil Geotextile Market 2018-2028
10.4 Argentina Geotextile Market 2018-2028
10.5 Rest of Latin America Geotextile Market 2018-2028
11. MEA Geotextile Market 2018-2028
11.1 An Overview of the MEA Geotextile Market 2018-2028
11.2 MEA Geotextile Market Share Forecast by Country 2018-2028
11.3 The United Arab Emirates (UAE) Geotextile Market 2018-2028
11.4 South Africa Geotextile Market 2018-2028
11.5 Rest of MEA Geotextile Market 2018-2028
12. Leading Companies in the Global Geotextiles Market 2018
12.1 Agru America Inc
12.1.1 Agru America Inc Company Overview
12.1.2 Agru America Inc Company Performance
12.1.3 Agru America Inc Recent Developments
12.2 Belton Industries Inc.
12.2.1 Belton Industries Inc. Company Overview
12.2.2 Belton Industries Inc. Company Performance
12.2.3 Belton Industries Inc. Recent Developments
12.3 Carthage Mills, Inc.
12.3.1 Carthage Mills, Inc. Company Overview
12.3.2 Carthage Mills, Inc. Company Performance
12.3.3 Carthage Mills, Inc. Recent Developments
12.4 Contech Engineered Solutions LLC
12.4.1 Contech Engineered Solutions LLC Company Overview
12.4.2 Contech Engineered Solutions LLC Company Performance
12.4.3 Contech Engineered Solutions LLC Recent Developments
12.5 Don & Low Ltd
12.5.1 Don and Low Ltd Company Overview
12.5.2 Don and Low Ltd Company Performance
12.5.3 Don and Low Ltd Recent Developments
12.6 E. I. Du Pont De Nemours & Company
12.6.1 E. I. Du Pont De Nemours & Company Overview
12.6.2 E. I. Du Pont De Nemours & Company Performance
12.7 Fibertex Nonwoven A/S
12.7.1 Fibertex Nonwoven A/S Company Overview
12.7.2 Fibertex Nonwoven A/S Company Performance
12.7.3 Fibertex Nonwoven A/S Recent Developments
12.8 GSE Environmental/Solmax GSE
12.8.1 GSE Environmental/Solmax GSE Company Overview
12.8.2 GSE Environmental/Solmax GSE Company Performance
12.8.3 GSE Environmental/Solmax GSE Recent Developments
12.9 HOV Environment Solutions Pvt. Ltd.
12.9.1 HOV Environment Solutions Pvt. Ltd Overview
12.9.2 HOV Environment Solutions Pvt. Ltd. Company Performance
12.10 Huesker Synthetic GmbH & Co.
12.10.1 Huesker Synthetic GmbH & Co. Company Overview
12.10.2 Huesker Synthetic GmbH & Co. Company Performance
12.10.3 Huesker Synthetic GmbH & Co. Recent Developments
12.11 Koninklijke Ten Cate bv
12.11.1 Koninklijke Ten Cate bv Company Overview
12.11.2 Koninklijke Ten Cate bv Company Performance
12.11.3 Koninklijke Ten Cate bv Recent Developments
12.12 Minerals Technologies Inc.
12.12.1 Minerals Technologies Inc. Company Overview
12.12.2 Minerals Technologies Inc. Company Performance
12.12.3 Minerals Technologies Inc. Recent Developments
12.13 Officine Maccaferri Spa
12.13.1 Officine Maccaferri Spa Company Overview
12.13.2 Officine Maccaferri Spa Company Performance
12.13.3 Officine Maccaferri Spa Recent Developments
12.14 Strata Systems, Inc.
12.14.1 Strata Systems, Inc. Company Overview
12.14.2 Strata Systems, Inc. Company Performance
12.14.3 Strata Systems, Inc. Recent Developments
12.15 TERRAM Geosynthetics
12.15.1 TERRAM Geosynthetics Company Overview
12.15.2 TERRAM Geosynthetics Company Performance
12.15.3 TERRAM Geosynthetics Recent Developments
12.16 Other Leading Companies in the Global Geotextile Market 2018
13. Conclusion
13.1 The Geotextile Market Overview
13.2 Fastest Growing Geotextile Regional Markets
13.3 Leading Global Geotextile Application Trends
13.4 Leading Global Geotextile Material Trends
Associated Visiongain Reports
Visiongain Report Sales Order Form
Appendix A
About Visiongain
Appendix B
Visiongain Report Evaluation Form
List of Figures
Figure 1.1 Leading Players in the Global Geotextiles Market
Figure 1.2 Market Segmentation of the Global Geotextiles Market
Figure 2.1 Global Geotextile Classification by Type
Figure 2.2 Value Chain of Geotextile Market
Figure 3.1 Global Geotextile Market Forecast 2018-2028 ($mn, AGR %)
Figure 3.2 Population Growth Across Leading Countries 1950-2016
Figure 3.3 World Population by Leading Regions 1950-2016
Figure 3.4 Share of World Urban and Rural Population 1960-2016
Figure 4.1 Global Geotextile Material Submarket Forecasts 2018-2028 ($mn)
Figure 4.2 Global Geotextile Material Submarket Share Forecast 2018 (%)
Figure 4.3 Global Geotextile Material Submarket Share Forecast 2023 (%)
Figure 4.4 Global Geotextile Material Submarket Share Forecast 2028 (%)
Figure 4.5 Global Geotextile Material Submarket Growth Forecast 2018-2028 (CAGR %)
Figure 4.6 Polypropylene Market Forecast 2018-2028 ($mn, AGR %)
Figure 4.7 Polypropylene Market Share Forecast 2018 (%)
Figure 4.8 Polypropylene Market Share Forecast 2023 (%)
Figure 4.9 Polypropylene Market Share Forecast 2028 (%)
Figure 4.10 Polypropylene Market Forecast by Geography 2018-2028 ($mn, AGR %)
Figure 4.11 Polyethylene Market Forecast 2018-2028 ($mn, AGR %)
Figure 4.12 Polyethylene Market Share Forecast 2018 (%)
Figure 4.13 Polyethylene Market Share Forecast 2023 (%)
Figure 4.14 Polyethylene Market Share Forecast 2028 (%)
Figure 4.15 Polyethylene Market Forecast by Geography 2018-2028 ($mn, AGR %)
Figure 4.16 Polyester Market Forecast 2018-2028 ($mn, AGR %)
Figure 4.17 Polyester Market Share Forecast 2018 (%)
Figure 4.18 Polyester Market Share Forecast 2023 (%)
Figure 4.19 Polyester Market Share Forecast 2028 (%)
Figure 4.20 Polyester Market Forecast by Geography 2018-2028 ($mn, AGR %)
Figure 4.21 Other Materials Market Forecast 2018-2028 ($mn, AGR %)
Figure 4.22 Other Materials Market Share Forecast 2018 (%)
Figure 4.23 Other Materials Market Share Forecast 2023 (%)
Figure 4.24 Other Materials Market Share Forecast 2028 (%)
Figure 4.25 Other Materials Market Forecast by Geography 2018-2028 ($mn, AGR %)
Figure 5.1 Global Geotextile Product Type Submarket Forecasts 2018-2028 ($mn)
Figure 5.2 Global Geotextile Product Type Submarket Share Forecast 2018 (%)
Figure 5.3 Global Geotextile Product Type Submarket Share Forecast 2023 (%)
Figure 5.4 Global Geotextile Product Type Submarket Share Forecast 2028 (%)
Figure 5.5 Global Geotextile Product Type Submarket Growth Forecast 2018-2028 (CAGR %)
Figure 5.6 Non-woven Product Type Market Forecast 2018-2028 ($mn, AGR %)
Figure 5.7 Non-woven Product Type Market Share Forecast 2018 (%)
Figure 5.8 Non-woven Product Type Market Share Forecast 2023 (%)
Figure 5.9 Non-woven Product Type Market Share Forecast 2028 (%)
Figure 5.10 Non-woven Product Type Market Forecast by Geography 2018-2028 ($mn)
Figure 5.11 Woven Product Type Market Forecast 2018-2028 ($mn, AGR %)
Figure 5.12 Woven Product Type Market Share Forecast 2018 (%)
Figure 5.13 Woven Product Type Market Share Forecast 2023 (%)
Figure 5.14 Woven Product Type Market Share Forecast 2028 (%)
Figure 5.15 Woven Product Type Market Forecast by Geography 2018-2028 ($mn)
Figure 5.16 Knitted Product Type Market Forecast 2018-2028 ($mn, AGR %)
Figure 5.17 Knitted Product Type Market Share Forecast 2018 (%)
Figure 5.18 Knitted Product Type Market Share Forecast 2023 (%)
Figure 5.19 Knitted Product Type Market Share Forecast 2028 (%)
Figure 5.20 Knitted Product Type Market Forecast by Geography 2018-2028 ($mn)
Figure 6.1 Global Geotextile Application Market Forecasts 2018-2028 ($mn)
Figure 6.2 Global Geotextile Application Market Share Forecast 2018 (%)
Figure 6.3 Global Geotextile Application Market Share Forecast 2023 (%)
Figure 6.4 Global Geotextile Application Market Share Forecast 2028 (%)
Figure 6.5 Global Geotextile Application Submarket Growth Forecast 2018-2028 (CAGR %)
Figure 6.6 Road Construction Market Forecast 2018-2028 ($mn, AGR %)
Figure 6.7 Road Construction Market Share Forecast 2018 (%)
Figure 6.8 Road Construction Market Share Forecast 2023 (%)
Figure 6.9 Road Construction Market Share Forecast 2028 (%)
Figure 6.10 Road Construction Market Forecast by Geography 2018-2028 ($mn)
Figure 6.11 Global Annual Investment by Sector 2015 ($Billion)
Figure 6.12 Americas Road Infrastructure Spending and Needs by Country 2007-2040 (Percent Of GDP)
Figure 6.13 Waste and Landfill Market Forecast 2018-2028 ($mn, AGR %)
Figure 6.14 Waste and Landfill Market Share Forecast 2018 (%)
Figure 6.15 Waste and Landfill Market Share Forecast 2023 (%)
Figure 6.16 Waste and Landfill Market Share Forecast 2028 (%)
Figure 6.17 Waste and Landfill Market Forecast by Geography 2018-2028 ($mn, AGR %)
Figure 6.18 Waste Generation by Economic Activities and Households, Europe 2014 (%)
Figure 6.19 Water Construction Market Forecast 2018-2028 ($mn, AGR %)
Figure 6.20 Water Construction Market Share Forecast 2018 (%)
Figure 6.21 Water Construction Market Share Forecast 2023 (%)
Figure 6.22 Water Construction Market Share Forecast 2028 (%)
Figure 6.23 Water Construction Market Forecast by Geography 2018-2028 ($mn, AGR %)
Figure 6.24 Agriculture Market Forecast 2018-2028 ($mn, AGR %)
Figure 6.25 Agriculture Market Share Forecast 2018 (%)
Figure 6.26 Agriculture Market Share Forecast 2023 (%)
Figure 6.27 Agriculture Market Share Forecast 2028 (%)
Figure 6.28 Agriculture Market Forecast by Geography 2018-2028 ($mn, AGR %)
Figure 6.29 Railroad Market Forecast 2018-2028 ($mn, AGR %)
Figure 6.30 Railroad Market Share Forecast 2018 (%)
Figure 6.31 Railroad Market Share Forecast 2023 (%)
Figure 6.32 Railroad Market Share Forecast 2028 (%)
Figure 6.33 Railroad Market Forecast by Geography 2018-2028 ($mn, AGR %)
Figure 6.34 Railroad Passenger/Kilometres by Region 2017 (% Share)
Figure 6.35 Railroad Tonne/Kilometres by Region 2017 (% Share)
Figure 6.36 Railroad Length of Lines by Region 2017 (% Share)
Figure 6.37 Other Applications Submarket Forecast 2018-2028 ($mn, AGR %)
Figure 6.38 Other Applications Market Share Forecast 2018 (%)
Figure 6.39 Other Applications Market Share Forecast 2023 (%)
Figure 6.40 Other Applications Market Share Forecast 2028 (%)
Figure 6.41 Other Applications Market Forecast by Geography 2018-2028 ($mn, AGR %)
Figure 7.1 North America Geotextile Market Forecast by Country 2018-2028 ($mn)
Figure 7.2 North America Market Growth Forecasts by Country 2018-2028 (CAGR%)
Figure 7.3 North America Geotextile Market Share Forecast 2018 (%)
Figure 7.4 North America Geotextile Market Share Forecast 2023 (%)
Figure 7.5 North America Geotextile Market Share Forecast 2028 (%)
Figure 7.6 The United States of America Geotextile Market Forecast 2018-2028 ($mn, AGR %)
Figure 7.7 The United States of America Geotextile Market Share Forecast 2018 (%)
Figure 7.8 The United States of America Geotextile Market Share Forecast 2023 (%)
Figure 7.9 The United States of America Geotextile Market Share Forecast 2028 (%)
Figure 7.10 The United States of America Population Pyramid 2015 (Male and Female Population by Age Bracket, Millions)
Figure 7.11 Canada Geotextile Market Forecast 2018-2028 ($mn, AGR %)
Figure 7.12 Canada Geotextile Market Share Forecast 2018 (%)
Figure 7.13 Canada Geotextile Market Share Forecast 2023 (%)
Figure 7.14 Canada Geotextile Market Share Forecast 2028 (%)
Figure 7.15 Mexico Geotextile Market Forecast 2018-2028 ($mn, AGR %)
Figure 7.16 Mexico Geotextile Market Share Forecast 2018 (%)
Figure 7.17 Mexico Geotextile Market Share Forecast 2023 (%)
Figure 7.18 Mexico Geotextile Market Share Forecast 2028 (%)
Figure 8.1 Europe Geotextile Market Forecast by Country 2018-2028 ($mn)
Figure 8.2 Europe Market Growth Forecast by Country 2018-2028 (CAGR%)
Figure 8.3 Europe Geotextile Market Share Forecast 2018 (%)
Figure 8.4 Europe Geotextile Market Share Forecast 2023 (%)
Figure 8.5 Europe Geotextile Market Share Forecast 2028 (%)
Figure 8.6 UK Geotextile Market Forecast 2018-2028 ($mn, AGR %)
Figure 8.7 UK Geotextile Market Share Forecast 2018 (%)
Figure 8.8 UK Geotextile Market Share Forecast 2023 (%)
Figure 8.9 UK Geotextile Market Share Forecast 2028 (%)
Figure 8.10 Denmark Geotextile Market Forecast 2018-2028 ($mn, AGR %)
Figure 8.11 Denmark Geotextile Market Share Forecast 2018 (%)
Figure 8.12 Denmark Geotextile Market Share Forecast 2023 (%)
Figure 8.13 Denmark Geotextile Market Share Forecast 2028 (%)
Figure 8.14 Netherlands Geotextile Market Forecast 2018-2028 ($mn, AGR%)
Figure 8.15 Netherlands Geotextile Market Share Forecast 2018 (%)
Figure 8.16 Netherlands Geotextile Market Share Forecast 2023 (%)
Figure 8.17 Netherlands Geotextile Market Share Forecast 2028 (%)
Figure 8.18 Germany Geotextile Market Forecast 2018-2028 ($mn, AGR %)
Figure 8.19 Germany Geotextile Market Share Forecast 2018 (%)
Figure 8.20 Germany Geotextile Market Share Forecast 2023 (%)
Figure 8.21 Germany Geotextile Market Share Forecast 2028 (%)
Figure 8.22 Italy Geotextile Market Forecast 2018-2028 ($mn, AGR %)
Figure 8.23 Italy Geotextile Market Share Forecast 2018 (%)
Figure 8.24 Italy Geotextile Market Share Forecast 2023 (%)
Figure 8.25 Italy Geotextile Market Share Forecast 2028 (%)
Figure 8.26 Russia Geotextile Market Forecast 2018-2028 ($mn, AGR %)
Figure 8.27 Russia Geotextile Market Share Forecast 2018 (%)
Figure 8.28 Russia Geotextile Market Share Forecast 2023 (%)
Figure 8.29 Russia Geotextile Market Share Forecast 2028 (%)
Figure 8.30 Rest of Europe Geotextile Market Forecast 2018-2028 ($mn, AGR %)
Figure 8.31 Rest of Europe Geotextile Market Share Forecast 2018 (%)
Figure 8.32 Rest of Europe Geotextile Market Share Forecast 2023 (%)
Figure 8.33 Rest of Europe Geotextile Market Share Forecast 2028 (%)
Figure 9.1 Asia-Pacific Geotextile Market Forecast by Country 2018-2028 ($mn)
Figure 9.2 Asia-Pacific Market Growth Forecasts by Country 2018-2028 (CAGR%)
Figure 9.3 Asia-Pacific Geotextile Market Share Forecast 2018 (%)
Figure 9.4 Asia-Pacific Geotextile Market Share Forecast 2023 (%)
Figure 9.5 Asia-Pacific Geotextile Market Share Forecast 2028 (%)
Figure 9.6 China Geotextile Market Forecast 2018-2028 ($mn, AGR %)
Figure 9.7 China Geotextile Market Share Forecast 2018 (%)
Figure 9.8 China Geotextile Market Share Forecast 2023 (%)
Figure 9.9 China Geotextile Market Share Forecast 2028 (%)
Figure 9.10 Japan Geotextile Submarket Forecast 2018-2028 ($mn, AGR %)
Figure 9.11 Japan Geotextile Market Share Forecast 2018 (%)
Figure 9.12 Japan Geotextile Market Share Forecast 2023 (%)
Figure 9.13 Japan Geotextile Market Share Forecast 2028 (%)
Figure 9.14 India Geotextiles Market Forecast 2018-2028 ($mn, AGR %)
Figure 9.15 India Geotextile Market Share Forecast 2018 (%)
Figure 9.16 India Geotextile Market Share Forecast 2023 (%)
Figure 9.17 India Geotextile Market Share Forecast 2028 (%)
Figure 9.18 Rest of Asia-Pacific Geotextile Market Forecast 2018-2028 ($mn, AGR %)
Figure 9.19 Rest of Asia-Pacific Geotextile Market Share Forecast 2018 (%)
Figure 9.20 Rest of Asia-Pacific Geotextile Market Share Forecast 2023 (%)
Figure 9.21 Rest of Asia-Pacific Geotextile Market Share Forecast 2028 (%)
Figure 10.1 Latin America Geotextile Market Forecast by Country 2018-2028 ($mn)
Figure 10.2 Latin America Market Growth Forecast by Country 2018-2028 (CAGR%)
Figure 10.3 Latin America Geotextile Market Share Forecast 2018 (%)
Figure 10.4 Latin America Geotextile Market Share Forecast 2023 (%)
Figure 10.5 Latin America Geotextile Market Share Forecast 2028 (%)
Figure 10.6 Brazil Geotextile Market Forecast 2018-2028 ($mn, AGR %)
Figure 10.7 Brazil Geotextile Market Share Forecast 2018 (%)
Figure 10.8 Brazil Geotextile Market Share Forecast 2023 (%)
Figure 10.9 Brazil Geotextile Market Share Forecast 2028 (%)
Figure 10.10 Argentina Geotextile Market Forecast 2018-2028 ($mn, AGR %)
Figure 10.11 Argentina Geotextile Market Share Forecast 2018 (%)
Figure 10.12 Argentina Geotextile Market Share Forecast 2023 (%)
Figure 10.13 Argentina Geotextile Market Share Forecast 2028 (%)
Figure 10.14 Rest of Latin America Geotextile Market Forecast 2018-2028 ($mn, AGR %)
Figure 10.15 Rest of Latin America Geotextile Market Share Forecast 2018 (%)
Figure 10.16 Rest of Latin America Geotextile Market Share Forecast 2023 (%)
Figure 10.17 Rest of Latin America Geotextile Market Share Forecast 2028 (%)
Figure 11.1 MEA Geotextile Market Forecast by Country 2018-2028 ($mn)
Figure 11.2 MEA Market Growth Forecast by Country 2018-2028 (CAGR%)
Figure 11.3 MEA Geotextile Market Share Forecast 2018 (%)
Figure 11.4 MEA Geotextile Market Share Forecast 2023 (%)
Figure 11.5 MEA Geotextile Market Share Forecast 2028 (%)
Figure 11.6 The United Arab Emirates (UAE) Geotextile Market Forecast 2018-2028 ($mn, AGR %)
Figure 11.7 The United Arab Emirates (UAE) Geotextile Market Share Forecast 2018 (%)
Figure 11.8 The United Arab Emirates (UAE) Geotextile Market Share Forecast 2023 (%)
Figure 11.9 The United Arab Emirates (UAE) Geotextile Market Share Forecast 2028 (%)
Figure 11.10 South Africa Geotextile Market Forecast 2018-2028 ($mn, AGR %)
Figure 11.11 South Africa Geotextile Market Share Forecast 2018 (%)
Figure 11.12 South Africa Geotextile Market Share Forecast 2023 (%)
Figure 11.13 South Africa Geotextile Market Share Forecast 2028 (%)
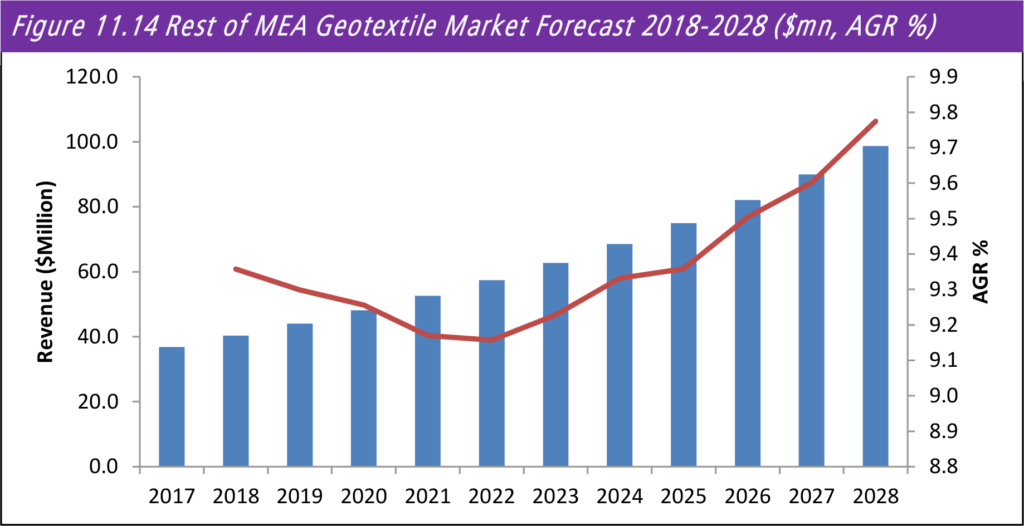
Figure 11.14 Rest of MEA Geotextile Market Forecast 2018-2028 ($mn, AGR %)
Figure 11.15 Rest of MEA Geotextile Market Share Forecast 2018 (%)
Figure 11.16 Rest of MEA Geotextile Market Share Forecast 2023 (%)
Figure 11.17 Rest of MEA Geotextile Market Share Forecast 2028 (%)
Figure 12.1 Agru America Inc. Business Offerings
Figure 12.2 Agru America Inc. Business Locations
Figure 12.3 Agru America Inc. Products
Figure 12.4 Belton Industries Inc. Markets
Figure 12.5 Belton Industries Inc. Erosion Control Products
Figure 12.6 Carthage Mills, Inc. Products
Figure 12.7 Carthage Mills, Inc. Geotextiles by Function
Figure 12.8 Carthage Mills, Inc. Geotextiles Types
Figure 12.9 Carthage Mills, Inc. Geotextiles Applications
Figure 12.10 Contech Engineered Solutions LLC Products
Figure 12.11 Contech Engineered Solutions LLC Markets
Figure 12.12 Don and Low Ltd Market Segments
Figure 12.13 E. I. Du Pont De Nemours & Company Products
Figure 12.14 E. I. Du Pont De Nemours & Company Industries
Figure 12.15 Business Performance of E. I. Du Pont De Nemours & Company 2015-2017 ($Mn)
Figure 12.16 Business Performance of E. I. Du Pont De Nemours & Company by Business Segment 2017 (%Share)
Figure 12.17 Business Performance of E. I. Du Pont De Nemours & Company by Geography 2017 (%Share)
Figure 12.18 Fibertex Nonwoven A/S Business Offerings
Figure 12.19 Fibertex Nonwoven A/S Geotextiles by Function
Figure 12.20 Fibertex Nonwoven A/S Geotextiles by Application
Figure 12.21 Business Performance of Fibertex Nonwoven A/S 2015-2017 ($Mn)
Figure 12.22 GSE Environmental Products
Figure 12.23 GSE Environmental Applications
Figure 12.24 GSE Environmental Geotextiles Types
Figure 12.25 HOV Environment Services
Figure 12.26 Huesker Synthetic GmbH & Co. Products
Figure 12.27 Huesker Synthetic GmbH & Co. Applications
Figure 12.28 Koninklijke Ten Cate bv Geosynthetics Markets
Figure 12.29 Koninklijke Ten Cate bv Geosynthetics Solutions
Figure 12.30 Koninklijke Ten Cate bv Geosynthetics Products
Figure 12.31 Business Performance of Koninklijke Ten Cate bv 2015-2017 ($Mn)
Figure 12.32 Business Performance of Koninklijke Ten Cate bv by Business Segment 2017 (% Share)
Figure 12.33 Minerals Technologies Inc. Markets
Figure 12.34 Minerals Technologies Inc. – Construction Technologies
Figure 12.35 Business Performance of Minerals Technology Inc. 2015-2017 ($Mn)
Figure 12.36 Business Performance of Minerals Technology Inc. by Business Segment 2017 (%Share)
Figure 12.37 Business Performance of Minerals Technology Inc. by Geography 2017 (%Share)
Figure 12.38 Officine Maccaferri Spa Products
Figure 12.39 Officine Maccaferri Spa Applications
Figure 12.40 Strata Systems, Inc. Product Offerings
Figure 12.41 Strata Systems, Inc. Applications
Figure 13.1 Top 3 Regional Markets CAGR Forecasts 2018-2028 (CAGR%)
Figure 13.2 Geotextile Applications Market Share 2018 (%Share)
Figure 13.3 Geotextiles Material Market Share 2018 (% Share)
List of Tables
Table 3.1 Global Geotextile Market Forecast 2018-2028 ($bn, AGR %, CAGR %)
Table 3.2 Global Geotextile Market Drivers & Restraints 2018-2028
Table 3.3 SWOT Analysis of the Geotextiles Market 2018-2028
Table 4.1 Global Geotextile Material Submarket Forecasts 2018-2028 ($bn, AGR %, CAGR%)
Table 4.2 Polypropylene Market Forecast 2018-2028 ($mn, AGR %, CAGR %)
Table 4.3 Polypropylene Market Forecast by Geography 2018-2028 ($mn, AGR %, CAGR %)
Table 4.4 Polyethylene Submarket Forecast 2018-2028 ($mn, AGR %, CAGR %)
Table 4.5 Polyethylene Market Forecast by Geography 2018-2028 ($mn, AGR %, CAGR %)
Table 4.6 Polyester Market Forecast 2018-2028 ($mn, AGR %, CAGR %)
Table 4.7 Polyester Market Forecast by Geography 2018-2028 ($mn, AGR %, CAGR %)
Table 4.8 Other Materials Submarket Forecast 2018-2028 ($mn, AGR %, CAGR %)
Table 4.9 Other Materials Market Forecast by Geography 2018-2028 ($mn, AGR %, CAGR %)
Table 5.1 Global Geotextile Product Type Submarket Forecasts 2018-2028 ($bn, AGR %, CAGR %)
Table 5.2 Non-woven Product Type Market Forecast 2018-2028 ($mn, AGR %, CAGR %)
Table 5.3 Non-woven Product Type Market Forecast by Geography 2018-2028 ($mn, AGR %, CAGR %)
Table 5.4 Woven Product Type Market Forecast 2018-2028 ($mn, AGR %, CAGR %)
Table 5.5 Woven Product Type Market Forecast by Geography 2018-2028 ($mn, AGR %, CAGR %)
Table 5.6 Knitted Product Type Market Forecast 2018-2028 ($mn, AGR %, CAGR %)
Table 5.7 Knitted Product Type Market Forecast by Geography 2018-2028 ($mn, AGR %, CAGR %)
Table 6.1 Global Geotextile Application Market Forecasts 2018-2028 ($bn, AGR %, CAGR %)
Table 6.2 Road Construction Market Forecast 2018-2028 ($mn, AGR %, CAGR %)
Table 6.3 Road Construction Market Forecast by Geography 2018-2028 ($mn, AGR %, CAGR %)
Table 6.4 Infrastructure Projects with Financial Support of the World Bank in China, India and Brazil (Country, Project, Status, Approval Date, Closing Date, Total Project Costs)
Table 6.5 Waste and Landfill Market Forecast 2018-2028 ($mn, AGR %, CAGR %)
Table 6.6 Waste and Landfill Market Forecast by Geography 2018-2028 ($mn, AGR %, CAGR %)
Table 6.7 Water Construction Market Forecast 2018-2028 ($mn, AGR %, CAGR %)
Table 6.8 Water Construction Market Forecast by Geography 2018-2028 ($mn, AGR %, CAGR %)
Table 6.9 Agriculture Market Forecast 2018-2028 ($mn, AGR %, CAGR %)
Table 6.10 Agriculture Market Forecast by Geography 2018-2028 ($mn, AGR %, CAGR %)
Table 6.11 Railroad Market Forecast 2018-2028 ($mn, AGR %, CAGR %)
Table 6.12 Railroad Market Forecast by Geography 2018-2028 ($mn, AGR %, CAGR %)
Table 6.13 Other Application Market Forecast 2018-2028 ($mn, AGR %, CAGR %)
Table 6.14 Other Applications Market Forecast by Geography 2018-2028 ($mn, AGR %, CAGR %)
Table 7.1 North America Geotextile Market Forecast by Country 2018-2028 ($mn, AGR%, CAGR %)
Table 7.2 The United States of America Geotextile Market Forecast 2018-2028 ($mn, AGR %, CAGR %)
Table 7.3 The United States of America Geotextile Market Drivers & Restraints 2018-2028
Table 7.4 Canada Geotextile Market Forecast 2018-2028 ($mn, AGR %, CAGR %)
Table 7.5 Canada Geotextile Market Drivers & Restraints 2018-2028
Table 7.6 Mexico Geotextile Market Forecast 2018-2028 ($mn, AGR %, CAGR %)
Table 7.7 Mexico Geotextile Market Drivers & Restraints
Table 8.1 Europe Geotextile Market Forecast by Country 2018-2028 ($mn, AGR%, CAGR %)
Table 8.2 UK Geotextile Market Forecast 2018-2028 ($mn, AGR %, CAGR %)
Table 8.3 UK Geotextile Market Drivers & Restraints 2018-2028
Table 8.4 Denmark Geotextile Market Forecast 2018-2028 ($mn, AGR %, CAGR %)
Table 8.5 Denmark Geotextile Market Drivers & Restraints 2018-2028
Table 8.6 Netherlands Geotextile Market Forecast 2018-2028 ($mn, AGR %, CAGR %)
Table 8.7 Netherlands Geotextile Market Drivers & Restraints 2018-2028
Table 8.8 Germany Geotextile Market Forecast 2018-2028 ($mn, AGR %, CAGR %)
Table 8.9 German Geotextile Market Drivers & Restraints 2018-2028
Table 8.10 Italy Geotextile Market Forecast 2018-2028 ($mn, AGR %, CAGR %)
Table 8.11 Italian Geotextile Market Drivers & Restraints 2018-2028
Table 8.12 Russia Geotextile Market Forecast 2018-2028, ($mn, AGR %, CAGR %)
Table 8.13 Russian Geotextile Market Drivers & Restraints 2018-2028
Table 8.14 Rest of Europe Geotextile Market Forecast 2018-2028 ($mn, AGR %, CAGR %)
Table 9.1 Asia-Pacific Geotextile Market Forecast by Country 2018-2028 ($mn, AGR%, CAGR %)
Table 9.2 China Geotextile Market Forecast 2018-2028 ($mn, AGR %, CAGR %)
Table 9.3 China Geotextile Market Drivers & Restraints 2018-2028
Table 9.4 Japan Geotextile Market Forecast 2018-2028, ($mn, AGR %, CAGR %)
Table 9.5 Japan Geotextile Market Drivers & Restraints 2018-2028
Table 9.6 India Geotextiles Market Forecast 2018-2028 ($mn, AGR %, CAGR %)
Table 9.7 Indian Geotextile Market Drivers & Restraints 2018-2028
Table 9.8 Rest of Asia-Pacific Geotextile Market Forecast 2018-2028 ($mn, AGR %, CAGR %)
Table 10.1 Latin America Geotextile Market Forecast by Country 2018-2028 ($mn, AGR%, CAGR %)
Table 10.2 Brazil Geotextile Market Forecast 2018-2028 ($mn, AGR %, CAGR %)
Table 10.3 Brazilian Geotextile Market Drivers & Restraints
Table 10.4 Argentina Geotextile Market Forecast 2018-2028 ($mn, AGR %, CAGR %)
Table 10.5 Argentina Geotextile Market Drivers & Restraints
Table 10.6 Rest of Latin America Geotextile Market Forecast 2018-2028 ($mn, AGR %, CAGR %)
Table 11.1 MEA Geotextile Market Forecast by Country 2018-2028 ($mn, AGR%, CAGR %)
Table 11.2 The United Arab Emirates (UAE) Geotextile Market Forecast 2018-2028 ($mn, AGR %, CAGR %)
Table 11.3 The United Arab Emirates (UAE) Geotextile Market Drivers & Restraints 2018-2028
Table 11.4 South Africa Geotextile Market Forecast 2018-2028 ($mn, AGR %, CAGR %)
Table 11.5 South Africa Geotextile Market Drivers & Restraints 2018-2028
Table 11.6 Rest of MEA Geotextile Market Forecast 2018-2028 ($mn, AGR %, CAGR %)
Table 12.1 Leading Geotextiles Companies 2018
Table 12.2 Agru America Inc. Overview 2018 (Headquarters, Website)
Table 12.3 Belton Industries Inc. Overview 2018 (President, Headquarters, Website)
Table 12.4 Carthage Mills, Inc. Overview 2018 (Headquarters, Website)
Table 12.5 Contech Engineered Solutions LLC Overview 2018 (Headquarters, Website)
Table 12.6 Don and Low Ltd Overview 2018 (Headquarters, Website)
Table 12.7 E. I. Du Pont De Nemours & Company Overview 2018 (Headquarters, Website)
Table 12.8 Fibertex Nonwoven A/S Overview 2018 (CEO, Headquarters, Website)
Table 12.9 GSE Environmental Overview 2018 (CEO, Headquarters, Website)
Table 12.10 HOV Environment Solutions Private Limited Overview 2018 (Headquarters, Website)
Table 12.11 Huesker Synthetic GmbH & Co. Overview 2018 (Headquarters, Website)
Table 12.12 Koninklijke Ten Cate bv Overview 2018 (CEO, Headquarters, Website)
Table 12.13 Minerals Technologies Inc. Overview 2018 (CEO, Headquarters, Website)
Table 12.14 Officine Maccaferri Spa Overview 2018 (Headquarters, CEO, Website)
Table 12.15 Strata Systems, Inc. Overview 2018 (Headquarters, Website)
Table 12.16 TERRAM Geosynthetics Overview 2018 (Headquarters, Website)
Table 12.17 Other Geotextile Companies

