Industries > Construction > Steel Market Report 2018-2028
Steel Market Report 2018-2028
Volume and Value Forecasts by Process (Hot Rolled, Cold Rolled, Direct Rolled, Tubes, Others), by Steel Type (Carbon Steel, Alloy Steel, Stainless Steel, Others), by End-User Industry (Automotive, Mechanical Engineering, Electronic Engineering, Oil & Gas, Construction, Others) Plus Financial Analysis of Leading Companies and Leading National Market and Volume (Consumption and Production) Analysis of Leading and Emerging National Markets
Visiongain’s new 287-page report reveals that the world market for steel will reach $991 billion, while the production levels will record 1,714.3 million tonnes and global consumption 1,592.5 million tonnes in 2018.
The steel market has been declining over the past few years as a result of the large oversupply of steel that pressured prices downwards. The global recession that hit the commodities sector hard also contributed to the shrinking growth.
To discover more about the reasons for the market development, please purchase our extensive report.
Market scope: Our report analyses the global steel market for 6 key submarkets by application, 5 submarkets by process, 4 submarkets by steel type, 4 submarkets by application, 16 leading national markets and 9 emerging national markets plus the rest of the world. The analyses and forecasts are presented in both volume and value terms.
Steel Market Report 2018-2028: Volume and Value Forecasts by Process (Hot Rolled, Cold Rolled, Direct Rolled, Tubes, Others), by Steel Type (Carbon Steel, Alloy Steel, Stainless Steel, Others), by End-User Industry (Automotive, Mechanical Engineering, Electronic Engineering, Oil & Gas, Construction, Others) Plus Financial Analysis of Leading Companies and Leading National Market and Volume (Consumption and Production) Analysis of Leading and Emerging National Markets report responds to your need for definitive market data:
• Where are the steel market opportunities?
• 333 tables, charts, and graphs reveal market data allowing you to target your strategy
• When will the steel market grow?
• Global, regional and steel submarket forecasts of production, consumption and sales projections and analysis of the market from 2018-2028
• Which end-use sectors will thrive? See market value and consumption volume for the key submarkets from 2018-2028
• Construction Steel Submarket Forecast
• Automotive Steel Submarket Forecast
• Mechanical Engineering Steel Submarket Forecast
• Electrical Engineering Steel Submarket Forecast
• Oil & Gas Steel Submarket Forecast
• Others Steel Submarket Forecast
• Which steel type will thrive? See market value, consumption and production volume for the key steel types from 2018-2028
• Stainless Steel Submarket Forecast
• Carbon Steel Submarket Forecast
• Alloy Steel Submarket Forecast
• Others Submarket Forecast
• Which process of production will thrive? See market value and consumption volume for the key production process types from 2018-2028
• Hot Roll Submarket Forecast
• Cold Roll Submarket Forecast
• Direct Roll Submarket Forecast
• Tubes Submarket Forecast
• Others Submarket Forecast
• Which steel application will thrive? See market value and consumption volume for the key application types from 2018-2028
• Domestic Appliances Submarket Forecast
• Shipbuilding Submarket Forecast
• Container Submarket Forecast
• Others Submarket Forecast
• What are the national steel market prospects from 2018-2028?
See the production, consumption and value forecasts for 16 leading national markets plus the rest of the world market.
North America
• US Steel Market Forecast
• Mexican Steel Market Forecast
Europe
• Russian Steel Market Forecast
• German Steel Market Forecast
• French Steel Market Forecast
• Spanish Steel Market Forecast
• Italian Steel Market Forecast
• Ukrainian Steel Market Forecast
East Asia
• Chinese Steel Market Forecast
• Japanese Steel Market Forecast
• South Korean Steel Market Forecast
• Taiwanese Steel Market Forecast
South Asia
• Indian Steel Market Forecast
• Pakistani Steel Market Forecast
• Bangladesh Steel Market Forecast
Southeast Asia
• Indonesian Steel Market Forecast
• Thai Steel Market Forecast
• Malaysian Steel Market Forecast
• Philippino Steel Market Forecast
• Vietnamese Steel Market Forecast
• Myanmar Steel Market Forecast
ANZAC
• Australian Steel Market Forecast
Latin America
• Brazilian Steel Market Forecast
Middle East
• Iranian Steel Market Forecast
• Turkish Steel Market Forecast
RoW Steel Market Forecast
• What are the factors influencing steel market dynamics?
• Research and development (R&D) strategy
• Technological issues and constraints.
• Supply and demand dynamics
• Advances in product quality
• Demographic changes
• Explore the political, economic, social and technological factors (PEST) affecting the industry and product advances.
• Who are the leading 10 steel companies?
• Understand the competitive landscape with profiles of 10 leading steel companies examining their positioning, projected revenues, capabilities, product portfolios, R&D activity, services, focus, strategies, M&A activity and market share.
• Ansteel Group
• ArcelorMittal
• China Baowu Group
• HBIS Group
• JFE Steel Corporation
• Nippon Steel and Sumitomo Metal Corporation
• POSCO
• Shagang Group
• Shougang Group
• Tata Steel Group
Buy our report today Steel Market Report 2018-2028: Volume and Value Forecasts by Process (Hot Rolled, Cold Rolled, Direct Rolled, Tubes, Others), by Steel Type (Carbon Steel, Alloy Steel, Stainless Steel, Others), by End-User Industry (Automotive, Mechanical Engineering, Electronic Engineering, Oil & Gas, Construction, Others) Plus Financial Analysis of Leading Companies and Leading National Market and Volume (Consumption and Production) Analysis. Avoid missing out – order our report now.
Visiongain is a trading partner with the US Federal Government
CCR Ref number: KD4R6
1.1. Global Steel Market Overview
1.2. Global Steel Market Segmentation
1.3. Why You Should Read This Report
1.4. How This Report Delivers
1.5. Key Questions Answered By This Analytical Report
1.6. Who Is This Report For?
1.7. Methodology
1.7.1 Primary Research
1.7.2 Secondary Research
1.7.3 Market Evaluation & Forecasting Methodology
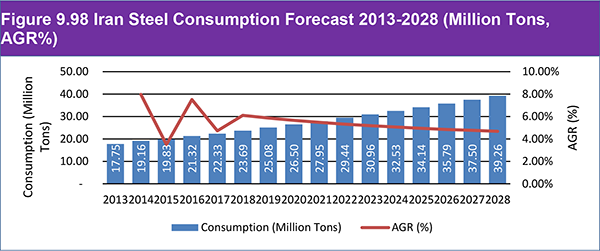
1.8. Frequently Asked Questions (FAQ)
1.9. Associated Visiongain Reports
1.10. About Visiongain
2. Introduction To Steel
2.1. What is Steel?
2.2. Properties of Steel
2.3. Where is Steel Used?
3. The Steel Market Outlook 2018-2028
3.1. Market Definition and Scope
3.2. Market Dynamics
3.2.1 Drivers
3.2.1.1 Demand for high strength stainless steel
3.2.1.2 Growing Automotive Industry in Asia-Pacific
3.2.2 Restraints
3.2.2.1 Increasing penetration of lightweight components and materials
3.2.3 Porter’s Five Forces Analysis
3.2.3.1 Bargaining Power of Supplier
3.2.3.2 Bargaining Power of Buyers
3.2.3.3 Threat of New Entrant
3.2.3.4Threat of Substitutes
3.2.3.5 Competitive Rivalry
4. Historical Performance of the Global Steel Market
4.1. Global Steel Market 1990-2012
4.2. Recent Global Steel Market Production 2013-2016
4.3. Global Steel Market Consumption 2013-2016
4.4. Global Steel Market Balance 2013-2016
4.5. Global Steel Market Value 2013-2016
5. Global Steel Market Analysis and Forecast 2018-2028
5.1 Global Steel Market Production Forecast 2018-2028
5.2 Global Steel Market Consumption Forecast 2018-2028
5.3 Global Steel Market Balance Forecast 2018-2028
5.4 Global Steel Market Value Forecast 2018-2028
6. Global Steel Market Forecast and Analysis by Process 2018-2028
6.1 Introduction
6.1.1 Global Steel Market Volume and Forecast by Process 2018-2028
6.1.2 Global Steel Market Value and Forecast by Process 2018-2028
6.2 Hot Rolled Market Analysis 2018-2028
6.2.1 Hot Rolled Market Overview
6.2.2 Hot Rolled Market Size and Forecast 2018-2028
6.3 Cold Rolled Market Analysis 2018-2028
6.3.1 Cold Rolled Market Overview
6.3.2 Cold Rolled Market Size and Forecast 2018-2028
6.4 Direct Rolled Market Analysis 2018-2028
6.4.1 Direct Rolled Market Overview
6.4.2 Direct Rolled Market Size and Forecast 2018-2028
6.5 Tubes Market Analysis 2018-2028
6.5.1. Tubes Market Overview
6.5.2. Tubes Market Size and Forecast 2018-2028
6.6 Other Processes Market Analysis 2018-2028
6.6.1 Other Processes Market Overview
6.6.2 Other Processes Market Size and Forecast 2018-2028
7. Global Steel Market Forecast and Analysis by Steel Type 2018-2028
7.1 Global Steel Market Forecast Share Analysis 2018-2028
7.2 Global Steel Market Production Forecast by Steel Type 2018-2028
7.3 Global Steel Market Consumption Forecast by Steel Type 2018-2028
7.4 Global Market Balance Forecast by Steel Type 2018-2028
7.5 Global Steel Market Value Forecast by Steel Type 2018-2028
7.6 Stainless Steel Market Analysis 2018-2028
7.7 Carbon Steel Market Analysis 2018-2028
7.8 Alloy Steel Market Analysis 2018-2028
7.9 Other Steel Types Market Analysis 2018-2028
8. Global Steel Market Forecast and Analysis by End-User Industry 2018-2028
8.1 Construction Forecast and Analysis 2018-2028
8.1.1 Construction Market Overview
8.1.2 Construction Market Forecast and Analysis 2018-2028
8.2 Automotive Forecast and Analysis 2018-2028
8.2.1 Automotive Market Overview
8.2.2 Automotive Market Forecast and Analysis 2018-2028
8.3 Mechanical Engineering Forecast and Analysis 2018-2028
8.3.1 Mechanical Engineering Market Overview
8.3.2 Mechanical Engineering Market Forecast and Analysis 2018-2028
8.4 Electrical Engineering Forecast and Analysis 2018-2028
8.4.1 Electrical Engineering Market Overview
8.4.2 Electrical Engineering Market Forecast and Analysis 2018-2028
8.5 Oil & Gas Forecast and Analysis 2018-2028
8.5.1 Oil & Gas Market Overview
8.5.2 Oil & Gas Market Forecast and Analysis 2018-2028
8.6 Other End-User Industries Forecast and Analysis 2018-2028
8.6.1 Other End-User Industries Overview
8.6.2 Other End-User Industries Market Forecast and Analysis 2018-2028
9 Global Steel Market Forecast and Analysis by Application 2018-2028
9.1 Domestic Appliance Application Forecast and Analysis 2018-2028
9.1.1 Domestic Appliance Application Overview
9.1.2 Domestic Appliance Application Market Forecast and Analysis 2018-2028
9.2 Container Application Forecast and Analysis 2018-2028
9.2.1 Container Application Overview
9.2.2 Container Application Market Forecast and Analysis 2018-2028
9.3 Shipbuilding Application Forecast and Analysis 2018-2028
9.3.1 Shipbuilding Application Overview
9.3.2 Shipbuilding Application Market Forecast and Analysis 2018-2028
9.4 Others Application Forecast and Analysis 2018-2028
9.4.1 Others Application Overview
9.4.2 Others Application Market Forecast and Analysis 2018-2028
10 Global Steel Market Forecast and Analysis by Leading National Markets 2018-2028
10.1 The U.S. Steel Market Forecast and Analysis 2018-2028
10.2 The Mexican Steel Market Forecast and Analysis 2018-2028
10.3 The German Steel Market Forecast and Analysis 2018-2028
10.4 The Italian Steel Market Forecast and Analysis 2018-2028
10.5 The French Steel Market Forecast and Analysis 2018-2028
10.6 The Spanish Steel Market Forecast and Analysis 2018-2028
10.7 The Russian Steel Market Forecast and Analysis 2018-2028
10.8 The Ukrainian Steel Market Forecast and Analysis 2018-2028
10.9 The Indian Steel Market Forecast and Analysis 2018-2028
10.10 The Chinese Steel Market Forecast and Analysis 2018-2028
10.11 The Japanese Steel Market Forecast and Analysis 2018-2028
10.12 The South Korean Steel Market Forecast and Analysis 2018-2028
10.13 The Taiwanese Steel Market Forecast and Analysis 2018-2028
10.14 The Turkish Steel Market Forecast and Analysis 2018-2028
10.15 The Brazilian Steel Market Forecast and Analysis 2018-2028
10.16 The Iranian Steel Market Forecast and Analysis 2018-2028
10.17 Indonesia Steel Market Forecast and Analysis 2018-2028
10.18 Thailand Steel Market Forecast and Analysis 2018-2028
10.19 Malaysia Steel Market Forecast and Analysis 2018-2028
10.20 Philippines Steel Market Forecast and Analysis 2018-2028
10.21 Vietnam Steel Market Forecast and Analysis 2018-2028
10.22 Bangladesh Steel Market Forecast and Analysis 2018-2028
10.23 Pakistan Steel Market Forecast and Analysis 2018-2028
10.24 Myanmar Steel Market Forecast and Analysis 2018-2028
10.24 Australia Steel Market Forecast and Analysis 2018-2028
10.25 The Rest of the World’s Steel Market Forecast and Analysis 2018-2028
11. Global Steel Market – Leading Company Profiles
11.1 Top Companies with Production (Million Tons) 2017
11.2 Ansteel Group
11.2.1 Ansteel Group: Overview
11.2.2 Ansteel Group: Product Offerings
11.2.3 Ansteel Group: Financial Performance
11.2.4 Ansteel Group: Recent Strategic Initiatives
11.3 ArcelorMittal
11.3.1 ArcelorMittal: Overview
11.3.2 ArcelorMittal: Product Offerings
11.3.3 ArcelorMittal: Financial Performance
11.3.4 ArcelorMittal: Recent Strategic Initiatives
11.4 China Baowu GrouChina Baowu Group: Overview
11.4.1 China Baowu Group: Product Offerings
11.4.2 China Baowu Group: Financial Performance
11.4.3 China Baowu Group: Recent Strategic Initiatives
11.5 HBIS Group
11.5.1 HBIS Group: Overview
11.5.2 HBIS Group: Product Offerings
11.5.3 HBIS Group: Recent Strategic Initiatives
11.6 Nippon Steel and Sumitomo Metal Corporation
11.6.1 Nippon Steel and Sumitomo Metal Corporation: Overview
11.6.2 Nippon Steel and Sumitomo Metal Corporation: Product Offerings
11.6.3 Nippon Steel and Sumitomo Metal Corporation: Financial Performance
11.6.4 Nippon Steel and Sumitomo Metal Corporation: Recent Strategic Initiatives
11.7 POSCO
11.7.1 POSCO: Overview
11.7.2 POSCO: Product Offerings
11.7.3 POSCO: Financial Performance
11.7.4 POSCO: Recent Strategic Initiatives
11.8 Jiangsu Shagang Group Co., Ltd.
11.8.1 Jiangsu Shagang Group Co., Ltd.: Overview
11.8.2 Jiangsu Shagang Group Co., Ltd.: Product Offerings
11.8.3 Jiangsu Shagang Group Co., Ltd.: Financial Performance
11.8.4 Jiangsu Shagang Group Co., Ltd.: Recent Strategic Initiatives
11.9 Shougang Group Co., Ltd.
11.9.1 Shougang Group Co., Ltd.: Overview
11.9.2 Shougang Group Co., Ltd.: Product Offerings
11.9.3 Shougang Group Co., Ltd.: Financial Performance
11.9.4 Shougang Group Co., Ltd.: Recent Strategic Initiatives
11.10 JFE Steel Corporation
11.10.1 JFE Steel Corporation: Overview
11.10.2 JFE Steel Corporation: Product Offerings
11.10.3 JFE Steel Corporation: Financial Performance
11.10.4 JFE Steel Corporation: Recent Strategic Initiatives
11.11 Tata Steel Group
11.11.1 Tata Steel Group: Overview
11.11.2 Tata Steel Group: Product Offerings
11.11.3 Tata Steel Group: Financial Performance
11.11.4 Tata Steel Group: Recent Strategic Initiatives
12. Glossary
Visiongain Report Sales Order Form
Appendix A
About Visiongain
Appendix
Visiongain report evaluation form
List of Figures
Figure 3.1 Global Steel Market – Share Analysis by Major Players
Figure 3.2 Chinese Automotive Production 2011-2017 (Million Units)
Figure 3.3 India Automotive Production 2008-2017 (Million Units)
Figure 3.4 Thailand Automotive Production 2012-2017 (Million Units)
Figure 3.5 Material Distribution in a Standard Vehicle (%)
Figure 3.6 Electric and Hybrid Vehicle Production 2016 & 2022
Figure 3.7 Steel Market – Porter’s Analysis
Figure 3.8 Low Bargaining Power of Suppliers
Figure 3.9 Low Bargaining Power of Buyers
Figure 3.10 Moderate to High Threat of New Entrant
Figure 3.11 Low to Moderate Threat of Substitutes
Figure 3.12 High Competitive Rivalry
Figure 4.1 Steel Production 1990-2012 (Million Tons, AGR %)
Figure 4.2 Steel Production 2013-2026 (Million Tons, AGR%)
Figure 4.3 Global Steel Consumption 2013-2016 (Million Tons, AGR%)
Figure 4.4 Steel Market Balance 2013-2016 (Million Tons, AGR %)
Figure 4.5 Steel Market Value 2013- 2016 (USD Bn, AGR %)
Figure 6.1 Global Steel Market by Process Market Share Forecast 2018, 2023, 2028 (% Share)
Figure 6.2 Global Steel Market by Process Market Value Share Forecast 2018, 2023, 2028 (% Share)
Figure 6.3 Hot Rolled Process Steel Market 2018-2028 (Million Tons, USD Bn)
Figure 6.4 Global Steel Market by Process Market Value Share Forecast 2018, 2023, 2028 (% Share)
Figure 6.5 Cold Rolled Process Steel Market 2018-2028 (Million Tons, USD Bn)
Figure 6.6 Global Steel Market by Process Market Value Share Forecast 2018, 2023, 2028 (% Share)
Figure 6.7 Direct Rolled Process Steel Market 2018-2028 (Million Tons, USD Bn)
Figure 6.8 Global Steel Market by Process Market Value Share Forecast 2018, 2023, 2028 (% Share)
Figure 6.9 Tubes Process Steel Market 2018-2028 (Million Tons, USD Bn)
Figure 6.10 Global Steel Market by Process Market Share Forecast 2018, 2023, 2028 (% Share)
Figure 6.11 Others Processes Steel Market 2018-2028 (Million Tons, USD Bn)
Figure 7.1 Global Steel Market by Steel Type Market Value Share Forecast 2018, 2023, 2028 (% Share)
Figure 7.2 Global Steel Market by Process Market Value Share Forecast 2018, 2023, 2028 (% Share)
Figure 7.3 Global Stainless Steel Production, Consumption, Balance and Value 2018-2028 (Million Tons, USD Bn)
Figure 7.4 Global Steel Market by Steel Type Market Value Share Forecast 2018, 2023, 2028 (% Share)
Figure 7.5 Carbon Steel Production, Consumption, Balance and Value 2018-2028 (Million Tons, USD Bn)
Figure 7.6 Global Steel Market by Steel Type Market Value Share Forecast 2018, 2023, 2028 (% Share)
Figure 7.7 Alloy Steel, Production, Consumption, Balance and Value (Million Tons, USD Bn) 2018-2028
Figure 7.8 Global Steel Market by Steel Type Market Value Share Forecast 2018, 2023, 2028 (% Share)
Figure 7.9 Other Steels, Production, Consumption, Balance and Value 2018-2028 (Million Tons, USD Bn)
Figure 8.1 Global Steel Market Value by End-user Industry Share Forecast 2018, 2023, 2028 (% Share)
Figure 8.2 Construction Market Value Share Forecast 2018, 2023, 2028 (% Share)
Figure 8.3 Construction Market Forecast 2018-2028 (Million Tons, USD Bn)
Figure 8.4 Automotive Market Value Share Forecast 2018, 2023, 2028 (% Share)
Figure 8.5 Automotive Market Forecast 2018-2028 (Million Tons, USD Bn)
Figure 8.6 Mechanical Engineering Market Value Share Forecast 2018, 2023, 2028 (% Share)
Figure 8.7 Mechanical Engineering Market Forecast 2018-2028 (Million Tons, USD Bn)
Figure 8.8 Electrical Engineering Market Value Share Forecast 2018, 2023, 2028 (% Share)
Figure 8.9 Electrical Engineering Market Forecast 2018-2028 (Million Tons, USD Bn)
Figure 8.10 Global Steel Market by End-user Industry Market Share Forecast 2018, 2023, 2028 (% Share)
Figure 8.11 Oil & Gas Market Forecast 2018-2028 (Million Tons, USD Bn)
Figure 8.12. Global Steel Market by End-user Industry Market Share Forecast 2018, 2023, 2028 (% Share)
Figure 8.13 Other End-User Industries Forecast 2018-2028 (Million Tons, USD Bn)
Figure 9.1 Global Steel Consumption Forecast by Application Share Forecast 2018, 2023, 2028 (% Share)
Figure 9.2 Global Steel Market Value Forecast by Application Share Forecast 2018, 2023, 2028 (% Share)
Figure 9.3 Domestic Appliance Application Consumption Share Forecast 2018, 2023, 2028 (% Share)
Figure 9.4 Domestic Appliance Application Market Forecast 2018-2028 (Million Tons, USD Bn)
Figure 9.5 Container Application Consumption Share Forecast 2018, 2023, 2028 (% Share)
Figure 9.6 Container Application Market Forecast 2018-2028 (Million Tons, USD Bn)
Figure 9.7 Shipbuilding Application Consumption Share Forecast 2018, 2023, 2028 (% Share)
Figure 9.8 Shipbuilding Application Market Forecast 2018-2028 (Million Tons, USD Bn)
Figure 9.9 Others Application Consumption Share Forecast 2018, 2023, 2028 (% Share)
Figure 9.10 Others Application Market Forecast 2018-2028 (Million Tons, USD Bn)
Figure. 10.1. Global Steel Production Market Share Forecast by Leading National Markets 2018 (% Share)
Figure. 10.2. Global Steel Production Market Share Forecast by Leading National Markets 2023 (% Share)
Figure. 10.3. Global Steel Production Market Share Forecast by Leading National Markets 2028 (% Share)
Figure 10.4. Global Steel Consumption Market Share Forecast by Leading National Markets 2018 (% Share)
Figure 10.5. Global Steel Consumption Market Share Forecast by Leading National Markets 2023 (% Share)
Figure 10.6. Global Steel Consumption Market Share Forecast by Leading National Markets 2028 (% Share)
Figure 10.7. Global Steel Market Value Share Forecast by Leading National Markets 2018 (% Share)
Figure 10.8. Global Steel Market Value Share Forecast by Leading National Markets 2023 (% Share)
Figure 10.9. Global Steel Market Value Share Forecast by Leading National Markets 2028 (% Share)
Figure 10.10 Leading National Steel Markets Production Forecast 2013-2028 (Million Tons)
Figure 10.11 Leading National Steel Markets Consumption Forecast 2013-2028 (Million Tons)
Figure 10.12 Leading National Steel Markets Value Forecast 2013-2028 (USD Bn)
Figure 10.13 US Steel Production Forecast 2013-2028 (Million Tons, AGR %)
Figure 10.14 US Steel Consumption Forecast 2013-2028 (Million Tons, AGR %)
Figure 10.15 US Steel Production Share Forecast 2018, 2023, 2028 (%)
Figure 10.16 US Steel Consumption Share Forecast 2018, 2023, 2028 (%)
Figure 10.17 US Steel Market Value Share Forecast 2018, 2023, 2028 (%)
Figure 10.18 US Steel Production, Consumption, Balance and Value Forecast 2018-2028 (Million Tons, US Bn)
Figure 10.19 Mexico Steel Production Forecast 2013-2028 (Million Tons, AGR %)
Figure 10.20 Mexico Steel Consumption Forecast 2013-2028 (Million Tons, AGR %)
Figure 10.21 Mexico Steel Production Share Forecast 2018, 2023, 2028 (%)
Figure 10.22 Mexico Steel Consumption Share Forecast 2018, 2023, 2028 (%)
Figure 10.23 Mexico Steel Market Value Share Forecast 2018, 2023, 2028 (%)
Figure 10.24 Mexico Steel Production, Consumption, Balance and Value Forecast, 2018-2028 (Million Tons, US Bn)
Figure 10.25 Germany Steel Production Forecast 2013-2028 (Million Tons, AGR%)
Figure 10.26 Germany Steel Consumption Forecast 2013-2028 (Million Tons, AGR%)
Figure 10.27 Germany Steel Production Share Forecast 2018, 2023, 2028 (%)
Figure 10.28 Germany Steel Consumption Share Forecast 2018, 2023, 2028 (%)
Figure 10.29 Germany Steel Market Value Share Forecast 2018, 2023, 2028 (%)
Figure 10.30 Germany Steel Production, Consumption, Balance and Value Forecast 2018-2028 (Million Tons, US Bn)
Figure 10.31 Italy Steel Production Forecast 2013-2028 (Million Tons, AGR %)
Figure 10.32. Italy Steel Consumption Forecast 2013-2028 (Million Tons, AGR%)
Figure 10.33 Italy Steel Production Share Forecast 2018, 2023, 2028 (%)
Figure 10.34 Italy Steel Consumption Share Forecast 2018, 2023, 2028 (%)
Figure 10.35 Italy Steel Market Value Share Forecast 2018, 2023, 2028 (%)
Figure 10.36 Italy Steel Production, Consumption, Balance and Value Forecast 2018-2028 (Million Tons, US Bn)
Figure 10.37 France Steel Production Forecast 2013-2028 (Million Tons, AGR %)
Figure 10.38 France Steel Consumption Forecast 2013-2028 (Million Tons, AGR%)
Figure 10.39 France Steel Production Share Forecast 2018, 2023, 2028 (%)
Figure 10.40 France Steel Consumption Share Forecast 2018, 2023, 2028 (%)
Figure 10.41 France Steel Market Value Share Forecast 2018, 2023, 2028 (%)
Figure 10.42 France Steel Production, Consumption, Balance and Value Forecast, 2018-2028 (Million Tons, US Bn)
Figure 10.43 Spain Steel Production Forecast 2013-2028 (Million Tons, AGR%)
Figure 10.44 Spain Steel Consumption Forecast 2013-2028 (Million Tons, AGR %)
Figure 10.45 Spain Steel Production Share Forecast 2018, 2023, 2028 (%)
Figure 10.46 Spain Steel Consumption Share Forecast 2018, 2023, 2028 (%)
Figure 10.47 Spain Steel Market Value Share Forecast 2018, 2023, 2028 (%)
Figure 10.48 Spain Steel Production, Consumption, Balance and Value Forecast, 2018-2028 (Million Tons, US Bn)
Figure 10.49 Russia Steel Production Forecast 2013-2028 (Million Tons, AGR %)
Figure 10.50 Russia Steel Consumption Forecast 2013-2028 (Million Tons, AGR%)
Figure 10.51 Russia Steel Production Share Forecast 2018, 2023, 2028 (%)
Figure 10.52 Russia Steel Consumption Share Forecast 2018, 2023, 2028 (%)
Figure 10.53 Russia Steel Market Value Share Forecast 2018, 2023, 2028 (%)
Figure 10.54 Ukraine Steel Production Forecast 2013-2028 (Million Tons, AGR%)
Figure 10.55 Ukraine Steel Consumption Forecast 2013-2028 (Million Tons, AGR%)
Figure 10.56 Ukraine Steel Production Share Forecast 2018, 2023, 2028 (%)
Figure 10.57 Ukraine Steel Consumption Share Forecast 2018, 2023, 2028 (%)
Figure 10.58 Ukraine Steel Market Value Share Forecast 2018, 2023, 2028 (%)
Figure 10.59 Ukraine Steel Production, Consumption, Balance and Value Forecast, 2018-2028 (Million Tons, US Bn)
Figure 10.60 India Steel Production Forecast 2013-2028 (Million Tons, AGR%)
Figure 10.61 India Steel Consumption Forecast 2013-2028 (Million Tons, AGR%)
Figure 10.62 India Steel Production Share Forecast 2018, 2023, 2028 (%)
Figure 10.63 India Steel Consumption Share Forecast 2018, 2023, 2028 (%)
Figure 10.64 India Steel Market Value Share Forecast 2018, 2023, 2028 (%)
Figure 10.65 India Steel Production, Consumption, Balance and Value Forecast, 2018-2028 (Million Tons, US Bn)
Figure 10.66 China Steel Production Forecast 2013-2028 (Million Tons, AGR %)
Figure 10.67 China Steel Consumption (Million Tons) and AGR (%), 2013-2028
Figure 10.68 China Steel Production Share Forecast 2018, 2023, 2028 (%)
Figure 10.69 China Steel Consumption Share Forecast 2018, 2023, 2028 (%)
Figure 10.70 China Steel Market Value Share Forecast 2018, 2023, 2028 (%)
Figure 10.71 China Steel Production, Consumption, Balance and Value Forecast, 2018-2028 (Million Tons, US Bn)
Figure 10.72 Japan Steel Production Forecast 2013-2028 (Million Tons, AGR%)
Figure 10.73 Japan Steel Consumption Forecast 2013-2028 (Million Tons, AGR%)
Figure 10.74 Japan Steel Production Share Forecast 2018, 2023, 2028 (%)
Figure 10.75 Japan Steel Consumption Share Forecast 2018, 2023, 2028 (%)
Figure 10.76 Japan Steel Market Value Share Forecast 2018, 2023, 2028 (%)
Figure 10.77 Japan Steel Production, Consumption, Balance and Value Forecast, 2018-2028 (Million Tons, US Bn)
Figure 10.78 South Korea Steel Production Forecast 2013-2028 (Million Tons, AGR%)
Figure 10.79 South Korea Steel Consumption Forecast 2013-2028 (Million Tons, AGR%)
Figure 10.80 South Korea Steel Production Share Forecast 2018, 2023, 2028 (%)
Figure 10.81 South Korea Steel Consumption Share Forecast 2018, 2023, 2028 (%)
Figure 10.82 South Korea Steel Market Value Share Forecast 2018, 2023, 2028 (%)
Figure 10.83 South Korea Steel Production, Consumption, Balance and Value Forecast, 2018-2028 (Million Tons, US Bn)
Figure 10.84 Taiwan Steel Production Forecast 2013-2028 (Million Tons, AGR%)
Figure 10.85 Taiwan Steel Consumption Forecast 2013-2028 (Million Tons, AGR%)
Figure 10.86 Taiwan Steel Production Share Forecast 2018, 2023, 2028 (%)
Figure 10.87 Taiwan Steel Consumption Share Forecast 2018, 2023, 2028 (%)
Figure 10.88 Taiwan Steel Market Value Share Forecast 2018, 2023, 2028 (%)
Figure 10.89 Taiwan Steel Production, Consumption, Balance and Value Forecast, 2018-2028 (Million Tons, US Bn)
Figure 10.90 Turkey Steel Production Forecast 2013-2028 (Million Tons, AGR%)
Figure 10.91 Turkey Steel Consumption Forecast 2013-2028 (Million Tons, AGR%)
Figure 10.92 Turkey Steel Production Share Forecast 2018, 2023, 2028 (%)
Figure 10.93 Turkey Steel Consumption Share Forecast 2018, 2023, 2028 (%)
Figure 10.94 Turkey Steel Market Value Share Forecast 2018, 2023, 2028 (%)
Figure 10.95 Turkey Steel Production, Consumption, Balance and Value Forecast, 2018-2028 (Million Tons, US Bn)
Figure 10.96 Brazil Steel Production Forecast 2013-2028 (Million Tons, AGR%)
Figure 10.97 Brazil Steel Consumption Forecast 2013-2028 (Million Tons, AGR%)
Figure 10.98 Brazil Steel Production Share Forecast 2018, 2023, 2028 (%)
Figure 10.99 Brazil Steel Consumption Share Forecast 2018, 2023, 2028 (%)
Figure 10.100 Brazil Steel Market Value Share Forecast 2018, 2023, 2028 (%)
Figure 10.101 Brazil Steel Production, Consumption, Balance and Value Forecast, 2018-2028 (Million Tons, US Bn)
Figure 10.102 Iran Steel Production Forecast 2013-2028 (Million Tons, AGR%)
Figure 10.103 Iran Steel Consumption Forecast 2013-2028 (Million Tons, AGR%)
Figure 10.104 Iran Steel Production Share Forecast 2018, 2023, 2028 (%)
Figure 10.105 Iran Steel Consumption Share Forecast 2018, 2023, 2028 (%)
Figure 10.106 Iran Steel Market Value Share Forecast 2018, 2023, 2028 (%)
Figure 10.107 Iran Steel Production, Consumption, Balance and Value Forecast, 2018-2028 (Million Tons, US Bn)
Figure 10.108 Indonesia Steel Production Forecast 2013-2028 (Million Tons, AGR %)
Figure 10.109 Indonesia Steel Consumption Forecast 2013-2028 (Million Tons, AGR%)
Figure 10.110 Indonesia Steel Production Share Forecast 2018, 2023, 2028 (%)
Figure 10.111. Indonesia Steel Consumption Share Forecast 2018, 2023, 2028 (%)
Figure 10.112. Indonesia Steel Market Value Share Forecast 2018, 2023, 2028 (%)
Figure 10.113 Indonesia Steel Production, Consumption, Balance and Value Forecast 2018-2028 (Million Tons, US Bn)
Figure 10.114 Thailand Steel Production Forecast 2013-2028 (Million Tons, AGR %)
Figure 10.115 Thailand Steel Consumption Forecast 2013-2028 (Million Tons, AGR%)
Figure 10.116 Thailand Steel Production Share Forecast 2018, 2023, 2028 (%)
Figure 10.117 Thailand Steel Consumption Share Forecast 2018, 2023, 2028 (%)
Figure 10.118 Thailand Steel Market Value Share Forecast 2018, 2023, 2028 (%)
Figure 10.119 Thailand Steel Production, Consumption, Balance and Value Forecast 2018-2028 (Million Tons, US Bn)
Figure 10.120 Malaysia Steel Production Forecast 2013-2028 (Million Tons, AGR %)
Figure 10.121 Malaysia Steel Consumption Forecast 2013-2028 (Million Tons, AGR%)
Figure 10.122 Malaysia Steel Production Share Forecast 2018, 2023, 2028 (%)
Figure 10.123 Malaysia Steel Consumption Share Forecast 2018, 2023, 2028 (%)
Figure 10.124 Malaysia Steel Market Value Share Forecast 2018, 2023, 2028 (%)
Figure 10.125 Malaysia Steel Production, Consumption, Balance and Value Forecast 2018-2028 (Million Tons, US Bn)
Figure 10.126 Philippines Steel Production Forecast 2013-2028 (Million Tons, AGR %)
Figure 10.127 Philippines Steel Consumption Forecast 2013-2028 (Million Tons, AGR%)
Figure 10.128 Philippines Steel Production Share Forecast 2018, 2023, 2028 (%)
Figure 10.129 Philippines Steel Consumption Share Forecast 2018, 2023, 2028 (%)
Figure 10.130 Philippines Steel Market Value Share Forecast 2018, 2023, 2028 (%)
Figure 10.131 Philippines Steel Production, Consumption, Balance and Value Forecast 2018-2028 (Million Tons, US Bn)
Figure 10.132 Vietnam Steel Production Forecast 2013-2028 (Million Tons, AGR %)
Figure 10.133 Vietnam Steel Consumption Forecast 2013-2028 (Million Tons, AGR%)
Figure 10.134 Vietnam Steel Production Share Forecast 2018, 2023, 2028 (%)
Figure 10.135 Vietnam Steel Consumption Share Forecast 2018, 2023, 2028 (%)
Figure 10.136 Vietnam Steel Market Value Share Forecast 2018, 2023, 2028 (%)
Figure 10.137 Vietnam Steel Production, Consumption, Balance and Value Forecast 2018-2028 (Million Tons, US Bn)
Figure 10.138 Bangladesh Steel Production Forecast 2013-2028 (Million Tons, AGR %)
Figure 10.139 Bangladesh Steel Consumption Forecast 2013-2028 (Million Tons, AGR%)
Figure 10.140 Bangladesh Steel Production Share Forecast 2018, 2023, 2028 (%)
Figure 10.141 Bangladesh Steel Consumption Share Forecast 2018, 2023, 2028 (%)
Figure 10.142 Bangladesh Steel Market Value Share Forecast 2018, 2023, 2028 (%)
Figure 10.143 Bangladesh Steel Production, Consumption, Balance and Value Forecast 2018-2028 (Million Tons, US Bn)
Figure 10.144 Pakistan Steel Production Forecast 2013-2028 (Million Tons, AGR %)
Figure 10.145 Pakistan Steel Consumption Forecast 2013-2028 (Million Tons, AGR%)
Figure 10.146 Pakistan Steel Production Share Forecast 2018, 2023, 2028 (%)
Figure 10.147 Pakistan Steel Consumption Share Forecast 2018, 2023, 2028 (%)
Figure 10.148 Pakistan Steel Market Value Share Forecast 2018, 2023, 2028 (%)
Figure 10.149 Pakistan Steel Production, Consumption, Balance and Value Forecast 2018-2028 (Million Tons, US Bn)
Figure 10.150 Myanmar Steel Production Forecast 2013-2028 (Million Tons, AGR %)
Figure 10.151 Myanmar Steel Consumption Forecast 2013-2028 (Million Tons, AGR%)
Figure 10.152 Myanmar Steel Production Share Forecast 2018, 2023, 2028 (%)
Figure 10.153 Myanmar Steel Consumption Share Forecast 2018, 2023, 2028 (%)
Figure 10.154 Myanmar Steel Market Value Share Forecast 2018, 2023, 2028 (%)
Figure 10.155 Myanmar Steel Production, Consumption, Balance and Value Forecast 2018-2028 (Million Tons, US Bn)
Figure 10.156 Australia Steel Production Forecast 2013-2028 (Million Tons, AGR %)
Figure 10.157 Australia Steel Consumption Forecast 2013-2028 (Million Tons, AGR%)
Figure 10.158 Australia Steel Production Share Forecast 2018, 2023, 2028 (%)
Figure 10.159 Australia Steel Consumption Share Forecast 2018, 2023, 2028 (%)
Figure 10.160 Australia Steel Market Value Share Forecast 2018, 2023, 2028 (%)
Figure 10.161 Australia Steel Production, Consumption, Balance and Value Forecast 2018-2028 (Million Tons, US Bn)
Figure 10.162 RoW Steel Production Forecast 2013-2028 (Million Tons, AGR%)
Figure 10.163 RoW Steel Consumption Forecast 2013-2028 (Million Tons, AGR%)
Figure 10.164 Rest of the World Steel Production Share Forecast 2018, 2023, 2028 (%)
Figure 10.165 Rest of the World Steel Consumption Share Forecast 2018, 2023, 2028 (%)
Figure 10.166 Rest of the World Steel Market Value Share Forecast 2018, 2023, 2028 (%)
Figure 10.167 RoW Steel Production, Consumption, Balance and Value Forecast 2018-2028 (Million Tons, US Bn)
Figure 11.1 ArcelorMittal Recent Revenue 2013-2017 (USD Bn, AGR%)
Figure 11.2 ArcelorMittal Revenue by Business Segments 2017 (%)
Figure 11.3 ArcelorMittal Revenue by Region 2017 (%)
Figure 11.4 Nippon Steel and Sumitomo Metal Corporation Revenues 2014-2017 (USD Bn, AGR%)
Figure 11.5 Nippon Steel and Sumitomo Metal Corporation Revenue by Business Segments 2017 (%)
Figure 11.6 Nippon Steel and Sumitomo Metal Corporation Revenue by Geographical Segments 2017 (%)
Figure 11.7 POSCO Revenues 2013-2017 (USD Bn, AGR%)
Figure 11.8 POSCO Revenue by Business Segments 2017 (%)
Figure 11.9 POSCO Revenue by Region 2017 (%)
Figure 11.10 Jiangsu Shagang Group Co., Ltd. Revenues 2014-2017 (USD Bn, AGR%)
Figure 11.11 JFE Steel Corporation Revenues 2014-2017 (USD Bn, AGR%)
Figure 11.12 JFE Steel Corporation Revenue by Business Segments 2017 (%)
Figure 11.13 Tata Steel Corporation Revenues 2014-2017 (USD Bn, AGR %)
List of Tables
Table 1.1 Global Steel Market Segmentation
Table 5.1 Global Steel Production Forecast 2018-2028 (Million Tons, AGR %, CAGR%)
Table 5.2 Global Steel Consumption Forecast 2018-2028 (Million Tons, AGR %, CAGR%)
Table 5.3 Global Steel Market Balance Forecast 2018-2028 (Million Tons, AGR %, CAGR%)
Table 5.4 Global Steel Market Value Forecast 2018-2028 (US Bn, AGR %, CAGR%)
Table 6.1 Global Steel Market Volume Forecast by Process 2018-2028 (Million Tons, AGR %, CAGR%)
Table 6.2 Global Steel Market Value Forecast by Process 2018-2028 (USD Bn, AGR %, CAGR%)
Table 7.1 Global Steel Production Forecast by Steel Type 2018-2028 (Million Tons, AGR %, CAGR%)
Table 7.2 Global Steel Consumption Forecast by Steel Type 2018-2028 (Million Tons, AGR %, CAGR%)
Table 7.3 Global Steel Market Balance Forecast by Steel Type 2018-2028 (Million USD, AGR %, CAGR%)
Table 7.4 Global Steel Market Value Forecast by Steel Type 2018-2028 (USD Bn, AGR %, CAGR%)
Table 8.1 Global Steel Consumption Forecast by End-User Industry 2018-2028 (Million Tons, AGR %, CAGR%)
Table 8.2 Global Steel Market Value Forecast by End-User Industry 2018-2028 (USD Bn, AGR %, CAGR%)
Table 9.1 Global Steel Consumption Forecast by Application 2018-2028 (Million Tons, AGR %, CAGR%)
Table 9.2 Global Steel Market Value Forecast by Application 2018-2028 (Million Tons, AGR %, CAGR%)
Table 10.1 Global Steel Production Forecast by Leading National Markets 2018-2028 (Million Tons, AGR %, CAGR%)
Table 10.2 Global Steel Consumption Forecast by Leading National Markets 2018-2028 (Million Tons, AGR %, CAGR%)
Table 10.3 Global Steel Market Value Forecast by Leading National Markets 2018-2028 (Million Tons, AGR %, CAGR%)
Table 10.4 US Steel Production Forecast 2018-2028 (Million Tons, AGR %, CAGR%)
Table 10.5. US Steel Consumption Forecast 2018-2028 (Million Tons, AGR %, CAGR%)
Table 10.6. Mexico Steel Production Forecast 2018-2028 (Million Tons, AGR %, CAGR%)
Table 10.7. Mexico Steel Consumption Forecast 2018-2028 (Million Tons, AGR %, CAGR%)
Table 10.8 Germany Steel Production Forecast 2018-2028 (Million Tons, AGR %, CAGR%)
Table 10.9 Germany Steel Consumption Forecast 2018-2028 (Million Tons, AGR %, CAGR%)
Table 10.10 Italy Steel Production Forecast 2018-2028 (Million Tons, AGR %, CAGR%)
Table 10.11. Italy Steel Consumption Forecast 2018-2028 (Million Tons, AGR %, CAGR%)
Table 10.12 France Steel Production Forecast 2018-2028 (Million Tons, AGR %, CAGR%)
Table 10.13. France Steel Consumption Forecast 2018-2028 (Million Tons, AGR %, CAGR%)
Table 10.14 Spain Steel Production Forecast 2018-2028 (Million Tons, AGR %, CAGR%)
Table 10.15. Spain Steel Consumption Forecast 2018-2028 (Million Tons, AGR %, CAGR%)
Table 10.16. Russia Steel Production Forecast 2018-2028 (Million Tons, AGR %, CAGR%)
Table 10.17 Russia Steel Consumption Forecast 2018-2028 (Million Tons, AGR %, CAGR%)
Table 10.18 Ukraine Steel Production Forecast 2018-2028 (Million Tons, AGR %, CAGR%)
Table 10.19 Ukraine Steel Consumption Forecast 2018-2028 (Million Tons, AGR %, CAGR%)
Table 10.20 India Steel Production Forecast 2018-2028 (Million Tons, AGR %, CAGR%)
Table 10.21 India Steel Consumption Forecast 2018-2028 (Million Tons, AGR %, CAGR%)
Table 10.22 China Steel Production Forecast 2018-2028 (Million Tons, AGR %, CAGR%)
Table 10.23 China Steel Consumption Forecast 2018-2028 (Million Tons, AGR %, CAGR%)
Table 10.24 Japan Steel Production Forecast 2018-2028 (Million Tons, AGR %, CAGR%)
Table 10.25 Japan Steel Consumption Forecast 2018-2028 (Million Tons, AGR %, CAGR%)
Table 10.26 South Korea Steel Production Forecast 2018-2028 (Million Tons, AGR %, CAGR%)
Table 10.27 South Korea Steel Consumption Forecast 2018-2028 (Million Tons, AGR %, CAGR%)
Table 10.28 Taiwan Steel Production Forecast 2018-2028 (Million Tons, AGR %, CAGR%)
Table 10.29 Taiwan Steel Consumption Forecast 2018-2028 (Million Tons, AGR %, CAGR%)
Table 10.30 Turkey Steel Production Forecast 2018-2028 (Million Tons, AGR %, CAGR%)
Table 10.31. Turkey Steel Consumption Forecast 2018-2028 (Million Tons, AGR %, CAGR%)
Table 10.32 Brazil Steel Production Forecast 2018-2028 (Million Tons, AGR %, CAGR%)
Table 10.33 Brazil Steel Consumption Forecast 2018-2028 (Million Tons, AGR %, CAGR%)
Table 10.34 Iran Steel Production Forecast 2018-2028 (Million Tons, AGR %, CAGR%)
Table 10.35 Iran Steel Consumption Forecast 2018-2028 (Million Tons, AGR %, CAGR%)
Table 10.36 Indonesia Steel Production Forecast 2018-2028 (Million Tons, AGR %, CAGR%)
Table 10.37 Indonesia Steel Consumption Forecast 2018-2028 (Million Tons, AGR %, CAGR%)
Table 10.38. Thailand Steel Production Forecast 2018-2028 (Million Tons, AGR %, CAGR%)
Table 10.39 Thailand Steel Consumption Forecast 2018-2028 (Million Tons, AGR %, CAGR%)
Table 10.40 Malaysia Steel Production Forecast 2018-2028 (Million Tons, AGR %, CAGR%)
Table 10.41 Malaysia Steel Consumption Forecast 2018-2028 (Million Tons, AGR %, CAGR%)
Table 10.42 Philippines Steel Production Forecast 2018-2028 (Million Tons, AGR %, CAGR%)
Table 10.43 Philippines Steel Consumption Forecast 2018-2028 (Million Tons, AGR %, CAGR%)
Table 10.44 Vietnam Steel Production Forecast 2018-2028 (Million Tons, AGR %, CAGR%)
Table 10.45 Vietnam Steel Consumption Forecast 2018-2028 (Million Tons, AGR %, CAGR%)
Table 10.46 Bangladesh Steel Production Forecast 2018-2028 (Million Tons, AGR %, CAGR%)
Table 10.47 Bangladesh Steel Market Consumption Forecast 2018-2028 (Million Tons, AGR %, CAGR%)
Table 10.48 Pakistan Steel Production Forecast 2018-2028 (Million Tons, AGR %, CAGR%)
Table 10.49 Pakistan Steel Consumption Forecast 2018-2028 (Million Tons, AGR %, CAGR%)
Table 10.50 Myanmar Steel Production Forecast 2018-2028 (Million Tons, AGR %, CAGR%)
Table 10.51 Myanmar Steel Consumption Forecast 2018-2028 (Million Tons, AGR %, CAGR%)
Table 10.52 Australia Steel Production Forecast 2018-2028 (Million Tons, AGR %, CAGR%)
Table 10.53 Australia Steel Consumption Forecast 2018-2028 (Million Tons, AGR %, CAGR%)
Table 10.54 RoW Steel Production Forecast 2018-2028 (Million Tons, AGR %, CAGR%)
Table 10.55 RoW Steel Consumption Forecast 2018-2028 (Million Tons, AGR %, CAGR%)
Table 11.1 Top Global Steel Market Players by Production (Million Tons) 2017
Table 11.2 Ansteel Group: Product Lines and Products 2018
Table 11.3 Ansteel Group: Financial Performance 2016-2017
Table 11.4 ArcelorMittal: Product Lines and Products 2018
Table 11.5 ArcelorMittal: Financial Performance 2016-2017
Table 11.6 China Baowu Group: Product Lines and Products 2018
Table 11.7 China Baowu Group: Financial Performance
Table 11.8 HBIS Group Product Lines and Products 2018
Table 11.9 Nippon Steel and Sumitomo Metal Corporation Product Lines and Products 2018
Table 11.10 Nippon Steel and Sumitomo Metal Corporation Financial Performance 2016-2017
Table 11.11 Product Lines and Products, 2018
Table 11.12 POSCO: Financial Performance
Table 11.13 Jiangsu Shagang Group Co., Ltd.: Product Lines and Products 2018
Table 11.14 Jiangsu Shagang Group Co., Ltd.: Financial Performance
Table 11.15 Shougang Group Co., Ltd.: Product Lines and Products 2018
Table 11.16 Shougang Group Co., Ltd.: Financial Performance 2016-2017
Table 11.17 Product Lines and Products 2018
Table 11.18 JFE Steel Corporation: Financial Performance 2016-2017
Table 11.19 Tata Steel Group: Product Lines and Products 2018
Table 11.20 Tata Steel Group: Financial Performance 2016-2017
Table 11.18 JFE Steel Corporation: Financial Performance 2016-2017
Table 11.19 Tata Steel Group: Product Lines and Products 2018
Table 11.20 Tata Steel Group: Financial Performance 2016-2017
ALBA Group
Alderon
Ansteel Group
ArcelorMittal
Auto Alliance Thailand (Ford and Mazda)
Bao Viet (BVSC)
Bethlehem Steel
BMW Manufacturing
Bosch
Charoen Pokphand Group (CP)
China Baowu Group
China Green Fund and China Merchants Finance Holdings Co., Ltd.
Continental
Denso
Dow Chemical
Faurecia
Ford Motor Company
General Motors
Hanbo Steel
Hanwa Co., Ltd. (Hanwa)
HBIS Group
Hebei Iron & Steel Group
Hino Motors
Honda Automobile
Hyundai Steel
Isuzu Motors
JFE Shoji Trade Corporation (JFE Shoji)
JFE Steel Corporation
Johnson Controls
Kangwon Industries
Kia Special Steel
Lear
LTV Steel
Magna International
Marubeni-Itochu Steel Inc. (MISI)
Meranti Steel Pte. Ltd. (Meranti)
Mercedes-Benz Thailand
Mitsubishi Motors
Nippon Steel & Sumitomo Metal Corporation (NSSMC)
Nissan Motors
Ovako Group
POSCO
SAIC Motor Corp
Sami Special Steel
Shagang Group
Shandong State-owned Assets Investment Holding Co., Ltd.
Shougang Group
Suzuki Motor
Tata Motors
Tata Steel Group
Teijin Ltd.
ThyssenKrupp
Toyota Motors
Triton
Volvo Car Thailand
Yazaki
ZF Friedrichshafen
List of Other Organisations Mentioned in this Report
Organisation for Economic Co-operation and Development (OECD)
The American Iron and Steel Institute (AISI)
The Government of China
The International Organization of Motor Vehicle Manufacturers
The Ministry of Finance
The Ministry of Shipping, Road Transport and Highways
The Thailand Board of Investment (BOI)
The World Steel Association (WSA)
Download sample pages
Complete the form below to download your free sample pages for Steel Market Report 2018-2028
Related reports
-

3D Printing Yearbook 2018
Visiongain’s report on 3D Printing sector gives a detailed overview of the market, revealing insight by industry vertical, technology, by...
Full DetailsPublished: 30 July 2018 -

3D Concrete Printing Market Report 2019-2029
Modern buildings and structures make fantastic use of defying convention and form and defying gravity at times. Because of the...Full DetailsPublished: 03 April 2019 -

Geotextiles Market Report 2018-2028
Geotextiles are part of the geosynthetic group of materials which include geogrids, geomembranes, geopipes, geocomposites, geosynthetic clay liners, and geonets....
Full DetailsPublished: 24 October 2018 -

Building Thermal Insulation Market Report 2019-2029
With an incredible amount of attention devoted to building thermal insulation market, deriving market prospects and opportunities can be difficult....Full DetailsPublished: 22 May 2019 -

Hydrogen Generator Market Analysis Report 2017-2027
Visiongain evaluates the hydrogen generator market at $914m in 2017 with major opportunities for incumbent and new entrants to capitalise...Full DetailsPublished: 09 August 2017 -

Carbon Fibre Reinforced Plastic (CFRP) Composites Market Report 2017-2027
Are you looking for a definitive report on the $33.5bn Carbon Fibre Reinforced Plastic (CFRP) Composites sector? With this definitive...Full DetailsPublished: 10 August 2017 -

Building Thermal Insulation Market Analysis & Forecasts 2018-2028
Visiongain’s new 195-page research report assesses that the global Building Thermal Insulation market will reach $26.1 billion in 2018.
...Full DetailsPublished: 22 May 2018 -

Cranes and Hoists Market Report 2018-2028
The USD 38.24 billion cranes & hoists market is expected to flourish in the next few years because of continual...Full DetailsPublished: 30 August 2018 -

Glass Packaging Market Report 2019-2029
The latest report from business intelligence provider Visiongain offers a comprehensive analysis of the global Glass Packaging market. Visiongain assesses...
Full DetailsPublished: 03 June 2019 -

Polymer Nanocomposites Market 2017-2027
Visiongain’s new 173 pages report assesses that the Polymer Nanocomposites market will reach $6.05 billion in 2017....Full DetailsPublished: 13 March 2017
Download sample pages
Complete the form below to download your free sample pages for Steel Market Report 2018-2028
Do you have any custom requirements we can help you with?
Any specific country, geo region, market segment or specific company information?
Email us today, we can discuss your needs and see how we can help: jamie.roberts@visiongain.com
Would you like a free report overview of the report of your choice?
If so, please drop an email to Jamie Roberts stating your chosen report title to jamie.roberts@visiongain.com
Visiongain construction reports are compiled using a broad and rich mixture of both primary and secondary information to produce an overall industry outlook. In order to provide our clients with the best product possible product, we do not rely on any one single source of information. Visiongain analysts reach out to market-leading vendors and automotive industry experts but also review a wealth of financial data and product information from a vast range of sources. To find out more about our reports methodology please email jamie.roberts@visiongain.com
Would you like to get the latest Visiongain construction reports catalogue?
What are the dynamic growth sectors? where are the regional business opportunities?
Which technologies will prevail and who are the leading companies succeeding in these sectors and why?
If you want definitive answers to business critical questions, discover Visiongain’s full range of business intelligence reports.
If so, please email Jamie Roberts on jamie.roberts@visiongain.com or call her today on +44 207 336 6100
Latest Construction news
Rolled Copper Products Market
The global Rolled Copper Products market was valued at US$24.87 billion in 2023 and is projected to grow at a CAGR of 5.7% during the forecast period 2024-2034.
15 May 2024
Green Cement Market
The global Green Cement market was valued at US$18.3 billion in 2024 and is expected to reach US$38.4 billion by 2034 at a CAGR of 7.7% during the forecast period 2024-2034.
01 May 2024
Visiongain Publishes Carbon Fibre Reinforced Plastic (CFRP) Composites Market Report 2024-2034
The global Carbon Fibre Reinforced Plastic (CFRP) Composites market was valued at US$23.88 billion in 2024 and is projected to grow at a CAGR of 9.9% during the forecast period 2024-2034.
27 November 2023
Visiongain Publishes Magnesium Alloys Market Report 2023-2033
The global Magnesium Alloys market was valued at US$1,550.6 million in 2022 and is projected to grow at a CAGR of 7.3% during the forecast period 2023-2033
25 May 2023
