• Do you need definitive cranes & hoists market data?
• Succinct cranes & hoists market analysis?
• Technological insight?
• Clear competitor analysis?
• Actionable business recommendations?
Read on to discover how this definitive report can transform your own research and save you time.
The growing construction industry is one of the key drivers of the cranes market around the world. The shipbuilding industry is also being driven by rising demand for commodities and other raw materials worldwide and this will also propel the growth of the global cranes market during the forecast period.
The Asia Pacific region in particular will witness the fastest growth due to increasing infrastructure developments and rising construction activities in emerging economies such as China , India and South Korea.
These developments have led Visiongain to publish this new report. The USD 38.24 billion cranes & hoists market is expected to flourish in the next few years because of continual economic development driving growth to new heights. If you want to be part of this growing industry, then read on to discover how you can maximise your investment potential.
Report highlights
• 135 tables, charts, and graphs
Leading Companies Profiled With Market Share Analysis
• Liebherr Cranes, Inc.
• Terex Cranes, Inc.
• Cargotec Crane & Electrical Services Inc
• XCMG Construction Machinery Co., Ltd.
• The Manitowoc Company, Inc.
• Tadano Ltd
• Konecranes Plc
• Palfinger AG
• Kobelco Cranes Co., Ltd
• Zoomlion
• Hitachi Sumitomo Heavy Industries Construction Crane Co., Ltd.
• TTS Group
Global Cranes & Hoists Market Outlook And Analysis From 2018-2028
Regional Cranes & Hoists Market Forecast 2018-2028
North America Cranes & Hoists Market Forecast 2018-2028
• US Cranes & Hoists Market Forecast 2018-2028
• Canada Cranes & Hoists Market Forecast 2018-2028
• Mexico Cranes & Hoists Market Forecast 2018-2028
• Rest of North America Cranes & Hoists Market Forecast 2018-2028
Europe Cranes & Hoists Market Forecast 2018-2028
• UK Cranes & Hoists Market Forecast 2018-2028
• France Cranes & Hoists Market Forecast 2018-2028
• Germany Cranes & Hoists Market Forecast 2018-2028
• Russia Cranes & Hoists Market Forecast 2018-2028
• Italy Cranes & Hoists Market Forecast 2018-2028
• Sweden Cranes & Hoists Market Forecast 2018-2028
• Spain Cranes & Hoists Market Forecast 2018-2028
• Rest of Europe Cranes & Hoists Market Forecast 2018-2028
Asia Pacific Cranes & Hoists Market Forecast 2018-2028
• Japan Cranes & Hoists Market Forecast 2018-2028
• China Cranes & Hoists Market Forecast 2018-2028
• India Cranes & Hoists Market Forecast 2018-2028
• South Korea Cranes & Hoists Market Forecast 2018-2028
• Australia Cranes & Hoists Market Forecast 2018-2028
• Rest of Asia Pacific Cranes & Hoists Market Forecast 2018-2028
South America Cranes & Hoists Market Forecast 2018-2028
• Argentina Cranes & Hoists Market Forecast 2018-2028
• Brazil Cranes & Hoists Market Forecast 2018-2028
• Rest of South America Cranes & Hoists Market Forecast 2018-2028
Middle East & Africa Cranes & Hoists Market Forecast 2018-2028
• Egypt Cranes & Hoists Market Forecast 2018-2028
• UAE Cranes & Hoists Market Forecast 2018-2028
• Saudi Arabia Cranes & Hoists Market Forecast 2018-2028
• South Africa Cranes & Hoists Market Forecast 2018-2028
• Rest of MEA Cranes & Hoists Market Forecast 2018-2028
Cranes & Hoists Market Forecast 2018-2028 By Type
Mobile Cranes Market Forecast 2018-2028
• Wheel Mounted (Telescopic (Single Control, Multi Control), Lattice, Knuckle) Market Forecast 2018-2028
• Truck Mounted (Hydraulic, Articulated, Trolley, Stiff) Market Forecast 2018-2028
• Crawler (Lattice, Hydraulic) Market Forecast 2018-2028
• Side Boom (Wheeled, Tracked) Market Forecast 2018-2028
• Straddle Cranes Market Forecast 2018-2028
• Railroad Cranes Market Forecast 2018-2028
• Aerial Cranes Market Forecast 2018-2028
• Other Mobile Cranes Market Forecast 2018-2028
Fixed Cranes Market Forecast 2018-2028
• Monorail & Underhung (Monorail Carrier, Power Operated Hoist, Electric Hoist) Cranes Market Forecast 2018-2028
• Overhead Track Mounted (Overhead Travelling, Wall, Gantry(Semi-Gantry, Gantry, Cantilever), Bridge) Cranes Market Forecast 2018-2028
• Tower (Saddle Jib, Luffing Jib, Self-Erecting (Telescoping, Inner & Outer Towers, Other)) Cranes Market Forecast 2018-2028
• Stiff Leg Derrik) Cranes Market Forecast 2018-2028
Marine & Port Cranes Market Forecast 2018-2028
• Mobile Harbour Cranes Market Forecast 2018-2028
• Fixed Harbour Cranes Market Forecast 2018-2028
• Offshore Cranes Market Forecast 2018-2028
• Ship Cranes Market Forecast 2018-2028
Others Market Forecast 2018-2028
Cranes & Hoists Market Forecast 2018-2028 By Industry Application
• Construction Cranes Market Forecast 2018-2028
• Infrastructure Cranes Market Forecast 2018-2028
• Mining & Excavation Cranes Market Forecast 2018-2028
• Shipyards Cranes Market Forecast 2018-2028
• Automotive Cranes Market Forecast 2018-2028
• Key questions answered
• What does the future hold for the Cranes & Hoists industry?
• Where should you target your business strategy?
• Which applications should you focus upon?
• Which disruptive technologies should you invest in?
• Which companies should you form strategic alliances with?
• Which company is likely to success and why?
• What business models should you adopt?
• What industry trends should you be aware of?
Target audience
• Crane manufacturers
• Component suppliers
• Construction companies
• Shipping companies
• Mining companies
• Energy companies
• Automotive companies
• Infrastructure companies
• CEOs
• Senior executives
• Marketing staff
• Market analysts
• Procurement staff
• Company managers
• Industry administrators
• Industry associations
• Company procurement departments
• Consultants
• Governmental departments & agencies
• R&D staff
• Business development managers
• Investors
• Governments
• Agencies
• Banks
Visiongain is a trading partner with the US Federal Government
CCR Ref number: KD4R6
1. Report Overview
1.1 Global Cranes and Hoists Market Overview
1.2 Why You Should Read This Report
1.3 How This Report Delivers
1.4 Key Questions Answered by This Analytical Report Include:
1.5 Who is This Report For?
1.6 Methodology
1.6.1 Primary Research
1.6.2 Secondary Research
1.6.3 Market Evaluation And Forecasting Methodology
1.7 Frequently Asked Questions (FAQs)
1.8 Associated Visiongain Reports
1.9 About Visiongain
2. Introduction To The Global Cranes And Hoists Market
2.1 Introduction
2.2 Latest Technologies And Developments In R&D
2.2.1 Revamped Ropes For Better Performance
2.2.2 Crane Aided By Brain Is To Revolutionize The Global Market
2.2.3 Enhanced Compatibility And Performance With Single Engine Concept
2.2.4 Introducing The Combi Concept Of Crane Applications – Crawler Mounted Tower Crane
2.2.5 Pipe Modular Lift System Would Eliminate The Cranes Usage, Working At Elevated Heights.
2.2.6 Crane Engines Are Set To Meet The Euro V Emission Regulations.
2.2.7 Smart Crane Hook System To Improvise Safety, Production And Comfort
3. Market Dynamics
3.1 Drivers
3.1.1 Prospects From Residential And Non-Residential Building Sector
3.1.2 Gradual Evolution Of Crane Technology
3.1.3 Increased Traction For Fuel Efficient Cranes
3.1.4 Aggravated Growth From The Oil And Gas Industry In North America
3.1.5 Widespread Application Driven By Industrial Needs
3.1.6 Growing Infrastructural Development
3.2 Global Construction Equipment Market Size Forecast 2018-2028
3.2 Restraints
3.2.1 Challenges In The Heavy Machinery Market
3.2.2 Complexities In Financing And Other Demand Side Rigidities
3.2.3 Increased Penetration Of Used Cranes
3.2.4 Downturn Of Mining Activities
3.2.5 Growing Instances Of Crane Alternatives
3.2.6 Stringent Emission Regulations On Various Construction Machinery
3.3 Opportunities
3.3.1 Rise In The Renting And Leasing Of Cranes
3.3.2 Advent Of Cranes With Increased Focus In Reducing Downtime
3.3.3 Demand For Safer And High Capacity Mobile Cranes
3.3.4 Growth Prospects From The Manufacturing Sector
3.3.5 Increased Initiative Of Personnel Training For Machinery Handling
3.3.6 Technological Development In Construction Machinery
3.4 Value & Supply Chain Analysis
3.5 Porter’s Five-Force Analysis
3.5.1 Threat Of New Entrants
3.5.2 Bargaining Power Of Buyers
3.5.3 Bargaining Power Of Suppliers
3.5.4 Threat Of Substitute Products/Services
3.5.5 Intensity Of Competitive Rivalry
4. Global Crane Market By Type 2018-2028
4.1 Mobile Cranes Market Forecast & Analysis 2018-2028
4.1.1 Wheel Mounted Mobile Cranes Forecast & Analysis 2018-2028
4.1.1.1 Introduction
4.1.1.2 Telescopic Boom Cranes Forecast & Analysis 2018-2028
4.1.1.2.1 Single Control Forecast & Analysis 2018-2028
4.1.1.2.2 Multiple Control Forecast & Analysis 2018-2028
4.1.1.3 Latticework Boom Forecast & Analysis 2018-2028
4.1.1.4 Knuckle Boom Forecast & Analysis 2018-2028
4.1.2 Commercial Truck Mounted Cranes Forecast & Analysis 2018-2028
4.1.2.1 Introduction
4.1.2.2 Hydraulic Boom Forecast & Analysis 2018-2028
4.1.2.3 Articulated Boom Forecast & Analysis 2018-2028
4.1.2.4 Trolley Boom Forecast & Analysis 2018-2028
4.1.2.5 Stiff Boom Forecast & Analysis 2018-2028
4.1.3 Crawler Crane Forecast & Analysis 2018-2028
4.1.3.1 Introduction
4.1.3.2 Crawler Crane With Lattice Boom Forecast & Analysis 2018-2028
4.1.3.3 Crawler Crane With Hydraulic Boom Forecast & Analysis 2018-2028
4.1.4 Side Boom Forecast & Analysis 2018-2028
4.1.4.1 Wheeled Side Boom Cranes Forecast & Analysis 2018-2028
4.1.4.2 Tracked Side Boom Cranes Forecast & Analysis 2018-2028
4.1.5 Straddle Cranes Forecast & Analysis 2018-2028
4.1.6 Railroad Cranes Forecast & Analysis 2018-2028
4.1.7 Aerial Cranes Forecast & Analysis 2018-2028
4.1.8 Other Mobile Cranes Forecast & Analysis 2018-2028
4.2 Fixed Cranes Forecast & Analysis 2018-2028
4.2.1 Monorail & Underhung Forecast & Analysis 2018-2028
4.2.1.1 Introduction
4.2.1.2 Monorail Carrier Forecast & Analysis 2018-2028
4.2.1.3 Power Operated Hoist Forecast & Analysis 2018-2028
4.2.1.4 Electric Hoist Forecast & Analysis 2018-2028
4.2.2 Overhead Track Mounted Cranes Forecast & Analysis 2018-2028
4.2.2.1 Introduction
4.2.2.2 Overhead Travelling Forecast & Analysis 2018-2028
4.2.2.3 Wall Forecast & Analysis 2018-2028
4.2.2.4 Gantry Forecast & Analysis 2018-2028
4.2.2.4.1 Semi Gantry Forecast & Analysis 2018-2028
4.2.2.4.2 Gantry Crane Forecast & Analysis 2018-2028
4.2.2.5 Bridge Cranes Forecast & Analysis 2018-2028
4.2.3 Tower Cranes Forecast & Analysis 2018-2028
4.2.3.1 Introduction
4.2.3.2 Saddle Jib Forecast & Analysis 2018-2028
4.2.3.3 Luffing Jib Forecast & Analysis 2018-2028
4.2.3.4 Self Erecting Forecast & Analysis 2018-2028
4.2.3.4.1 Telescoping Forecast & Analysis 2018-2028
4.2.3.4.2 Inner And Outer Towers Forecast & Analysis 2018-2028
4.2.3.4.3 Others Forecast & Analysis 2018-2028
4.3 Marine & Port Cranes Forecast & Analysis 2018-2028
4.3.1 Mobile Harbour Cranes Forecast & Analysis 2018-2028
4.3.2 Fixed Harbour Cranes Forecast & Analysis 2018-2028
4.3.3 Offshore Forecast & Analysis 2018-2028
4.3.4 Ship Cranes Forecast & Analysis 2018-2028
4.4 Other Crane Types Forecast & Analysis 2018-2028
5. Global Crane Market, By Application Type 2018-2028
5.1 Construction And Infrastructure Cranes Forecast & Analysis 2018-2028
5.2 Mining And Excavation Cranes Forecast & Analysis 2018-2028
5.3 Shipyard Cranes Forecast & Analysis 2018-2028
5.4 Industrial Cranes Forecast & Analysis 2018-2028
6. Global Crane Market, By Geography 2018-2028
6.1 North America Crane Forecast & Analysis By Country 2018-2028
6.1.1 Introduction
6.1.2 US Crane Forecast & Analysis 2018-2028
6.1.3 Canada Crane Forecast & Analysis 2018-2028
6.1.4 Mexico Crane Forecast & Analysis 2018-2028
6.1.5 Rest Of North America Crane Forecast & Analysis 2018-2028
6.2 South America Crane Forecast & Analysis By Country 2018-2028
6.2.1 Introduction
6.2.2 Argentina Crane Forecast & Analysis 2018-2028
6.2.3 Brazil Crane Forecast & Analysis 2018-2028
6.2.4 Rest Of South America Crane Forecast & Analysis 2018-2028
6.3 Europe Crane Forecast & Analysis By Country 2018-2028
6.3.1 Introduction
6.3.2 UK Crane Forecast & Analysis 2018-2028
6.3.3 France Crane Forecast & Analysis 2018-2028
6.3.4 Germany Crane Forecast & Analysis 2018-2028
6.3.5 Russia Crane Forecast & Analysis 2018-2028
6.3.6 Italy Crane Forecast & Analysis 2018-2028
6.3.7 Sweden Crane Forecast & Analysis 2018-2028
6.3.8 Spain Crane Forecast & Analysis 2018-2028
6.3.9 Rest Of Europe Crane Forecast & Analysis 2018-2028
6.4 Asia Pacific Crane Forecast & Analysis By Country 2018-2028
6.4.1 Introduction
6.4.2 India Crane Forecast & Analysis 2018-2028
6.4.3 China Crane Forecast & Analysis 2018-2028
6.4.4 Japan Crane Forecast & Analysis 2018-2028
6.4.5 South Korea Crane Forecast & Analysis 2018-2028
6.4.6 Australia Crane Forecast & Analysis 2018-2028
6.4.7 Rest Of Asia Pacific Crane Forecast & Analysis 2018-2028
6.5 Africa & Middle-East Crane Forecast & Analysis By Country 2018-2028
6.5.1 Introduction
6.5.2 Egypt Crane Forecast & Analysis 2018-2028
6.5.3 UAE Crane Forecast & Analysis 2018-2028
6.5.4 Saudi Arabia Crane Forecast & Analysis 2018-2028
6.5.5 South Africa Crane Forecast & Analysis 2018-2028
6.5.6 Rest Of Africa & Middle-East Crane Forecast & Analysis 2018-2028
7. Competitive Landscape
7.1 Introduction
7.2 Crane Company Market Share Analysis
7.3 Liebherr Cranes, Inc.
7.4 Terex Cranes, Inc.
7.5 Cargotec Crane & Electrical Services Inc
7.6 XCMG Construction Machinery Co., Ltd.
7.7 The Manitowoc Company, Inc.
7.8 Tadano Ltd
7.9 Konecranes Plc
7.10 Palfinger AG
7.11 Kobelco Cranes Co., Ltd.
7.12 Zoomlion
7.13 Hitachi Sumitomo Heavy Industries Construction Crane Co., Ltd.
7.14 TTS Group
8. Future Outlook Of The Market
9. Glossary
List of Tables
Table 3.1 Tier 4 / Stage IV Acceptable Emissions Standards
Table 3.2 Tier 3 And Tier 4 Acceptable Emissions Standards
Table 4.1 Global Crane Market By Type 2018-2028 (USD Million)
Table 4.2 Global Crane Market, By Type, Wheel Mounted Mobile Cranes, 2018-2028 (in USD Millions)
Table 4.3 Global Crane Market, By Type, Telescopic Boom Cranes, 2018-2028 (USD Millions)
Table 4.4 Global Crane Market, By Type, Commercial Truck Mounted Mobile Cranes, 2018-2028 (in USD millions)
Table 4.5 Global Crane Market, By Type, Fixed Cranes, 2018-2028 (USD millions)
Table 4.6 Monorail and Underhung Cranes: By Type Market, 2018-2028, (USD million)
Table 4.7 Overhead Track Mounted Cranes By Type Market, 2018-2028, (USD million)
Table 4.8 Gantry Cranes By Type, Market, 2018-2028 (USD Millions)
Table 4.9 Global Crane Market, By Type, Tower Cranes, 2018-2028 (USD Millions)
Table 4.10 Self-Erecting Crane By Type, Market 2018-2028 (USD Millions)
Table 4.11 Marine & Port Cranes, By Type, Market 2018-2028 (in USD Millions)
Table 5.1 Global Crane Market, By Application Type, 2018-2028, (USD million)
Table 5.2 The Top 10 Construction Companies In The World
Table 5.3 The Busiest Container Ports Across The Globe (Port, Location, Container Volume, Growth %)
Table 6.1 Global Cranes Market By Geography 2018 – 2028 (USD Million)
Table 6.2 North America Crane Market Revenue, By Country, 2018-2028 (USD millions)
Table 6.3 Largest Infrastructure Projects in Canada, 2018 (Project name, Current Stage, Location, Budget ($)
Table 6.4 South America Crane Market Revenue, By Country, 2018-2028 (USD Millions)
Table 6.5 Construction Output of Top 12 countries in European Union, 2017, (in EUR billion)
Table 6.6 European Crane Market By Geography 2018 – 2028 (USD Million)
Table 6.7 Construction Companies in Sweden
Table 6.8 Asia Pacific Crane Market Revenue, By Country, 2018-2028 (USD millions)
Table 6.9 Africa & Middle-East Crane Market Revenue, By Country, 2018-2028 (in USD millions)
Table 7.1 Liebherr Cranes & Hoists Product Range
Table 7.2 Terrex Cranes Inc. Cranes & Hoists Product Range
Table 7.3 Cargotec Crane & Electrical Services Inc. Cranes & Hoists Product Range
Table 7.4 XCMG Construction Machinery Co. Ltd. Cranes & Hoists Product
Table 7.5 Manitowoc Company Inc. Cranes & Hoists Product Range
Table 7.6 Tadano Ltd. Cranes & Hoists Product Range
Table 7.7 Konecranes Plc. Cranes & Hoists Product Range
Table 7.8 Palfinger AG Cranes & Hoists Product Range
Table 7.9 Kobelco Cranes Co. Ltd. Cranes & Hoists Product Range
Table 7.10 Zoomlion Cranes & Hoists Product Range
Table 7.11 Hitachi Sumitomo Heavy Industries Constructions Cranes Co. Ltd. Product Range
Table 7.12 TTS Group Cranes & Hoists Product Range
List of Figures
Figure 3.1 Global Construction Equipment Market Size By Region 2018-2028 (‘000 Units)
Figure 3.2 Fuel Consumption of RIS Enabled RTG Cranes (Litres / Hour)
Figure 3.3 Historical Data Showcasing Value Addition in the Construction Industry (China) 2006-2014 (USD Billion)
Figure 3.4 Value Of Planned, Unawarded GCC Projects By Sector 2018 (In Billion $)
Figure 3.5 Advantages Of Renting Construction Equipment
Figure 3.6 Advantages Of Truck Loader Cranes Over Conventional Fixed Cranes
Figure 3.7 Process Flow In The Crane Market
Figure 3.8 Factors Affecting Barriers To Entry
Figure 3.9 Factors Affecting Bargaining Power of Buyers
Figure 3.10 Factors Affecting Bargaining Power of Suppliers
Figure 3.11 Factors Influencing Threat Of Substitute Products / Services
Figure 3.12 Factors Influencing Intensity of Competitive Rivalry
Figure 4.1 Global Crane Market By Type 2017 (%)
Figure 4.2 Global Crane Market, By Type, Mobile Cranes, 2018-2028 (USD Millions)
Figure 4.3 Wheel Mounted Crane Market Share: Global Crane Market, By Type, 2017
Figure 4.4 Telescopic Boom Cranes Market Share: Global Crane Market, By Type 2017
Figure 4.6 Multi Control Telescopic Boom Crane Market, 2018-2028, (USD million)
Figure 4.7 Latticework Boom Crane Market, 2018-2028, (Revenue in USD million)
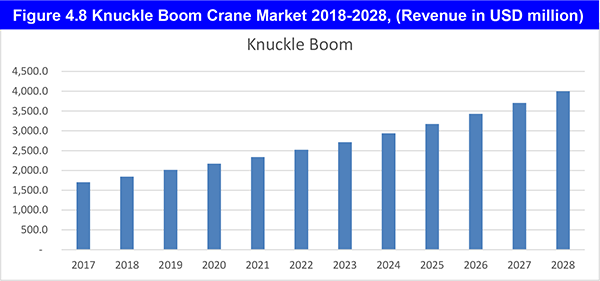
Figure 4.8 Knuckle Boom Crane Market 2018-2028, (Revenue in USD million)
Figure 4.9 Commercial Truck Mounted Crane Market Share: By Type 2017 (%)
Figure 4.10 Hydraulic Boom Crane Market, 2018-2028 (USD million)
Figure 4.11 Articulated Boom Crane Market, 2018-2028, (USD million)
Figure 4.12 Trolley Boom Crane Market 2018-2028 (USD million)
Figure 4.13 Stiff Boom Crane Market, 2017-2028, (USD million)
Figure 4.14 Crawler Cranes: Global Crane Market, 2018-2028, (USD million)
Figure 4.15 Crawler Crane With Latticework Boom Crane Market, 2018-2028, (USD million)
Figure 4.16 Crawler Crane With Hydraulic Boom Crane Market, 2018-2028, (USD million)
Figure 4.17 Side Boom Cranes Market By Type 2018-2028, (USD million)
Figure 4.18 Wheeled Side Boom Crane Market, 2018-2028, (USD million)
Figure 4.19 Tracked Side Boom Crane Market, 2018-2028, (USD million)
Figure 4.20 Straddle Cranes Market, 2018-2028, (USD million)
Figure 4.21 Railroad Cranes Market, 2018-2028, (USD million)
Figure 4.22 Aerial Cranes Market, 2018-2028, (USD million)
Figure 4.23 Other Cranes Market, 2018-2028, (USD million)
Figure 4.24 Fixed Crane Market Share: Global Crane Market, By Type, 2018 (%)
Figure 4.25 Monorail Carrier Cranes Market, 2018-2028, (USD million)
Figure 4.26 Power Operated Hoist Cranes Market, 2018-2028, (USD million)
Figure 4.27 Electric Hoist Cranes Market, 2018-2028, (USD million)
Figure 4.28 Overhead Travelling Crane Market, 2018-2028, (USD million)
Figure 4.29 Wall Crane Market, 2018-2028, (USD million)
Figure 4.30 Gantry Crane Market Share, By Type, 2017 (%)
Figure 4.31 Semi Gantry Crane Market, 2018-2028, (USD million)
Figure 4.32 Gantry Crane Market, 2018-2028, (USD million)
Figure 4.33 Cantilever Gantry Crane Market, 2018-2028, (USD million)
Figure 4.34 Bridge Cranes Market, 2018-2028, (Revenue in USD million)
Figure 4.35 Tower Crane Market Share Market, By Type, 2017 (%)
Figure 4.36 Saddle Jib Tower Crane Market, 2018-2028, (USD million)
Figure 4.37 Luffing Jib Tower Crane Market, 2018-2028, (USD million)
Figure 4.38 Self-Erecting Tower Cranes Market, 2018-2028, (USD million)
Figure 4.39 Self-Erecting Cranes Market Share, By Type, 2017 (%)
Figure 4.40 Telescopic Self Erecting Tower Cranes Market, 2018-2028, (USD million)
Figure 4.41 Inner and Outer Tower Self Erecting Crane Market, 2018-2028,(USD million)
Figure 4.42 Other Self Erecting Crane Market, 2018-2028, (USD million)
Figure 4.43 Stiff Leg Derrick Tower Crane Market, 2018-2028, (USD million)
Figure 4.44 Marine and Port Crane Market Share, By Type, 2017 (%)
Figure 4.45 Mobile Harbour Crane Market, 2018-2028, (USD million)
Figure 4.46 Fixed Harbor Crane Market, 2018-2028, (USD million)
Figure 4.47 Offshore Crane Market, 2018-2028, (USD million)
Figure 4.48 Ship Crane Market, 2018-2028, (USD million)
Figure 4.49 Other Crane Market, 2018-2028, (USD million)
Figure 5.1 Construction and Infrastructure Crane Market,2018-2028 (USD million)
Figure 5.2 Mining and Excavation Crane Market, 2018-2028 (USD million)
Figure 5.3 Shipyard Crane Market,2018-2028 (USD million)
Figure 5.4 Industrial Crane Market, 2018-2028 (USD million)
Figure 6.1 Global Crane Market Revenue, By Geography, 2017 (USD millions)
Figure 6.2 North America Crane Market By Country 2017 (%)
Figure 6.3 USA Crane Market 2018- 2028 (USD million)
Figure 6.4 Canada Crane Market, 2018- 2028, (USD million)
Figure 6.5 Mexico Crane Market, 2018- 2028, (USD million)
Figure 6.6 Rest of North America Crane Market, 2018- 2028, (USD million)
Figure 6.7 South America Crane Market Revenue, By Country 2017 (%)
Figure 6.8 Argentina Crane Market 2018- 2028, (USD million)
Figure 6.9 Brazil: Global Crane Market 2018- 2028, (USD million)
Figure 6.10 Rest of South America Crane Forecast 2018-2028 (USD Million)
Figure 6.11 Europe Crane Market Revenue, By Country, 2018 (%)
Figure 6.12 United Kingdom Crane Market 2018- 2028, (USD million)
Figure 6.13 France Crane Market 2018- 2028, (USD million)
Figure 6.14 Germany Crane Market 2018- 2028, (USD million)
Figure 6.15 Russia Crane Market,2018- 2028, (Revenue in USD million)
Figure 6.16 Italy Crane Market 2018- 2028, (USD million)
Figure 6.17 Sweden Crane Market 2018- 2028, (USD million)
Figure 6.18 Spain Crane Market 2018- 2028, (USD million)
Figure 6.19 Rest of Europe Crane Market 2018- 2028, (USD million)
Figure 6.20 Asia Pacific Crane Market Share, By Country, 2017 (%)
Figure 6.21 India Crane Market 2018- 2028, (USD million)
Figure 6.22 China Crane Market 2018- 2028, (USD million)
Figure 6.23 Japan Crane Market 2018- 2028, (Revenue in USD million)
Figure 6.24 South Korea Crane Market 2018- 2028, (USD million)
Figure 6.25 Australia Crane Market, 2018- 2028, (USD million)
Figure 6.26 Rest of Asia Pacific Crane Market, 2018- 2028, (USD million)
Figure 6.27 Africa & Middle-East Crane Market Share, By Country, 2017 (%)
Figure 6.28 Egypt Crane Market,2018- 2028, (USD million)
Figure 6.29 UAE Crane Market,2018- 2028, (USD million)
Figure 6.30 Saudi Arabia Crane Market 2018- 2028, (USD million)
Figure 6.31 South Africa: Global Crane Market 2018- 2028, (USD million)
Figure 6.32 Rest of Africa and Middle East Crane Market, 2018- 2028, (USD million)
Figure 7.1 Global Crane Company Market Share Analysis 2017 (%)
20th Century Fox
A2SEA
ABUS
Accor SA
ALM Equity AB
Andrade Gutierrez
Arcelor Mittal
Arkona
Atrium Ljungberg AB
Balfour Beatty
BDX Företagen AB
Bechtel
Besqab AB
Bilfinger Marine and Offshore Systems GmbH
Bosch Rexroth
Bouygues Construction
Bridgestone
Byggmästar'n i Skåne AB
Camargo Correa
Cargotec Crane & Electrical Services, Inc.
CASE
Caterpillar
Continental
CoreLogic
Cranedge
Danfoss
Demag
Diepa
DP Energy Australia
Eaton Corporation PLC
Eiffage.
Einar Mattsson AB
Elebia Company
ElectroMech
Emerson
Escorts Construction Equipment
GDF Suez
Goodyear
Grupo ACS
Hebei Iron and Steel Group
Herpertz
Hitachi
Hitachi Construction Machinery Co., Ltd.
Hitachi Sumitomo Heavy Industries Construction Crane Co., Ltd.
Hochtief
HSB ProjektPartner AB
Huisman heavy machinery
JCB
JFE Holdings.
JM AB
Kato Works
Kiewit
Kobe Steel, Ltd.
Kobelco Cranes Co., Ltd
Komatsu
Kone Cranes Plc
Kuiphuis
Laing O’Rourke
Liebherr Cranes, Inc.
Liebherr GmbH
Liebherr-International Deutschland GmbH.
LiuGong
Lukoil
Mainstream Renewable Power
Manitowoc
Midroc Europe AB
National Buildings Construction Corporation (NBCC)
Nippon Steel and Sumitomo Metal Corporation (NSSMC)
OAS
Oderbrecht
Orascom Construction (OC)
Palfinger AB
Palfinger Family Trust.
Palfinger Marine
Peab AB
Posco
Queiroz Galvão
Rekab Entreprenad AB
Renaissance
Riksbyggen ekonomisk Forening
Royal BAM Group
SANY
Serneke Group AB
Sibcranex
Siemens
Sikorsky
Skanska AB
Småa AB
SSA Marine
STAHL Crane systems
Sumitomo Heavy Industries, Ltd.
Tadano Ltd.,
Terex Corporation.
Terex Cranes, Inc
The Manitowoc Company, Inc.
Toebe
TTS Group ASA
Vale
Van Oord
Veidekke Entreprenad AB
Vinci
Volvo
XCMG Construction Machinery Co., Ltd.
Zoomlion Heavy Industry Science and Technology Co., Ltd
Organisations Mentioned
Argentina Ministry of Transport
Australian Construction Industry Forum (ACIF)
Crane Manufactures Association of America (CMAA)
Egyptian General Authority
European Association of Abnormal Road Transport and Mobile Cranes (ESTA)
European Commission
European Parliament
Michigan Department of Transportation
Ministry of Energy, Uganda
Occupational Safety and Health Administration (OSHA)
Sri Lankan Urban Development, Ministry of Megapolis and Western Development
Taiwan Environmental Protection Administration (EPA)
US Environmental Protection Agency (EPA)