Visiongain has calculated that the global Artificial Lift Systems Market will see a capital expenditure (CAPEX) of $12,087 mn in 2018. Read on to discover the potential business opportunities available.
Artificial lift systems are employed when the natural drive energy of the reservoir is not strong enough to push the oil to the surface. These systems enhance pressure within the reservoir and recover more oil production. Most of the wells that initially facilitate natural flow to the surface, demand for artificial lift systems once the pressure starts depleting over time. Some of the major types of artificial lift systems include an electric submersible pump (ESP), rod lift, progressive cavity pump, gas lift, plunger lift and other pumps.
From the approximate one million oil and gas wells producing in the world, around 5% flow naturally – leaving nearly all of the world’s oil and gas production reliant on some form of efficient artificial lift systems.
Most of the oil and gas fields operating currently have been in production for decades. They are either matured or at the end of their production life. With the demand for oil and gas increasing, there is a pressing need to develop additional production capacity in order to sustain the current level of consumption growth. The challenge of meeting an increase in demand for oil over next two decades may seem daunting unless the productivity of existing wells is increased, or new production sites are established.
Rise in exploration and production (E&P) activity from unconventional wells, increase in drilling activity, the need to improve recovery rates from mature oil fields are some of the factors driving the demand for artificial lift systems.
Visiongain’s global Artificial Lift Systems Market report can keep you informed and up to date with the developments in the market, across six different regions: North America, Europe, Middle East, Africa, Asia Pacific and South America.
With reference to this report, it details the key investments trend in the global market, subdivided by regions, capital expenditure and equipment. Through extensive secondary research and interviews with industry experts, visiongain has identified a series of market trends that will impact the Artificial Lift Systems Market over the forecast timeframe.
The report will answer questions such as:
– How is the Artificial Lift Systems market evolving?
– What is driving and restraining Artificial Lift Systems market dynamics?
– How will each Artificial Lift Systems submarket segment grow over the forecast period and how much sales will these submarkets account for in 2028?
– How will market shares of each Artificial Lift Systems submarket develop from 2018-2028?
– Which individual technologies will prevail and how will these shifts be responded to?
– Which Artificial Lift Systems submarket will be the main driver of the overall market from 2018-2028?
– How will political and regulatory factors influence regional Artificial Lift Systems markets and submarkets?
– Will leading national Artificial Lift Systems market broadly follow macroeconomic dynamics, or will individual country sectors outperform the rest of the economy?
– How will market shares of the national markets change by 2028 and which nation will lead the market in 2028?
– Who are the leading players and what are their prospects over the forecast period?
– How will the sector evolve as alliances form during the period between 2018 and 2028?
Five Reasons Why You Must Order and Read This Report Today:
1) The report provides Forecasts for the Artificial Lift Systems Market by Type, for the period 2018-2028
– Electric Submersible Pump (ESP)
– Rod Lift
– Progressive Cavity Pump
– Gas Lift
– Other Pumps (Hydraulic Pump & Plunger Lift)
2) The report also Forecasts and Analyses the Artificial Lift Systems Market by Area from 2018-2028
– Onshore
– Offshore
3) The report Forecasts and Analyses the Artificial Lift Systems Market by Region from 2018-2028
North America
– U.S CAPEX 2018-2028
– Canada CAPEX 2018-2028
– Mexico CAPEX 2018-2028
Europe
– UK CAPEX 2018-2028
– Norway CAPEX 2018-2028
– Russia CAPEX 2018-2028
– Rest of Europe CAPEX 2018-2028
Asia Pacific
– China CAPEX 2018-2028
– India CAPEX 2018-2028
– Indonesia CAPEX 2018-2028
– Malaysia CAPEX 2018-2028
– Thailand CAPEX 2018-2028
– Rest of Asia Pacific CAPEX 2018-2028
Middle East
– Saudi Arabia CAPEX 2018-2028
– Iran CAPEX 2018-2028
– Qatar CAPEX 2018-2028
– UAE CAPEX 2018-2028
– Rest of Middle East CAPEX 2018-2028
Africa
– Nigeria CAPEX 2018-2028
– Algeria CAPEX 2018-2028
– Angola CAPEX 2018-2028
– Rest of Africa CAPEX 2018-2028
South America
– Venezuela CAPEX 2018-2028
– Brazil CAPEX 2018-2028
– Argentina CAPEX 2018-2028
– Rest of South America CAPEX 2018-2028
4) The report includes Drivers and Restraints affecting the Artificial Lift Systems Market
5) The report provides Detailed Profiles of The Leading Companies Operating within the Artificial Lift Systems Market:
– Baker Hughes Inc.
– Halliburton
– Schlumberger
– Weatherford International
– General Electric
– Dover Corporation
– Borets International Limited
– National Oilwell Varco
– Aker Solutions
– Novomet
– BCP Group Artificial Lift Inc.
– OILSERVE
This independent 187-page report guarantees you will remain better informed than your competitors. With 177 tables and figures examining the Artificial Lift Systems market space, the report gives you a direct, detailed breakdown of the market. PLUS, Capital expenditure by type, area and region, as well as in-Depth analysis of leading companies in the Artificial Lift Systems market from 2018-2028 that will keep your knowledge that one step ahead of your rivals.
This report is essential reading for you or anyone in the Energy sector. Purchasing this report today will help you to recognise those important market opportunities and understand the possibilities there. I look forward to receiving your order.
Visiongain is a trading partner with the US Federal Government
CCR Ref number: KD4R6
1. Report Overview
1.1 Global Artificial Lift Systems Market Overview
1.2 Why You Should Read This Report
1.3 How This Report Delivers
1.4 Key Questions Answered by This Analytical Report Include:
1.5 Who is This Report For?
1.6 Methodology
1.6.1 Primary Research
1.6.2 Secondary Research
1.6.3 Market Evaluation & Forecasting Methodology
1.7 Frequently Asked Questions (FAQ)
1.8 Associated Visiongain Reports
1.9 About Visiongain
2. Introduction to the Artificial Lift Systems Market
2.1 Artificial Lift Systems Market Definition
2.2 Artificial Lift Systems Market Structure
2.3 Brief History of Artificial Lift Systems
3. Global Artificial Lift Systems Market 2018-2028
3.1 Global Artificial Lift Systems Market Forecast 2018-2028
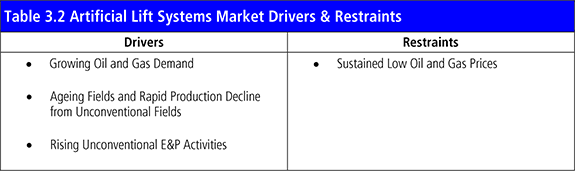
3.2 Artificial Lift Systems Drivers & Restraints 2018
3.2.1 Drivers in the Artificial Lift Systems Market
3.2.1.1 Growing Oil and Gas Demand
3.2.1.2 Ageing Fields and Rapid Production Decline from Unconventional Fields
3.2.1.3 Rising Unconventional E&P Activities
3.2.2 Restraints in the Artificial Lift Systems Market
3.2.2.1 Sustained Low Oil and Gas Prices
4. Global Artificial Lift Systems Market By Types Forecast 2018-2028
4.1 Global Artificial Lift Systems Market By Electric Submersible Pump (ESP) Forecast 2018-2028
4.2 Global Artificial Lift Systems Market By Rod Lift Forecast 2018-2028
4.3 Global Artificial Lift Systems Market By Progressive Cavity Pumps Forecast 2018-2028
4.4 Global Artificial Lift Systems Market By Gas Lift Forecast 2018-2028
4.5 Global Artificial Lift Systems Market By Other Pumps Forecast 2018-2028
4.5.1 Hydraulic Piston Pumping
4.5.2 Plunger Lift
5. Global Artificial Lift Systems Market By Area of Deployment Forecast 2018-2028
5.1 Global Artificial Lift Systems Market By Onshore Forecast 2018-2028
5.2 Global Artificial Lift Systems Market By Offshore Forecast 2018-2028
6. Leading Regional and National Artificial Lift Systems Market Forecast 2018-2028
6.1 North America Artificial Lift Systems Market Forecast 2018-2028
6.1.1 The US Artificial Lift Systems Market Forecast 2018-2028
6.1.2 Canada Artificial Lift Systems Market Forecast 2018-2028
6.1.3 Mexico Artificial Lift Systems Market Forecast 2018-2028
6.2 Europe Artificial Lift Systems Market Forecast 2018-2028
6.2.1 The UK Artificial Lift Systems Market Forecast 2018-2028
6.2.2 Norway Artificial Lift Systems Market Forecast 2018-2028
6.2.3 Russia Artificial Lift Systems Market Forecast 2018-2028
6.2.4 Rest of Europe Artificial Lift Systems Market Forecast 2018-2028
6.3 Asia Pacific Artificial Lift Systems Market Forecast 2018-2028
6.3.1 China Artificial Lift Systems Market Forecast 2018-2028
6.3.2 India Artificial Lift Systems Market Forecast 2018-2028
6.3.3 Indonesia Artificial Lift Systems Market Forecast 2018-2028
6.3.4 Malaysia Artificial Lift Systems Market Forecast 2018-2028
6.3.5 Thailand Artificial Lift Systems Market Forecast 2018-2028
6.3.6 Rest of Asia Pacific Artificial Lift Systems Market Forecast 2018-2028
6.4 Middle East Artificial Lift Systems Market Forecast 2018-2028
6.4.1 Saudi Arabia Artificial Lift Systems Market Forecast 2018-2028
6.4.2 Iran Artificial Lift Systems Market Forecast 2018-2028
6.4.3 Qatar Artificial Lift Systems Market Forecast 2018-2028
6.4.4 UAE Artificial Lift Systems Market Forecast 2018-2028
6.4.5 Rest of Middle East Artificial Lift Systems Market Forecast 2018-2028
6.5 Africa Artificial Lift Systems Market Forecast 2018-2028
6.5.1 Nigeria Artificial Lift Systems Market Forecast 2018-2028
6.5.2 Algeria Artificial Lift Systems Market Forecast 2018-2028
6.5.3 Angola Artificial Lift Systems Market Forecast 2018-2028
6.5.4 Rest of Africa Artificial Lift Systems Market Forecast 2018-2028
6.6 South America Artificial Lift Systems Market Forecast 2018-2028
6.6.1 Venezuela Artificial Lift Systems Market Forecast 2018-2028
6.6.2 Brazil Artificial Lift Systems Market Forecast 2018-2028
6.6.3 Argentina Artificial Lift Systems Market Forecast 2018-2028
6.6.4 Rest of South America Artificial Lift Systems Market Forecast 2018-2028
7. PEST Analysis of the Artificial Lift Systems Market 2018-2028
7.1 Political
7.2 Economical
7.3 Social
7.4 Technological
8. The Leading Companies in the Artificial Lift Systems Market
8.1 Baker Hughes Inc.
8.1.1 Baker Hughes Inc. Total Company Sales 2011-2016
8.1.2 Baker Hughes Inc. Sales in the Artificial Lift Systems Market 2011-2016
8.2 Halliburton
8.2.1 Halliburton Total Company Sales 2011-2016
8.2.2 Halliburton Sales in the Artificial Lift Systems Market 2011-2016
8.3 Schlumberger
8.4 Weatherford International
8.4.1 Weatherford International Total Company Sales 2011-2016
8.4.2 Weatherford International Sales in the Artificial Lift Systems Market 2011-2016
8.5 General Electric
8.5.1 General Electric Total Company Sales 2012-2016
8.5.2 General Electric Sales in the Artificial Lift Systems Market 2011-2016
8.6 Dover Corporation
8.6.1 Dover Corporation Total Company Sales 2011-2016
8.6.2 Dover Corporation Sales in the Artificial Lift Systems Market 2011-2016
8.6.3 Dover Corporation (Subsegment) Sales in the Artificial Lift Systems Market 2011-2016
8.7 Borets International Limited
8.7.1 Borets International Limited Total Company Sales 2011-2016
8.8 National Oilwell Varco
8.8.1 National Oilwell Varco Total Company Sales 2011-2016
8.8.2 National Oilwell Varco Sales in the Artificial Lift Systems Market 2011-2016
8.9 Aker Solutions
8.9.1 Aker Solutions Total Company Sales 2011-2016
8.9.2 Aker Solutions Sales in the Artificial Lift Systems Market 2014-2016
8.10 Novomet
8.11 BCP Group Artificial Lift Inc.
8.12 OILSERVE
9. Conclusions and Recommendations
9.1 Key Findings
9.2 Recommendations
10. Glossary
Appendix
Associated Visiongain Reports
Visiongain Report Sales Order Form
Appendix A
Appendix B
Visiongain Report Evaluation Form
List of Tables
Table 1.1 Global Artificial Lift Systems Market By Type Forecast 2018-2028 (US$mn, AGR %, Cumulative)
Table 1.2 Global Artificial Lift Systems Market By Area of Deployment Forecast 2018-2028 (US$mn, AGR %, Cumulative)
Table 1.3 Leading Regional Artificial Lift Systems Market Forecast 2018-2028 (US$mn, Global AGR %, Cumulative)
Table 3.1 Global Artificial Lift Systems Market Forecast 2018-2028 (US$mn, AGR %, CAGR %, Cumulative)
Table 3.2 Artificial Lift Systems Market Drivers & Restraints
Table 4.1 Global Artificial Lift Systems Market By Type Forecast 2018-2028 (US$mn, AGR %, Cumulative)
Table 4.2 Global Artificial Lift Systems Market By Type CAGR Forecast 2018-2023, 2023-2028, 2018-2028 (CAGR %)
Table 4.3 Global Artificial Lift Systems Market By Electric Submersible Pump (ESP) Forecast 2018-2028 (US$mn, AGR %, CAGR %, Cumulative)
Table 4.4 Global Artificial Lift Systems Market By Rod Lift Forecast 2018-2028 (US$mn, AGR %, CAGR %, Cumulative)
Table 4.5 Global Artificial Lift Systems Market By Progressive Cavity Pump Forecast 2018-2028 (US$mn, AGR %, CAGR %, Cumulative)
Table 4.6 Global Artificial Lift Systems Market By Gas Lift Forecast 2018-2028 (US$mn, AGR %, CAGR %, Cumulative)
Table 4.7 Global Artificial Lift Systems Market By Other Pumps Forecast 2018-2028 (US$mn, AGR %, CAGR %, Cumulative)
Table 5.1 Global Artificial Lift Systems Market By Area of Deployment Forecast 2018-2028 (US$mn, AGR %, Cumulative)
Table 5.2 Global Artificial Lift Systems Market By Area of Deployment CAGR Forecast 2018-2023, 2023-2028, 2018-2028 (CAGR %)
Table 5.3 Global Artificial Lift Systems Market By Onshore Forecast 2018-2028 (US$mn, AGR %, CAGR %, Cumulative)
Table 5.4 Global Artificial Lift Systems Market By Offshore Forecast 2018-2028 (US$mn, AGR %, CAGR %, Cumulative)
Table 6.1 Leading Regional Artificial Lift Systems Market Forecast 2018-2028 (US$mn, Global AGR %, Cumulative)
Table 6.2 Regional Artificial Lift Systems Market Percentage Change in Market Share 2018-2023, 2023-2028, 2018-2028 (% Change)
Table 6.3 North America Artificial Lift Systems Market by Country Forecast 2018-2028 (US$mn, AGR %, CAGR %, Cumulative)
Table 6.4 The U.S. Artificial Lift Systems Market Forecast 2018-2028 (US$mn, AGR %, CAGR %, Cumulative)
Table 6.5 Canada Artificial Lift Systems Market Forecast 2018-2028 (US$mn, AGR %, CAGR %, Cumulative)
Table 6.6 Mexico Artificial Lift Systems Market Forecast 2018-2028 (US$mn, AGR %, CAGR %, Cumulative)
Table 6.7 Europe Artificial Lift Systems Market by Country Forecast 2018-2028 (US$mn, AGR %, CAGR %, Cumulative)
Table 6.8 The UK Artificial Lift Systems Market Forecast 2018-2028 (US$mn, AGR %, CAGR %, Cumulative)
Table 6.9 Norway Artificial Lift Systems Market Forecast 2018-2028 (US$mn, AGR %, CAGR %, Cumulative)
Table 6.10 Russia Artificial Lift Systems Market Forecast 2018-2028 (US$mn, AGR %, CAGR %, Cumulative)
Table 6.11 Rest of Europe Artificial Lift Systems Market Forecast 2018-2028 (US$mn, AGR %, CAGR %, Cumulative)
Table 6.12 Asia Pacific Artificial Lift Systems Market by Country Forecast 2018-2028 (US$mn, AGR %, CAGR %, Cumulative)
Table 6.13 China Artificial Lift Systems Market Forecast 2018-2028 (US$mn, AGR %, CAGR %, Cumulative)
Table 6.14 India Artificial Lift Systems Market Forecast 2018-2028 (US$mn, AGR %, CAGR %, Cumulative)
Table 6.15 Indonesia Artificial Lift Systems Market Forecast 2018-2028 (US$mn, AGR %, CAGR %, Cumulative)
Table 6.16 Malaysia Artificial Lift Systems Market Forecast 2018-2028 (US$mn, AGR %, CAGR %, Cumulative)
Table 6.17 Thailand Artificial Lift Systems Market Forecast 2018-2028 (US$mn, AGR %, CAGR %, Cumulative)
Table 6.18 Rest of Asia Pacific Artificial Lift Systems Market Forecast 2018-2028 (US$mn, AGR %, CAGR %, Cumulative)
Table 6.19 Middle East Artificial Lift Systems Market by Country Forecast 2018-2028 (US$mn, AGR %, CAGR %, Cumulative)
Table 6.20 Saudi Arabia Artificial Lift Systems Market Forecast 2018-2028 (US$mn, AGR %, CAGR %, Cumulative)
Table 6.21 Iran Artificial Lift Systems Market Forecast 2018-2028 (US$mn, AGR %, CAGR %, Cumulative)
Table 6.22 Qatar Artificial Lift Systems Market Forecast 2018-2028 (US$mn, AGR %, CAGR %, Cumulative)
Table 6.23 UAE Artificial Lift Systems Market Forecast 2018-2028 (US$mn, AGR %, CAGR %, Cumulative)
Table 6.24 Rest of Middle East Artificial Lift Systems Market Forecast 2018-2028 (US$mn, AGR %, CAGR %, Cumulative)
Table 6.25 Africa Artificial Lift Systems Market by Country Forecast 2018-2028 (US$mn, AGR %, CAGR %, Cumulative)
Table 6.26 Nigeria Artificial Lift Systems Market Forecast 2018-2028 (US$mn, AGR %, CAGR %, Cumulative)
Table 6.27 Algeria Artificial Lift Systems Market Forecast 2018-2028 (US$mn, AGR %, CAGR %, Cumulative)
Table 6.28 Angola Artificial Lift Systems Market Forecast 2018-2028 (US$mn, AGR %, CAGR %, Cumulative)
Table 6.29 Rest of Africa Artificial Lift Systems Market Forecast 2018-2028 (US$mn, AGR %, CAGR %, Cumulative)
Table 6.30 South America Artificial Lift Systems Market by Country Forecast 2018-2028 (US$mn, AGR %, CAGR %, Cumulative)
Table 6.31 Venezuela Artificial Lift Systems Market Forecast 2018-2028 (US$mn, AGR %, CAGR %, Cumulative)
Table 6.32 Brazil Artificial Lift Systems Market Forecast 2018-2028 (US$mn, AGR %, CAGR %, Cumulative)
Table 6.33 Argentina Artificial Lift Systems Market Forecast 2018-2028 (US$mn, AGR %, CAGR %, Cumulative)
Table 6.34 Rest of South America Artificial Lift Systems Market Forecast 2018-2028 (US$mn, AGR %, CAGR %, Cumulative)
Table 7.1 Global Artificial Lift Systems Market PEST Analysis 2018-2028
Table 8.1 Baker Hughes Inc. 2017 (CEO, Total Company Sales US$m, Sales from Company Division that includes Artificial Lift Systems (US$m), Share of Total Company Sales from Company Division that includes Artificial Lift Systems (%), Net Income / Loss US$m, Net Capital Expenditure US$m, Strongest Business Region, Business Segment in the Market, HQ, Founded, No. of Employees, IR Contact, Ticker, Website)
Table 8.2 Baker Hughes Inc. Total Company Sales 2010-2016 (US$m, AGR %)
Table 8.3 Baker Hughes Inc. Sales in the Artificial Lift Systems Market 2010-2016 (US$m, AGR %)
Table 8.4 Halliburton 2017 (CEO, Total Company Sales US$m, Sales from Company Division that includes Artificial Lift Systems (US$m), Share of Total Company Sales from Company Division that includes Artificial Lift Systems (%), Net Income / Loss US$m, Net Capital Expenditure US$m, Strongest Business Region, Business Segment in the Market, HQ, Founded, No. of Employees, IR Contact, Ticker, Website)
Table 8.5 Halliburton Total Company Sales 2010-2016 (US$m, AGR %)
Table 8.6 Halliburton Sales in the Artificial Lift Systems Market 2010-2016 (US$m, AGR %)
Table 8.7 Schlumberger 2017 (CEO, Total Company Sales US$m, Sales from Company Division that includes Artificial Lift Systems (US$m), Share of Total Company Sales from Company Division that includes Artificial Lift Systems (%), Net Income / Loss US$m, Net Capital Expenditure US$m, Strongest Business Region, Business Segment in the Market, HQ, Founded, No. of Employees, IR Contact, Ticker, Website)
Table 8.8 Schlumberger Total Company Sales 2010-2016 (US$m, AGR %)
Table 8.9 Schlumberger Sales in the Artificial Lift Systems Market 2010-2016 (US$m, AGR %)
Table 8.10 Weatherford International 2017 (CEO, Total Company Sales from Company Division that includes Artificial Lift Systems (US$m), Share of Total Company Sales from Company Division that includes Artificial Lift Systems (%), Net Income / Loss US$m, Net Capital Expenditure US$m, Strongest Business Region, Business Segment in the Market, HQ, Founded, No. of Employees, IR Contact, Ticker, Website)
Table 8.11 Weatherford International Total Company Sales 2010-2016 (US$m, AGR %)
Table 8.12 Weatherford International Sales in the Artificial Lift Systems Market 2010-2016 (US$m, AGR %)
Table 8.13 General Electric Profile 2017 (CEO, Total Company Sales US$m, Sales from Company Division that includes Artificial Lift Systems (US$m), Share of Total Company Sales from Company Division that includes Artificial Lift Systems (%), Net Income / Loss US$m, Net Capital Expenditure US$m, Strongest Business Region, Business Segment in the Market, HQ, Founded, No. of Employees, IR Contact, Ticker, Website)
Table 8.14 General Electric Total Company Sales 2011-2016 (US$m, AGR %)
Table 8.15 General Electric Sales in the Artificial Lift Systems Market 2010-2016 (US$m, AGR %)
Table 8.16 Dover Corporation 2017 (CEO, Total Company Sales US$m, Sales from Company Division that includes Artificial Lift Systems (US$m), Share of Total Company Sales from Company Division that includes Artificial Lift Systems (%), Net Income / Loss US$m, Net Capital Expenditure US$m, Strongest Business Region, Business Segment in the Market, HQ, Founded, No. of Employees, IR Contact, Ticker, Website)
Table 8.17 Dover Corporation Total Company Sales 2010-2016 (US$m, AGR %)
Table 8.18 Dover Corporation Sales in the Artificial Lift Systems Market 2010-2016 (US$m, AGR %)
Table 8.19 Dover Corporation (Subsegment) Sales in the Artificial Lift Systems Market 2010-2016 (US$m, AGR %)
Table 8.20 Borets International Limited 2017 (CEO, Total Company Sales US$m, Net Income / Loss US$m, Net Capital Expenditure US$m, Strongest Business Region, HQ, Founded, No. of Employees, Website)
Table 8.21 Borets International Limited Total Company Sales 2010-2016 (US$m, AGR %)
Table 8.22 National Oilwell Varco 2017 (CEO, Total Company Sales US$m, Sales from Company Division that includes Artificial Lift Systems (US$m), Share of Total Company Sales from Company Division that includes Artificial Lift Systems (%), Net Income / Loss US$m, Net Capital Expenditure US$m, Strongest Business Region, Business Segment in the Market, HQ, Founded, No. of Employees, Ticker, Website)
Table 8.23 National Oilwell Varco Total Company Sales 2010-2016 (US$m, AGR %)
Table 8.24 National Oilwell Varco Sales in the Artificial Lift Systems Market 2010-2016 (US$m, AGR %)
Table 8.25 Aker Solutions Profile 2017 (CEO, Total Company Sales US$m, Sales from Company Division that includes Artificial Lift Systems (US$m), Share of Total Company Sales from Company Division that includes Artificial Lift Systems (%), Net Income / Loss US$m, Net Capital Expenditure US$m, Strongest Business Region, Business Segment in the Market, HQ, Founded, No. of Employees, IR Contact, Ticker, Website)
Table 8.26 Aker Solutions Total Company Sales 2010-2016 (US$m, AGR %)
Table 8.27 Aker Solutions Sales in the Artificial Lift Systems Market 2013-2016 (US$m, AGR %)
Table 8.28 Novomet Profile 2017 (Business Segment in the Market, HQ, Founded, No. of Employees, IR Contact, Ticker, Website)
Table 8.29 BCP Group Artificial Lift Inc. Profile 2017 (Business Segment in the Market, HQ, Founded, Website)
Table 8.30 OILSERVE Profile 2017 (Business Segment in the Market, HQ, IR Contact, Website)
Table 9.1 Global Artificial Lift Systems Market By Type Forecast 2018-2028 (US$mn, AGR %, Cumulative)
Table 9.2 Global Artificial Lift Systems Market By Area of Deployment Forecast 2018-2028 (US$mn, AGR %, Cumulative)
Table 9.3 Leading Regional Artificial Lift Systems Market Forecast 2018-2028 (US$mn, Global AGR %, Cumulative)
List of Figures
Figure 2.1 Global Artificial Lift Systems Market Segmentation Overview
Figure 3.1 Global Artificial Lift Systems Market Forecast 2018-2028 (US$mn, AGR %)
Figure 4.1 Global Artificial Lift Systems Market By Type AGR Forecast 2018-2028 (AGR %)
Figure 4.2 Global Artificial Lift Systems Market By Type Forecast 2018-2028 (US$mn, Global AGR %)
Figure 4.3 Global Artificial Lift Systems Market By Type Share Forecast 2018 (% Share)
Figure 4.4 Global Artificial Lift Systems Market By Type Share Forecast 2023 (% Share)
Figure 4.5 Global Artificial Lift Systems Market By Type Share Forecast 2028 (% Share)
Figure 4.6 Global Artificial Lift Systems Market By Electric Submersible Pump (ESP) Forecast 2018-2028 (US$mn, Global AGR %)
Figure 4.7 Share of Electric Submersible Pump (ESP) in Global Artificial Lift Systems Market 2018-2028 (%)
Figure 4.8 Global Artificial Lift Systems Market By Rod Lift Forecast 2018-2028 (US$mn, Global AGR %)
Figure 4.9 Share of Rod Lift in Global Artificial Lift Systems Market 2018-2028 (%)
Figure 4.10 Global Artificial Lift Systems Market By Progressive Cavity Pump Forecast 2018-2028 (US$mn, Global AGR %)
Figure 4.11 Share of Progressive Cavity Pump in Global Artificial Lift Systems Market 2018-2028 (%)
Figure 4.12 Global Artificial Lift Systems Market By Gas Lift Forecast 2018-2028 (US$mn, Global AGR %)
Figure 4.13 Share of Gas Lift in Global Artificial Lift Systems Market 2018-2028 (%)
Figure 4.14 Global Artificial Lift Systems Market By Other Pumps Forecast 2018-2028 (US$mn, Global AGR %)
Figure 4.15 Share of Other Pumps in Global Artificial Lift Systems Market 2018-2028 (%)
Figure 5.1 Global Artificial Lift Systems Market By Area of Deployment AGR Forecast 2018-2028 (AGR %)
Figure 5.2 Global Artificial Lift Systems Market By Area of Deployment Forecast 2018-2028 (US$mn, Global AGR %)
Figure 5.3 Global Artificial Lift Systems Market By Area of Deployment Share Forecast 2018 (% Share)
Figure 5.4 Global Artificial Lift Systems Market By Area of Deployment Share Forecast 2023 (% Share)
Figure 5.5 Global Artificial Lift Systems Market By Area of Deployment Share Forecast 2028 (% Share)
Figure 5.6 Global Artificial Lift Systems Market By Onshore Forecast 2018-2028 (US$mn, Global AGR %)
Figure 5.7 Share of the Onshore in Global Artificial Lift Systems Market 2018-2028 (%)
Figure 5.8 Global Artificial Lift Systems Market By Offshore Forecast 2018-2028 (US$mn, Global AGR %)
Figure 5.9 Share of the Offshore in Global Artificial Lift Systems Market 2018-2028 (%)
Figure 6.1 Global Artificial Lift Systems Market by Region Market Forecast 2018-2028 (US$mn, Global AGR %)
Figure 6.2 Global Artificial Lift Systems Market by Region Market AGR Forecast 2018-2028 (AGR %)
Figure 6.3 Global Artificial Lift Systems Market by Regional Market Share Forecast 2018 (% Share)
Figure 6.4 Global Artificial Lift Systems Market by Regional Market Share Forecast 2023 (% Share)
Figure 6.5 Global Artificial Lift Systems Market by Regional Market Share Forecast 2028 (% Share)
Figure 6.6 North America Artificial Lift Systems Market by Country AGR Forecast 2018-2028 (AGR %)
Figure 6.7 North America Artificial Lift Systems by Country Forecast 2018-2028 (US$mn, North America Total Market Sales AGR %)
Figure 6.8 North America Artificial Lift Systems Market Share by Country Forecast 2018, 2023, 2028 (% Share)
Figure 6.9 U.S. Artificial Lift Systems Market Forecast 2018-2028 (US$mn, AGR %)
Figure 6.10 Canada Artificial Lift Systems Market Forecast 2018-2028 (US$mn, AGR %)
Figure 6.11 Mexico Artificial Lift Systems Market Forecast 2018-2028 (US$mn, AGR %)
Figure 6.12 Europe Artificial Lift Systems Market by Country AGR Forecast 2018-2028 (AGR %)
Figure 6.13 Europe Artificial Lift Systems Market by Country Forecast 2018-2028 (US$mn, Europe Total Market Sales AGR %)
Figure 6.14 Europe Artificial Lift Systems Market Share by Country Forecast 2018, 2023, 2028 (% Share)
Figure 6.15 The UK Artificial Lift Systems Market Forecast 2018-2028 (US$mn, AGR %)
Figure 6.16 Norway Artificial Lift Systems Market Forecast 2018-2028 (US$mn, AGR %)
Figure 6.17 Russia Artificial Lift Systems Market Forecast 2018-2028 (US$mn, AGR %)
Figure 6.18 Rest of Europe Artificial Lift Systems Market Forecast 2018-2028 (US$mn, AGR %)
Figure 6.19 Asia Pacific Artificial Lift Systems Market by Country AGR Forecast 2018-2028 (AGR %)
Figure 6.20 Asia Pacific Artificial Lift Systems Market by Country Forecast 2018-2028 (US$mn, Asia Pacific Total Market Sales AGR %)
Figure 6.21 Asia Pacific Artificial Lift Systems Market Share by Country Forecast 2018, 2023, 2028 (% Share)
Figure 6.22 China Artificial Lift Systems Market Forecast 2018-2028 (US$mn, AGR %)
Figure 6.23 India Artificial Lift Systems Market Forecast 2018-2028 (US$mn, AGR %)
Figure 6.24 Indonesia Artificial Lift Systems Market Forecast 2018-2028 (US$mn, AGR %)
Figure 6.25 Malaysia Artificial Lift Systems Market Forecast 2018-2028 (US$mn, AGR %)
Figure 6.26 Thailand Artificial Lift Systems Market Forecast 2018-2028 (US$mn, AGR %)
Figure 6.27 Rest of Asia Pacific Artificial Lift Systems Market Forecast 2018-2028 (US$mn, AGR %)
Figure 6.28 Middle East Artificial Lift Systems Market by Country AGR Forecast 2018-2028 (AGR %)
Figure 6.29 Middle East Artificial Lift Systems Market by Country Forecast 2018-2028 (US$mn, Middle East Total Market Sales AGR %)
Figure 6.30 Middle East Artificial Lift Systems Market Share By Country Forecast 2018, 2023, 2028 (% Share)
Figure 6.31 Saudi Arabia Artificial Lift Systems Market Forecast 2018-2028 (US$mn, AGR %)
Figure 6.32 Iran Artificial Lift Systems Market Forecast 2018-2028 (US$mn, AGR %)
Figure 6.33 Qatar Artificial Lift Systems Market Forecast 2018-2028 (US$mn, AGR %)
Figure 6.34 UAE Artificial Lift Systems Market Forecast 2018-2028 (US$mn, AGR %)
Figure 6.35 Rest of Middle East Artificial Lift Systems Market Forecast 2018-2028 (US$mn, AGR %)
Figure 6.36 Africa Artificial Lift Systems Market by Country AGR Forecast 2018-2028 (AGR %)
Figure 6.37 Africa Artificial Lift Systems Market by Country Forecast 2018-2028 (US$mn, Africa Total Market Sales AGR %)
Figure 6.38 Africa Artificial Lift Systems Market Share by Country Forecast 2018, 2023, 2028 (% Share)
Figure 6.39 Nigeria Artificial Lift Systems Market Forecast 2018-2028 (US$mn, AGR %)
Figure 6.40 Algeria Artificial Lift Systems Market Forecast 2018-2028 (US$mn, AGR %)
Figure 6.41 Angola Artificial Lift Systems Market Forecast 2018-2028 (US$mn, AGR %)
Figure 6.42 Rest of Africa Artificial Lift Systems Market Forecast 2018-2028 (US$mn, AGR %)
Figure 6.43 South America Artificial Lift Systems Market by Country AGR Forecast 2018-2028 (AGR %)
Figure 6.44 South America Artificial Lift Systems Market by Country Forecast 2018-2028 (US$mn, South America Total Market Sales AGR %)
Figure 6.45 South America Artificial Lift Systems Market Share by Country Forecast 2018, 2023, 2028 (% Share)
Figure 6.46 Venezuela Artificial Lift Systems Market Forecast 2018-2028 (US$mn, AGR %)
Figure 6.47 Brazil Artificial Lift Systems Market Forecast 2018-2028 (US$mn, AGR %)
Figure 6.48 Argentina Artificial Lift Systems Market Forecast 2018-2028 (US$mn, AGR %)
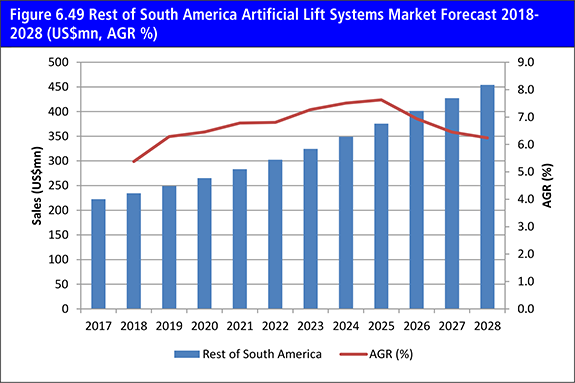
Figure 6.49 Rest of South America Artificial Lift Systems Market Forecast 2018-2028 (US$mn, AGR %)
Figure 8.1 Baker Hughes Inc. Total Company Sales 2011-2016 (US$m, AGR %)
Figure 8.2 Baker Hughes Inc. Sales in the Artificial Lift Systems Market 2011-2016 (US$m, AGR %)
Figure 8.3 Halliburton Total Company Sales 2011-2016 (US$m, AGR %)
Figure 8.4 Halliburton Sales in the Artificial Lift Systems Market 2011-2016 (US$m, AGR %)
Figure 8.5 Schlumberger Total Company Sales 2011-2016 (US$m, AGR %)
Figure 8.6 Schlumberger Sales in the Artificial Lift Systems Market 2011-2016 (US$m, AGR %)
Figure 8.7 Weatherford International Total Company Sales 2011-2016 (US$m, AGR %)
Figure 8.8 Weatherford International Sales in the Artificial Lift Systems Market 2011-2016 (US$m, AGR %)
Figure 8.9 General Electric Total Company Sales 2012-2016 (US$m, AGR %)
Figure 8.10 General Electric Sales in the Artificial Lift Systems Market 2011-2016 (US$m, AGR %)
Figure 8.11 Dover Corporation Company Sales 2011-2016 (US$m, AGR %)
Figure 8.12 Dover Corporation Sales in the Artificial Lift Systems Market 2011-2016 (US$m, AGR %)
Figure 8.13 Dover Corporation (Subsegment) Sales in the Artificial Lift Systems Market 2011-2016 (US$m, AGR %)
Figure 8.14 Borets International Limited Total Company Sales 2011-2016 (US$m, AGR %)
Figure 8.15 National Oilwell Varco Company Sales 2011-2016 (US$m, AGR %)
Figure 8.16 National Oilwell Varco Sales in the Artificial Lift Systems Market 2011-2016 (US$m, AGR %)
Figure 8.17 Aker Solutions Total Company Sales 2011-2016 (US$m, AGR %)
Figure 8.18 Aker Solutions Sales in the Artificial Lift Systems Market 2014-2016 (US$m, AGR %)