The Waste-to-Energy Market Report 2022-2032: This report will prove invaluable to leading firms striving for new revenue pockets if they wish to better understand the industry and its underlying dynamics. It will be useful for companies that would like to expand into different industries or to expand their existing operations in a new country.
WtE Technologies Advances Enhances Plant Energy Generation
Hydrothermal Carbonisation (HTC) simulates the synthesis of ‘hydro-char,’ which has attributes similar to fossil fuels, by speeding up the slow process of geothermal conversion of wet waste using an acid catalyst at high pressure and heat. The major benefits of AD are the faster processing times and the same operating conditions needed to produce the same amount of energy. Dendro Liquid Energy (DLE) is a waste-free WtE breakthrough developed in Germany. It’s said to be four times more efficient and cost less than AD.
Government Support For WtE Plant Development is Driving the Market Growth
The WTE market in Asia-Pacific is predicted to grow at a rate of over 15% annually by 2023, reaching a value of US$13.66 billion. This market is being used by commercial banks, multilateral development banks, financial sponsors, and private equity firms. Financial equity is less common in emerging regions, but increasingly common in developed areas such as Australia. In the region, public-private partnerships (PPPs) are a popular development method. According to Ananda Ram Bhaskar, Deputy Chief Executive Officer (Environmental Protection) and Director-General of Singapore’s National Environment Agency’s Environmental Protection Division, the NEA constructs WTE facilities both on its own and with private sector developers under a PPP structure (NEA).
What Questions Should You Ask before Buying a Market Research Report?
• How is the waste-to-energy market evolving?
• What is driving and restraining the waste-to-energy market?
• How will each waste-to-energy submarket segment grow over the forecast period and how much revenue will these submarkets account for in 2032?
• How will the market shares for each waste-to-energy submarket develop from 2022 to 2032?
• What will be the main driver for the overall market from 2022 to 2032?
• Will leading waste-to-energy markets broadly follow the macroeconomic dynamics, or will individual national markets outperform others?
• How will the market shares of the national markets change by 2032 and which geographical region will lead the market in 2032?
• Who are the leading players and what are their prospects over the forecast period?
• What are the waste-to-energy projects for these leading companies?
• How will the industry evolve during the period between 2020 and 2032? What are the implications of waste-to-energy projects taking place now and over the next 10 years?
• Is there a greater need for product commercialisation to further scale the waste-to-energy market?
• Where is the waste-to-energy market heading and how can you ensure you are at the forefront of the market?
• What are the best investment options for new product and service lines?
• What are the key prospects for moving companies into a new growth path and C-suite?
You need to discover how this will impact the waste-to-energy market today, and over the next 10 years:
• Our 286-page report provides 160 tables and 156 charts/graphs exclusively to you.
• The report highlights key lucrative areas in the industry so you can target them – NOW.
• It contains in-depth analysis of global, and national sales and growth.
• It highlights for you the key successful trends, changes and revenue projections made by your competitors.
This report tells you TODAY how the waste-to-energy market will develop in the next 10 years, and in line with the variations in COVID-19 economic recession and bounce. This market is more critical now than at any point over the last 10 years.
The report delivers exclusive COVID-19 variations and economic data specific to your market.
To access the data contained in this document please email contactus@visiongain.com
Forecasts to 2032 and other analyses reveal commercial prospects
• In addition to revenue forecasting to 2032, our new study provides you with recent results, growth rates, and market shares.
• You will find original analyses, with business outlooks and developments.
• Discover qualitative analyses (including market dynamics, drivers, opportunities, restraints and challenges), cost structure, impact of rising waste-to-energy prices and recent developments.
This report includes data analysis and invaluable insight into how COVID-19 will affect the industry and your company. Four COVID-19 recovery patterns and their impact, namely, “V”, “L”, “W” and “U” are discussed in this report.
Segments Covered in the Report
Global Waste to Energy Market Size Estimation
• Waste to Energy Cumulative CAPEX ($Mn)
• Waste to Energy Cumulative Capacity (MTPA)
• Waste to Energy Cumulative Total WtE Plants (Units)
• Waste to Energy Cumulative Total Energy Generation (MWe)
Market Segmentation by Plant Status
• Operational WtE Plants
• Under Construction WtE Plants
Market Segmentation by Technology
• Direct Combustion (Mass Burn and RDF)
• Plasma Arc Gasification
• Conventional Gasification
• Pyrolysis WtE
• Chemical Treatment
• Biological Treatment
Market Segmentation by End-Use
• Electricity Generation
• Steam Exports
• Combined Heat and Power (CHP)
• Syngas
• Refuse-Derived fuel (RDF)

In addition to the revenue predictions for the overall world market and segments, you will also find revenue forecasts for 10 leading national markets:
U.S.
• U.S. Market Outlook
• U.S. Market Size Estimation and Forecast by WtE Energy Generation (MWe)
• U.S. Market Size Estimation and Forecast by WtE CAPEX (USD Million)
• U.S. Market Size Estimation and Forecast by WtE Capacity (MTPA)
• U.S. Market Size Estimation and Forecast by WtE Plants (Units)
• U.S. Market Size Estimation and Forecast by WtE Plant Status
• U.S. Market Size Estimation and Forecast by WtE Technology (MTPA)
• U.S. Market Size Estimation and Forecast by End-Use (MWe)
UK
• UK Market Outlook
• UK Market Size Estimation and Forecast by WtE Energy Generation (MWe)
• UK Market Size Estimation and Forecast by WtE CAPEX (USD Million)
• UK Market Size Estimation and Forecast by WtE Capacity (MTPA)
• UK Market Size Estimation and Forecast by WtE Plants (Units)
• UK Market Size Estimation and Forecast by WtE Plant Status
• UK Market Size Estimation and Forecast by WtE Technology (MTPA)
• UK Market Size Estimation and Forecast by End-Use (MWe)
Germany
• Germany Market Outlook
• Germany Market Size Estimation and Forecast by WtE Energy Generation (MWe)
• Germany Market Size Estimation and Forecast by WtE CAPEX (USD Million)
• Germany Market Size Estimation and Forecast by WtE Capacity (MTPA)
• Germany Market Size Estimation and Forecast by WtE Plants (Units)
• Germany Market Size Estimation and Forecast by WtE Plant Status
• Germany Market Size Estimation and Forecast by WtE Technology (MTPA)
• Germany Market Size Estimation and Forecast by End-Use (MWe)
France
• France Market Outlook
• France Market Size Estimation and Forecast by WtE Energy Generation (MWe)
• France Market Size Estimation and Forecast by WtE CAPEX (USD Million)
• France Market Size Estimation and Forecast by WtE Capacity (MTPA)
• France Market Size Estimation and Forecast by WtE Plants (Units)
• France Market Size Estimation and Forecast by WtE Plant Status
• France Market Size Estimation and Forecast by WtE Technology (MTPA)
• France Market Size Estimation and Forecast by End-Use (MWe)
Switzerland
• Switzerland Market Outlook
• Switzerland Market Size Estimation and Forecast by WtE Energy Generation (MWe)
• Switzerland Market Size Estimation and Forecast by WtE CAPEX (USD Million)
• Switzerland Market Size Estimation and Forecast by WtE Capacity (MTPA)
• Switzerland Market Size Estimation and Forecast by WtE Plants (Units)
• Switzerland Market Size Estimation and Forecast by WtE Plant Status
• Switzerland Market Size Estimation and Forecast by WtE Technology (MTPA)
• Switzerland Market Size Estimation and Forecast by End-Use (MWe)
China
• China Market Outlook
• China Market Size Estimation and Forecast by WtE Energy Generation (MWe)
• China Market Size Estimation and Forecast by WtE CAPEX (USD Million)
• China Market Size Estimation and Forecast by WtE Capacity (MTPA)
• China Market Size Estimation and Forecast by WtE Plants (Units)
• China Market Size Estimation and Forecast by WtE Plant Status
• China Market Size Estimation and Forecast by WtE Technology (MTPA)
• China Market Size Estimation and Forecast by End-Use (MWe)
Japan
• Japan Market Outlook
• Japan Market Size Estimation and Forecast by WtE Energy Generation (MWe)
• Japan Market Size Estimation and Forecast by WtE CAPEX (USD Million)
• Japan Market Size Estimation and Forecast by WtE Capacity (MTPA)
• Japan Market Size Estimation and Forecast by WtE Plants (Units)
• Japan Market Size Estimation and Forecast by WtE Plant Status
• Japan Market Size Estimation and Forecast by WtE Technology (MTPA)
• Japan Market Size Estimation and Forecast by End-Use (MWe)
India
• India Market Outlook
• India Market Size Estimation and Forecast by WtE Energy Generation (MWe)
• India Market Size Estimation and Forecast by WtE CAPEX (USD Million)
• India Market Size Estimation and Forecast by WtE Capacity (MTPA)
• India Market Size Estimation and Forecast by WtE Plants (Units)
• India Market Size Estimation and Forecast by WtE Plant Status
• India Market Size Estimation and Forecast by WtE Technology (MTPA)
• India Market Size Estimation and Forecast by End-Use (MWe)
Singapore
• Singapore Market Outlook
• Singapore Market Size Estimation and Forecast by WtE Energy Generation (MWe)
• Singapore Market Size Estimation and Forecast by WtE CAPEX (USD Million)
• Singapore Market Size Estimation and Forecast by WtE Capacity (MTPA)
• Singapore Market Size Estimation and Forecast by WtE Plants (Units)
• Singapore Market Size Estimation and Forecast by WtE Plant Status
• Singapore Market Size Estimation and Forecast by WtE Technology (MTPA)
• Singapore Market Size Estimation and Forecast by End-Use (MWe)
South Korea
• South Korea Market Outlook
• South Korea Market Size Estimation and Forecast by WtE Energy Generation (MWe)
• South Korea Market Size Estimation and Forecast by WtE CAPEX (USD Million)
• South Korea Market Size Estimation and Forecast by WtE Capacity (MTPA)
• South Korea Market Size Estimation and Forecast by WtE Plants (Units)
• South Korea Market Size Estimation and Forecast by WtE Plant Status
• South Korea Market Size Estimation and Forecast by WtE Technology (MTPA)
• South Korea Market Size Estimation and Forecast by End-Use (MWe)
Rest of World
• Rest of World Market Outlook
• Rest of World Market Size Estimation and Forecast by WtE Energy Generation (MWe)
• Rest of World Market Size Estimation and Forecast by WtE CAPEX (USD Million)
• Rest of World Market Size Estimation and Forecast by WtE Capacity (MTPA)
• Rest of World Market Size Estimation and Forecast by WtE Plants (Units)
• Rest of World Market Size Estimation and Forecast by WtE Plant Status
• Rest of World Market Size Estimation and Forecast by WtE Technology (MTPA)
• Rest of World Market Size Estimation and Forecast by End-Use (MWe)
Need industry data? Please contact us today.
The report also includes profiles and for some of the leading companies in the Waste-to-Energy Market, 2022 to 2032, with a focus on this segment of these companies’ operations.
Leading companies and the potential for market growth
• ATCO Power
• Babcock & Wilcox Enterprises
• Biffa plc
• China Everbright Environment Group Ltd,
• Covanta Holding Corporation
• EBARA Corporation
• Fomento de Construcciones y Contratas SA (FCC)
• Hera SpA
• Hitachi Zosen Corp
• Mostostal Warszawa SA
• Origin Energy Limited
• Renova Energia SA
• Suez SA
• Veolia Environnement SA
Overall world revenue for Waste-to-Energy Market, 2022 to 2032 in terms of value the market will surpass US$18,729 million in 2022, our work calculates. We predict strong revenue growth through to 2032. Our work identifies which organizations hold the greatest potential. Discover their capabilities, progress, and commercial prospects, helping you stay ahead.
How will the Waste-to-Energy Market, 2022 to 2032 report help you?
In summary, our 286-age report provides you with the following knowledge:
• Revenue forecasts to 2032 for Waste-to-Energy Market, 2022 to 2032 Market, with forecasts for energy generation, CAPEX, number of plants, technology, end-use, capacity and company size, each forecast at a global and regional level – discover the industry’s prospects, finding the most lucrative places for investments and revenues.
• Revenue forecasts to 2032 for four regional and 20 key national markets – See forecasts for the Waste-to-Energy Market, 2022 to 2032 market in the US, Germany, France, UK, China, India, Japan, South Korea, Switzerland, and Singapore among other prominent economies.
• Prospects for established firms and those seeking to enter the market – including company profiles for 20 of the major companies involved in the Waste-to-Energy Market, 2022 to 2032.
Find quantitative and qualitative analyses with independent predictions. Receive information that only our report contains, staying informed with invaluable business intelligence.
Information found nowhere else
With our new report, you are less likely to fall behind in knowledge or miss out on opportunities. See how our work could benefit your research, analyses, and decisions. Visiongain’s study is for everybody needing commercial analyses for the Waste-to-Energy Market, 2022 to 2032, market-leading companies. You will find data, trends and predictions.
To access the data contained in this document please email contactus@visiongain.com
Buy our report today Waste to Energy (WtE) Market Report 2022-2032: Forecasts by Plant Status (Operational WtE Plants, Under Construction WtE Plants), by Technology (Direct Combustion (Mass Burn, RDF), Plasma Arc Gasification, Conventional Gasification, Pyrolysis WtE, Chemical Treatment, Biological Treatment), by End-use (Electricity Generation, Steam Exports, Combined Heat and Power (CHP), Syngas, Refuse-Derived fuel (RDF)) AND Regional and Leading National Market Analysis PLUS Analysis of Leading Companies AND COVID-19 Impact and Recovery Pattern Analysis. Avoid missing out by staying informed – order our report now.
Visiongain is a trading partner with the US Federal Government
CCR Ref number: KD4R6
Do you have any custom requirements we can help you with? Any need for a specific country, geo region, market segment or specific company information? Contact us today, we can discuss your needs and see how we can help: contactus@visiongain.com
1. Report Overview
1.1 Introduction to Global Waste to Energy Market
1.2 Global Waste to Energy Market Overview
1.2.1 Modernized Waste-to-Energy Plant is Proposed by PEI Energy Systems
1.3 What Are the Objectives of this Report?
1.4 What is the Scope of the Report?
1.5 Global Waste to Energy Market Definition
1.6 Why You Should Read this Report
1.7 What this Report Delivers
1.8 Key Questions Answered by this Analytical Report Include:
1.9 Who is this Report for?
1.10 Research Methodology
1.10.1 Primary Research
1.10.2 Secondary Research
1.10.3 Market Evaluation & Forecasting Methodology
1.11 Frequently Asked Questions (FAQs)
1.12 Associated Visiongain Reports
1.13 About Visiongain
2 Executive Summary
2.1 Every Year, More than 2.2 Billion Tonnes of Municipal Solid Trash Are Produced Worldwide
2.2 Decreasing Land Filling Space Will Boost the WtE Market
2.3 Waste-to-Energy Technology Highlights
2.3.1 Physical Waste-to-energy Ultra-High Temperature Gasification (UHTG) Plants Are the Project's Cornerstones
2.3.2 TPC Power Holding Plc's (TPCH) Revenue Growth Will Be Between 30 and 40 Percent, Powered by a Waste-to-Energy Power Plant
2.3.3 Ireland-Based EQTEC Is a Co-Developer and a Supplier of Gasification Technology for the Southport Hybrid Energy Park Development Project
2.3.4 A $22 Million Contract Has Been Given to the B&W Renewable Business Sector to Create and Provide Cutting-Edge Waste-to-Energy Technology
2.3.5 A New Hawaii Company Wants to Build a Second Waste-to-Energy Power Facility on the Island of Oahu
3 Global Waste to Energy Industry Structure
3.1 Overview
3.2 Benefits of Waste to Energy
3.3 Financial Profits from WTE business
3.4 Innovations in the Industry
3.4.1 Simulating Pyrolysis System
3.4.2 The Conversion of Non-Woody Lignocellulose Biomass into Marketable Products
3.4.3 Mountain Solid Waste Management
3.4.4 Computational Tools for Biotechnology Applications
3.4.5 Biomass-Derived Carbon-Based Materials with High Value
3.5 Recent Developments in the Global Market
3.5.1 The Method of Converting Food Waste into Energy Will Soon Be Put to the Test in St. Cloud
3.5.2 Introduction of a New Method Developed at Purdue University Northwest (PNW)
3.5.3 Clean Hydrogen Fuel and High-Value Carbon Nanomaterials Are Produced from Plastic Waste
3.5.4 In 107 Nations, HomeBiogas Sold over 15,000 Residential Systems
3.5.5 Eleven Municipal Mayors Have Been Alerted by the Waste-to-Energy Division of the Ministry's Resources Circulation Bureau
3.5.6 Construction of a $350 Million Waste-to-Energy Facility in South Canterbury Is Proposed
3.5.7 Sulzer Has Helped Fulcrum Bioenergy, Inc. Finish Building the First Commercial-Scale WtE Plant in the World
3.5.8 In Oahu, a New Waste-to-Energy Facility Will Be Built for $50 Million
3.5.9 Community Eco Power's Waste-to-Energy Plant on Hubbard Avenue in Pittsfield Might Have Found a Buyer
3.5.10 A Proposal to Build a "Waste to Power" Recycling Facility in Southeast Arkansas
3.5.11 The Riverhead Zoning Board Requested a Decision About the Proposed EPCAL Waste-to-Energy Facility
3.5.12 Minnesota County's Push for Waste-to-Energy Goal is Confirmed by the Court
3.5.13 Long Beach Enters into a Contract with a Private Business to Run the Facility
3.5.14 South Yorkshire's Controversial Plans to Construct A £200 Million Waste-to-Energy Incinerator Have Been Approved
3.5.15 The Renewable Natural Gas (RNG) Facility on Wood Road is Now in Use
3.5.16 Regreen Technologies Inc. and Global Sustainable Technologies Inc. Signed a Contract with Astra Energy Inc.
3.5.17 An Application Was Submitted by Veolia Environmental Services for Permission to Build an Advanced Energy Recovery Center at the Woodlawn
4 Global Market Dynamics
4.1 Current Trends in the Global Market
4.1.1 WTE Technologies Advances
4.1.2 Government Support
4.1.3 Urbanization Increasing
4.2 Market Driving Factors
4.2.1 Rising Awareness Toward Energy Generation Using Renewable Resources
4.2.2 Global Municipal Waste for WTE Increasing Volume
4.2.3 Developing Countries Giving Attention Towards WtE
4.2.4 Land Filling Space Decreased
4.2.5 Recent Developments WtE Technologies
4.2.6 Increased Funding from Government Leads to Tackle the Waste Generation
4.2.7 Urbanization Increasing Leading Ever-Increasing Waste Generation
4.3 Market Restraining Factors
4.3.1 Costly Equipements like Incinerators
4.3.2 WTE's Expansion Has Slowed Due to Environmental Opposition in the United States
4.3.3 Waste Incineration Uncommon for Developing Countries
4.3.4 Waste Management Practices
4.3.5 No New Garbage Incinerators Will Be Constructed in Scotland
4.3.6 By July 2022, a State-Owned Rubbish Incinerator Was Intended to Be Shut Down
4.3.7 The Trash-To-Energy Incinerator Might Be Effectively Shut Down by a New State Law
4.4 Opportunities in the Global Market
4.4.1 Asia-Pacific as a Major Hub for WTE
4.4.2 Requiring for Increased Number of WtE Plants
4.4.3 Requiring for WtE Research & Development
4.4.4 Annual Waste Generation Increasing in Asian Countries
4.4.5 National Governments Teaming Up with WtE Companies
4.4.6 WtE Gaining Traction in the Worldwide Energy Industry
4.4.7 The Melville-Based Developer CEA Energy Wants to Construct a Plant for Anaerobic Digestion
4.4.8 The Construction of Aker Carbon Capture's Just Catchtm Modular Carbon Capture Plant at Twence's Waste-to-Energy Facility in Hengelo Has Officially Begun.
4.5 Challenges in the Global Market
4.5.1 Threat from Other Competing Technologies
4.5.2 Obstacles in Terms of Technology and Economics
4.5.3 WTE Regulation and Toxic Pollutants
4.6 PEST Analysis of the Waste-to-Energy Market
4.6.1 Political Factors
4.6.2 Economic Factors
4.6.3 Social Factors
4.6.4 Technological Factors
4.7 SWOT Analysis
4.8 Porter’s 5 Forces Model
5 Global Waste to Energy Market Analysis
5.1 Global Market Outlook
5.1.1 Utilizing Carbon Capture and Usage/Storage, the WtE Sector Has the Entire Potential to Go from Being Carbon Neutral to Carbon Negative (CCUS)
5.2 Global Market Size Estimation and Forecast by Energy Generation
5.3 Global Market Size Estimation and Forecast by CAPEX
5.3.1 Pre-COVID-19 Waste to Energy Market Scenario by CAPEX
5.3.2 Post-COVID-19 Waste to Energy Market Scenario by CAPEX (V, W, U, L-Shaped Recovery Analysis)
5.4 Global Market Size Estimation and Forecast by Capacity
5.5 Global Market Size Estimation and Forecast by Number of Units
5.6 Global Market Size Estimation and Forecast by Plants’ Status
5.7 Global Market Size Estimation and Forecast by Technology
5.8 Global Waste to Energy (WtE) Energy Generation Market Size Estimation and Forecast by End-Use
5.9 Global Waste to Energy (WtE) Energy Generation Market Size Estimation and Forecast by Country
5.10 Global Waste to Energy (WtE) CAPEX Market Size Estimation and Forecast by Country
5.10.1 Pre-COVID-19 Waste to Energy (WtE) CAPEX Market Scenario by Country
5.10.2 Post-COVID-19 Waste to Energy (WtE) CAPEX Market Scenario by Country (V, W, U, L-Shaped Recovery Analysis)
5.11 Global Waste to Energy (WtE) Capacity Market Size Estimation and Forecast by Country
5.12 Global Waste to Energy (WtE) Plants Market Size Estimation and Forecast by Country
6 US Waste to Energy Market Analysis
6.1 US Market Outlook
6.1.1 Municipal Review Committee Intends to Purchase a Waste-to-Energy Facility
6.1.2 Legislation Enacted in Florida Promoting Municipal Use
6.1.3 A New WtE Facility in West Hartford Has Started its Basic Planning Stages
6.1.4 Covanta Will Work with Lee County's Solid Waste Resource Recovery Facility Through 2031
6.2 US Market Size Estimation and Forecast by Energy Generation
6.3 US Market Size Estimation and Forecast by CAPEX
6.4 US Market Size Estimation and Forecast by Capacity
6.5 US Market Size Estimation and Forecast by Number of Plants
6.6 US Market Size Estimation and Forecast by Plants’ Status
6.7 US Market Size Estimation and Forecast by Technology
6.8 US Waste to Energy (WtE) Energy Generation Market Size Estimation and Forecast by End-Use
7 UK Waste to Energy Market Analysis
7.1 UK Market Outlook
7.2 UK Market Size Estimation and Forecast by Energy Generation
7.3 UK Market Size Estimation and Forecast by CAPEX
7.4 UK Market Size Estimation and Forecast by Capacity
7.5 UK Market Size Estimation and Forecast by WTE Plants
7.6 UK Market Size Estimation and Forecast by Plant Status
7.7 UK Market Size Estimation and Forecast by Technology
7.8 UK Market Size Estimation and Forecast by End-Use
8 Germany Waste to Energy Market Analysis
8.1 Germany Market Outlook
8.2 Germany Market Size Estimation and Forecast by Energy Generation
8.3 Germany Market Size Estimation and Forecast by CAPEX
8.4 Germany Market Size Estimation and Forecast by Capacity
8.5 Germany Market Size Estimation and Forecast by WTE Plants
8.6 Germany Market Size Estimation and Forecast by Plant Status
8.7 Germany Market Size Estimation and Forecast by Technology
8.8 Germany Market Size Estimation and Forecast by End-Use
9 France Waste to Energy Market Analysis
9.1 France Market Outlook
9.2 France Market Size Estimation and Forecast by Energy Generation
9.3 France Market Size Estimation and Forecast by CAPEX
9.4 France Market Size Estimation and Forecast by Capacity
9.5 France Market Size Estimation and Forecast by WTE Plants
9.6 France Market Size Estimation and Forecast by Plant Status
9.7 France Market Size Estimation and Forecast by Technology
9.8 France Market Size Estimation and Forecast by End-Use
10 Switzerland Waste to Energy Market Analysis
10.1 Switzerland Market Outlook
10.2 Switzerland Market Size Estimation and Forecast by Energy Generation
10.3 Switzerland Market Size Estimation and Forecast by CAPEX
10.4 Switzerland Market Size Estimation and Forecast by Capacity
10.5 Switzerland Market Size Estimation and Forecast by WTE Plants
10.6 Switzerland Market Size Estimation and Forecast by Plant Status
10.7 Switzerland Market Size Estimation and Forecast by Technology
10.8 Switzerland Market Size Estimation and Forecast by End – Use
11 China Waste to Energy Market Analysis
11.1 China Market Outlook
11.2 China Market Size Estimation and Forecast by Energy Generation
11.3 China Market Size Estimation and Forecast by CAPEX
11.4 China Market Size Estimation and Forecast by Capacity
11.5 China Market Size Estimation and Forecast by WTE Plants
11.6 China Market Size Estimation and Forecast by Plant Status
11.7 China Market Size Estimation and Forecast by Technology
11.8 China Market Size Estimation and Forecast by End - Use
12 Japan Waste to Energy Market Analysis
12.1 Japan Market Outlook
12.2 Japan Market Size Estimation and Forecast by Energy Generation
12.3 Japan Market Size Estimation and Forecast by CAPEX
12.4 Japan Market Size Estimation and Forecast by Capacity
12.5 Japan Market Size Estimation and Forecast by WTE Plants
12.6 Japan Market Size Estimation and Forecast by Plant Status
12.7 Japan Market Size Estimation and Forecast by Technology
12.8 Japan Market Size Estimation and Forecast by End – Use
13 India Waste to Energy Market Analysis
13.1 India Market Outlook
13.1.1 Struggling to Find a Facility for the 360 MT of Non-Recyclable Material
13.1.2 The Waste-to-Energy (WTE) Facility at Brahmapuram Is Not Able to Be Implemented by the Authorities
13.2 India Market Size Estimation and Forecast by Energy Generation
13.3 India Market Size Estimation and Forecast by CAPEX
13.4 India Market Size Estimation and Forecast by Capacity
13.5 India Market Size Estimation and Forecast by WTE Plants
13.6 India Market Size Estimation and Forecast by Plant Status
13.7 India Market Size Estimation and Forecast by Technology
13.8 India Market Size Estimation and Forecast by End - Use
14 Singapore Waste to Energy Market Analysis
14.1 Singapore Market Outlook
14.2 Singapore Market Size Estimation and Forecast by Energy Generation
14.3 Singapore Market Size Estimation and Forecast by CAPEX
14.4 Singapore Market Size Estimation and Forecast by Capacity
14.5 Singapore Market Size Estimation and Forecast by WTE Plants
14.6 Singapore Market Size Estimation and Forecast by Plant Status
14.7 Singapore Market Size Estimation and Forecast by Technology
14.8 Singapore Market Size Estimation and Forecast by End-Use
15 South Korea Waste to Energy Market Analysis
15.1 South Korea Market Outlook
15.2 Switzerland Market Size Estimation and Forecast by Energy Generation
15.3 South Korea Market Size Estimation and Forecast by CAPEX
15.4 South Korea Market Size Estimation and Forecast by Capacity
15.5 South Korea Market Size Estimation and Forecast by WTE Plants
15.6 South Korea Market Size Estimation and Forecast by Plant Status
15.7 South Korea Market Size Estimation and Forecast by Technology
15.8 South Korea Market Size Estimation and Forecast by End - Use
16 Rest of World Waste to Energy Market Analysis
16.1 Rest of World Market Outlook
16.1.1 Kibbutz Yagur Has Changed its Focus and Is Currently Running an Anaerobic Digester (AD)
16.1.2 Warsan, Dubai Is Home to the Largest Waste-to-Energy Project in the World
16.1.3 The Tangerang City Administration Is Preparing to Construct a Waste-to-Energy Facility
16.1.4 Istanbul Is a Leader in the Conversion of Garbage into Electricity
16.2 Rest of World Market Size Estimation and Forecast by Energy Generation
16.3 Rest of World Market Size Estimation and Forecast by CAPEX
16.4 Rest of World Market Size Estimation and Forecast by Capacity
16.5 Rest of World Market Size Estimation and Forecast by WTE Plants
16.6 Rest of World Market Size Estimation and Forecast by Plant Status
16.7 Rest of World Market Size Estimation and Forecast by Technology
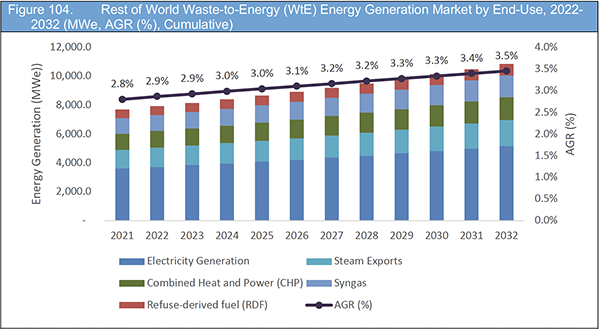
16.8 Rest of World Market Size Estimation and Forecast by End – Use
17 Company Profiles
17.1 ATCO Power
17.1.1 Company Snapshot
17.1.2 Company Overview
17.1.3 Financial Analysis
17.1.4 Product Benchmarking
17.1.5 Strategic Outlook
17.2 Biffa Plc
17.2.1 Company Snapshot
17.2.2 Company Overview
17.2.3 Financial Analysis
17.2.4 Product Benchmarking
17.2.5 Strategic Outlook
17.3 Babcock & Wilcox Enterprises Inc
17.3.1 Company Snapshot
17.3.2 Company Overview
17.3.3 Financial Analysis
17.3.4 Product Benchmarking
17.3.5 Strategic Outlook
17.4 Covanta Holding Corp
17.4.1 Company Snapshot
17.4.2 Company Overview
17.4.3 Financial Analysis
17.4.4 Product Benchmarking
17.4.5 Strategic Outlook
17.5 FCC Environment
17.5.1 Company Snapshot
17.5.2 Company Overview
17.5.3 Financial Analysis
17.5.4 Product Benchmarking
17.5.5 Strategic Outlook
17.6 Origin Renewable Energy
17.6.1 Company Snapshot
17.6.2 Company Overview
17.6.3 Financial Analysis
17.6.4 Product Benchmarking
17.6.5 Strategic Outlook
17.7 Hera SpA
17.7.1 Company Snapshot
17.7.2 Company Overview
17.7.3 Financial Analysis
17.7.4 Product Benchmarking
17.7.5 Strategic Outlook
17.8 Hitachi Zosen Corporation
17.8.1 Company Snapshot
17.8.2 Company Overview
17.8.3 Financial Analysis
17.8.4 Product Benchmarking
17.8.5 Strategic Outlook
17.9 Mostostal Warszawa SA
17.9.1 Company Snapshot
17.9.2 Company Overview
17.9.3 Financial Analysis
17.9.4 Product Benchmarking
17.9.5 Strategic Outlook
17.10 Renova Energia SA
17.10.1 Company Snapshot
17.10.2 Company Overview
17.10.3 Financial Analysis
17.10.4 Product Benchmarking
17.10.5 Strategic Outlook
17.11 Suez SA
17.11.1 Company Snapshot
17.11.2 Company Overview
17.11.3 Financial Analysis
17.11.4 Product Benchmarking
17.11.5 Strategic Outlook
17.12 Veolia Environment SA
17.12.1 Company Snapshot
17.12.2 Company Overview
17.12.3 Financial Analysis
17.12.4 Product Benchmarking
17.12.5 Strategic Outlook
17.13 Ebara Corporation
17.13.1 Company Snapshot
17.13.2 Company Overview
17.13.3 Financial Analysis
17.13.4 Product Benchmarking
17.13.5 Strategic Outlook
17.14 Everbright Environment
17.14.1 Company Snapshot
17.14.2 Company Overview
17.14.3 Financial Analysis
17.14.4 Product Benchmarking
17.14.5 Strategic Outlook
18 Conclusion and Recommendations
18.1 Recommendations
19 Glossary Terms
19.1 List of US Based Waste to Energy Plants with Details
List of Tables
Table 1. Global Waste-to-Energy (WtE) Market Forecast by Energy Generation, 2022-2032 (MWe, AGR (%), CAGR(%), Cumulative)
Table 2. Global Waste To Energy Market Snapshot, 2022 & 2032 (US$million, CAGR %)
Table 3. PEST Analysis
Table 4. SWOT Analysis
Table 5. Global Waste-to-Energy (WtE) Market Forecast by Energy Generation, 2022-2032 (MWe, AGR (%), CAGR(%), Cumulative)
Table 6. Global Waste-to-Energy (WtE) Market Forecast by CAPEX, 2022-2032 (USD Mn, AGR (%), Cumulative)
Table 7. Global Waste-to-Energy (WtE) Market Forecast by CAPEX, 2022-2032 (USD Mn, AGR (%), CAGR(%), Cumulative) (V-Shaped Recovery)
Table 8. Global Waste-to-Energy (WtE) Market Forecast by CAPEX, 2022-2032 (USD Mn, AGR (%), CAGR(%), Cumulative) (W-Shaped Recovery) (W-Shaped Recovery)
Table 9. Global Waste-to-Energy (WtE) Market Forecast by CAPEX, 2022-2032 (USD Mn, AGR (%), CAGR(%), Cumulative) (U-Shaped Recovery)
Table 10. Global Waste-to-Energy (WtE) Market Forecast by CAPEX, 2022-2032 (USD Mn, AGR (%), CAGR(%), Cumulative) (L-Shaped Recovery)
Table 11. Global Waste-to-Energy (WtE) Market Forecast by Capacity, 2022-2032 (MTPA, AGR (%), CAGR(%), Cumulative)
Table 12. Global Waste-to-Energy (WtE) Market Forecast, 2022-2032 (No. of Units, AGR (%), CAGR(%), Cumulative)
Table 13. Global Waste-to-Energy (WtE) Market Forecast by Plant Status, 2022-2032 (Plant Units, AGR (%), CAGR(%), Cumulative)
Table 14. Global Waste-to-Energy (WtE) Market by Technology, 2022-2032 (MTPA, AGR (%), CAGR(%), Cumulative)
Table 15. Global Waste-to-Energy (WtE) Energy Generation Market by End-Use, 2022-2032 (MWe, AGR (%), CAGR(%), Cumulative)
Table 16. Global Waste-to-Energy (WtE) Energy Generation Market by Country, 2022-2032 (MWe, AGR (%), CAGR(%), Cumulative)
Table 17. Global Waste-to-Energy (WtE) CAPEX Market by Country, 2022-2032 (USD Mn, AGR (%), CAGR(%), Cumulative)
Table 18. Global Waste-to-Energy (WtE) CAPEX Market by Country, 2022-2032 (USD Mn, AGR (%), CAGR(%), Cumulative) (V-Shaped Recovery)
Table 19. Global Waste-to-Energy (WtE) CAPEX Market by Country, 2022-2032 (USD Mn, AGR (%), CAGR(%), Cumulative) (W-Shaped Recovery)
Table 20. Global Waste-to-Energy (WtE) CAPEX Market by Country, 2022-2032 (USD Mn, AGR (%), CAGR(%), Cumulative) (U-Shaped Recovery)
Table 21. Global Waste-to-Energy (WtE) CAPEX Market by Country, 2022-2032 (USD Mn, AGR (%), CAGR(%), Cumulative) (L-Shaped Recovery)
Table 22. Global Waste-to-Energy (WtE) Capacity Market by Country, 2022-2032 (MTPA, AGR (%), CAGR(%), Cumulative)
Table 23. Global Waste-to-Energy (WtE) Plants Market by Country, 2022-2032 (Units, AGR (%), CAGR(%), Cumulative)
Table 24. US Waste-to-Energy (WtE) Market Forecast by Energy Generation, 2022-2032 (MWe, AGR (%), CAGR(%), Cumulative)
Table 25. US Waste-to-Energy (WtE) Market Forecast by CAPEX, 2022-2032 (USD Mn, AGR (%), CAGR(%), Cumulative)
Table 26. US Waste-to-Energy (WtE) Market Forecast by Capacity, 2022-2032 (MTPA, AGR (%), CAGR(%), Cumulative)
Table 27. US Waste-to-Energy (WtE) Market Forecast, 2022-2032 (No. of Units, AGR (%), CAGR(%), Cumulative)
Table 28. US Waste-to-Energy (WtE) Market Forecast by Plant Status, 2022-2032 (Plant Units, AGR (%), CAGR(%), Cumulative)
Table 29. US Waste-to-Energy (WtE) Market by Technology, 2022-2032 (MTPA, AGR (%), CAGR(%), Cumulative)
Table 30. US Waste-to-Energy (WtE) Energy Generation Market by End-Use, 2022-2032 (MWe, AGR (%), CAGR(%), Cumulative)
Table 31. UK Waste-to-Energy (WtE) Market Forecast by Energy Generation, 2022-2032 (MWe, AGR (%), CAGR(%), Cumulative)
Table 32. UK Waste-to-Energy (WtE) Market Forecast by CAPEX, 2022-2032 (UKD Mn, AGR (%), CAGR(%), Cumulative)
Table 33. UK Waste-to-Energy (WtE) Market Forecast by CAPEX, 2022-2032 (UKD Mn, AGR (%),
Table 34. UK Waste-to-Energy (WtE) Market Forecast by Capacity, 2022-2032 (MTPA, AGR (%), CAGR(%), Cumulative)
Table 35. UK Waste-to-Energy (WtE) Market Forecast by Capacity, 2022-2032 (MTPA, AGR (%),
Table 36. UK Waste-to-Energy (WtE) Market Forecast, 2022-2032 (No. of Units, AGR (%), CAGR(%), Cumulative)
Table 37. UK Waste-to-Energy (WtE) Market Forecast by Plant Status, 2022-2032 (Plant Units, AGR (%), CAGR(%), Cumulative)
Table 38. UK Waste-to-Energy (WtE) Market by Technology, 2022-2032 (MTPA, AGR (%), CAGR(%), Cumulative)
Table 39. UK Waste-to-Energy (WtE) Energy Generation Market by End-Use, 2022-2032 (MWe, AGR (%), CAGR(%), Cumulative)
Table 40. Germany Waste-to-Energy (WtE) Market Forecast by Energy Generation, 2022-2032 (MWe, AGR (%), CAGR(%), Cumulative)
Table 41. Germany Waste-to-Energy (WtE) Market Forecast by CAPEX, 2022-2032 (GermanyD Mn, AGR (%), CAGR(%), Cumulative)
Table 42. Germany Waste-to-Energy (WtE) Market Forecast by Capacity, 2022-2032 (MTPA, AGR (%), CAGR(%), Cumulative)
Table 43. Germany Waste-to-Energy (WtE) Market Forecast, 2022-2032 (No. of Units, AGR (%), CAGR(%), Cumulative)
Table 44. Germany Waste-to-Energy (WtE) Market Forecast by Plant Status, 2022-2032 (Plant Units, AGR (%), CAGR(%), Cumulative)
Table 45. Germany Waste-to-Energy (WtE) Market by Technology, 2022-2032 (MTPA, AGR (%), CAGR(%), Cumulative)
Table 46. Germany Waste-to-Energy (WtE) Energy Generation Market by End-Use, 2022-2032 (MWe, AGR (%), CAGR(%), Cumulative)
Table 47. France Waste-to-Energy (WtE) Market Forecast by Energy Generation, 2022-2032 (MWe, AGR (%), CAGR(%), Cumulative)
Table 48. France Waste-to-Energy (WtE) Market Forecast by CAPEX, 2022-2032 (FranceD Mn, AGR (%), CAGR(%), Cumulative)
Table 49. France Waste-to-Energy (WtE) Market Forecast by Capacity, 2022-2032 (MTPA, AGR (%), CAGR(%), Cumulative)
Table 50. France Waste-to-Energy (WtE) Market Forecast, 2022-2032 (No. of Units, AGR (%), CAGR(%), Cumulative)
Table 51. France Waste-to-Energy (WtE) Market Forecast by Plant Status, 2022-2032 (Plant Units, AGR (%), CAGR(%), Cumulative)
Table 52. France Waste-to-Energy (WtE) Market by Technology, 2022-2032 (MTPA, AGR (%), CAGR(%), Cumulative)
Table 53. France Waste-to-Energy (WtE) Energy Generation Market by End-Use, 2022-2032 (MWe, AGR (%), CAGR(%), Cumulative)
Table 54. Switzerland Waste-to-Energy (WtE) Market Forecast by Energy Generation, 2022-2032 (MWe, AGR (%), CAGR(%), Cumulative)
Table 55. Switzerland Waste-to-Energy (WtE) Market Forecast by CAPEX, 2022-2032 (SwitzerlandD Mn, AGR (%), CAGR(%), Cumulative)
Table 56. Switzerland Waste-to-Energy (WtE) Market Forecast by Capacity, 2022-2032 (MTPA, AGR (%), CAGR(%), Cumulative)
Table 57. Switzerland Waste-to-Energy (WtE) Market Forecast, 2022-2032 (No. of Units, AGR (%), CAGR(%), Cumulative)
Table 58. Switzerland Waste-to-Energy (WtE) Market Forecast by Plant Status, 2022-2032 (Plant Units, AGR (%), CAGR(%), Cumulative)
Table 59. Switzerland Waste-to-Energy (WtE) Market by Technology, 2022-2032 (MTPA, AGR (%), CAGR(%), Cumulative)
Table 60. Switzerland Waste-to-Energy (WtE) Energy Generation Market by End-Use, 2022-2032 (MWe, AGR (%), CAGR(%), Cumulative)
Table 61. China Waste-to-Energy (WtE) Market Forecast by Energy Generation, 2022-2032 (MWe, AGR (%), CAGR(%), Cumulative)
Table 62. China Waste-to-Energy (WtE) Market Forecast by CAPEX, 2022-2032 (ChinaD Mn, AGR (%), CAGR(%), Cumulative)
Table 63. China Waste-to-Energy (WtE) Market Forecast by Capacity, 2022-2032 (MTPA, AGR (%), CAGR(%), Cumulative)
Table 64. China Waste-to-Energy (WtE) Market Forecast, 2022-2032 (No. of Units, AGR (%), CAGR(%), Cumulative)
Table 65. China Waste-to-Energy (WtE) Market Forecast by Plant Status, 2022-2032 (Plant Units, AGR (%), CAGR(%), Cumulative)
Table 66. China Waste-to-Energy (WtE) Market by Technology, 2022-2032 (MTPA, AGR (%), CAGR(%), Cumulative)
Table 67. China Waste-to-Energy (WtE) Energy Generation Market by End-Use, 2022-2032 (MWe, AGR (%), CAGR(%), Cumulative)
Table 68. Japan Waste-to-Energy (WtE) Market Forecast by Energy Generation, 2022-2032 (MWe, AGR (%), CAGR(%), Cumulative)
Table 69. Japan Waste-to-Energy (WtE) Market Forecast by CAPEX, 2022-2032 (JapanD Mn, AGR (%), CAGR(%), Cumulative)
Table 70. Japan Waste-to-Energy (WtE) Market Forecast by Capacity, 2022-2032 (MTPA, AGR (%), CAGR(%), Cumulative)
Table 71. Japan Waste-to-Energy (WtE) Market Forecast, 2022-2032 (No. of Units, AGR (%), CAGR(%), Cumulative)
Table 72. Japan Waste-to-Energy (WtE) Market Forecast by Plant Status, 2022-2032 (Plant Units, AGR (%), CAGR(%), Cumulative)
Table 73. Japan Waste-to-Energy (WtE) Market by Technology, 2022-2032 (MTPA, AGR (%), CAGR(%), Cumulative)
Table 73. Japan Waste-to-Energy (WtE) Energy Generation Market by End-Use, 2022-2032 (MWe, AGR (%), CAGR(%), Cumulative)
Table 74. India Waste-to-Energy (WtE) Market Forecast by Energy Generation, 2022-2032 (MWe, AGR (%), CAGR(%), Cumulative)
Table 75. India Waste-to-Energy (WtE) Market Forecast by CAPEX, 2022-2032 (IndiaD Mn, AGR (%), CAGR(%), Cumulative)
Table 76. India Waste-to-Energy (WtE) Market Forecast by Capacity, 2022-2032 (MTPA, AGR (%), CAGR(%), Cumulative)
Table 77. India Waste-to-Energy (WtE) Market Forecast, 2022-2032 (No. of Units, AGR (%), CAGR(%), Cumulative)
Table 78. India Waste-to-Energy (WtE) Market Forecast by Plant Status, 2022-2032 (Plant Units, AGR (%), CAGR(%), Cumulative)
Table 79. India Waste-to-Energy (WtE) Market by Technology, 2022-2032 (MTPA, AGR (%), CAGR(%), Cumulative)
Table 80. India Waste-to-Energy (WtE) Energy Generation Market by End-Use, 2022-2032 (MWe, AGR (%), CAGR(%), Cumulative)
Table 81. Singapore Waste-to-Energy (WtE) Market Forecast by Energy Generation, 2022-2032 (MWe, AGR (%), CAGR(%), Cumulative)
Table 82. Singapore Waste-to-Energy (WtE) Market Forecast by CAPEX, 2022-2032 (SingaporeD Mn, AGR (%), CAGR(%), Cumulative)
Table 83. Singapore Waste-to-Energy (WtE) Market Forecast by Capacity, 2022-2032 (MTPA, AGR (%), CAGR(%), Cumulative)
Table 84. Singapore Waste-to-Energy (WtE) Market Forecast, 2022-2032 (No. of Units, AGR (%), CAGR(%), Cumulative)
Table 85. Singapore Waste-to-Energy (WtE) Market Forecast by Plant Status, 2022-2032 (Plant Units, AGR (%), CAGR(%), Cumulative)
Table 86. Singapore Waste-to-Energy (WtE) Market by Technology, 2022-2032 (MTPA, AGR (%), CAGR(%), Cumulative)
Table 87. Singapore Waste-to-Energy (WtE) Energy Generation Market by End-Use, 2022-2032 (MWe, AGR (%), CAGR(%), Cumulative)
Table 88. South Korea Waste-to-Energy (WtE) Market Forecast by Energy Generation, 2022-2032 (MWe, AGR (%), CAGR(%), Cumulative)
Table 89. South Korea Waste-to-Energy (WtE) Market Forecast by CAPEX, 2022-2032 (South KoreaD Mn, AGR (%), CAGR(%), Cumulative)
Table 90. South Korea Waste-to-Energy (WtE) Market Forecast by Capacity, 2022-2032 (MTPA, AGR (%), CAGR(%), Cumulative)
Table 91. South Korea Waste-to-Energy (WtE) Market Forecast, 2022-2032 (No. of Units, AGR (%), CAGR(%), Cumulative)
Table 92. South Korea Waste-to-Energy (WtE) Market Forecast by Plant Status, 2022-2032 (Plant Units, AGR (%), CAGR(%), Cumulative)
Table 93. South Korea Waste-to-Energy (WtE) Market by Technology, 2022-2032 (MTPA, AGR (%), CAGR(%), Cumulative)
Table 94. South Korea Waste-to-Energy (WtE) Energy Generation Market by End-Use, 2022-2032 (MWe, AGR (%), CAGR(%), Cumulative)
Table 95. Rest of World Waste-to-Energy (WtE) Market Forecast by Energy Generation, 2022-2032 (MWe, AGR (%), CAGR(%), Cumulative)
Table 96. Rest of World Waste-to-Energy (WtE) Market Forecast by CAPEX, 2022-2032 (Rest of WorldD Mn, AGR (%), CAGR(%), Cumulative)
Table 97. Rest of World Waste-to-Energy (WtE) Market Forecast by Capacity, 2022-2032 (MTPA, AGR (%), CAGR(%), Cumulative)
Table 98. Rest of World Waste-to-Energy (WtE) Market Forecast, 2022-2032 (No. of Units, AGR (%), CAGR(%), Cumulative)
Table 99. Rest of World Waste-to-Energy (WtE) Market Forecast by Plant Status, 2022-2032 (Plant Units, AGR (%), CAGR(%), Cumulative)
Table 100. Rest of World Waste-to-Energy (WtE) Market by Technology, 2022-2032 (MTPA, AGR (%), CAGR(%), Cumulative)
Table 101. Rest of World Waste-to-Energy (WtE) Energy Generation Market by End-Use, 2022-2032 (MWe, AGR (%), CAGR(%), Cumulative)
Table 102. ATCO Power: Company Information
Table 103. ATCO Power: Company Revenue 2016-2022 (US$Mn, AGR %)
Table 104. ATCO Power: Company Product and Service Benchmarking
Table 105. ATCO Power: Company Recent Developments till Feb,2020
Table 106. Biffa plc : Company Information
Table 107. Biffa plc : Company Revenue 2016-2020 (US$Mn, AGR %)
Table 108. Biffa plc : Company Product and Service Benchmarking
Table 109. Biffa plc : Company Recent Developments till Feb,2020
Table 110. Babcock & Wilcox Enterprises Inc: Company Information
Table 111. Babcock & Wilcox Enterprises Inc: Company Revenue 2015-2019 (US$Mn, AGR %)
Table 112. Babcock & Wilcox Enterprises Inc: Company Product and Service Benchmarking
Table 113. Babcock & Wilcox Enterprises Inc: Company Recent Developments till Feb,2020
Table 114. Covanta Holding Corp: Company Information
Table 115. Covanta Holding Corp: Company Revenue 2016-2020(US$Mn, AGR %)
Table 116. Covanta Holding Corp: Company Product and Service Benchmarking
Table 117. Covanta Holding Corp: Company Recent Developments till Feb,2020
Table 118. FCC Environment: Company Information
Table 119. FCC Environment: Company Revenue 2016-2020(US$Mn, AGR %)
Table 120. FCC Environment: Company Product and Service Benchmarking
Table 121. FCC Environment: Company Recent Developments till Feb,2020
Table 122. Origin renewable energy: Company Information
Table 123. Origin renewable energy: Company Revenue 2016-2020 (US$Mn, AGR %)
Table 124. Origin renewable energy: Company Product and Service Benchmarking
Table 125. Origin renewable energy: Company Recent Developments till Feb,2020
Table 126. Hera SpA : Company Information
Table 127. Hera SpA : Company Revenue 2016-2020 (US$Mn, AGR %)
Table 128. Hera SpA : Company Product and Service Benchmarking
Table 129. Hera SpA : Company Recent Developments till Feb,2020
Table 130. Hitachi Zosen Corporation: Company Information
Table 134. Hitachi Zosen Corporation: Company Revenue 2016-2020 (US$Mn, AGR %)
Table 135. Hitachi Zosen Corporation: Company Product and Service Benchmarking
Table 136. Hitachi Zosen Corporation: Company Recent Developments till Feb,2020
Table 137. Mostostal Warszawa SA: Company Information
Table 138. Mostostal Warszawa SA: Company Revenue 2015-2019 (US$Mn, AGR %)
Table 139. Mostostal Warszawa SA: Company Product and Service Benchmarking
Table 140. Mostostal Warszawa SA: Company Recent Developments till Feb,2020
Table 141. Renova Energia SA: Company Information
Table 142. Renova Energia SA: Company Revenue 2015-2019 (US$Mn, AGR %)
Table 143. Renova Energia SA: Company Product and Service Benchmarking
Table 144. Renova Energia SA: Company Recent Developments till Feb,2020
Table 145. Suez SA: Company Information
Table 146. Suez SA: Company Revenue 2016-2020 (US$Mn, AGR %)
Table 147. Suez SA: Company Product and Service Benchmarking
Table 148. Suez SA: Company Recent Developments till Feb,2020
Table 149. Veolia Environnement SA: Company Information
Table 150.Veolia Environnement SA: Company Revenue 2016-2020 (US$Mn, AGR %)
Table 151. Veolia Environnement SA: Company Product and Service Benchmarking
Table 152. Veolia Environnement SA: Company Recent Developments till Feb,2020
Table 153. EBARA CORPORATION: Company Information
Table 154. EBARA CORPORATION: Company Revenue 2016-2020 (US$Mn, AGR %)
Table 155. EBARA CORPORATION: Company Product and Service Benchmarking
Table 156. EBARA CORPORATION: Company Recent Developments till Feb,2020
Table 157. Everbright Environment: Company Information
Table 159. Everbright Environment: Company Product and Service Benchmarking
Table 160. Everbright Environment: Company Recent Developments till Feb,2020
List of Figures
Figure 1. Muncipal Solid Waste Management
Figure 2. Global Waste-to-Energy (WtE) Market Forecast by Energy Generation, 2022-2032 (MWe, AGR (%), CAGR(%), Cumulative)
Figure 3. Global Waste To Energy Market Segmentation
Figure 4. Waste to Energy Hierarchy
Figure 5. Waste to Energy Cycle
Figure 6. The Waste Hierarchy
Figure 7. Competing Renewable Technologies
Figure 8. Porters 5 Forces
Figure 9. Global Waste-to-Energy (WtE) Market Forecast by Energy Generation, 2022-2032 (MWe, AGR (%), CAGR(%), Cumulative)
Figure 10. Global Waste-to-Energy (WtE) Market Forecast by CAPEX, 2022-2032 (USD Mn, AGR (%), Cumulative)
Figure 11. Global Waste-to-Energy (WtE) Market Forecast by CAPEX, 2022-2032 (USD Mn, AGR (%), Cumulative) (V-Shaped Recovery)
Figure 12. Global Waste-to-Energy (WtE) Market Forecast by CAPEX, 2022-2032 (USD Mn, AGR (%), Cumulative) (W-Shaped Recovery) (W-Shaped Recovery)
Figure 13. Global Waste-to-Energy (WtE) Market Forecast by CAPEX, 2022-2032 (USD Mn, AGR (%), Cumulative) (U-Shaped Recovery)
Figure 14. Global Waste-to-Energy (WtE) Market Forecast by CAPEX, 2022-2032 (USD Mn, AGR (%), Cumulative) (L-Shaped Recovery)
Figure 15. Global Waste-to-Energy (WtE) Market Forecast by Capacity, 2022-2032 (MTPA, AGR (%), Cumulative)
Figure 16. Global Waste-to-Energy (WtE) Market Forecast, 2022-2032 (No. of Units, AGR (%), Cumulative)
Figure 17. Global Waste-to-Energy (WtE) Market Forecast by Plant Status, 2022-2032 (Plant Units, AGR (%), Cumulative)
Figure 18. Global Waste-to-Energy (WtE) Market by Technology, 2022-2032 (MTPA, AGR (%), Cumulative)
Figure 19. Global Waste-to-Energy (WtE) Energy Generation Market by End-Use, 2022-2032 (MWe, AGR (%), Cumulative)
Figure 20. Global Waste-to-Energy (WtE) Energy Generation Market by Country, 2022-2032 (MWe, AGR (%), Cumulative)
Figure 21. Global Waste-to-Energy (WtE) CAPEX Market by Country, 2022-2032 (USD Mn, AGR (%), Cumulative)
Figure 22. Global Waste-to-Energy (WtE) Capacity Market by Country, 2022-2032 (MTPA, AGR (%), Cumulative)
Figure 23. Global Waste-to-Energy (WtE) Plants Market by Country, 2022-2032 (Units, AGR (%), Cumulative)
Figure 24. US Waste-to-Energy (WtE) Market Forecast by Energy Generation, 2022-2032 (MWe, AGR (%), Cumulative)
Figure 25. US Waste-to-Energy (WtE) Market Forecast by CAPEX, 2022-2032 (USD Mn, AGR (%), Cumulative)
Figure 26. US Waste-to-Energy (WtE) Market Forecast by Capacity, 2022-2032 (MTPA, AGR (%), Cumulative)
Figure 27. US Waste-to-Energy (WtE) Market Forecast, 2022-2032 (No. of Units, AGR (%), Cumulative)
Figure 28. US Waste-to-Energy (WtE) Market Forecast by Plant Status, 2022-2032 (Plant Units, AGR (%), Cumulative)
Figure 29. US Waste-to-Energy (WtE) Market by Technology, 2022-2032 (MTPA, AGR (%), Cumulative)
Figure 30. US Waste-to-Energy (WtE) Energy Generation Market by End-Use, 2022-2032 (MWe, AGR (%), Cumulative)
Figure 31. UK Waste-to-Energy (WtE) Market Forecast by Energy Generation, 2022-2032 (MWe, AGR (%), Cumulative)
Figure 32. UK Waste-to-Energy (WtE) Market Forecast by CAPEX, 2022-2032 (UKD Mn, AGR (%), Cumulative)
Figure 33. UK Waste-to-Energy (WtE) Market Forecast by Capacity, 2022-2032 (MTPA, AGR (%), Cumulative)
Figure 34. UK Waste-to-Energy (WtE) Market Forecast, 2022-2032 (No. of Units, AGR (%), Cumulative)
Figure 35. UK Waste-to-Energy (WtE) Market Forecast by Plant Status, 2022-2032 (Plant Units, AGR (%), Cumulative)
Figure 36. UK Waste-to-Energy (WtE) Market Forecast by Plant Status, 2022-2032 (Plant Units, AGR (%), Cumulative) (L-Shaped Recovery)
Figure 37. UK Waste-to-Energy (WtE) Market by Technology, 2022-2032 (MTPA, AGR (%), Cumulative)
Figure 38. UK Waste-to-Energy (WtE) Energy Generation Market by End-Use, 2022-2032 (MWe, AGR (%), Cumulative)
Figure 39. Germany Waste-to-Energy (WtE) Market Forecast by Energy Generation, 2022-2032 (MWe, AGR (%), Cumulative)
Figure 40. Germany Waste-to-Energy (WtE) Market Forecast by CAPEX, 2022-2032 (GermanyD Mn, AGR (%), Cumulative)
Figure 41. Germany Waste-to-Energy (WtE) Market Forecast by Capacity, 2022-2032 (MTPA, AGR (%), Cumulative)
Figure 42. Germany Waste-to-Energy (WtE) Market Forecast, 2022-2032 (No. of Units, AGR (%), Cumulative)
Figure 43. Germany Waste-to-Energy (WtE) Market Forecast by Plant Status, 2022-2032 (Plant Units, AGR (%), Cumulative)
Figure 44. Germany Waste-to-Energy (WtE) Market by Technology, 2022-2032 (MTPA, AGR (%), Cumulative)
Figure 45. Germany Waste-to-Energy (WtE) Energy Generation Market by End-Use, 2022-2032 (MWe, AGR (%), Cumulative)
Figure 46. France Waste-to-Energy (WtE) Market Forecast by Energy Generation, 2022-2032 (MWe, AGR (%), Cumulative)
Figure 47. France Waste-to-Energy (WtE) Market Forecast by CAPEX, 2022-2032 (FranceD Mn, AGR (%), Cumulative)
Figure 48. France Waste-to-Energy (WtE) Market Forecast by Capacity, 2022-2032 (MTPA, AGR (%), Cumulative)
Figure 49. France Waste-to-Energy (WtE) Market Forecast, 2022-2032 (No. of Units, AGR (%), Cumulative)
Figure 50. France Waste-to-Energy (WtE) Market Forecast by Plant Status, 2022-2032 (Plant Units, AGR (%), Cumulative)
Figure 51. France Waste-to-Energy (WtE) Market by Technology, 2022-2032 (MTPA, AGR (%), Cumulative)
Figure 52. France Waste-to-Energy (WtE) Energy Generation Market by End-Use, 2022-2032 (MWe, AGR (%), Cumulative)
Figure 53. Switzerland Waste-to-Energy (WtE) Market Forecast by Energy Generation, 2022-2032 (MWe, AGR (%), Cumulative)
Figure 54. Switzerland Waste-to-Energy (WtE) Market Forecast by CAPEX, 2022-2032 (SwitzerlandD Mn, AGR (%), Cumulative)
Figure 55. Switzerland Waste-to-Energy (WtE) Market Forecast by Capacity, 2022-2032 (MTPA, AGR (%), Cumulative)
Figure 56. Switzerland Waste-to-Energy (WtE) Market Forecast, 2022-2032 (No. of Units, AGR (%), Cumulative)
Figure 57. Switzerland Waste-to-Energy (WtE) Market Forecast by Plant Status, 2022-2032 (Plant Units, AGR (%), Cumulative)
Figure 58. Switzerland Waste-to-Energy (WtE) Market by Technology, 2022-2032 (MTPA, AGR (%), Cumulative)
Figure 59. Switzerland Waste-to-Energy (WtE) Energy Generation Market by End-Use, 2022-2032 (MWe, AGR (%), Cumulative)
Figure 60. China Waste-to-Energy (WtE) Market Forecast by Energy Generation, 2022-2032 (MWe, AGR (%), Cumulative)
Figure 61. China Waste-to-Energy (WtE) Market Forecast by CAPEX, 2022-2032 (ChinaD Mn, AGR (%), Cumulative)
Figure 62. China Waste-to-Energy (WtE) Market Forecast by Capacity, 2022-2032 (MTPA, AGR (%), Cumulative)
Figure 63. China Waste-to-Energy (WtE) Market Forecast, 2022-2032 (No. of Units, AGR (%), Cumulative)
Figure 64. China Waste-to-Energy (WtE) Market Forecast by Plant Status, 2022-2032 (Plant Units, AGR (%), Cumulative)
Figure 65. China Waste-to-Energy (WtE) Market by Technology, 2022-2032 (MTPA, AGR (%), Cumulative)
Figure 66. China Waste-to-Energy (WtE) Energy Generation Market by End-Use, 2022-2032 (MWe, AGR (%), Cumulative)
Figure 67. Japan Waste-to-Energy (WtE) Market Forecast by Energy Generation, 2022-2032 (MWe, AGR (%), CAGR(%), Cumulative)
Figure 68. Japan Waste-to-Energy (WtE) Market Forecast by CAPEX, 2022-2032 (JapanD Mn, AGR (%), Cumulative)
Figure 69. Japan Waste-to-Energy (WtE) Market Forecast by Capacity, 2022-2032 (MTPA, AGR (%), Cumulative)
Figure 70. Japan Waste-to-Energy (WtE) Market Forecast, 2022-2032 (No. of Units, AGR (%), Cumulative)
Figure 71. Japan Waste-to-Energy (WtE) Market Forecast by Plant Status, 2022-2032 (Plant Units, AGR (%), Cumulative)
Figure 72. Japan Waste-to-Energy (WtE) Market by Technology, 2022-2032 (MTPA, AGR (%), Cumulative)
Figure 73. Japan Waste-to-Energy (WtE) Energy Generation Market by End-Use, 2022-2032 (MWe, AGR (%), Cumulative)
Figure 74. India Waste-to-Energy (WtE) Market Forecast by Energy Generation, 2022-2032 (MWe, AGR (%), Cumulative)
Figure 75. India Waste-to-Energy (WtE) Market Forecast by CAPEX, 2022-2032 (IndiaD Mn, AGR (%), Cumulative)
Figure 76. India Waste-to-Energy (WtE) Market Forecast by Capacity, 2022-2032 (MTPA, AGR (%), Cumulative)
Figure 77. India Waste-to-Energy (WtE) Market Forecast, 2022-2032 (No. of Units, AGR (%), Cumulative)
Figure 78. India Waste-to-Energy (WtE) Market Forecast by Plant Status, 2022-2032 (Plant Units, AGR (%), Cumulative)
Figure 79. India Waste-to-Energy (WtE) Market by Technology, 2022-2032 (MTPA, AGR (%), Cumulative)
Figure 80. India Waste-to-Energy (WtE) Energy Generation Market by End-Use, 2022-2032 (MWe, AGR (%), CAGR(%), Cumulative)
Figure 81. Singapore Waste-to-Energy (WtE) Market Forecast by Energy Generation, 2022-2032 (MWe, AGR (%), Cumulative)
Figure 82. Singapore Waste-to-Energy (WtE) Market Forecast by CAPEX, 2022-2032 (SingaporeD Mn, AGR (%), Cumulative)
Figure 83. Singapore Waste-to-Energy (WtE) Market Forecast by Capacity, 2022-2032 (MTPA, AGR (%), Cumulative)
Figure 84. Singapore Waste-to-Energy (WtE) Market Forecast by Plant Status, 2022-2032 (Plant Units, AGR (%), Cumulative)
Figure 85. Singapore Waste-to-Energy (WtE) Market by Technology, 2022-2032 (MTPA, AGR (%), Cumulative)
Figure 86. Singapore Waste-to-Energy (WtE) Energy Generation Market by End-Use, 2022-2032 (MWe, AGR (%), Cumulative)
Figure 87. South Korea Waste-to-Energy (WtE) Market Forecast by Energy Generation, 2022-2032 (MWe, AGR (%), Cumulative)
Figure 88. South Korea Waste-to-Energy (WtE) Market Forecast by CAPEX, 2022-2032 (South KoreaD Mn, AGR (%), Cumulative)
Figure 89. South Korea Waste-to-Energy (WtE) Market Forecast by Capacity, 2022-2032 (MTPA, AGR (%), Cumulative)
Figure 90. South Korea Waste-to-Energy (WtE) Market Forecast, 2022-2032 (No. of Units, AGR (%), Cumulative)
Figure 91. South Korea Waste-to-Energy (WtE) Market Forecast by Plant Status, 2022-2032 (Plant Units, AGR (%), Cumulative)
Figure 92. South Korea Waste-to-Energy (WtE) Market by Technology, 2022-2032 (MTPA, AGR (%), Cumulative)
Figure 93. South Korea Waste-to-Energy (WtE) Energy Generation Market by End-Use, 2022-2032 (MWe, AGR (%), CAGR(%), Cumulative)
Figure 94. Rest of World Waste-to-Energy (WtE) Market Forecast by Energy Generation, 2022-2032 (MWe, AGR (%), Cumulative)
Figure 95. Rest of World Waste-to-Energy (WtE) Market Forecast by CAPEX, 2022-2032 (Rest of WorldD Mn, AGR (%), Cumulative)
Figure 96. Rest of World Waste-to-Energy (WtE) Market Forecast by Capacity, 2022-2032 (MTPA, AGR (%), Cumulative)
Figure 97. Rest of World Waste-to-Energy (WtE) Market Forecast, 2022-2032 (No. of Units, AGR (%), Cumulative)
Figure 98. Rest of World Waste-to-Energy (WtE) Market Forecast by Plant Status, 2022-2032 (Plant Units, AGR (%), Cumulative)
Figure 99. Rest of World Waste-to-Energy (WtE) Market by Technology, 2022-2032 (MTPA, AGR (%), Cumulative)
Figure 100. Rest of World Waste-to-Energy (WtE) Energy Generation Market by End-Use, 2022-2032 (MWe, AGR (%), Cumulative)
Figure 101. ATCO Power: Company Revenue 2017-2021 (US$Mn, AGR %)
Figure 102. ATCO Power: Company Operating Income 2017-2021 (US$Mn, AGR %)
Figure 103. ATCO Power: Company Net Income 2017-2021 (US$Mn, AGR %)
Figure 104. ATCO Power: Company EBITDA 2017-2021 (US$Mn, AGR %)
Figure 105. Biffa plc : Company Revenue 2017-2021 (US$Mn, AGR %)
Figure 106. Biffa plc : Company Operating Income 2017-2021 (US$Mn, AGR %)
Figure 107. Biffa plc : Company Net Income 2017-2021 (US$Mn, AGR %)
Figure 108. Biffa plc : Company EBITDA 2017-2021 (US$Mn, AGR %)
Figure 109. Babcock & Wilcox Enterprises Inc: Company Revenue 2017-2021 (US$Mn, AGR %)
Figure 110. Babcock & Wilcox Enterprises Inc: Company Operating Income 2017-2021 (US$Mn, AGR %)
Figure 111. Babcock & Wilcox Enterprises Inc: Company Net Income 2017-2021 (US$Mn, AGR %)
Figure 112. Babcock & Wilcox Enterprises Inc: Company EBITDA 2017-2021 (US$Mn, AGR %)
Figure 113. Covanta Holding Corp: Company Revenue 2017-2021 (US$Mn, AGR %)
Figure 114. Covanta Holding Corp: Company Operating Income 2017-2021 (US$Mn, AGR %)
Figure 115. Covanta Holding Corp: Company Net Income 2017-2021 (US$Mn, AGR %)
Figure 116. Covanta Holding Corp: Company EBITDA 2017-2021 (US$Mn, AGR %)
Figure 117. FCC Environment: Company Revenue 2017-2021 (US$Mn, AGR %)
Figure 118. FCC Environment: Company Operating Income 2017-2021 (US$Mn, AGR %)
Figure 119. FCC Environment: Company Net Income 2017-2021 (US$Mn, AGR %)
Figure 120. FCC Environment: Company EBITDA 2017-2021 (US$Mn, AGR %)
Figure 121. Origin renewable energy: Company Revenue 2017-2021 (US$Mn, AGR %)
Figure 122. Origin renewable energy: Company Operating Income 2017-2021 (US$Mn, AGR %)
Figure 123. Origin renewable energy: Company Net Income 2017-2021 (US$Mn, AGR %)
Figure 124. Origin renewable energy: Company EBITDA 2017-2021 (US$Mn, AGR %)
Figure 125. Hera SpA : Company Revenue 2017-2021 (US$Mn, AGR %)
Figure 126. Hera SpA : Company Operating Income 2017-2021 (US$Mn, AGR %)
Figure 127. Hera SpA : Company Net Income 2017-2021 (US$Mn, AGR %)
Figure 128. Hera SpA : Company EBITDA 2017-2021 (US$Mn, AGR %)
Figure 129. Hitachi Zosen Corporation: Company Revenue 2017-2021 (US$Mn, AGR %)
Figure 130. Hitachi Zosen Corporation: Company Operating Income 2017-2021 (US$Mn, AGR %)
Figure 131. Hitachi Zosen Corporation: Company Net Income 2017-2021 (US$Mn, AGR %)
Figure 132. Hitachi Zosen Corporation: Company EBITDA 2017-2021 (US$Mn, AGR %)
Figure 133. Mostostal Warszawa SA: Company Revenue 2017-2021 (US$Mn, AGR %)
Figure 134. Mostostal Warszawa SA: Company Operating Income 2017-2021 (US$Mn, AGR %)
Figure 135. Mostostal Warszawa SA: Company Net Income 2017-2021 (US$Mn, AGR %)
Figure 136. Mostostal Warszawa SA: Company EBITDA 2017-2021 (US$Mn, AGR %)
Figure 137. Renova Energia SA: Company Revenue 2017-2021 (US$Mn, AGR %)
Figure 138. Renova Energia SA: Company Operating Income 2017-2021 (US$Mn, AGR %)
Figure 139. Renova Energia SA: Company Net Income 2017-2021 (US$Mn, AGR %)
Figure 140. Renova Energia SA: Company EBITDA 2017-2021 (US$Mn, AGR %)
Figure 141. Suez SA: Company Revenue 2017-2021 (US$Mn, AGR %)
Figure 142. Suez SA: Company Operating Income 2017-2021 (US$Mn, AGR %)
Figure 143. Suez SA: Company Net Income 2017-2021 (US$Mn, AGR %)
Figure 144.Suez SA: Company EBITDA 2017-2021 (US$Mn, AGR %)
Figure 145. Veolia Environnement SA: Company Revenue 2017-2021 (US$Mn, AGR %)
Figure 146. Veolia Environnement SA: Company Operating Income 2017-2021 (US$Mn, AGR %)
Figure 147. Veolia Environnement SA: Company Net Income 2017-2021 (US$Mn, AGR %)
Figure 148. Veolia Environnement SA: Company EBITDA 2017-2021 (US$Mn, AGR %)
Figure 149. EBARA CORPORATION: Company Revenue 2017-2021 (US$Mn, AGR %)
Figure 150. EBARA CORPORATION: Company Operating Income 2017-2021 (US$Mn, AGR %)
Figure 151. EBARA CORPORATION: Company Net Income 2017-2021 (US$Mn, AGR %)
Figure 152. EBARA CORPORATION: Company EBITDA 2017-2021 (US$Mn, AGR %)
Figure 153. Everbright Environment: Company Revenue 2017-2021 (US$Mn, AGR %)
Figure 154. Everbright Environment: Company Operating Income 2017-2021 (US$Mn, AGR %)
Figure 155. Everbright Environment: Company Net Income 2017-2021 (US$Mn, AGR %)
Figure 156. Everbright Environment: Company EBITDA 2017-2021 (US$Mn, AGR %)
List of Companies Profiled in the report
ATCO Power
Babcock & Wilcox Enterprises
Biffa plc
China Everbright Environment Group Ltd,
Covanta Holding Corporation
EBARA Corporation
Fomento de Construcciones y Contratas SA (FCC)
Hera SpA
Hitachi Zosen Corp
Mostostal Warszawa SA
Origin Energy Limited
Renova Energia SA
Suez SA
Veolia Environnement SA
List of Other Companies Mentioned in the report
Acea Group
ACWA Power
Aem Cremona
Air Products
AISA IMPIANTI
Akita City
AmeyCespa
An Bord Pleanala (Irish Planning Board)
An Hui Wenergy
Atlantic County Utilities Authority (ACUA)
Aurium Capital
Azienda Autonoma Municipale Pubblici Servizi
B&W Vølund A/S
Bee’ah
Beijing Municipal Government
Biffa
Bioenergy Infrastructure Group (BIG)
Bioessence
Bodens Energi
Bollnäs Energi AB
Borås Energi Miljo
Borlänge Energi
Borui Green Energy
Bouygues Energies & Services
Brianza Energia Ambiente
Broadcrown
Cadence Enviropower
CAGT Engineering
CECEP
Cemex
Changshu Pufa Thermoelectricity
Chant Group
Chengdu Xingrong Renewable Energy
China Boqi
China Everbright
China Power New Energy
Chinook Urban Mining
CISC
Cixi Zhongke Zhongmao
Clean Association of Tokyo 23
CoGen
Consorzio Recuperi Energetici
Cory Environmental
Covanta
Coventry & Solihull Waste Dsiposal Company
Dalian TEDA Environmental Protection
Dan Municipal Sanitation Association/Nesher
Datong Fuqiao Waste Incineration Electricity
Devon Waste Management
Doosan
Drenl
Dubai Municipality
Dundee Energy Recycling
Ebara
Eco Center
EDF
Ekokem
Ekokem Group (Sakab)
Eksjö Energi
Enviroparks Operations
EON
Equitix
Ethiopian Electric Power Corporation
Euro Energy Group
Falascaia
FCC Environment
Ferrero
Fiberight
Finspang
Fortum Carlisle Ltd
Fortum Keilaniemi
GCL-Poly
Gent Fairhead
Grandblue Environment
Grontmij
Grundon
Hangzhou Jinjiang Group
Helios Energy Investments
Hem
Herambiente
Hfab
Hisashi Kennan Environment Union
Hitachi Zosen Inova
Hunan Junxin Environmental Protection
Inagawa Upstream Garbage Treatment Facilities Union
Indaver
International Electric Power
Iren
Jersey Transport and Technical Services
Jingjiang
Jönköping Energi
K3CHP
Kara/NOVEREN
Karlskoga Energi
Karlstad Energi
Kasugai City
Kawasaki City Hall
KIC Odpapdy
Kils Energi
Kingmoor Park Properties Ltd
Kitakata Union
Kodaira Murayama Yamato Sanitation Union
Kotka Energia
Lahti Energy
Landskrona Energi AB
LECH
Lidköping
Ljungby Energi
Lomellina e Energia
Marcegaglia Energy
Martin GmbH
MCC
MES Environmental
MHIEC
Middlesbrough Council
Minamikawachi Environmental Partnership Secretariat
Mizuda Group
Mostostal Warszawa
Multifuel Energy
MVV Environment
Network Rail
New Earth Energy
NHS Trust
Ningbo Beilun II
NLWA
North Beck Energy Ltd
North London Waste Authority
Nybro Energi
Öresundskraft AB
Organistaions Mentioned
Origin Renewable Energy
Osaka City Hall
Oulun Energia
Peel Environmental
PGNiG Termika
PHG Energy
Posco E&C
Pražské služby
Premier Aggregates
ProNatura
Quadrifoglio
Rabbit Group
Ramboll
Rank Progress
REA Dalmine
Reform Energy
Renova
Resource Recovery Solutions
Sako
Savini
Scarborough Power
Scarlino Energia
Se. Ver. A. SPA
Sennan Cleaning Office Union
Shenzhen Energy
Shida Office Union
Shore Energy
Shougang Corporation
SITA Sembcorp
Skövde Värmeverk AB
Socotec
Söder Energi
Sound Environmental Resources
Southern Yue Cleaning Union
State Communal Enterprise Koktem
Steinmuller Babcock Environment
Stockholm Town
Suez Environmental
Sundsvall Energi
Sysav
Tai'an Zhongke Environment
Tammervoima Oy
Taqa
Tata
Teeside University
Tekniska Verken
Termizo
TIRU
Turku Energia
Uddevalla Energi
Umeå Energi
VafabMiljö
Vantaan Energia
Västervik
Vattenfall
Veolia
Viridor
Warsaw City
Waste Gas Technology UK
Weiming
West Akikawa Sanitation Union
Wheelabrator
Zakland Utylizacyjny
Zevo
ZhongDe
List of Organizations and Associations Mentioned in the report
American Chemistry Council (ACC)
Canadian Ministry for the Environment
Clean Up Britain
Environment and Natural Resources (SEMARNAT) in Mexico
Environmental Protection Agency (EPA)
Government of Bhutan
Government of China
Government of Goa
Inzai District Environment Maintenance Business Union
Ishinomaki District Integrated Administration Work Association
Ocean Recovery Alliance (ORA)
Pernem municipal council
Pope/Douglas Solid Waste Joint Powers Board
Qionghai City Construction Bureau
San-Ei Regulator
Shida Office Union
Southern Yue Cleaning Union
Sustainable Development Technology Canada (SDTC)
Swedish Waste Management
The European Committee of Regions (CoR)
University of California, Irvine (UC Irvine)
US Environmental Protection Agency
West Akikawa Sanitation Union
Xiamen Municipal Environmental Energy Investment Development
Zhangzhou Environment Renewable Energy
Zhaodong Longjie Environmental Protection
 Market Report 2022-2032")