The Compressed Air Energy Storage (CAES) Market Report 2021-2031: This report will prove invaluable to leading firms striving for new revenue pockets if they wish to better understand the industry and its underlying dynamics. It will be useful for companies that would like to expand into different industries or to expand their existing operations in a new region.
Increasingly unpredictable production of electricity from renewable sources
Renewable energy is the fastest-growing energy source in the US, with a 100 percent increase between 2000 and 2018. In 2018, renewables accounted for more than 17% of net energy generation in the United States, with hydropower (7.0%) and wind power (7.0%) accounting for the majority (6.6 percent). Solar generation (including distributed) is expected to expand from 11% of total renewable generation in 2017 to 48% by 2050, making it the fastest-growing electricity source in the United States.
What Are These Questions You Should Ask Before Buying A Market Research Report?
• How is the compressed air energy storage market evolving?
• What is driving and restraining the compressed air energy storage market?
• How will each compressed air energy storage submarket segment grow over the forecast period and how much revenue will these submarkets account for in 2031?
• How will the market shares for each compressed air energy storage submarket develop from 2021 to 2031?
• What will be the main driver for the overall market from 2021 to 2031?
• Will leading compressed air energy storage markets broadly follow the macroeconomic dynamics, or will individual national markets outperform others?
• How will the market shares of the national markets change by 2031 and which geographical region will lead the market in 2031?
• Who are the leading players and what are their prospects over the forecast period?
• What are the compressed air energy storage projects for these leading companies?
• How will the industry evolve during the period between 2020 and 2031?
• What are the implication of compressed air energy storage projects taking place now and over the next 10 years?
• Is there a greater need for product commercialisation to further scale the compressed air energy storage market?
• Where is the compressed air energy storage market heading? And how can you ensure you are at the forefront of the market?
• What can be the best investment options for new product and service lines?
• What are the key prospects for moving companies into a new growth path? C-suite?
You need to discover how this will impact the compressed air energy storage market today, and over the next 10 years:
• Our 448-page report provides 324 tables and 310 charts/graphs exclusively to you.
• The report highlights key lucrative areas in the industry so you can target them – NOW.
• Contains in-depth analyse of global, regional and national sales and growth
• Highlights for you the key successful trends, changes and revenue projections made by your competitors
This report tells you TODAY how the compressed air energy storage market will develop in the next 10 years, and in-line with the variations in COVID-19 economic recession and bounce. This market is more critical now than at any point over the last 10 years.
Delivers exclusive COVID-19 variations economic data specific to your market. To access the data contained in this document please email contactus@visiongain.com
Forecasts to 2031 and other analyses reveal the commercial prospects
• In addition to revenue forecasting to 2031, our new study provides you with recent results, growth rates, and market shares.
• You find original analyses, with business outlooks and developments.
• Discover qualitative analyses (including market dynamics, drivers, opportunities, restraints and challenges), cost structure, impact of rising compressed air energy storage prices and recent developments.
This report includes data analysis and invaluable insight into how COVID-19 will affect the industry and your company. Four COVID-19 recovery patterns and their impact, namely, V, L, W and U are discussed in this report.
Global Compressed Air Energy Storage Market (COVID Impact Analysis) by Plant Location
• Coastal Lines
• Floating Platforms
Global Compressed Air Energy Storage Market (COVID Impact Analysis) by Technology
• Constant Volume Storage
• Constant Pressure Storage
• Other Technology
Global Compressed Air Energy Storage Market (COVID Impact Analysis) by Type
• Adiabatic
• Diabatic
• Isothermal
• Near-isothermal
• Others
Global Compressed Air Energy Storage Market (COVID Impact Analysis) by Components
• Motor/Generator
• Multi-stage Air Compressors
• Expander Train
• Control System
• Auxiliary Equipment
• Compressed Air Storage
Global Compressed Air Energy Storage Market (COVID Impact Analysis) by Stage
• Commercial
• Pre-commercial prototype
• Demonstration stage
• Developmental stage

In addition to the revenue predictions for the overall world market and segments, you will also find revenue forecasts for 4 regional and 20 leading national markets:
• North America Compressed Air Energy Storage Market, 2021 to 2031 Market Outlook
• U.S. Compressed Air Energy Storage Market, 2021 to 2031 Market Forecast & COVID Impact Analysis
• Canada Compressed Air Energy Storage Market, 2021 to 2031 Market Forecast & COVID Impact Analysis
• Mexico Compressed Air Energy Storage Market, 2021 to 2031 Market Forecast & COVID Impact Analysis
• Europe Compressed Air Energy Storage Market, 2021 to 2031 Market Outlook
• Germany Compressed Air Energy Storage Market, 2021 to 2031 Market Forecast & COVID Impact Analysis
• Spain Compressed Air Energy Storage Market, 2021 to 2031 Market Forecast & COVID Impact Analysis
• United Kingdom Compressed Air Energy Storage Market, 2021 to 2031 Market Forecast & COVID Impact Analysis
• France Compressed Air Energy Storage Market, 2021 to 2031 Market Forecast & COVID Impact Analysis
• Italy Compressed Air Energy Storage Market, 2021 to 2031 Market Forecast & COVID Impact Analysis
• Rest of Europe Market Forecast & COVID Impact Analysis
• Asia Pacific Compressed Air Energy Storage Market, 2021 to 2031 Market Outlook
• China Compressed Air Energy Storage Market, 2021 to 2031 Market Forecast & COVID Impact Analysis
• Japan Compressed Air Energy Storage Market, 2021 to 2031 Market Forecast & COVID Impact Analysis
• India Compressed Air Energy Storage Market, 2021 to 2031 Market Forecast & COVID Impact Analysis
• Australia Compressed Air Energy Storage Market, 2021 to 2031 Market Forecast & COVID Impact Analysis
• South Korea Compressed Air Energy Storage Market, 2021 to 2031 Market Forecast & COVID Impact Analysis
• Rest of Asia Pacific Market Forecast & COVID Impact Analysis
• LAMEA Compressed Air Energy Storage Market, 2021 to 2031 Market Outlook
• Brazil Compressed Air Energy Storage Market, 2021 to 2031 Market Forecast & COVID Impact Analysis
• Turkey Compressed Air Energy Storage Market, 2021 to 2031 Market Forecast & COVID Impact Analysis
• Saudi Arabia Compressed Air Energy Storage Market, 2021 to 2031 Market Forecast & COVID Impact Analysis
• South Africa Compressed Air Energy Storage Market, 2021 to 2031 Market Forecast & COVID Impact Analysis
• UAE Compressed Air Energy Storage Market, 2021 to 2031 Market Forecast & COVID Impact Analysis
• Rest of Latin America, Middle East and Africa
Need industry data? Please contact us today.
The report also includes profiles and for some of the leading companies in the Compressed Air Energy Storage Market, 2021 to 2031, with a focus on this segment of these companies’ operations.
Leading companies and the potential for market growth
• Siemens AG
• Pacific Gas and Electric Company
• General Electric Company
• MAN SE
• Hydrostor Inc.
• Magnum Development LLC
• NG Advantage
• AES Energy Storage LLC
• Alstom Power, Inc.
• ALACAES
• General Compression
• Apex CAES
• Storelectric Ltd.
• Solar Turbines, Inc.
• Babcock Power
Overall world revenue for Compressed Air Energy Storage Market, 2021 to 2031 in terms of value the market will surpass US$xx million in 2021, our work calculates. We predict strong revenue growth through to 2031. Our work identifies which organizations hold the greatest potential. Discover their capabilities, progress, and commercial prospects, helping you stay ahead.
How the Compressed Air Energy Storage Market, 2021 to 2031 Market report helps you?
In summary, our 440+ page report provides you with the following knowledge:
• Revenue forecasts to 2031 for Compressed Air Energy Storage Market, 2021 to 2031 Market, with forecasts for technology, type, component, stage each forecasted at a global and regional level– discover the industry’s prospects, finding the most lucrative places for investments and revenues
• Revenue forecasts to 2031 for 4 regional and 20 key national markets – See forecasts for the Compressed Air Energy Storage Market, 2021 to 2031 market in North America, Europe, Asia-Pacific and LAMEA. Also forecasted is the market in the US, Canada, Mexico, Brazil, Germany, France, UK, Italy, China, India, Japan, and Australia among other prominent economies.
• Prospects for established firms and those seeking to enter the market– including company profiles for 20 of the major companies involved in the Compressed Air Energy Storage Market, 2021 to 2031 Market.
Find quantitative and qualitative analyses with independent predictions. Receive information that only our report contains, staying informed with this invaluable business intelligence.
Information found nowhere else
With our newly report title, you are less likely to fall behind in knowledge or miss out on opportunities. See how our work could benefit your research, analyses, and decisions. Visiongain’s study is for everybody needing commercial analyses for the Compressed Air Energy Storage Market, 2021 to 2031 Market and leading companies. You will find data, trends and predictions.
To access the data contained in this document please email contactus@visiongain.com
Buy our report today Compressed Air Energy Storage (CAES) Market Report 2021-2031: Forecasts by Plant Location (Coastal Lines Plants, Floating Platforms), by Technology (Constant Volume Storage, Constant Pressure Storage, Dehydration, Other), by Type (Adiabatic CAES, Diabatic CAES, Isothermal CAES, Nearisothermal CAES, Other), by Components (Motor/Generator, Multi-stage Air Compressors Expander, Train Control System, Auxiliary Equipment, Other), by Stage (Commercial Stage, Pre-commercial Stage, Demonstration Stage, Developmental Stage) AND Regional and Leading National Market Analysis PLUS Analysis of Leading CAES Companies AND COVID-19 Recovery Scenarios. Avoid missing out by staying informed – order our report now.
Visiongain is a trading partner with the US Federal Government
CCR Ref number: KD4R6
Do you have any custom requirements we can help you with? Any need for a specific country, geo region, market segment or specific company information? Contact us today, we can discuss your needs and see how we can help: sara.peerun@visiongain.com
1. Report Overview
1.1 Introduction to Compressed Air Energy Storage Market
1.2 Global Compressed Air Energy Storage Market Overview
1.3 What are the Objectives of this Report?
1.4 What is the Scope of the Report?
1.5 Why You Should Read This Report
1.6 What This Report Delivers
1.7 Key Questions Answered By This Analytical Report Include:
1.8 Who is This Report for?
1.9 Research Methodology
1.9.1 Primary Research
1.9.2 Secondary Research
1.9.3 Market Evaluation & Forecasting Methodology
1.10 Frequently Asked Questions (FAQs)
1.11 Associated Visiongain Reports
1.12 About Visiongain
2 Executive Summary
3 Global Market Dynamics
3.1 Current Trends in the Global Market
3.2 Market Driving Factors
3.2.1 Increasingly unpredictable production of electricity from renewable sources
3.2.2 CAES offers a broad range of benefits for energy storage
3.2.3 Recent Developments In Grid Storage Investing
3.2.4 Increased Investment in Storage Technology
3.3 Market Restraining Factors
3.3.1 High Capital Cost for Compressed Air Energy Storage System
3.3.2 Energy storage efficiency
3.3.3 Future Development Of CAES Technology Is Mainly Restricted By The Compressor, Expander Efficiency And Cooling Capacity And Heat Recovery Efficiency.
3.4 Opportunities in the Global Market
3.4.1 CAES (Compressed Air Energy Storage) has the potential to help with socioeconomic growth as well as environmental protection.
3.4.2 Using Liquid Air for Energy Storage and Maritime Propulsion
3.4.3 Proper energy storage pricing mechanisms and policies are important factors to support the sustainable development of the energy storage industry.
3.5 Challenges in the Global Market
3.5.1 Design issues for compressed air energy storage in sealed underground cavities
3.5.2 Construction cost
3.5.3 The Fracture Influence on the Energy Loss of Compressed Air Energy Storage in Hard Rock
3.6 SWOT Analysis:
4 Global Compressed Air Energy Storage Market Analysis
4.1 Global Market Outlook
4.2 Global Market Size Estimation and Forecast
4.2.1 Pre-COVID-19 Market Scenario
4.2.2 Post-COVID-19 Market Scenarios (V, W, U, L-Shaped Recovery Analysis)
5 Global Compressed Air Energy Storage Market Analysis By Region
5.1 North America
5.2 Europe
5.3 Asia Pacific
5.4 LAMEA
5.5 Global Market Size Estimation and Forecast
5.5.1 Pre-COVID-19 Market Scenario
5.5.2 Post-COVID-19 Market Scenarios (V, W, U, L-Shaped Recovery Analysis)
6 Global Compressed Air Energy Storage Market Analysis By Plant Location
6.1 Coastal Lines Plants
6.2 Floating Platforms
6.3 Global Market Size Estimation and Forecast
6.3.1 Pre-COVID-19 Market Scenario
6.3.2 Post-COVID-19 Market Scenarios (V, W, U, L-Shaped Recovery Analysis)
7 Global Compressed Air Energy Storage Market Analysis By Technology
7.1 Constant Volume Storage
7.2 Constant Pressure Storage
7.3 Global Market Size Estimation and Forecast
7.3.1 Pre-COVID-19 Market Scenario
7.3.2 Post-COVID-19 Market Scenarios (V, W, U, L-Shaped Recovery Analysis)
8 Global Compressed Air Energy Storage Market Analysis By Type
8.1 Adiabatic CAES
8.2 Diabatic CAES
8.3 Isothermal CAES
8.4 Near-isothermal CAES
8.5 Other CAES
8.6 Global Market Size Estimation and Forecast
8.6.1 Pre-COVID-19 Market Scenario
8.6.2 Post-COVID-19 Market Scenarios (V, W, U, L-Shaped Recovery Analysis)
9 Global Compressed Air Energy Storage Market Analysis By Components
9.1 Motor/Generator
9.2 Multi-stage Air Compressors
9.3 Expander Train
9.4 Control System
9.5 Auxiliary Equipment
9.6 Global Market Size Estimation and Forecast
9.6.1 Pre-COVID-19 Market Scenario
9.6.2 Post-COVID-19 Market Scenarios (V, W, U, L-Shaped Recovery Analysis)
10 Global Compressed Air Energy Storage Market Analysis By Stage
10.1 Commercial Stage
10.2 Pre-commercial Stage
10.3 Demonstration Stage
10.4 Developmental Stage
10.5 Global Market Size Estimation and Forecast
10.5.1 Pre-COVID-19 Market Scenario
10.5.2 Post-COVID-19 Market Scenarios (V, W, U, L-Shaped Recovery Analysis)
11 North America Compressed Air Energy Storage Market Analysis
11.1 North America to Dominate the Market, in Terms of Number of CAES Projects
11.2 North America Renewable Energy Demand will Drive the CAES Market
11.3 North America Market Size Estimation and Forecast
11.3.1 Pre-COVID-19 Market Scenario
11.3.2 Post-COVID-19 Market Scenarios (V, W, U, L-Shaped Recovery Analysis)
11.4 Country Market Size Estimation and Forecast
11.4.1 Pre-COVID-19 Market Scenario
11.4.2 Post-COVID-19 Market Scenarios (V, W, U, L-Shaped Recovery Analysis)
11.5 North America Market Size Estimation and Forecast by Plant Location
11.5.1 Pre-COVID-19 Market Scenario
11.5.2 Post-COVID-19 Market Scenarios (V, W, U, L-Shaped Recovery Analysis)
11.6 North America Market Size Estimation and Forecast by Technology
11.6.1 Pre-COVID-19 Market Scenario
11.6.2 Post-COVID-19 Market Scenarios (V, W, U, L-Shaped Recovery Analysis)
11.7 North America Market Size Estimation and Forecast by Type
11.7.1 Pre-COVID-19 Market Scenario
11.7.2 Post-COVID-19 Market Scenarios (V, W, U, L-Shaped Recovery Analysis)
11.8 North America Market Size Estimation and Forecast by Components
11.8.1 Pre-COVID-19 Market Scenario
11.8.2 Post-COVID-19 Market Scenarios (V, W, U, L-Shaped Recovery Analysis)
11.9 North America Market Size Estimation and Forecast By Stage
11.9.1 Pre-COVID-19 Market Scenario
11.9.2 Post-COVID-19 Market Scenarios (V, W, U, L-Shaped Recovery Analysis)
11.10 US Compressed Air Energy Storage Market Analysis
11.10.1 World’s largest non-hydro energy-storage projects announced
11.10.2 Renewable energy is the fastest-growing energy source in the United States
11.10.3 Pre-COVID-19 Market Scenario
11.10.4 Post-COVID-19 Market Scenarios (V, W, U, L-Shaped Recovery Analysis)
11.11 Canada Compressed Air Energy Storage Market Analysis
11.11.1 Canada's biggest-ever clean-energy storage plant plans charged up with launch funding
11.11.2 Canada Launches World’s First Underwater Compressed Air Energy Storage System
11.11.3 Pre-COVID-19 Market Scenario
11.11.4 Post-COVID-19 Market Scenarios (V, W, U, L-Shaped Recovery Analysis)
11.12 Mexico Compressed Air Energy Storage Market Analysis
11.12.1 Mexico Needs Options for Renewable Energy Storage
11.12.2 Mexico has some of the most attractive solar irradiation profiles across the world
11.12.3 Pre-COVID-19 Market Scenario
11.12.4 Post-COVID-19 Market Scenarios (V, W, U, L-Shaped Recovery Analysis)
12 Europe Compressed Air Energy Storage Market Analysis
12.1 Europe Energy Storage Demand will Drive the Market
12.2 Renewable energy production beat fossil fuels in Europe
12.3 Europe Market Size Estimation and Forecast
12.3.1 Pre-COVID-19 Market Scenario
12.3.2 Post-COVID-19 Market Scenarios (V, W, U, L-Shaped Recovery Analysis)
12.4 Country Market Size Estimation and Forecast
12.4.1 Pre-COVID-19 Market Scenario
12.4.2 Post-COVID-19 Market Scenarios (V, W, U, L-Shaped Recovery Analysis)
12.5 Europe Market Size Estimation and Forecast by Plant Location
12.5.1 Pre-COVID-19 Market Scenario
12.5.2 Post-COVID-19 Market Scenarios (V, W, U, L-Shaped Recovery Analysis)
12.6 Europe Market Size Estimation and Forecast by Technology
12.6.1 Pre-COVID-19 Market Scenario
12.6.2 Post-COVID-19 Market Scenarios (V, W, U, L-Shaped Recovery Analysis)
12.7 Europe Market Size Estimation and Forecast by Type
12.7.1 Pre-COVID-19 Market Scenario
12.7.2 Post-COVID-19 Market Scenarios (V, W, U, L-Shaped Recovery Analysis)
12.8 Europe Market Size Estimation and Forecast by Components
12.8.1 Pre-COVID-19 Market Scenario
12.8.2 Post-COVID-19 Market Scenarios (V, W, U, L-Shaped Recovery Analysis)
12.9 Europe Market Size Estimation and Forecast By Stage
12.9.1 Pre-COVID-19 Market Scenario
12.9.2 Post-COVID-19 Market Scenarios (V, W, U, L-Shaped Recovery Analysis)
12.10 Germany Compressed Air Energy Storage Market Analysis
12.10.1 Wind Power Is The Primary Source Of Renewable Energy In Germany
12.10.2 Lithium Ion Batteries are most used in Germany Energy Storage Market
12.10.3 Pre-COVID-19 Market Scenario
12.10.4 Post-COVID-19 Market Scenarios (V, W, U, L-Shaped Recovery Analysis)
12.11 UK Compressed Air Energy Storage Market Analysis
12.11.1 Feasible CAES storage capacity in the UK
12.11.2 Growth in Renewable Energy Sector to Drive the Demand for Energy Storage Systems
12.11.3 Pre-COVID-19 Market Scenario
12.11.4 Post-COVID-19 Market Scenarios (V, W, U, L-Shaped Recovery Analysis)
12.12 France Compressed Air Energy Storage Market Analysis
12.12.1 New Renewable Energy Projects in France will Drive the CAES Market
12.12.2 Total to Build the Largest Battery-based Energy Storage Project in France
12.12.3 Pre-COVID-19 Market Scenario
12.12.4 Post-COVID-19 Market Scenarios (V, W, U, L-Shaped Recovery Analysis)
12.13 Italy Compressed Air Energy Storage Market Analysis
12.13.1 Use of an Under-Water Compressed Air Energy Storage (UWCAES) to Fully Power the Sicily Region (Italy) With Renewable Energy
12.13.2 Pre-COVID-19 Market Scenario
12.13.3 Post-COVID-19 Market Scenarios (V, W, U, L-Shaped Recovery Analysis)
12.14 Spain Compressed Air Energy Storage Market Analysis
12.14.1 Integration of liquid air energy storage into the spanish power grid
12.14.2 Spain generates 43.6% of power from renewables in 2020
12.14.3 Pre-COVID-19 Market Scenario
12.14.4 Post-COVID-19 Market Scenarios (V, W, U, L-Shaped Recovery Analysis)
12.15 Rest of Europe Compressed Air Energy Storage Market Analysis
12.15.1 Pre-COVID-19 Market Scenario
12.15.2 Post-COVID-19 Market Scenarios (V, W, U, L-Shaped Recovery Analysis)
13 Asia-Pacific Compressed Air Energy Storage Market Analysis
13.1 Emergence of Asia-Pacific Renewable Energy Sector
13.2 Asia Pacific Energy Storage Market has Significant Growth in Forecast Period
13.3 Asia-Pacific Market Size Estimation and Forecast
13.3.1 Pre-COVID-19 Market Scenario
13.3.2 Post-COVID-19 Market Scenarios (V, W, U, L-Shaped Recovery Analysis)
13.4 Country Market Size Estimation and Forecast
13.4.1 Pre-COVID-19 Market Scenario
13.4.2 Post-COVID-19 Market Scenarios (V, W, U, L-Shaped Recovery Analysis)
13.5 Asia-Pacific Market Size Estimation and Forecast by Plant Location
13.5.1 Pre-COVID-19 Market Scenario
13.5.2 Post-COVID-19 Market Scenarios (V, W, U, L-Shaped Recovery Analysis)
13.6 Asia-Pacific Market Size Estimation and Forecast by Technology
13.6.1 Pre-COVID-19 Market Scenario
13.6.2 Post-COVID-19 Market Scenarios (V, W, U, L-Shaped Recovery Analysis)
13.7 Asia-Pacific Market Size Estimation and Forecast by Type
13.7.1 Pre-COVID-19 Market Scenario
13.7.2 Post-COVID-19 Market Scenarios (V, W, U, L-Shaped Recovery Analysis)
13.8 Asia-Pacific Market Size Estimation and Forecast by Components
13.8.1 Pre-COVID-19 Market Scenario
13.8.2 Post-COVID-19 Market Scenarios (V, W, U, L-Shaped Recovery Analysis)
13.9 Asia-Pacific Market Size Estimation and Forecast By Stage
13.9.1 Pre-COVID-19 Market Scenario
13.9.2 Post-COVID-19 Market Scenarios (V, W, U, L-Shaped Recovery Analysis)
13.10 China Compressed Air Energy Storage Market Analysis
13.10.1 China completes test on 100 MW compressed air energy storage expander
13.10.2 China aims to install over 30 GW of new energy storage by 2025
13.10.3 Pre-COVID-19 Market Scenario
13.10.4 Post-COVID-19 Market Scenarios (V, W, U, L-Shaped Recovery Analysis)
13.11 India Compressed Air Energy Storage Market Analysis
13.11.1 Feasible CAES storage capacity in India
13.11.2 Energy Storage Capacity in India to witness Significant Demand
13.11.3 Pre-COVID-19 Market Scenario
13.11.4 Post-COVID-19 Market Scenarios (V, W, U, L-Shaped Recovery Analysis)
13.12 Japan Compressed Air Energy Storage Market Analysis
13.12.1 Japanese giant Sumitomo Heavy invests in liquid-air energy storage pioneer
13.12.2 Japan to promote renewable power and reduce fossil fuel imports during 2021-2030
13.12.3 Pre-COVID-19 Market Scenario
13.12.4 Post-COVID-19 Market Scenarios (V, W, U, L-Shaped Recovery Analysis)
13.13 South Korea Compressed Air Energy Storage Market Analysis
13.13.1 South Korea sets 42% renewable energy target by 2034
13.13.2 Pre-COVID-19 Market Scenario
13.13.3 Post-COVID-19 Market Scenarios (V, W, U, L-Shaped Recovery Analysis)
13.14 Australia Compressed Air Energy Storage Market Analysis
13.14.1 Australian utility tests compressed air storage
13.14.2 Australia’s first compressed air energy storage system gets development approval
13.14.3 Pre-COVID-19 Market Scenario
13.14.4 Post-COVID-19 Market Scenarios (V, W, U, L-Shaped Recovery Analysis)
13.15 Rest of Asia-Pacific Compressed Air Energy Storage Market Analysis
13.15.1 Pre-COVID-19 Market Scenario
13.15.2 Post-COVID-19 Market Scenarios (V, W, U, L-Shaped Recovery Analysis)
14 LAMEA Compressed Air Energy Storage Market Analysis
14.1 Latin America’s energy storage leader is getting creative
14.2 Electricity demand in the Middle East will triple by 2050
14.3 LAMEA Market Size Estimation and Forecast
14.3.1 Pre-COVID-19 Market Scenario
14.3.2 Post-COVID-19 Market Scenarios (V, W, U, L-Shaped Recovery Analysis)
14.4 Country Market Size Estimation and Forecast
14.4.1 Pre-COVID-19 Market Scenario
14.4.2 Post-COVID-19 Market Scenarios (V, W, U, L-Shaped Recovery Analysis)
14.5 LAMEA Market Size Estimation and Forecast by Plant Location
14.5.1 Pre-COVID-19 Market Scenario
14.5.2 Post-COVID-19 Market Scenarios (V, W, U, L-Shaped Recovery Analysis)
14.6 LAMEA Market Size Estimation and Forecast by Technology
14.6.1 Pre-COVID-19 Market Scenario
14.6.2 Post-COVID-19 Market Scenarios (V, W, U, L-Shaped Recovery Analysis)
14.7 LAMEA Market Size Estimation and Forecast by Type
14.7.1 Pre-COVID-19 Market Scenario
14.7.2 Post-COVID-19 Market Scenarios (V, W, U, L-Shaped Recovery Analysis)
14.8 LAMEA Market Size Estimation and Forecast by Components
14.8.1 Pre-COVID-19 Market Scenario
14.8.2 Post-COVID-19 Market Scenarios (V, W, U, L-Shaped Recovery Analysis)
14.9 LAMEA Market Size Estimation and Forecast By Stage
14.9.1 Pre-COVID-19 Market Scenario
14.9.2 Post-COVID-19 Market Scenarios (V, W, U, L-Shaped Recovery Analysis)
14.10 Brazil Compressed Air Energy Storage Market Analysis
14.10.1 Brazil Sources 45% of its Energy from Renewables
14.10.2 Brazil holds vast potential for renewables and energy storage development.
14.10.3 Pre-COVID-19 Market Scenario
14.10.4 Post-COVID-19 Market Scenarios (V, W, U, L-Shaped Recovery Analysis)
14.11 South Africa Compressed Air Energy Storage Market Analysis
14.11.1 JCG invests $13m in liquid air long-duration energy storage
14.11.2 South Africa’s system demand for electricity decreased by 5.1% in 2020
14.11.3 Pre-COVID-19 Market Scenario
14.11.4 Post-COVID-19 Market Scenarios (V, W, U, L-Shaped Recovery Analysis)
14.12 Saudi Arabia Compressed Air Energy Storage Market Analysis
14.12.1 Expansion in the renewable energy sector along with several upcoming projects in Saudi Arabia is expected to increase the growth of the stationary energy storage market
14.12.2 Pre-COVID-19 Market Scenario
14.12.3 Post-COVID-19 Market Scenarios (V, W, U, L-Shaped Recovery Analysis)
14.13 Turkey Compressed Air Energy Storage Market Analysis
14.13.1 2020 turning point for renewable energy in Turkey
14.13.2 Pre-COVID-19 Market Scenario
14.13.3 Post-COVID-19 Market Scenarios (V, W, U, L-Shaped Recovery Analysis)
14.14 UAE Compressed Air Energy Storage Market Analysis
14.14.1 UAE Energy Storage Demand is Driving the CAES Market:
14.14.2 Pre-COVID-19 Market Scenario
14.14.3 Post-COVID-19 Market Scenarios (V, W, U, L-Shaped Recovery Analysis)
14.15 Rest of LAMEA Compressed Air Energy Storage Market Analysis
14.15.1 Pre-COVID-19 Market Scenario
14.15.2 Post-COVID-19 Market Scenarios (V, W, U, L-Shaped Recovery Analysis)
15 Leading Company Analysis and Profiles
15.1 Siemens AG
15.1.1 Company Snapshot
15.1.2 Company Overview
15.1.3 Company Financial Profile
15.1.4 Company Product Benchmarking
15.1.5 Company Recent Developments
15.2 Pacific Gas and Electric Company
15.2.1 Company Snapshot
15.2.2 Company Overview
15.2.3 Company Financial Profile
15.2.4 Company Product Benchmarking
15.3 GE Energy
15.3.1 Company Snapshot
15.3.2 Company Overview
15.3.3 Company Financial Profile
15.3.4 Company Product Benchmarking
15.3.5 Company Recent Developments
15.4 MAN SE
15.4.1 Company Snapshot
15.4.2 Company Overview
15.4.3 Company Financial Profile
15.4.4 Company Product Benchmarking
15.4.5 Company Recent Developments
15.5 Hydrostor Inc.
15.5.1 Company Snapshot
15.5.2 Company Overview
15.5.3 Company Product Benchmarking
15.5.4 Company Recent Developments
15.6 Magnum Development LLC
15.6.1 Company Snapshot
15.6.2 Company Overview
15.6.3 Company Product Benchmarking
15.6.4 Company Recent Developments
15.7 NG Advantage
15.7.1 Company Snapshot
15.7.2 Company Overview
15.7.3 Company Product Benchmarking
15.7.4 Company Recent Developments
15.8 AES Energy Storage LLC
15.8.1 Company Snapshot
15.8.2 Company Overview
15.8.3 Company Product Benchmarking
15.8.4 Company Recent Developments
15.9 Alstom Power, Inc.
15.9.1 Company Snapshot
15.9.2 Company Overview
15.9.3 Company Financial Profile
15.10 ALACAES
15.10.1 Company Snapshot
15.10.2 Company Overview
15.10.3 Company Product Benchmarking
15.11 General Compression
15.11.1 Company Snapshot
15.11.2 Company Overview
15.11.3 Company Product Benchmarking
15.12 Apex CAES
15.12.1 Company Snapshot
15.12.2 Company Overview
15.12.3 Company Product Benchmarking
15.13 Storelectric Ltd.,
15.13.1 Company Snapshot
15.13.2 Company Overview
15.13.3 Company Product Benchmarking
15.14 Solar Turbines, Inc.
15.14.1 Company Snapshot
15.14.2 Company Overview
15.14.3 Company Product Benchmarking
15.15 Babcock Power
15.15.1 Company Snapshot
15.15.2 Company Overview
15.15.3 Company Product Benchmarking
16 Conclusion
17 Recommendations
List of Tables
Table 1. Global Compressed Air Energy Storage Market Forecast, 2021-2031 (USD Mn, AGR (%), CAGR(%))
Table 2. Global Compressed Air Energy Storage Market Snapshot, 2021 & 2031 (US$million, CAGR %)
Table 3. Global Compressed Air Energy Storage Market SWOT Analysis 2021-2031
Table 4. Global Compressed Air Energy Storage Market Forecast, 2021-2031 (USD Mn, AGR (%), CAGR(%))
Table 5. Global Compressed Air Energy Storage Market Forecast, 2021-2031 (USD Mn, AGR (%), CAGR(%)) (V-Shaped Recovery)
Table 6. Global Compressed Air Energy Storage Market Forecast, 2021-2031 (USD Mn, AGR (%), CAGR(%)) (W-Shaped Recovery)
Table 7. Global Compressed Air Energy Storage Market Forecast, 2021-2031 (USD Mn, AGR (%), CAGR(%)) (U-Shaped Recovery)
Table 8. Global Compressed Air Energy Storage Market Forecast, 2021-2031 (USD Mn, AGR (%), CAGR(%)) (L-Shaped Recovery)
Table 9. Global Compressed Air Energy Storage Market by Region, 2021-2031 (USD Mn, AGR (%), CAGR(%))
Table 10. Global Compressed Air Energy Storage Market by Region, 2021-2031 (USD Mn, AGR (%), CAGR(%)) (V-Shaped Recovery)
Table 11. Global Compressed Air Energy Storage Market by Region, 2021-2031 (USD Mn, AGR (%), CAGR(%)) (W-Shaped Recovery)
Table 12. Global Compressed Air Energy Storage Market by Region, 2021-2031 (USD Mn, AGR (%), CAGR(%)) (U-Shaped Recovery)
Table 13. Global Compressed Air Energy Storage Market by Region, 2021-2031 (USD Mn, AGR (%), CAGR(%)) (L-Shaped Recovery)
Table 14. Global Compressed Air Energy Storage Market by Plant Location, 2021-2031 (USD Mn, AGR (%), CAGR(%))
Table 15. Global Compressed Air Energy Storage Market by Plant Location, 2021-2031 (USD Mn, AGR (%), CAGR(%)) (V-Shaped Recovery)
Table 16. Global Compressed Air Energy Storage Market by Plant Location, 2021-2031 (USD Mn, AGR (%), CAGR(%)) (W-Shaped Recovery)
Table 17. Global Compressed Air Energy Storage Market by Plant Location, 2021-2031 (USD Mn, AGR (%), CAGR(%)) (U-Shaped Recovery)
Table 18. Global Compressed Air Energy Storage Market by Plant Location, 2021-2031 (USD Mn, AGR (%), CAGR(%)) (L-Shaped Recovery)
Table 19. Global Compressed Air Energy Storage Market by Technology, 2021-2031 (USD Mn, AGR (%), CAGR(%))
Table 20. Global Compressed Air Energy Storage Market by Technology, 2021-2031 (USD Mn, AGR (%), CAGR(%)) (V-Shaped Recovery)
Table 21. Global Compressed Air Energy Storage Market by Technology, 2021-2031 (USD Mn, AGR (%), CAGR(%)) (W-Shaped Recovery)
Table 22. Global Compressed Air Energy Storage Market by Technology, 2021-2031 (USD Mn, AGR (%), CAGR(%)) (U-Shaped Recovery)
Table 23. Global Compressed Air Energy Storage Market by Technology, 2021-2031 (USD Mn, AGR (%), CAGR(%)) (L-Shaped Recovery)
Table 24. Global Compressed Air Energy Storage Markek by Type, 2021-2031 (USD Mn, AGR (%), CAGR(%))
Table 25. Global Compressed Air Energy Storage Markek by Type, 2021-2031 (USD Mn, AGR (%), CAGR(%)) (V-Shaped Recovery)
Table 26. Global Compressed Air Energy Storage Markek by Type, 2021-2031 (USD Mn, AGR (%), CAGR(%)) (W-Shaped Recovery)
Table 27. Global Compressed Air Energy Storage Markek by Type, 2021-2031 (USD Mn, AGR (%), CAGR(%)) (U-Shaped Recovery)
Table 28. Global Compressed Air Energy Storage Markek by Type, 2021-2031 (USD Mn, AGR (%), CAGR(%)) (L-Shaped Recovery)
Table 29. Global Compressed Air Energy Storage Market by Components, 2021-2031 (USD Mn, AGR (%), CAGR(%))
Table 30. Global Compressed Air Energy Storage Market by Components, 2021-2031 (USD Mn, AGR (%), CAGR(%)) (V-Shaped Recovery)
Table 31. Global Compressed Air Energy Storage Market by Components, 2021-2031 (USD Mn, AGR (%), CAGR(%)) (W-Shaped Recovery)
Table 32. Global Compressed Air Energy Storage Market by Components, 2021-2031 (USD Mn, AGR (%), CAGR(%)) (U-Shaped Recovery)
Table 33. Global Compressed Air Energy Storage Market by Components, 2021-2031 (USD Mn, AGR (%), CAGR(%)) (L-Shaped Recovery)
Table 34. Global Compressed Air Energy Storage Market by Stage, 2021-2031 (USD Mn, AGR (%), CAGR(%))
Table 35. Global Compressed Air Energy Storage Market by Stage, 2021-2031 (USD Mn, AGR (%), CAGR(%)) (V-Shaped Recovery)
Table 36. Global Compressed Air Energy Storage Market by Stage, 2021-2031 (USD Mn, AGR (%), CAGR(%)) (W-Shaped Recovery)
Table 37. Global Compressed Air Energy Storage Market by Stage, 2021-2031 (USD Mn, AGR (%), CAGR(%)) (U-Shaped Recovery)
Table 38. Global Compressed Air Energy Storage Market by Stage, 2021-2031 (USD Mn, AGR (%), CAGR(%)) (L-Shaped Recovery)
Table 39. North America Compressed Air Energy Storage Market by Value, 2021-2031 (USD Mn, AGR (%), CAGR(%))
Table 40. North America Compressed Air Energy Storage Market by Value, 2021-2031 (USD Mn, AGR (%), CAGR(%)) (V-Shaped Recovery)
Table 41. North America Compressed Air Energy Storage Market by Value, 2021-2031 (USD Mn, AGR (%), CAGR(%)) (W-Shaped Recovery)
Table 42. North America Compressed Air Energy Storage Market by Value, 2021-2031 (USD Mn, AGR (%), CAGR(%)) (U-Shaped Recovery)
Table 43. North America Compressed Air Energy Storage Market by Value, 2021-2031 (USD Mn, AGR (%), CAGR(%)) (L-Shaped Recovery)
Table 44. North America Compressed Air Energy Storage Market by Country, 2021-2031 (USD Mn, AGR (%), CAGR(%))
Table 45. North America Compressed Air Energy Storage Market by Country, 2021-2031 (USD Mn, AGR (%), CAGR(%)) (V-Shaped Recovery)
Table 46. North America Compressed Air Energy Storage Market by Country, 2021-2031 (USD Mn, AGR (%), CAGR(%)) (W-Shaped Recovery)
Table 47. North America Compressed Air Energy Storage Market by Country, 2021-2031 (USD Mn, AGR (%), CAGR(%)) (U-Shaped Recovery)
Table 48. North America Compressed Air Energy Storage Market by Country, 2021-2031 (USD Mn, AGR (%), CAGR(%)) (L-Shaped Recovery)
Table 49. North America Compressed Air Energy Storage Market by Plant Location, 2021-2031 (USD Mn, AGR (%), CAGR(%))
Table 50. North America Compressed Air Energy Storage Market by Plant Location, 2021-2031 (USD Mn, AGR (%), CAGR(%)) (V-Shaped Recovery)
Table 51. North America Compressed Air Energy Storage Market by Plant Location, 2021-2031 (USD Mn, AGR (%), CAGR(%)) (W-Shaped Recovery)
Table 52. North America Compressed Air Energy Storage Market by Plant Location, 2021-2031 (USD Mn, AGR (%), CAGR(%)) (U-Shaped Recovery)
Table 53. North America Compressed Air Energy Storage Market by Plant Location, 2021-2031 (USD Mn, AGR (%), CAGR(%)) (L-Shaped Recovery)
Table 54. North America Compressed Air Energy Storage Market by Technology, 2021-2031 (USD Mn, AGR (%), CAGR(%))
Table 55. North America Compressed Air Energy Storage Market by Technology, 2021-2031 (USD Mn, AGR (%), CAGR(%)) (V-Shaped Recovery)
Table 56. North America Compressed Air Energy Storage Market by Technology, 2021-2031 (USD Mn, AGR (%), CAGR(%)) (W-Shaped Recovery)
Table 57. North America Compressed Air Energy Storage Market by Technology, 2021-2031 (USD Mn, AGR (%), CAGR(%)) (U-Shaped Recovery)
Table 58. North America Compressed Air Energy Storage Market by Technology, 2021-2031 (USD Mn, AGR (%), CAGR(%)) (L-Shaped Recovery)
Table 59. North America Compressed Air Energy Storage Markek by Type, 2021-2031 (USD Mn, AGR (%), CAGR(%))
Table 60. North America Compressed Air Energy Storage Markek by Type, 2021-2031 (USD Mn, AGR (%), CAGR(%)) (V-Shaped Recovery)
Table 61. North America Compressed Air Energy Storage Markek by Type, 2021-2031 (USD Mn, AGR (%), CAGR(%)) (W-Shaped Recovery)
Table 62. North America Compressed Air Energy Storage Markek by Type, 2021-2031 (USD Mn, AGR (%), CAGR(%)) (U-Shaped Recovery)
Table 63. North America Compressed Air Energy Storage Markek by Type, 2021-2031 (USD Mn, AGR (%), CAGR(%)) (L-Shaped Recovery)
Table 64. North America Compressed Air Energy Storage Market by Components, 2021-2031 (USD Mn, AGR (%), CAGR(%))
Table 65. North America Compressed Air Energy Storage Market by Components, 2021-2031 (USD Mn, AGR (%), CAGR(%)) (V-Shaped Recovery)
Table 66. North America Compressed Air Energy Storage Market by Components, 2021-2031 (USD Mn, AGR (%), CAGR(%)) (W-Shaped Recovery)
Table 67. North America Compressed Air Energy Storage Market by Components, 2021-2031 (USD Mn, AGR (%), CAGR(%)) (U-Shaped Recovery)
Table 68. North America Compressed Air Energy Storage Market by Components, 2021-2031 (USD Mn, AGR (%), CAGR(%)) (L-Shaped Recovery)
Table 69. North America Compressed Air Energy Storage Market by Stage, 2021-2031 (USD Mn, AGR (%), CAGR(%))
Table 70. North America Compressed Air Energy Storage Market by Stage, 2021-2031 (USD Mn, AGR (%), CAGR(%)) (V-Shaped Recovery)
Table 71. North America Compressed Air Energy Storage Market by Stage, 2021-2031 (USD Mn, AGR (%), CAGR(%)) (W-Shaped Recovery)
Table 72. North America Compressed Air Energy Storage Market by Stage, 2021-2031 (USD Mn, AGR (%), CAGR(%)) (U-Shaped Recovery)
Table 73. North America Compressed Air Energy Storage Market by Stage, 2021-2031 (USD Mn, AGR (%), CAGR(%)) (L-Shaped Recovery)
Table 74. US Compressed Air Energy Storage Market by Value, 2021-2031 (USD Mn, AGR (%), CAGR(%))
Table 75. US Compressed Air Energy Storage Market by Value, 2021-2031 (USD Mn, AGR (%), CAGR(%)) (V-Shaped Recovery)
Table 76. US Compressed Air Energy Storage Market by Value, 2021-2031 (USD Mn, AGR (%), CAGR(%)) (W-Shaped Recovery)
Table 77. US Compressed Air Energy Storage Market by Value, 2021-2031 (USD Mn, AGR (%), CAGR(%)) (U-Shaped Recovery)
Table 78. US Compressed Air Energy Storage Market by Value, 2021-2031 (USD Mn, AGR (%), CAGR(%)) (L-Shaped Recovery)
Table 79. Canada Compressed Air Energy Storage Market by Value, 2021-2031 (USD Mn, AGR (%), CAGR(%))
Table 80. Canada Compressed Air Energy Storage Market by Value, 2021-2031 (USD Mn, AGR (%), CAGR(%)) (V-Shaped Recovery)
Table 81. Canada Compressed Air Energy Storage Market by Value, 2021-2031 (USD Mn, AGR (%), CAGR(%)) (W-Shaped Recovery)
Table 82. Canada Compressed Air Energy Storage Market by Value, 2021-2031 (USD Mn, AGR (%), CAGR(%)) (U-Shaped Recovery)
Table 83. Canada Compressed Air Energy Storage Market by Value, 2021-2031 (USD Mn, AGR (%), CAGR(%)) (L-Shaped Recovery)
Table 84. Mexico Compressed Air Energy Storage Market by Value, 2021-2031 (USD Mn, AGR (%), CAGR(%))
Table 85. Mexico Compressed Air Energy Storage Market by Value, 2021-2031 (USD Mn, AGR (%), CAGR(%)) (V-Shaped Recovery)
Table 86. Mexico Compressed Air Energy Storage Market by Value, 2021-2031 (USD Mn, AGR (%), CAGR(%)) (W-Shaped Recovery)
Table 87. Mexico Compressed Air Energy Storage Market by Value, 2021-2031 (USD Mn, AGR (%), CAGR(%)) (U-Shaped Recovery)
Table 88. Mexico Compressed Air Energy Storage Market by Value, 2021-2031 (USD Mn, AGR (%), CAGR(%)) (L-Shaped Recovery)
Table 89. Europe Compressed Air Energy Storage Market by Value, 2021-2031 (USD Mn, AGR (%), CAGR(%))
Table 90. Europe Compressed Air Energy Storage Market by Value, 2021-2031 (USD Mn, AGR (%), CAGR(%)) (V-Shaped Recovery)
Table 91. Europe Compressed Air Energy Storage Market by Value, 2021-2031 (USD Mn, AGR (%), CAGR(%)) (W-Shaped Recovery)
Table 92. Europe Compressed Air Energy Storage Market by Value, 2021-2031 (USD Mn, AGR (%), CAGR(%)) (U-Shaped Recovery)
Table 93. Europe Compressed Air Energy Storage Market by Value, 2021-2031 (USD Mn, AGR (%), CAGR(%)) (L-Shaped Recovery)
Table 94. Europe Compressed Air Energy Storage Market by Country, 2021-2031 (USD Mn, AGR (%), CAGR(%))
Table 95. Europe Compressed Air Energy Storage Market by Country, 2021-2031 (USD Mn, AGR (%), CAGR(%)) (V-Shaped Recovery)
Table 96. Europe Compressed Air Energy Storage Market by Country, 2021-2031 (USD Mn, AGR (%), CAGR(%)) (W-Shaped Recovery)
Table 97. Europe Compressed Air Energy Storage Market by Country, 2021-2031 (USD Mn, AGR (%), CAGR(%)) (U-Shaped Recovery)
Table 98. Europe Compressed Air Energy Storage Market by Country, 2021-2031 (USD Mn, AGR (%), CAGR(%)) (L-Shaped Recovery)
Table 99. Europe Compressed Air Energy Storage Market by Plant Location, 2021-2031 (USD Mn, AGR (%), CAGR(%))
Table 100. Europe Compressed Air Energy Storage Market by Plant Location, 2021-2031 (USD Mn, AGR (%), CAGR(%)) (V-Shaped Recovery)
Table 101. Europe Compressed Air Energy Storage Market by Plant Location, 2021-2031 (USD Mn, AGR (%), CAGR(%)) (W-Shaped Recovery)
Table 102. Europe Compressed Air Energy Storage Market by Plant Location, 2021-2031 (USD Mn, AGR (%), CAGR(%)) (U-Shaped Recovery)
Table 103. Europe Compressed Air Energy Storage Market by Plant Location, 2021-2031 (USD Mn, AGR (%), CAGR(%)) (L-Shaped Recovery)
Table 104. Europe Compressed Air Energy Storage Market by Technology, 2021-2031 (USD Mn, AGR (%), CAGR(%))
Table 105. Europe Compressed Air Energy Storage Market by Technology, 2021-2031 (USD Mn, AGR (%), CAGR(%)) (V-Shaped Recovery)
Table 106. Europe Compressed Air Energy Storage Market by Technology, 2021-2031 (USD Mn, AGR (%), CAGR(%)) (W-Shaped Recovery)
Table 107. Europe Compressed Air Energy Storage Market by Technology, 2021-2031 (USD Mn, AGR (%), CAGR(%)) (U-Shaped Recovery)
Table 108. Europe Compressed Air Energy Storage Market by Technology, 2021-2031 (USD Mn, AGR (%), CAGR(%)) (L-Shaped Recovery)
Table 109. Europe Compressed Air Energy Storage Markek by Type, 2021-2031 (USD Mn, AGR (%), CAGR(%))
Table 110. Europe Compressed Air Energy Storage Markek by Type, 2021-2031 (USD Mn, AGR (%), CAGR(%)) (V-Shaped Recovery)
Table 111. Europe Compressed Air Energy Storage Markek by Type, 2021-2031 (USD Mn, AGR (%), CAGR(%)) (W-Shaped Recovery)
Table 112. Europe Compressed Air Energy Storage Markek by Type, 2021-2031 (USD Mn, AGR (%), CAGR(%)) (U-Shaped Recovery)
Table 113. Europe Compressed Air Energy Storage Markek by Type, 2021-2031 (USD Mn, AGR (%), CAGR(%)) (L-Shaped Recovery)
Table 114. Europe Compressed Air Energy Storage Market by Components, 2021-2031 (USD Mn, AGR (%), CAGR(%))
Table 115. Europe Compressed Air Energy Storage Market by Components, 2021-2031 (USD Mn, AGR (%), CAGR(%)) (V-Shaped Recovery)
Table 116. Europe Compressed Air Energy Storage Market by Components, 2021-2031 (USD Mn, AGR (%), CAGR(%)) (W-Shaped Recovery)
Table 117. Europe Compressed Air Energy Storage Market by Components, 2021-2031 (USD Mn, AGR (%), CAGR(%)) (U-Shaped Recovery)
Table 118. Europe Compressed Air Energy Storage Market by Components, 2021-2031 (USD Mn, AGR (%), CAGR(%)) (L-Shaped Recovery)
Table 119. Europe Compressed Air Energy Storage Market by Stage, 2021-2031 (USD Mn, AGR (%), CAGR(%))
Table 120. Europe Compressed Air Energy Storage Market by Stage, 2021-2031 (USD Mn, AGR (%), CAGR(%)) (V-Shaped Recovery)
Table 121. Europe Compressed Air Energy Storage Market by Stage, 2021-2031 (USD Mn, AGR (%), CAGR(%)) (W-Shaped Recovery)
Table 122. Europe Compressed Air Energy Storage Market by Stage, 2021-2031 (USD Mn, AGR (%), CAGR(%)) (U-Shaped Recovery)
Table 123. Europe Compressed Air Energy Storage Market by Stage, 2021-2031 (USD Mn, AGR (%), CAGR(%)) (L-Shaped Recovery)
Table 124. Germany Compressed Air Energy Storage Market by Value, 2021-2031 (USD Mn, AGR (%), CAGR(%))
Table 125. Germany Compressed Air Energy Storage Market by Value, 2021-2031 (USD Mn, AGR (%), CAGR(%)) (V-Shaped Recovery)
Table 126. Germany Compressed Air Energy Storage Market by Value, 2021-2031 (USD Mn, AGR (%), CAGR(%)) (W-Shaped Recovery)
Table 127. Germany Compressed Air Energy Storage Market by Value, 2021-2031 (USD Mn, AGR (%), CAGR(%)) (U-Shaped Recovery)
Table 128. Germany Compressed Air Energy Storage Market by Value, 2021-2031 (USD Mn, AGR (%), CAGR(%)) (L-Shaped Recovery)
Table 129. UK Compressed Air Energy Storage Market by Value, 2021-2031 (USD Mn, AGR (%), CAGR(%))
Table 130. UK Compressed Air Energy Storage Market by Value, 2021-2031 (USD Mn, AGR (%), CAGR(%)) (V-Shaped Recovery)
Table 131. UK Compressed Air Energy Storage Market by Value, 2021-2031 (USD Mn, AGR (%), CAGR(%)) (W-Shaped Recovery)
Table 132. UK Compressed Air Energy Storage Market by Value, 2021-2031 (USD Mn, AGR (%), CAGR(%)) (U-Shaped Recovery)
Table 133. UK Compressed Air Energy Storage Market by Value, 2021-2031 (USD Mn, AGR (%), CAGR(%)) (L-Shaped Recovery)
Table 134. France Compressed Air Energy Storage Market by Value, 2021-2031 (USD Mn, AGR (%), CAGR(%))
Table 135. France Compressed Air Energy Storage Market by Value, 2021-2031 (USD Mn, AGR (%), CAGR(%)) (V-Shaped Recovery)
Table 136. France Compressed Air Energy Storage Market by Value, 2021-2031 (USD Mn, AGR (%), CAGR(%)) (W-Shaped Recovery)
Table 137. France Compressed Air Energy Storage Market by Value, 2021-2031 (USD Mn, AGR (%), CAGR(%)) (U-Shaped Recovery)
Table 138. France Compressed Air Energy Storage Market by Value, 2021-2031 (USD Mn, AGR (%), CAGR(%)) (L-Shaped Recovery)
Table 139. Italy Compressed Air Energy Storage Market by Value, 2021-2031 (USD Mn, AGR (%), CAGR(%))
Table 140. Italy Compressed Air Energy Storage Market by Value, 2021-2031 (USD Mn, AGR (%), CAGR(%)) (V-Shaped Recovery)
Table 141. Italy Compressed Air Energy Storage Market by Value, 2021-2031 (USD Mn, AGR (%), CAGR(%)) (W-Shaped Recovery)
Table 142. Italy Compressed Air Energy Storage Market by Value, 2021-2031 (USD Mn, AGR (%), CAGR(%)) (U-Shaped Recovery)
Table 143. Italy Compressed Air Energy Storage Market by Value, 2021-2031 (USD Mn, AGR (%), CAGR(%)) (L-Shaped Recovery)
Table 144. Spain Compressed Air Energy Storage Market by Value, 2021-2031 (USD Mn, AGR (%), CAGR(%))
Table 145. Spain Compressed Air Energy Storage Market by Value, 2021-2031 (USD Mn, AGR (%), CAGR(%)) (V-Shaped Recovery)
Table 146. Spain Compressed Air Energy Storage Market by Value, 2021-2031 (USD Mn, AGR (%), CAGR(%)) (W-Shaped Recovery)
Table 147. Spain Compressed Air Energy Storage Market by Value, 2021-2031 (USD Mn, AGR (%), CAGR(%)) (U-Shaped Recovery)
Table 148. Spain Compressed Air Energy Storage Market by Value, 2021-2031 (USD Mn, AGR (%), CAGR(%)) (L-Shaped Recovery)
Table 149. Rest of Europe Compressed Air Energy Storage Market by Value, 2021-2031 (USD Mn, AGR (%), CAGR(%))
Table 150. Rest of Europe Compressed Air Energy Storage Market by Value, 2021-2031 (USD Mn, AGR (%), CAGR(%)) (V-Shaped Recovery)
Table 151. Rest of Europe Compressed Air Energy Storage Market by Value, 2021-2031 (USD Mn, AGR (%), CAGR(%)) (W-Shaped Recovery)
Table 152. Rest of Europe Compressed Air Energy Storage Market by Value, 2021-2031 (USD Mn, AGR (%), CAGR(%)) (U-Shaped Recovery)
Table 153. Rest of Europe Compressed Air Energy Storage Market by Value, 2021-2031 (USD Mn, AGR (%), CAGR(%)) (L-Shaped Recovery)
Table 154. Asia-Pacific Compressed Air Energy Storage Market by Value, 2021-2031 (USD Mn, AGR (%), CAGR(%))
Table 155. Asia-Pacific Compressed Air Energy Storage Market by Value, 2021-2031 (USD Mn, AGR (%), CAGR(%)) (V-Shaped Recovery)
Table 156. Asia-Pacific Compressed Air Energy Storage Market by Value, 2021-2031 (USD Mn, AGR (%), CAGR(%)) (W-Shaped Recovery)
Table 157. Asia-Pacific Compressed Air Energy Storage Market by Value, 2021-2031 (USD Mn, AGR (%), CAGR(%)) (U-Shaped Recovery)
Table 158. Asia-Pacific Compressed Air Energy Storage Market by Value, 2021-2031 (USD Mn, AGR (%), CAGR(%)) (L-Shaped Recovery)
Table 159. Asia-Pacific Compressed Air Energy Storage Market by Country, 2021-2031 (USD Mn, AGR (%), CAGR(%))
Table 160. Asia-Pacific Compressed Air Energy Storage Market by Country, 2021-2031 (USD Mn, AGR (%), CAGR(%)) (V-Shaped Recovery)
Table 161. Asia-Pacific Compressed Air Energy Storage Market by Country, 2021-2031 (USD Mn, AGR (%), CAGR(%)) (W-Shaped Recovery)
Table 162. Asia-Pacific Compressed Air Energy Storage Market by Country, 2021-2031 (USD Mn, AGR (%), CAGR(%)) (U-Shaped Recovery)
Table 163. Asia-Pacific Compressed Air Energy Storage Market by Country, 2021-2031 (USD Mn, AGR (%), CAGR(%)) (L-Shaped Recovery)
Table 164. Asia-Pacific Compressed Air Energy Storage Market by Plant Location, 2021-2031 (USD Mn, AGR (%), CAGR(%))
Table 165. Asia-Pacific Compressed Air Energy Storage Market by Plant Location, 2021-2031 (USD Mn, AGR (%), CAGR(%)) (V-Shaped Recovery)
Table 166. Asia-Pacific Compressed Air Energy Storage Market by Plant Location, 2021-2031 (USD Mn, AGR (%), CAGR(%)) (W-Shaped Recovery)
Table 167. Asia-Pacific Compressed Air Energy Storage Market by Plant Location, 2021-2031 (USD Mn, AGR (%), CAGR(%)) (U-Shaped Recovery)
Table 168. Asia-Pacific Compressed Air Energy Storage Market by Plant Location, 2021-2031 (USD Mn, AGR (%), CAGR(%)) (L-Shaped Recovery)
Table 169. Asia-Pacific Compressed Air Energy Storage Market by Technology, 2021-2031 (USD Mn, AGR (%), CAGR(%))
Table 170. Asia-Pacific Compressed Air Energy Storage Market by Technology, 2021-2031 (USD Mn, AGR (%), CAGR(%)) (V-Shaped Recovery)
Table 171. Asia-Pacific Compressed Air Energy Storage Market by Technology, 2021-2031 (USD Mn, AGR (%), CAGR(%)) (W-Shaped Recovery)
Table 172. Asia-Pacific Compressed Air Energy Storage Market by Technology, 2021-2031 (USD Mn, AGR (%), CAGR(%)) (U-Shaped Recovery)
Table 173. Asia-Pacific Compressed Air Energy Storage Market by Technology, 2021-2031 (USD Mn, AGR (%), CAGR(%)) (L-Shaped Recovery)
Table 174. Asia-Pacific Compressed Air Energy Storage Markek by Type, 2021-2031 (USD Mn, AGR (%), CAGR(%))
Table 175. Asia-Pacific Compressed Air Energy Storage Markek by Type, 2021-2031 (USD Mn, AGR (%), CAGR(%)) (V-Shaped Recovery)
Table 176. Asia-Pacific Compressed Air Energy Storage Markek by Type, 2021-2031 (USD Mn, AGR (%), CAGR(%)) (W-Shaped Recovery)
Table 177. Asia-Pacific Compressed Air Energy Storage Markek by Type, 2021-2031 (USD Mn, AGR (%), CAGR(%)) (U-Shaped Recovery)
Table 178. Asia-Pacific Compressed Air Energy Storage Markek by Type, 2021-2031 (USD Mn, AGR (%), CAGR(%)) (L-Shaped Recovery)
Table 179. Asia-Pacific Compressed Air Energy Storage Market by Components, 2021-2031 (USD Mn, AGR (%), CAGR(%))
Table 180. Asia-Pacific Compressed Air Energy Storage Market by Components, 2021-2031 (USD Mn, AGR (%), CAGR(%)) (V-Shaped Recovery)
Table 181. Asia-Pacific Compressed Air Energy Storage Market by Components, 2021-2031 (USD Mn, AGR (%), CAGR(%)) (W-Shaped Recovery)
Table 182. Asia-Pacific Compressed Air Energy Storage Market by Components, 2021-2031 (USD Mn, AGR (%), CAGR(%)) (U-Shaped Recovery)
Table 183. Asia-Pacific Compressed Air Energy Storage Market by Components, 2021-2031 (USD Mn, AGR (%), CAGR(%)) (L-Shaped Recovery)
Table 184. Asia-Pacific Compressed Air Energy Storage Market by Stage, 2021-2031 (USD Mn, AGR (%), CAGR(%))
Table 185. Asia-Pacific Compressed Air Energy Storage Market by Stage, 2021-2031 (USD Mn, AGR (%), CAGR(%)) (V-Shaped Recovery)
Table 186. Asia-Pacific Compressed Air Energy Storage Market by Stage, 2021-2031 (USD Mn, AGR (%), CAGR(%)) (W-Shaped Recovery)
Table 187. Asia-Pacific Compressed Air Energy Storage Market by Stage, 2021-2031 (USD Mn, AGR (%), CAGR(%)) (U-Shaped Recovery)
Table 188. Asia-Pacific Compressed Air Energy Storage Market by Stage, 2021-2031 (USD Mn, AGR (%), CAGR(%)) (L-Shaped Recovery)
Table 189. China Compressed Air Energy Storage Market by Value, 2021-2031 (USD Mn, AGR (%), CAGR(%))
Table 190. China Compressed Air Energy Storage Market by Value, 2021-2031 (USD Mn, AGR (%), CAGR(%)) (V-Shaped Recovery)
Table 191. China Compressed Air Energy Storage Market by Value, 2021-2031 (USD Mn, AGR (%), CAGR(%)) (W-Shaped Recovery)
Table 192. China Compressed Air Energy Storage Market by Value, 2021-2031 (USD Mn, AGR (%), CAGR(%)) (U-Shaped Recovery)
Table 193. China Compressed Air Energy Storage Market by Value, 2021-2031 (USD Mn, AGR (%), CAGR(%)) (L-Shaped Recovery)
Table 194. India Compressed Air Energy Storage Market by Value, 2021-2031 (USD Mn, AGR (%), CAGR(%))
Table 195. India Compressed Air Energy Storage Market by Value, 2021-2031 (USD Mn, AGR (%), CAGR(%)) (V-Shaped Recovery)
Table 196. India Compressed Air Energy Storage Market by Value, 2021-2031 (USD Mn, AGR (%), CAGR(%)) (W-Shaped Recovery)
Table 197. India Compressed Air Energy Storage Market by Value, 2021-2031 (USD Mn, AGR (%), CAGR(%)) (U-Shaped Recovery)
Table 198. India Compressed Air Energy Storage Market by Value, 2021-2031 (USD Mn, AGR (%), CAGR(%)) (L-Shaped Recovery)
Table 199. Japan Compressed Air Energy Storage Market by Value, 2021-2031 (USD Mn, AGR (%), CAGR(%))
Table 200. Japan Compressed Air Energy Storage Market by Value, 2021-2031 (USD Mn, AGR (%), CAGR(%)) (V-Shaped Recovery)
Table 201. Japan Compressed Air Energy Storage Market by Value, 2021-2031 (USD Mn, AGR (%), CAGR(%)) (W-Shaped Recovery)
Table 202. Japan Compressed Air Energy Storage Market by Value, 2021-2031 (USD Mn, AGR (%), CAGR(%)) (U-Shaped Recovery)
Table 203. Japan Compressed Air Energy Storage Market by Value, 2021-2031 (USD Mn, AGR (%), CAGR(%)) (L-Shaped Recovery)
Table 204. South Korea Compressed Air Energy Storage Market by Value, 2021-2031 (USD Mn, AGR (%), CAGR(%))
Table 205. South Korea Compressed Air Energy Storage Market by Value, 2021-2031 (USD Mn, AGR (%), CAGR(%)) (V-Shaped Recovery)
Table 206. South Korea Compressed Air Energy Storage Market by Value, 2021-2031 (USD Mn, AGR (%), CAGR(%)) (W-Shaped Recovery)
Table 207. South Korea Compressed Air Energy Storage Market by Value, 2021-2031 (USD Mn, AGR (%), CAGR(%)) (U-Shaped Recovery)
Table 208. South Korea Compressed Air Energy Storage Market by Value, 2021-2031 (USD Mn, AGR (%), CAGR(%)) (L-Shaped Recovery)
Table 209. Australia Compressed Air Energy Storage Market by Value, 2021-2031 (USD Mn, AGR (%), CAGR(%))
Table 210. Australia Compressed Air Energy Storage Market by Value, 2021-2031 (USD Mn, AGR (%), CAGR(%)) (V-Shaped Recovery)
Table 211. Australia Compressed Air Energy Storage Market by Value, 2021-2031 (USD Mn, AGR (%), CAGR(%)) (W-Shaped Recovery)
Table 212. Australia Compressed Air Energy Storage Market by Value, 2021-2031 (USD Mn, AGR (%), CAGR(%)) (U-Shaped Recovery)
Table 213. Australia Compressed Air Energy Storage Market by Value, 2021-2031 (USD Mn, AGR (%), CAGR(%)) (L-Shaped Recovery)
Table 214. Rest of Asia-Pacific Compressed Air Energy Storage Market by Value, 2021-2031 (USD Mn, AGR (%), CAGR(%))
Table 215. Rest of Asia-Pacific Compressed Air Energy Storage Market by Value, 2021-2031 (USD Mn, AGR (%), CAGR(%)) (V-Shaped Recovery)
Table 216. Rest of Asia-Pacific Compressed Air Energy Storage Market by Value, 2021-2031 (USD Mn, AGR (%), CAGR(%)) (W-Shaped Recovery)
Table 217. Rest of Asia-Pacific Compressed Air Energy Storage Market by Value, 2021-2031 (USD Mn, AGR (%), CAGR(%)) (U-Shaped Recovery)
Table 218. Rest of Asia-Pacific Compressed Air Energy Storage Market by Value, 2021-2031 (USD Mn, AGR (%), CAGR(%)) (L-Shaped Recovery)
Table 219. LAMEA Compressed Air Energy Storage Market by Value, 2021-2031 (USD Mn, AGR (%), CAGR(%))
Table 220. LAMEA Compressed Air Energy Storage Market by Value, 2021-2031 (USD Mn, AGR (%), CAGR(%)) (V-Shaped Recovery)
Table 221. LAMEA Compressed Air Energy Storage Market by Value, 2021-2031 (USD Mn, AGR (%), CAGR(%)) (W-Shaped Recovery)
Table 222. LAMEA Compressed Air Energy Storage Market by Value, 2021-2031 (USD Mn, AGR (%), CAGR(%)) (U-Shaped Recovery)
Table 223. LAMEA Compressed Air Energy Storage Market by Value, 2021-2031 (USD Mn, AGR (%), CAGR(%)) (L-Shaped Recovery)
Table 224. LAMEA Compressed Air Energy Storage Market by Country, 2021-2031 (USD Mn, AGR (%), CAGR(%))
Table 225. LAMEA Compressed Air Energy Storage Market by Country, 2021-2031 (USD Mn, AGR (%), CAGR(%)) (V-Shaped Recovery)
Table 226. LAMEA Compressed Air Energy Storage Market by Country, 2021-2031 (USD Mn, AGR (%), CAGR(%)) (W-Shaped Recovery)
Table 227. LAMEA Compressed Air Energy Storage Market by Country, 2021-2031 (USD Mn, AGR (%), CAGR(%)) (U-Shaped Recovery)
Table 228. LAMEA Compressed Air Energy Storage Market by Country, 2021-2031 (USD Mn, AGR (%), CAGR(%)) (L-Shaped Recovery)
Table 229. LAMEA Compressed Air Energy Storage Market by Plant Location, 2021-2031 (USD Mn, AGR (%), CAGR(%))
Table 230. LAMEA Compressed Air Energy Storage Market by Plant Location, 2021-2031 (USD Mn, AGR (%), CAGR(%)) (V-Shaped Recovery)
Table 231. LAMEA Compressed Air Energy Storage Market by Plant Location, 2021-2031 (USD Mn, AGR (%), CAGR(%)) (W-Shaped Recovery)
Table 232. LAMEA Compressed Air Energy Storage Market by Plant Location, 2021-2031 (USD Mn, AGR (%), CAGR(%)) (U-Shaped Recovery)
Table 233. LAMEA Compressed Air Energy Storage Market by Plant Location, 2021-2031 (USD Mn, AGR (%), CAGR(%)) (L-Shaped Recovery)
Table 234. LAMEA Compressed Air Energy Storage Market by Technology, 2021-2031 (USD Mn, AGR (%), CAGR(%))
Table 235. LAMEA Compressed Air Energy Storage Market by Technology, 2021-2031 (USD Mn, AGR (%), CAGR(%)) (V-Shaped Recovery)
Table 236. LAMEA Compressed Air Energy Storage Market by Technology, 2021-2031 (USD Mn, AGR (%), CAGR(%)) (W-Shaped Recovery)
Table 237. LAMEA Compressed Air Energy Storage Market by Technology, 2021-2031 (USD Mn, AGR (%), CAGR(%)) (U-Shaped Recovery)
Table 238. LAMEA Compressed Air Energy Storage Market by Technology, 2021-2031 (USD Mn, AGR (%), CAGR(%)) (L-Shaped Recovery)
Table 239. LAMEA Compressed Air Energy Storage Markek by Type, 2021-2031 (USD Mn, AGR (%), CAGR(%))
Table 240. LAMEA Compressed Air Energy Storage Markek by Type, 2021-2031 (USD Mn, AGR (%), CAGR(%)) (V-Shaped Recovery)
Table 241. LAMEA Compressed Air Energy Storage Markek by Type, 2021-2031 (USD Mn, AGR (%), CAGR(%)) (W-Shaped Recovery)
Table 242. LAMEA Compressed Air Energy Storage Markek by Type, 2021-2031 (USD Mn, AGR (%), CAGR(%)) (U-Shaped Recovery)
Table 243. LAMEA Compressed Air Energy Storage Markek by Type, 2021-2031 (USD Mn, AGR (%), CAGR(%)) (L-Shaped Recovery)
Table 244. LAMEA Compressed Air Energy Storage Market by Components, 2021-2031 (USD Mn, AGR (%), CAGR(%))
Table 245. LAMEA Compressed Air Energy Storage Market by Components, 2021-2031 (USD Mn, AGR (%), CAGR(%)) (V-Shaped Recovery)
Table 246. LAMEA Compressed Air Energy Storage Market by Components, 2021-2031 (USD Mn, AGR (%), CAGR(%)) (W-Shaped Recovery)
Table 247. LAMEA Compressed Air Energy Storage Market by Components, 2021-2031 (USD Mn, AGR (%), CAGR(%)) (U-Shaped Recovery)
Table 248. LAMEA Compressed Air Energy Storage Market by Components, 2021-2031 (USD Mn, AGR (%), CAGR(%)) (L-Shaped Recovery)
Table 249. LAMEA Compressed Air Energy Storage Market by Stage, 2021-2031 (USD Mn, AGR (%), CAGR(%))
Table 250. LAMEA Compressed Air Energy Storage Market by Stage, 2021-2031 (USD Mn, AGR (%), CAGR(%)) (V-Shaped Recovery)
Table 251. LAMEA Compressed Air Energy Storage Market by Stage, 2021-2031 (USD Mn, AGR (%), CAGR(%)) (W-Shaped Recovery)
Table 252. LAMEA Compressed Air Energy Storage Market by Stage, 2021-2031 (USD Mn, AGR (%), CAGR(%)) (U-Shaped Recovery)
Table 253. LAMEA Compressed Air Energy Storage Market by Stage, 2021-2031 (USD Mn, AGR (%), CAGR(%)) (L-Shaped Recovery)
Table 254. Brazil Compressed Air Energy Storage Market by Value, 2021-2031 (USD Mn, AGR (%), CAGR(%))
Table 255. Brazil Compressed Air Energy Storage Market by Value, 2021-2031 (USD Mn, AGR (%), CAGR(%)) (V-Shaped Recovery)
Table 256. Brazil Compressed Air Energy Storage Market by Value, 2021-2031 (USD Mn, AGR (%), CAGR(%)) (W-Shaped Recovery)
Table 257. Brazil Compressed Air Energy Storage Market by Value, 2021-2031 (USD Mn, AGR (%), CAGR(%)) (U-Shaped Recovery)
Table 258. Brazil Compressed Air Energy Storage Market by Value, 2021-2031 (USD Mn, AGR (%), CAGR(%)) (L-Shaped Recovery)
Table 259. South Africa Compressed Air Energy Storage Market by Value, 2021-2031 (USD Mn, AGR (%), CAGR(%))
Table 260. South Africa Compressed Air Energy Storage Market by Value, 2021-2031 (USD Mn, AGR (%), CAGR(%)) (V-Shaped Recovery)
Table 261. South Africa Compressed Air Energy Storage Market by Value, 2021-2031 (USD Mn, AGR (%), CAGR(%)) (W-Shaped Recovery)
Table 262. South Africa Compressed Air Energy Storage Market by Value, 2021-2031 (USD Mn, AGR (%), CAGR(%)) (U-Shaped Recovery)
Table 263. South Africa Compressed Air Energy Storage Market by Value, 2021-2031 (USD Mn, AGR (%), CAGR(%)) (L-Shaped Recovery)
Table 264. Saudi Arabia Compressed Air Energy Storage Market by Value, 2021-2031 (USD Mn, AGR (%), CAGR(%))
Table 265. Saudi Arabia Compressed Air Energy Storage Market by Value, 2021-2031 (USD Mn, AGR (%), CAGR(%)) (V-Shaped Recovery)
Table 266. Saudi Arabia Compressed Air Energy Storage Market by Value, 2021-2031 (USD Mn, AGR (%), CAGR(%)) (W-Shaped Recovery)
Table 267. Saudi Arabia Compressed Air Energy Storage Market by Value, 2021-2031 (USD Mn, AGR (%), CAGR(%)) (U-Shaped Recovery)
Table 268. Saudi Arabia Compressed Air Energy Storage Market by Value, 2021-2031 (USD Mn, AGR (%), CAGR(%)) (L-Shaped Recovery)
Table 269. Turkey Compressed Air Energy Storage Market by Value, 2021-2031 (USD Mn, AGR (%), CAGR(%))
Table 270. Turkey Compressed Air Energy Storage Market by Value, 2021-2031 (USD Mn, AGR (%), CAGR(%)) (V-Shaped Recovery)
Table 271. Turkey Compressed Air Energy Storage Market by Value, 2021-2031 (USD Mn, AGR (%), CAGR(%)) (W-Shaped Recovery)
Table 272. Turkey Compressed Air Energy Storage Market by Value, 2021-2031 (USD Mn, AGR (%), CAGR(%)) (U-Shaped Recovery)
Table 273. Turkey Compressed Air Energy Storage Market by Value, 2021-2031 (USD Mn, AGR (%), CAGR(%)) (L-Shaped Recovery)
Table 274. UAE Compressed Air Energy Storage Market by Value, 2021-2031 (USD Mn, AGR (%), CAGR(%))
Table 275. UAE Compressed Air Energy Storage Market by Value, 2021-2031 (USD Mn, AGR (%), CAGR(%)) (V-Shaped Recovery)
Table 276. UAE Compressed Air Energy Storage Market by Value, 2021-2031 (USD Mn, AGR (%), CAGR(%)) (W-Shaped Recovery)
Table 277. UAE Compressed Air Energy Storage Market by Value, 2021-2031 (USD Mn, AGR (%), CAGR(%)) (U-Shaped Recovery)
Table 278. UAE Compressed Air Energy Storage Market by Value, 2021-2031 (USD Mn, AGR (%), CAGR(%)) (L-Shaped Recovery)
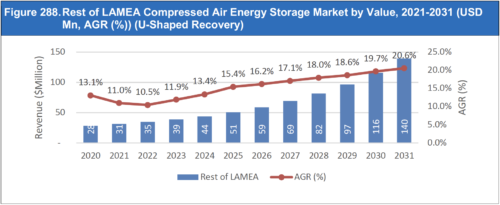
Table 279. Rest of LAMEA Compressed Air Energy Storage Market by Value, 2021-2031 (USD Mn, AGR (%), CAGR(%))
Table 280. Rest of LAMEA Compressed Air Energy Storage Market by Value, 2021-2031 (USD Mn, AGR (%), CAGR(%)) (V-Shaped Recovery)
Table 281. Rest of LAMEA Compressed Air Energy Storage Market by Value, 2021-2031 (USD Mn, AGR (%), CAGR(%)) (W-Shaped Recovery)
Table 282. Rest of LAMEA Compressed Air Energy Storage Market by Value, 2021-2031 (USD Mn, AGR (%), CAGR(%)) (U-Shaped Recovery)
Table 283. Rest of LAMEA Compressed Air Energy Storage Market by Value, 2021-2031 (USD Mn, AGR (%), CAGR(%)) (L-Shaped Recovery)
Table 284. Siemens AG: Company Information
Table 285. Siemens AG: Company Revenue 2016-2020 (US$Mn, AGR %)
Table 286. Siemens AG: Company Product and Service Benchmarking
Table 287. Siemens AG: Company Recent Developments till Feb,2021
Table 288. Pacific Gas and Electric Company: Company Information
Table 289. Pacific Gas and Electric Company: Company Revenue 2016-2020 (US$Mn, AGR %)
Table 290. Pacific Gas and Electric Company: Company Product and Service Benchmarking
Table 291. GE Energy: Company Information
Table 292. GE Energy: Company Revenue 2016-2020 (US$Mn, AGR %)
Table 293. GE Energy: Company Product and Service Benchmarking
Table 294. GE Energy: Company Recent Developments till Feb,2021
Table 295. MAN SE: Company Information
Table 296. MAN SE: Company Revenue 2016-2020 (US$Mn, AGR %)
Table 297. MAN SE: Company Product and Service Benchmarking
Table 298. MAN SE: Company Recent Developments till Feb,2021
Table 299. Hydrostor Inc.: Company Information
Table 300. Hydrostor Inc.: Company Product and Service Benchmarking
Table 301. Hydrostor Inc.: Company Recent Developments till Feb,2021
Table 302. Magnum Development LLC: Company Information
Table 303. Magnum Development LLC: Company Product and Service Benchmarking
Table 304. Magnum Development LLC: Company Recent Developments till Feb,2021
Table 305. NG Advantage: Company Information
Table 306. NG Advantage: Company Product and Service Benchmarking
Table 307. NG Advantage: Company Recent Developments till Feb,2021
Table 308. AES Energy Storage LLC: Company Information
Table 309. AES Energy Storage LLC: Company Product and Service Benchmarking
Table 310. AES Energy Storage LLC: Company Recent Developments till Feb,2021
Table 311. Alstom Power, Inc.: Company Information
Table 312. Alstom Power, Inc.: Company Revenue 2017-2021 (US$Mn, AGR %)
Table 313. ALACAES: Company Information
Table 314. ALACAES: Company Product and Service Benchmarking
Table 315. General Compression: Company Information
Table 316. General Compression: Company Product and Service Benchmarking
Table 317. Apex CAES: Company Information
Table 318. Apex CAES: Company Product and Service Benchmarking
Table 319. Storelectric Ltd., : Company Information
Table 320. Storelectric Ltd., : Company Product and Service Benchmarking
Table 321. Solar Turbines, Inc.: Company Information
Table 322. Solar Turbines, Inc.: Company Product and Service Benchmarking
Table 323. Babcock Power : Company Information
Table 324. Babcock Power : Company Product and Service Benchmarking
List of Figures
Figure 1. Global Compressed Air Energy Storage Market Forecast, 2021-2031 (USD Mn, AGR (%))
Figure 2. Global Compressed Air Energy Storage Market Segmentation
Figure 3. Global Compressed Air Energy Storage Market Trends :
Figure 4. Global Compressed Air Energy Storage Market Forecast, 2021-2031 (USD Mn, AGR (%))
Figure 5. Global Compressed Air Energy Storage Market Forecast, 2021-2031 (USD Mn, AGR (%)) (V-Shaped Recovery)
Figure 6. Global Compressed Air Energy Storage Market Forecast, 2021-2031 (USD Mn, AGR (%)) (W-Shaped Recovery)
Figure 7. Global Compressed Air Energy Storage Market Forecast, 2021-2031 (USD Mn, AGR (%)) (U-Shaped Recovery)
Figure 8. Global Compressed Air Energy Storage Market Forecast, 2021-2031 (USD Mn, AGR (%)) (L-Shaped Recovery)
Figure 9. Global Compressed Air Energy Storage Market Share Forecast by Region 2021, 2026, 2031 (%)
Figure 10. Global Compressed Air Energy Storage Market by Region, 2021-2031 (USD Mn, AGR (%))
Figure 11. Global Compressed Air Energy Storage Market by Region, 2021-2031 (USD Mn, AGR (%)) (V-Shaped Recovery)
Figure 12. Global Compressed Air Energy Storage Market by Region, 2021-2031 (USD Mn, AGR (%)) (W-Shaped Recovery)
Figure 13. Global Compressed Air Energy Storage Market by Region, 2021-2031 (USD Mn, AGR (%)) (U-Shaped Recovery)
Figure 14. Global Compressed Air Energy Storage Market by Region, 2021-2031 (USD Mn, AGR (%)) (L-Shaped Recovery)
Figure 15. Global Compressed Air Energy Storage Market Share Forecast by Plant Location 2021, 2026, 2031 (%)
Figure 16. Global Compressed Air Energy Storage Market by Plant Location, 2021-2031 (USD Mn, AGR (%))
Figure 17. Global Compressed Air Energy Storage Market by Plant Location, 2021-2031 (USD Mn, AGR (%)) (V-Shaped Recovery)
Figure 18. Global Compressed Air Energy Storage Market by Plant Location, 2021-2031 (USD Mn, AGR (%)) (W-Shaped Recovery)
Figure 19. Global Compressed Air Energy Storage Market by Plant Location, 2021-2031 (USD Mn, AGR (%)) (U-Shaped Recovery)
Figure 20. Global Compressed Air Energy Storage Market by Plant Location, 2021-2031 (USD Mn, AGR (%)) (L-Shaped Recovery)
Figure 21. Global Compressed Air Energy Storage Market Share Forecast by Technology 2021, 2026, 2031 (%)
Figure 22. Global Compressed Air Energy Storage Market by Technology, 2021-2031 (USD Mn, AGR (%))
Figure 23. Global Compressed Air Energy Storage Market by Technology, 2021-2031 (USD Mn, AGR (%)) (V-Shaped Recovery)
Figure 24. Global Compressed Air Energy Storage Market by Technology, 2021-2031 (USD Mn, AGR (%)) (W-Shaped Recovery)
Figure 25. Global Compressed Air Energy Storage Market by Technology, 2021-2031 (USD Mn, AGR (%)) (U-Shaped Recovery)
Figure 26. Global Compressed Air Energy Storage Market by Technology, 2021-2031 (USD Mn, AGR (%)) (L-Shaped Recovery)
Figure 27. Global Compressed Air Energy Storage Market Share Forecast by Type 2021, 2026, 2031 (%)
Figure 28. Global Compressed Air Energy Storage Markek by Type, 2021-2031 (USD Mn, AGR (%))
Figure 29. Global Compressed Air Energy Storage Markek by Type, 2021-2031 (USD Mn, AGR (%)) (V-Shaped Recovery)
Figure 30. Global Compressed Air Energy Storage Markek by Type, 2021-2031 (USD Mn, AGR (%)) (W-Shaped Recovery)
Figure 31. Global Compressed Air Energy Storage Markek by Type, 2021-2031 (USD Mn, AGR (%)) (U-Shaped Recovery)
Figure 32. Global Compressed Air Energy Storage Markek by Type, 2021-2031 (USD Mn, AGR (%)) (L-Shaped Recovery)
Figure 33. Global Compressed Air Energy Storage Market Share Forecast by Components 2021, 2026, 2031 (%)
Figure 34. Global Compressed Air Energy Storage Market by Components, 2021-2031 (USD Mn, AGR (%))
Figure 35. Global Compressed Air Energy Storage Market by Components, 2021-2031 (USD Mn, AGR (%)) (V-Shaped Recovery)
Figure 36. Global Compressed Air Energy Storage Market by Components, 2021-2031 (USD Mn, AGR (%)) (W-Shaped Recovery)
Figure 37. Global Compressed Air Energy Storage Market by Components, 2021-2031 (USD Mn, AGR (%)) (U-Shaped Recovery)
Figure 38. Global Compressed Air Energy Storage Market by Components, 2021-2031 (USD Mn, AGR (%)) (L-Shaped Recovery)
Figure 39. Global Compressed Air Energy Storage Market Share Forecast by Stage 2021, 2026, 2031 (%)
Figure 40. Global Compressed Air Energy Storage Market by Stage, 2021-2031 (USD Mn, AGR (%))
Figure 41. Global Compressed Air Energy Storage Market by Stage, 2021-2031 (USD Mn, AGR (%)) (V-Shaped Recovery)
Figure 42. Global Compressed Air Energy Storage Market by Stage, 2021-2031 (USD Mn, AGR (%)) (W-Shaped Recovery)
Figure 43. Global Compressed Air Energy Storage Market by Stage, 2021-2031 (USD Mn, AGR (%)) (U-Shaped Recovery)
Figure 44. Global Compressed Air Energy Storage Market by Stage, 2021-2031 (USD Mn, AGR (%)) (L-Shaped Recovery)
Figure 45. North America Compressed Air Energy Storage Market by Value, 2021-2031 (USD Mn, AGR (%))
Figure 46. North America Compressed Air Energy Storage Market by Value, 2021-2031 (USD Mn, AGR (%)) (V-Shaped Recovery)
Figure 47. North America Compressed Air Energy Storage Market by Value, 2021-2031 (USD Mn, AGR (%)) (W-Shaped Recovery)
Figure 48. North America Compressed Air Energy Storage Market by Value, 2021-2031 (USD Mn, AGR (%)) (U-Shaped Recovery)
Figure 49. North America Compressed Air Energy Storage Market by Value, 2021-2031 (USD Mn, AGR (%)) (L-Shaped Recovery)
Figure 50. North America Compressed Air Energy Storage Market by Country, 2021-2031 (USD Mn, AGR (%))
Figure 51. North America Compressed Air Energy Storage Market by Country, 2021-2031 (USD Mn, AGR (%)) (V-Shaped Recovery)
Figure 52. North America Compressed Air Energy Storage Market by Country, 2021-2031 (USD Mn, AGR (%)) (W-Shaped Recovery)
Figure 53. North America Compressed Air Energy Storage Market by Country, 2021-2031 (USD Mn, AGR (%)) (U-Shaped Recovery)
Figure 54. North America Compressed Air Energy Storage Market by Country, 2021-2031 (USD Mn, AGR (%)) (L-Shaped Recovery)
Figure 55. North America Compressed Air Energy Storage Market by Plant Location, 2021-2031 (USD Mn, AGR (%))
Figure 56. North America Compressed Air Energy Storage Market by Plant Location, 2021-2031 (USD Mn, AGR (%)) (V-Shaped Recovery)
Figure 57. North America Compressed Air Energy Storage Market by Plant Location, 2021-2031 (USD Mn, AGR (%)) (W-Shaped Recovery)
Figure 58. North America Compressed Air Energy Storage Market by Plant Location, 2021-2031 (USD Mn, AGR (%)) (U-Shaped Recovery)
Figure 59. North America Compressed Air Energy Storage Market by Plant Location, 2021-2031 (USD Mn, AGR (%)) (L-Shaped Recovery)
Figure 60. North America Compressed Air Energy Storage Market by Technology, 2021-2031 (USD Mn, AGR (%))
Figure 61. North America Compressed Air Energy Storage Market by Technology, 2021-2031 (USD Mn, AGR (%)) (V-Shaped Recovery)
Figure 62. North America Compressed Air Energy Storage Market by Technology, 2021-2031 (USD Mn, AGR (%)) (W-Shaped Recovery)
Figure 63. North America Compressed Air Energy Storage Market by Technology, 2021-2031 (USD Mn, AGR (%)) (U-Shaped Recovery)
Figure 64. North America Compressed Air Energy Storage Market by Technology, 2021-2031 (USD Mn, AGR (%)) (L-Shaped Recovery)
Figure 65. North America Compressed Air Energy Storage Markek by Type, 2021-2031 (USD Mn, AGR (%))
Figure 66. North America Compressed Air Energy Storage Markek by Type, 2021-2031 (USD Mn, AGR (%)) (V-Shaped Recovery)
Figure 67. North America Compressed Air Energy Storage Markek by Type, 2021-2031 (USD Mn, AGR (%)) (W-Shaped Recovery)
Figure 68. North America Compressed Air Energy Storage Markek by Type, 2021-2031 (USD Mn, AGR (%)) (U-Shaped Recovery)
Figure 69. North America Compressed Air Energy Storage Markek by Type, 2021-2031 (USD Mn, AGR (%)) (L-Shaped Recovery)
Figure 70. North America Compressed Air Energy Storage Market by Components, 2021-2031 (USD Mn, AGR (%))
Figure 71. North America Compressed Air Energy Storage Market by Components, 2021-2031 (USD Mn, AGR (%)) (V-Shaped Recovery)
Figure 72. North America Compressed Air Energy Storage Market by Components, 2021-2031 (USD Mn, AGR (%)) (W-Shaped Recovery)
Figure 73. North America Compressed Air Energy Storage Market by Components, 2021-2031 (USD Mn, AGR (%)) (U-Shaped Recovery)
Figure 74. North America Compressed Air Energy Storage Market by Components, 2021-2031 (USD Mn, AGR (%)) (L-Shaped Recovery)
Figure 75. North America Compressed Air Energy Storage Market by Stage, 2021-2031 (USD Mn, AGR (%))
Figure 76. North America Compressed Air Energy Storage Market by Stage, 2021-2031 (USD Mn, AGR (%)) (V-Shaped Recovery)
Figure 77. North America Compressed Air Energy Storage Market by Stage, 2021-2031 (USD Mn, AGR (%)) (W-Shaped Recovery)
Figure 78. North America Compressed Air Energy Storage Market by Stage, 2021-2031 (USD Mn, AGR (%)) (U-Shaped Recovery)
Figure 79. North America Compressed Air Energy Storage Market by Stage, 2021-2031 (USD Mn, AGR (%)) (L-Shaped Recovery)
Figure 80. US Compressed Air Energy Storage Market by Value, 2021-2031 (USD Mn, AGR (%))
Figure 81. US Compressed Air Energy Storage Market by Value, 2021-2031 (USD Mn, AGR (%)) (V-Shaped Recovery)
Figure 82. US Compressed Air Energy Storage Market by Value, 2021-2031 (USD Mn, AGR (%)) (W-Shaped Recovery)
Figure 83. US Compressed Air Energy Storage Market by Value, 2021-2031 (USD Mn, AGR (%)) (U-Shaped Recovery)
Figure 84. US Compressed Air Energy Storage Market by Value, 2021-2031 (USD Mn, AGR (%)) (L-Shaped Recovery)
Figure 85. Canada Compressed Air Energy Storage Market by Value, 2021-2031 (USD Mn, AGR (%))
Figure 86. Canada Compressed Air Energy Storage Market by Value, 2021-2031 (USD Mn, AGR (%)) (V-Shaped Recovery)
Figure 87. Canada Compressed Air Energy Storage Market by Value, 2021-2031 (USD Mn, AGR (%)) (W-Shaped Recovery)
Figure 88. Canada Compressed Air Energy Storage Market by Value, 2021-2031 (USD Mn, AGR (%)) (U-Shaped Recovery)
Figure 89. Canada Compressed Air Energy Storage Market by Value, 2021-2031 (USD Mn, AGR (%)) (L-Shaped Recovery)
Figure 90. Mexico Compressed Air Energy Storage Market by Value, 2021-2031 (USD Mn, AGR (%))
Figure 91. Mexico Compressed Air Energy Storage Market by Value, 2021-2031 (USD Mn, AGR (%)) (V-Shaped Recovery)
Figure 92. Mexico Compressed Air Energy Storage Market by Value, 2021-2031 (USD Mn, AGR (%)) (W-Shaped Recovery)
Figure 93. Mexico Compressed Air Energy Storage Market by Value, 2021-2031 (USD Mn, AGR (%)) (U-Shaped Recovery)
Figure 94. Mexico Compressed Air Energy Storage Market by Value, 2021-2031 (USD Mn, AGR (%)) (L-Shaped Recovery)
Figure 95. Europe Compressed Air Energy Storage Market by Value, 2021-2031 (USD Mn, AGR (%))
Figure 96. Europe Compressed Air Energy Storage Market by Value, 2021-2031 (USD Mn, AGR (%)) (V-Shaped Recovery)
Figure 97. Europe Compressed Air Energy Storage Market by Value, 2021-2031 (USD Mn, AGR (%)) (W-Shaped Recovery)
Figure 98. Europe Compressed Air Energy Storage Market by Value, 2021-2031 (USD Mn, AGR (%)) (U-Shaped Recovery)
Figure 99. Europe Compressed Air Energy Storage Market by Value, 2021-2031 (USD Mn, AGR (%)) (L-Shaped Recovery)
Figure 100. Europe Europe Compressed Air Energy Storage Market by Country, 2021-2031 (USD Mn, AGR (%))
Figure 101. Europe Europe Compressed Air Energy Storage Market by Country, 2021-2031 (USD Mn, AGR (%)) (V-Shaped Recovery)
Figure 102. Europe Europe Compressed Air Energy Storage Market by Country, 2021-2031 (USD Mn, AGR (%)) (W-Shaped Recovery)
Figure 103. Europe Europe Compressed Air Energy Storage Market by Country, 2021-2031 (USD Mn, AGR (%)) (U-Shaped Recovery)
Figure 104. Europe Europe Compressed Air Energy Storage Market by Country, 2021-2031 (USD Mn, AGR (%)) (L-Shaped Recovery)
Figure 105. Europe Compressed Air Energy Storage Market by Plant Location, 2021-2031 (USD Mn, AGR (%))
Figure 106. Europe Compressed Air Energy Storage Market by Plant Location, 2021-2031 (USD Mn, AGR (%)) (V-Shaped Recovery)
Figure 107. Europe Compressed Air Energy Storage Market by Plant Location, 2021-2031 (USD Mn, AGR (%)) (W-Shaped Recovery)
Figure 108. Europe Compressed Air Energy Storage Market by Plant Location, 2021-2031 (USD Mn, AGR (%)) (U-Shaped Recovery)
Figure 109. Europe Compressed Air Energy Storage Market by Plant Location, 2021-2031 (USD Mn, AGR (%)) (L-Shaped Recovery)
Figure 110. Europe Compressed Air Energy Storage Market by Technology, 2021-2031 (USD Mn, AGR (%))
Figure 111. Europe Compressed Air Energy Storage Market by Technology, 2021-2031 (USD Mn, AGR (%)) (V-Shaped Recovery)
Figure 112. Europe Compressed Air Energy Storage Market by Technology, 2021-2031 (USD Mn, AGR (%)) (W-Shaped Recovery)
Figure 113. Europe Compressed Air Energy Storage Market by Technology, 2021-2031 (USD Mn, AGR (%)) (U-Shaped Recovery)
Figure 114. Europe Compressed Air Energy Storage Market by Technology, 2021-2031 (USD Mn, AGR (%)) (L-Shaped Recovery)
Figure 115. Europe Compressed Air Energy Storage Markek by Type, 2021-2031 (USD Mn, AGR (%))
Figure 116. Europe Compressed Air Energy Storage Markek by Type, 2021-2031 (USD Mn, AGR (%)) (V-Shaped Recovery)
Figure 117. Europe Compressed Air Energy Storage Markek by Type, 2021-2031 (USD Mn, AGR (%)) (W-Shaped Recovery)
Figure 118. Europe Compressed Air Energy Storage Markek by Type, 2021-2031 (USD Mn, AGR (%)) (U-Shaped Recovery)
Figure 119. Europe Compressed Air Energy Storage Markek by Type, 2021-2031 (USD Mn, AGR (%)) (L-Shaped Recovery)
Figure 120. Europe Compressed Air Energy Storage Market by Components, 2021-2031 (USD Mn, AGR (%))
Figure 121. Europe Compressed Air Energy Storage Market by Components, 2021-2031 (USD Mn, AGR (%)) (V-Shaped Recovery)
Figure 122. Europe Compressed Air Energy Storage Market by Components, 2021-2031 (USD Mn, AGR (%)) (W-Shaped Recovery)
Figure 123. Europe Compressed Air Energy Storage Market by Components, 2021-2031 (USD Mn, AGR (%)) (U-Shaped Recovery)
Figure 124. Europe Compressed Air Energy Storage Market by Components, 2021-2031 (USD Mn, AGR (%)) (L-Shaped Recovery)
Figure 125. Europe Compressed Air Energy Storage Market by Stage, 2021-2031 (USD Mn, AGR (%))
Figure 126. Europe Compressed Air Energy Storage Market by Stage, 2021-2031 (USD Mn, AGR (%)) (V-Shaped Recovery)
Figure 127. Europe Compressed Air Energy Storage Market by Stage, 2021-2031 (USD Mn, AGR (%)) (W-Shaped Recovery)
Figure 128. Europe Compressed Air Energy Storage Market by Stage, 2021-2031 (USD Mn, AGR (%)) (U-Shaped Recovery)
Figure 129. Europe Compressed Air Energy Storage Market by Stage, 2021-2031 (USD Mn, AGR (%)) (L-Shaped Recovery)
Figure 130. Germany Compressed Air Energy Storage Market by Value, 2021-2031 (USD Mn, AGR (%))
Figure 131. Germany Compressed Air Energy Storage Market by Value, 2021-2031 (USD Mn, AGR (%)) (V-Shaped Recovery)
Figure 132. Germany Compressed Air Energy Storage Market by Value, 2021-2031 (USD Mn, AGR (%)) (W-Shaped Recovery)
Figure 133. Germany Compressed Air Energy Storage Market by Value, 2021-2031 (USD Mn, AGR (%)) (U-Shaped Recovery)
Figure 134. Germany Compressed Air Energy Storage Market by Value, 2021-2031 (USD Mn, AGR (%)) (L-Shaped Recovery)
Figure 135. UK Compressed Air Energy Storage Market by Value, 2021-2031 (USD Mn, AGR (%))
Figure 136. UK Compressed Air Energy Storage Market by Value, 2021-2031 (USD Mn, AGR (%)) (V-Shaped Recovery)
Figure 137. UK Compressed Air Energy Storage Market by Value, 2021-2031 (USD Mn, AGR (%)) (W-Shaped Recovery)
Figure 138. UK Compressed Air Energy Storage Market by Value, 2021-2031 (USD Mn, AGR (%)) (U-Shaped Recovery)
Figure 139. UK Compressed Air Energy Storage Market by Value, 2021-2031 (USD Mn, AGR (%)) (L-Shaped Recovery)
Figure 140. France Compressed Air Energy Storage Market by Value, 2021-2031 (USD Mn, AGR (%))
Figure 141. France Compressed Air Energy Storage Market by Value, 2021-2031 (USD Mn, AGR (%)) (V-Shaped Recovery)
Figure 142. France Compressed Air Energy Storage Market by Value, 2021-2031 (USD Mn, AGR (%)) (W-Shaped Recovery)
Figure 143. France Compressed Air Energy Storage Market by Value, 2021-2031 (USD Mn, AGR (%)) (U-Shaped Recovery)
Figure 144. France Compressed Air Energy Storage Market by Value, 2021-2031 (USD Mn, AGR (%)) (L-Shaped Recovery)
Figure 145. Italy Compressed Air Energy Storage Market by Value, 2021-2031 (USD Mn, AGR (%))
Figure 146. Italy Compressed Air Energy Storage Market by Value, 2021-2031 (USD Mn, AGR (%)) (V-Shaped Recovery)
Figure 147. Italy Compressed Air Energy Storage Market by Value, 2021-2031 (USD Mn, AGR (%)) (W-Shaped Recovery)
Figure 148. Italy Compressed Air Energy Storage Market by Value, 2021-2031 (USD Mn, AGR (%)) (U-Shaped Recovery)
Figure 149. Italy Compressed Air Energy Storage Market by Value, 2021-2031 (USD Mn, AGR (%)) (L-Shaped Recovery)
Figure 150. Spain Compressed Air Energy Storage Market by Value, 2021-2031 (USD Mn, AGR (%))
Figure 151. Spain Compressed Air Energy Storage Market by Value, 2021-2031 (USD Mn, AGR (%)) (V-Shaped Recovery)
Figure 152. Spain Compressed Air Energy Storage Market by Value, 2021-2031 (USD Mn, AGR (%)) (W-Shaped Recovery)
Figure 153. Spain Compressed Air Energy Storage Market by Value, 2021-2031 (USD Mn, AGR (%)) (U-Shaped Recovery)
Figure 154. Spain Compressed Air Energy Storage Market by Value, 2021-2031 (USD Mn, AGR (%)) (L-Shaped Recovery)
Figure 155. Rest of Europe Compressed Air Energy Storage Market by Value, 2021-2031 (USD Mn, AGR (%))
Figure 156. Rest of Europe Compressed Air Energy Storage Market by Value, 2021-2031 (USD Mn, AGR (%)) (V-Shaped Recovery)
Figure 157. Rest of Europe Compressed Air Energy Storage Market by Value, 2021-2031 (USD Mn, AGR (%)) (W-Shaped Recovery)
Figure 158. Rest of Europe Compressed Air Energy Storage Market by Value, 2021-2031 (USD Mn, AGR (%)) (U-Shaped Recovery)
Figure 159. Rest of Europe Compressed Air Energy Storage Market by Value, 2021-2031 (USD Mn, AGR (%)) (L-Shaped Recovery)
Figure 160. Asia-Pacific Compressed Air Energy Storage Market by Value, 2021-2031 (USD Mn, AGR (%))
Figure 161. Asia-Pacific Compressed Air Energy Storage Market by Value, 2021-2031 (USD Mn, AGR (%)) (V-Shaped Recovery)
Figure 162. Asia-Pacific Compressed Air Energy Storage Market by Value, 2021-2031 (USD Mn, AGR (%)) (W-Shaped Recovery)
Figure 163. Asia-Pacific Compressed Air Energy Storage Market by Value, 2021-2031 (USD Mn, AGR (%)) (U-Shaped Recovery)
Figure 164. Asia-Pacific Compressed Air Energy Storage Market by Value, 2021-2031 (USD Mn, AGR (%)) (L-Shaped Recovery)
Figure 165. Asia-Pacific Compressed Air Energy Storage Market by Country, 2021-2031 (USD Mn, AGR (%))
Figure 166. Asia-Pacific Compressed Air Energy Storage Market by Country, 2021-2031 (USD Mn, AGR (%)) (V-Shaped Recovery)
Figure 167. Asia-Pacific Compressed Air Energy Storage Market by Country, 2021-2031 (USD Mn, AGR (%)) (W-Shaped Recovery)
Figure 168. Asia-Pacific Compressed Air Energy Storage Market by Country, 2021-2031 (USD Mn, AGR (%)) (U-Shaped Recovery)
Figure 169. Asia-Pacific Compressed Air Energy Storage Market by Country, 2021-2031 (USD Mn, AGR (%)) (L-Shaped Recovery)
Figure 170. Asia-Pacific Compressed Air Energy Storage Market by Plant Location, 2021-2031 (USD Mn, AGR (%))
Figure 171. Asia-Pacific Compressed Air Energy Storage Market by Plant Location, 2021-2031 (USD Mn, AGR (%)) (V-Shaped Recovery)
Figure 172. Asia-Pacific Compressed Air Energy Storage Market by Plant Location, 2021-2031 (USD Mn, AGR (%)) (W-Shaped Recovery)
Figure 173. Asia-Pacific Compressed Air Energy Storage Market by Plant Location, 2021-2031 (USD Mn, AGR (%)) (U-Shaped Recovery)
Figure 174. Asia-Pacific Compressed Air Energy Storage Market by Plant Location, 2021-2031 (USD Mn, AGR (%)) (L-Shaped Recovery)
Figure 175. Asia-Pacific Compressed Air Energy Storage Market by Technology, 2021-2031 (USD Mn, AGR (%))
Figure 176. Asia-Pacific Compressed Air Energy Storage Market by Technology, 2021-2031 (USD Mn, AGR (%)) (V-Shaped Recovery)
Figure 177. Asia-Pacific Compressed Air Energy Storage Market by Technology, 2021-2031 (USD Mn, AGR (%)) (W-Shaped Recovery)
Figure 178. Asia-Pacific Compressed Air Energy Storage Market by Technology, 2021-2031 (USD Mn, AGR (%)) (U-Shaped Recovery)
Figure 179. Asia-Pacific Compressed Air Energy Storage Market by Technology, 2021-2031 (USD Mn, AGR (%)) (L-Shaped Recovery)
Figure 180. Asia-Pacific Compressed Air Energy Storage Markek by Type, 2021-2031 (USD Mn, AGR (%))
Figure 181. Asia-Pacific Compressed Air Energy Storage Markek by Type, 2021-2031 (USD Mn, AGR (%)) (V-Shaped Recovery)
Figure 182. Asia-Pacific Compressed Air Energy Storage Markek by Type, 2021-2031 (USD Mn, AGR (%)) (W-Shaped Recovery)
Figure 183. Asia-Pacific Compressed Air Energy Storage Markek by Type, 2021-2031 (USD Mn, AGR (%)) (U-Shaped Recovery)
Figure 184. Asia-Pacific Compressed Air Energy Storage Markek by Type, 2021-2031 (USD Mn, AGR (%)) (L-Shaped Recovery)
Figure 185. Asia-Pacific Compressed Air Energy Storage Market by Components, 2021-2031 (USD Mn, AGR (%))
Figure 186. Asia-Pacific Compressed Air Energy Storage Market by Components, 2021-2031 (USD Mn, AGR (%)) (V-Shaped Recovery)
Figure 187. Asia-Pacific Compressed Air Energy Storage Market by Components, 2021-2031 (USD Mn, AGR (%)) (W-Shaped Recovery)
Figure 188. Asia-Pacific Compressed Air Energy Storage Market by Components, 2021-2031 (USD Mn, AGR (%)) (U-Shaped Recovery)
Figure 189. Asia-Pacific Compressed Air Energy Storage Market by Components, 2021-2031 (USD Mn, AGR (%)) (L-Shaped Recovery)
Figure 190. Asia-Pacific Compressed Air Energy Storage Market by Stage, 2021-2031 (USD Mn, AGR (%))
Figure 191. Asia-Pacific Compressed Air Energy Storage Market by Stage, 2021-2031 (USD Mn, AGR (%)) (V-Shaped Recovery)
Figure 192. Asia-Pacific Compressed Air Energy Storage Market by Stage, 2021-2031 (USD Mn, AGR (%)) (W-Shaped Recovery)
Figure 193. Asia-Pacific Compressed Air Energy Storage Market by Stage, 2021-2031 (USD Mn, AGR (%)) (U-Shaped Recovery)
Figure 194. Asia-Pacific Compressed Air Energy Storage Market by Stage, 2021-2031 (USD Mn, AGR (%)) (L-Shaped Recovery)
Figure 195. China Compressed Air Energy Storage Market by Value, 2021-2031 (USD Mn, AGR (%))
Figure 196. China Compressed Air Energy Storage Market by Value, 2021-2031 (USD Mn, AGR (%)) (V-Shaped Recovery)
Figure 197. China Compressed Air Energy Storage Market by Value, 2021-2031 (USD Mn, AGR (%)) (W-Shaped Recovery)
Figure 198. China Compressed Air Energy Storage Market by Value, 2021-2031 (USD Mn, AGR (%)) (U-Shaped Recovery)
Figure 199. China Compressed Air Energy Storage Market by Value, 2021-2031 (USD Mn, AGR (%)) (L-Shaped Recovery)
Figure 200. India Compressed Air Energy Storage Market by Value, 2021-2031 (USD Mn, AGR (%))
Figure 201. India Compressed Air Energy Storage Market by Value, 2021-2031 (USD Mn, AGR (%)) (V-Shaped Recovery)
Figure 202. India Compressed Air Energy Storage Market by Value, 2021-2031 (USD Mn, AGR (%)) (W-Shaped Recovery)
Figure 203. India Compressed Air Energy Storage Market by Value, 2021-2031 (USD Mn, AGR (%)) (U-Shaped Recovery)
Figure 204. India Compressed Air Energy Storage Market by Value, 2021-2031 (USD Mn, AGR (%)) (L-Shaped Recovery)
Figure 205. Japan Compressed Air Energy Storage Market by Value, 2021-2031 (USD Mn, AGR (%))
Figure 206. Japan Compressed Air Energy Storage Market by Value, 2021-2031 (USD Mn, AGR (%)) (V-Shaped Recovery)
Figure 207. Japan Compressed Air Energy Storage Market by Value, 2021-2031 (USD Mn, AGR (%)) (W-Shaped Recovery)
Figure 208. Japan Compressed Air Energy Storage Market by Value, 2021-2031 (USD Mn, AGR (%)) (U-Shaped Recovery)
Figure 209. Japan Compressed Air Energy Storage Market by Value, 2021-2031 (USD Mn, AGR (%)) (L-Shaped Recovery)
Figure 210. South Korea Compressed Air Energy Storage Market by Value, 2021-2031 (USD Mn, AGR (%))
Figure 211. South Korea Compressed Air Energy Storage Market by Value, 2021-2031 (USD Mn, AGR (%)) (V-Shaped Recovery)
Figure 212. South Korea Compressed Air Energy Storage Market by Value, 2021-2031 (USD Mn, AGR (%)) (W-Shaped Recovery)
Figure 213. South Korea Compressed Air Energy Storage Market by Value, 2021-2031 (USD Mn, AGR (%)) (U-Shaped Recovery)
Figure 214. South Korea Compressed Air Energy Storage Market by Value, 2021-2031 (USD Mn, AGR (%)) (L-Shaped Recovery)
Figure 215. Australia Compressed Air Energy Storage Market by Value, 2021-2031 (USD Mn, AGR (%))
Figure 216. Australia Compressed Air Energy Storage Market by Value, 2021-2031 (USD Mn, AGR (%)) (V-Shaped Recovery)
Figure 217. Australia Compressed Air Energy Storage Market by Value, 2021-2031 (USD Mn, AGR (%)) (W-Shaped Recovery)
Figure 218. Australia Compressed Air Energy Storage Market by Value, 2021-2031 (USD Mn, AGR (%)) (U-Shaped Recovery)
Figure 219. Australia Compressed Air Energy Storage Market by Value, 2021-2031 (USD Mn, AGR (%)) (L-Shaped Recovery)
Figure 220. Rest of Asia-Pacific Compressed Air Energy Storage Market by Value, 2021-2031 (USD Mn, AGR (%))
Figure 221. Rest of Asia-Pacific Compressed Air Energy Storage Market by Value, 2021-2031 (USD Mn, AGR (%)) (V-Shaped Recovery)
Figure 222. Rest of Asia-Pacific Compressed Air Energy Storage Market by Value, 2021-2031 (USD Mn, AGR (%)) (W-Shaped Recovery)
Figure 223. Rest of Asia-Pacific Compressed Air Energy Storage Market by Value, 2021-2031 (USD Mn, AGR (%)) (U-Shaped Recovery)
Figure 224. Rest of Asia-Pacific Compressed Air Energy Storage Market by Value, 2021-2031 (USD Mn, AGR (%)) (L-Shaped Recovery)
Figure 225. LAMEA Compressed Air Energy Storage Market by Value, 2021-2031 (USD Mn, AGR (%))
Figure 226. LAMEA Compressed Air Energy Storage Market by Value, 2021-2031 (USD Mn, AGR (%)) (V-Shaped Recovery)
Figure 227. LAMEA Compressed Air Energy Storage Market by Value, 2021-2031 (USD Mn, AGR (%)) (W-Shaped Recovery)
Figure 228. LAMEA Compressed Air Energy Storage Market by Value, 2021-2031 (USD Mn, AGR (%)) (U-Shaped Recovery)
Figure 229. LAMEA Compressed Air Energy Storage Market by Value, 2021-2031 (USD Mn, AGR (%)) (L-Shaped Recovery)
Figure 230. LAMEA Compressed Air Energy Storage Market by Country, 2021-2031 (USD Mn, AGR (%))
Figure 231. LAMEA Compressed Air Energy Storage Market by Country, 2021-2031 (USD Mn, AGR (%)) (V-Shaped Recovery)
Figure 232. LAMEA Compressed Air Energy Storage Market by Country, 2021-2031 (USD Mn, AGR (%)) (W-Shaped Recovery)
Figure 233. LAMEA Compressed Air Energy Storage Market by Country, 2021-2031 (USD Mn, AGR (%)) (U-Shaped Recovery)
Figure 234. LAMEA Compressed Air Energy Storage Market by Country, 2021-2031 (USD Mn, AGR (%)) (L-Shaped Recovery)
Figure 235. LAMEA Compressed Air Energy Storage Market by Plant Location, 2021-2031 (USD Mn, AGR (%))
Figure 236. LAMEA Compressed Air Energy Storage Market by Plant Location, 2021-2031 (USD Mn, AGR (%)) (V-Shaped Recovery)
Figure 237. LAMEA Compressed Air Energy Storage Market by Plant Location, 2021-2031 (USD Mn, AGR (%)) (W-Shaped Recovery)
Figure 238. LAMEA Compressed Air Energy Storage Market by Plant Location, 2021-2031 (USD Mn, AGR (%)) (U-Shaped Recovery)
Figure 239. LAMEA Compressed Air Energy Storage Market by Plant Location, 2021-2031 (USD Mn, AGR (%)) (L-Shaped Recovery)
Figure 240. LAMEA Compressed Air Energy Storage Market by Technology, 2021-2031 (USD Mn, AGR (%))
Figure 241. LAMEA Compressed Air Energy Storage Market by Technology, 2021-2031 (USD Mn, AGR (%)) (V-Shaped Recovery)
Figure 242. LAMEA Compressed Air Energy Storage Market by Technology, 2021-2031 (USD Mn, AGR (%)) (W-Shaped Recovery)
Figure 243. LAMEA Compressed Air Energy Storage Market by Technology, 2021-2031 (USD Mn, AGR (%)) (U-Shaped Recovery)
Figure 244. LAMEA Compressed Air Energy Storage Market by Technology, 2021-2031 (USD Mn, AGR (%)) (L-Shaped Recovery)
Figure 245. LAMEA Compressed Air Energy Storage Markek by Type, 2021-2031 (USD Mn, AGR (%))
Figure 246. LAMEA Compressed Air Energy Storage Markek by Type, 2021-2031 (USD Mn, AGR (%)) (V-Shaped Recovery)
Figure 247. LAMEA Compressed Air Energy Storage Markek by Type, 2021-2031 (USD Mn, AGR (%)) (W-Shaped Recovery)
Figure 248. LAMEA Compressed Air Energy Storage Markek by Type, 2021-2031 (USD Mn, AGR (%)) (U-Shaped Recovery)
Figure 249. LAMEA Compressed Air Energy Storage Markek by Type, 2021-2031 (USD Mn, AGR (%)) (L-Shaped Recovery)
Figure 250. LAMEA Compressed Air Energy Storage Market by Components, 2021-2031 (USD Mn, AGR (%))
Figure 251. LAMEA Compressed Air Energy Storage Market by Components, 2021-2031 (USD Mn, AGR (%)) (V-Shaped Recovery)
Figure 252. LAMEA Compressed Air Energy Storage Market by Components, 2021-2031 (USD Mn, AGR (%)) (W-Shaped Recovery)
Figure 253. LAMEA Compressed Air Energy Storage Market by Components, 2021-2031 (USD Mn, AGR (%)) (U-Shaped Recovery)
Figure 254. LAMEA Compressed Air Energy Storage Market by Components, 2021-2031 (USD Mn, AGR (%)) (L-Shaped Recovery)
Figure 255. LAMEA Compressed Air Energy Storage Market by Stage, 2021-2031 (USD Mn, AGR (%))
Figure 256. LAMEA Compressed Air Energy Storage Market by Stage, 2021-2031 (USD Mn, AGR (%)) (V-Shaped Recovery)
Figure 257. LAMEA Compressed Air Energy Storage Market by Stage, 2021-2031 (USD Mn, AGR (%)) (W-Shaped Recovery)
Figure 258. LAMEA Compressed Air Energy Storage Market by Stage, 2021-2031 (USD Mn, AGR (%)) (U-Shaped Recovery)
Figure 259. LAMEA Compressed Air Energy Storage Market by Stage, 2021-2031 (USD Mn, AGR (%)) (L-Shaped Recovery)
Figure 260. Brazil Compressed Air Energy Storage Market by Value, 2021-2031 (USD Mn, AGR (%))
Figure 261. Brazil Compressed Air Energy Storage Market by Value, 2021-2031 (USD Mn, AGR (%)) (V-Shaped Recovery)
Figure 262. Brazil Compressed Air Energy Storage Market by Value, 2021-2031 (USD Mn, AGR (%)) (W-Shaped Recovery)
Figure 263. Brazil Compressed Air Energy Storage Market by Value, 2021-2031 (USD Mn, AGR (%)) (U-Shaped Recovery)
Figure 264. Brazil Compressed Air Energy Storage Market by Value, 2021-2031 (USD Mn, AGR (%)) (L-Shaped Recovery)
Figure 265. South Africa Compressed Air Energy Storage Market by Value, 2021-2031 (USD Mn, AGR (%))
Figure 266. South Africa Compressed Air Energy Storage Market by Value, 2021-2031 (USD Mn, AGR (%)) (V-Shaped Recovery)
Figure 267. South Africa Compressed Air Energy Storage Market by Value, 2021-2031 (USD Mn, AGR (%)) (W-Shaped Recovery)
Figure 268. South Africa Compressed Air Energy Storage Market by Value, 2021-2031 (USD Mn, AGR (%)) (U-Shaped Recovery)
Figure 269. South Africa Compressed Air Energy Storage Market by Value, 2021-2031 (USD Mn, AGR (%)) (L-Shaped Recovery)
Figure 270. Saudi Arabia Compressed Air Energy Storage Market by Value, 2021-2031 (USD Mn, AGR (%))
Figure 271. Saudi Arabia Compressed Air Energy Storage Market by Value, 2021-2031 (USD Mn, AGR (%)) (V-Shaped Recovery)
Figure 272. Saudi Arabia Compressed Air Energy Storage Market by Value, 2021-2031 (USD Mn, AGR (%)) (W-Shaped Recovery)
Figure 273. Saudi Arabia Compressed Air Energy Storage Market by Value, 2021-2031 (USD Mn, AGR (%)) (U-Shaped Recovery)
Figure 274. Saudi Arabia Compressed Air Energy Storage Market by Value, 2021-2031 (USD Mn, AGR (%)) (L-Shaped Recovery)
Figure 275. Turkey Compressed Air Energy Storage Market by Value, 2021-2031 (USD Mn, AGR (%))
Figure 276. Turkey Compressed Air Energy Storage Market by Value, 2021-2031 (USD Mn, AGR (%)) (V-Shaped Recovery)
Figure 277. Turkey Compressed Air Energy Storage Market by Value, 2021-2031 (USD Mn, AGR (%)) (W-Shaped Recovery)
Figure 278. Turkey Compressed Air Energy Storage Market by Value, 2021-2031 (USD Mn, AGR (%)) (U-Shaped Recovery)
Figure 279. Turkey Compressed Air Energy Storage Market by Value, 2021-2031 (USD Mn, AGR (%)) (L-Shaped Recovery)
Figure 280. UAE Compressed Air Energy Storage Market by Value, 2021-2031 (USD Mn, AGR (%))
Figure 281. UAE Compressed Air Energy Storage Market by Value, 2021-2031 (USD Mn, AGR (%)) (V-Shaped Recovery)
Figure 282. UAE Compressed Air Energy Storage Market by Value, 2021-2031 (USD Mn, AGR (%)) (W-Shaped Recovery)
Figure 283. UAE Compressed Air Energy Storage Market by Value, 2021-2031 (USD Mn, AGR (%)) (U-Shaped Recovery)
Figure 284. UAE Compressed Air Energy Storage Market by Value, 2021-2031 (USD Mn, AGR (%)) (L-Shaped Recovery)
Figure 285. Rest of LAMEA Compressed Air Energy Storage Market by Value, 2021-2031 (USD Mn, AGR (%))
Figure 286. Rest of LAMEA Compressed Air Energy Storage Market by Value, 2021-2031 (USD Mn, AGR (%)) (V-Shaped Recovery)
Figure 287. Rest of LAMEA Compressed Air Energy Storage Market by Value, 2021-2031 (USD Mn, AGR (%)) (W-Shaped Recovery)
Figure 288. Rest of LAMEA Compressed Air Energy Storage Market by Value, 2021-2031 (USD Mn, AGR (%)) (U-Shaped Recovery)
Figure 289. Rest of LAMEA Compressed Air Energy Storage Market by Value, 2021-2031 (USD Mn, AGR (%)) (L-Shaped Recovery)
Figure 290. Siemens AG: Company Revenue 2016-2020 (US$Mn, AGR %)
Figure 291. Siemens AG: Company Operating Income 2016-2020 (US$Mn, AGR %)
Figure 292. Siemens AG: Company Net Income 2016-2020 (US$Mn, AGR %)
Figure 293. Siemens AG: Company EBITDA 2016-2020 (US$Mn, AGR %)
Figure 294. Pacific Gas and Electric Company: Company Revenue 2016-2020 (US$Mn, AGR %)
Figure 295. Pacific Gas and Electric Company: Company Operating Income 2016-2020 (US$Mn, AGR %)
Figure 296. Pacific Gas and Electric Company: Company Net Income 2016-2020 (US$Mn, AGR %)
Figure 297. Pacific Gas and Electric Company: Company EBITDA 2016-2020 (US$Mn, AGR %)
Figure 298. GE Energy: Company Revenue 2016-2020 (US$Mn, AGR %)
Figure 299. GE Energy: Company Operating Income 2016-2020 (US$Mn, AGR %)
Figure 300. GE Energy: Company Net Income 2016-2020 (US$Mn, AGR %)
Figure 301. GE Energy: Company EBITDA 2016-2020 (US$Mn, AGR %)
Figure 302. MAN SE: Company Revenue 2016-2020 (US$Mn, AGR %)
Figure 303. MAN SE: Company Operating Income 2016-2020 (US$Mn, AGR %)
Figure 304. MAN SE: Company Net Income 2016-2020 (US$Mn, AGR %)
Figure 305. MAN SE: Company EBITDA 2016-2020 (US$Mn, AGR %)
Figure 306. Alstom Power, Inc.: Company Revenue 2017-2021 (US$Mn, AGR %)
Figure 307. Alstom Power, Inc.: Company Operating Income 2017-2021 (US$Mn, AGR %)
Figure 308. Alstom Power, Inc.: Company Net Income 2017-2021 (US$Mn, AGR %)
Figure 309. Alstom Power, Inc.: Company EBITDA 2017-2021 (US$Mn, AGR %)
Figure 310. Global Compressed Air Energy Storage Market Share Forecast by Region 2021, 2026, 2031 (%)
List of Companies Profiled in the report
AES Energy Storage LLC
ALACAES
Alstom Power, Inc.
Apex CAES
Babcock Power
General Compression
General Electric Company
Hydrostor Inc.
Magnum Development LLC
MAN SE
NG Advantage
Pacific Gas and Electric Company
Siemens AG
Solar Turbines, Inc.
Storelectric Ltd.
List of Other Companies Mentioned in the report
A123 Systems Inc.
ABB Ltd.
ABB Ltd.
Abengoa Solar S.A.
Active Power
Active Power Inc. (Piller Group GmbH)
AES Energy Storage, LLC
Airfilter Engineering
Alpha-Pure
Altairnano
Altairnano, Inc.
Altec Air
Amber Kinetics
Amber Kinetics, Inc.
Amplify Energy Corp.
Arotech Corporation
Atlas Copco
Autobat SACI
Axion Power International Inc.
Baltimore Aircoil Company Inc.
Beacon Power Corporation
Beko Technologies
BOGE Kompressoren
Burns & McDonnell
BYD Auto Co. Ltd
BYD Company
C&D Technologies Inc.
Calnetix Technologies, LLC
Chicago Pneumatic
China Bak Battery Inc.
ComEd
Compressed Air Parts Company (CAPCO)
Convergent Energy and Power Inc.
Donaldson Company
E-One Moli Energy Corp.
EaglePicher Technologies
East Penn Manufacturing Co. Inc (Deka Batteries)
East Penn Manufacturing Company
Eguana Technologies
Electrovaya Inc.
ELGI Equipments LTD
ELYTT ENERGY
Enel
Ener1 Inc.
Enerbrax Acumuladores Ltda
ENERGIESTRO
Energizer
Enersys
Evapco Inc.
Exide Industries Ltd.
Exide Technologies
Fluence
Fluence Energy, LLC
Gardner Denver, Inc.
GE Energy
Gem Equipments Ltd.
General Electric Company
Genex Power Limited
GreenSmith Energy Management Systems
GS Yuasa Corporation
GS Yuasa International Ltd.
Hitachi Chemical Co., Ltd.
Ice Energy
Imergy Power Systems.
Invenergy
Invinity Energy Systems
Ionotec Ltd
J POWER
Johnson Controls
LG Chem Ltd
Lithium Technology Corporation (Gaia Akkumulatorenwerke Gmbh)
Maxwell Technologies Inc
NEC Energy Solutions
NEC Energy Solutions, Inc.
Nesscap Co. Ltd
NextEra Energy Resources
Nippon Chemi-Con Corporation
NRStor Inc.
OXTO Energy
Parker Hannifin
POWERTHRU
RES
Rotonix USA
S&C Electric Company
Saft Groupe S.A.
Saft Groupe S.A.
Samsung SDI Co. Ltd
Samsung SDI Co., Ltd.
Sanyo Electric Co. Ltd
Scheider Electric
Seeo, Inc.
SK Holdings
SMA Solar Technology AG
SolarReserve, LLC
Stornetic
Tata Power
Teraloop Oy
Tesla Inc.
The Furukawa Battery Co. Ltd
Toshiba
Ultralife Corporation
Uniper
Valence
Voith Hydro
Vycon
Xtreme Power
List of Associations Mentioned in the Report
Aalto University
Advanced Lead Acid Battery Consortium (ALABC)
Australian Renewable Energy Agency
Battery Association of Japan
Business Finland
California Energy Storage Association CESA
China Energy Storage Alliance
Clean Energy Ministerial
Climate Technology Centre & Network
Council of European Energy Regulators (CEER)
Energy Storage Association
ESMAP
EUROBAT
European Association for the Storage of Energy EASE
European Commission
European Union
Federal Energy Regulatory Commission's (FERC)
German Energy Storage Association (BVES)
India Energy Storage Alliance (IESA)
International Battery and Energy Storage Alliance (IBESA)
International Energy Agency
International Renewable Energy Agency (IRENA)
NITI Aayog
NREL
RECHARGE
Regional Transmission Organisations (RTO)
SOLARUNITED
Texas Energy Storage Alliance TESA
The Central Electricity Regulatory Commission (CERC)
The Rechargeable Battery Association
The World Renewable Energy Association (WoREA)
Thinking Circular
TÜV Rheinland
U.S. Energy Storage Association (ESA)
US Department of Energy (DoE)
US EIA
World Bank
World Energy Council
World Petroleum Council
 Market Report 2021-2031")