The Anaerobic Digestion (AD) Market Report 2022-2032: This report will prove invaluable to leading firms striving for new revenue pockets if they wish to better understand the industry and its underlying dynamics. It will be useful for companies that would like to expand into different industries or to expand their existing operations in a new region.
Anaerobic Digesters Are Simpler to Run and Maintain
Digesters are designed to function under a range of temperature conditions. Mesophilic and thermophilic plants typically grow best in temperatures between 86 and 100 °F and 122 and 140 °F, respectively. Different populations of anaerobic microorganisms thrive in different temperature ranges. Thermophilic anaerobic digestion (AD) is frequently used when a higher level of pathogen killing is desired. “Class A Biosolids” are capable of being produced at these temperatures. Class a Biosolids are defined as dewatered and heated sewage sludge that satisfies US EPA standards for land application without limits. Class A Biosolids can thus be sold as compost or fertiliser to home gardeners and used legally as fertiliser in farms and vegetable gardens. Thermophillic digesters process feedstock more quickly, but they can cost more and be more difficult to operate.
Feed-In Tariffs, Feed-In Premiums, and Green Certifications Have All Been Evident Drivers of Anaerobic Digestion’s Development
To refine biogas for use as a fuel, it may need to be treated or ‘scrubbed.’ As a trace component of the biogas, hydrogen sulphide, a hazardous chemical generated from sulphates in the feedstock, is emitted. National environmental enforcement agencies, such as the United States Environmental Protection Agency or the English and Welsh Environment Agency, set strict limits on hydrogen sulphide levels in gases, and if the levels of hydrogen sulphide in the gas are high, gas scrubbing and cleaning equipment (such as amine gas treating) will be required to process the biogas to regionally acceptable levels. The addition of ferrous chloride FeCl2 to the digestion tanks, on the other hand, prevents hydrogen production.
What Questions Should You Ask before Buying a Market Research Report?
• How is the anaerobic digestion (AD) market evolving?
• What is driving and restraining the anaerobic digestion (AD) market?
• How will each anaerobic digestion (AD) submarket segment grow over the forecast period and how much revenue will these submarkets account for in 2032?
• How will the market shares for each anaerobic digestion (AD) submarket develop from 2022 to 2032?
• What will be the main driver for the overall market from 2022 to 2032?
• Will leading anaerobic digestion (AD) markets broadly follow the macroeconomic dynamics, or will individual national markets outperform others?
• How will the market shares of the national markets change by 2032 and which geographical region will lead the market in 2032?
• Who are the leading players and what are their prospects over the forecast period?
• What are the anaerobic digestion (AD) projects for these leading companies?
• How will the industry evolve during the period between 2020 and 2032? What are the implications of anaerobic digestion (AD) projects taking place now and over the next 10 years?
• Is there a greater need for product commercialisation to further scale the anaerobic digestion (AD) market?
• Where is the anaerobic digestion (AD) market heading and how can you ensure you are at the forefront of the market?
• What are the best investment options for new product and service lines?
• What are the key prospects for moving companies into a new growth path and C-suite?
You need to discover how this will impact the anaerobic digestion (AD) market today, and over the next 10 years:
• Our 261-page report provides 131 tables and 154 charts/graphs exclusively to you.
• The report highlights key lucrative areas in the industry so you can target them – NOW.
• It contains in-depth analysis of global, regional and national sales and growth.
• It highlights for you the key successful trends, changes and revenue projections made by your competitors.
This report tells you TODAY how the anaerobic digestion (AD) market will develop in the next 10 years, and in line with the variations in COVID-19 economic recession and bounce. This market is more critical now than at any point over the last 10 years.
The report delivers exclusive COVID-19 variations and economic data specific to your market.
To access the data contained in this document please email contactus@visiongain.com
Forecasts to 2032 and other analyses reveal commercial prospects
• In addition to revenue forecasting to 2032, our new study provides you with recent results, growth rates, and market shares.
• You will find original analyses, with business outlooks and developments.
• Discover qualitative analyses (including market dynamics, drivers, opportunities, restraints and challenges), cost structure, impact of rising anaerobic digestion (AD) prices and recent developments.
This report includes data analysis and invaluable insight into how COVID-19 will affect the industry and your company. Four COVID-19 recovery patterns and their impact, namely, “V”, “L”, “W” and “U” are discussed in this report.
Segments Covered in the Report
Market Segment by Spending
• CAPEX
• OPEX
Market Segment by Digester Type
• Stand-Alone Digesters
• On-Farm Digesters
• Co-Digestion System
Market Segment by Feedstock
• Agricultural Residues
• Food & Beverage Industry Waste
• Residential Organic Wastes
• Food Service Waste
• Wastewater solids (sludge)
Market Segment by End-Use
• Produce Heat and Electricity (CHP)
• Fuel Boilers and Furnaces to Heat Digesters
• Produce Electricity
• Produce Mechanical Power
• Compressed to Vehicle Fuels
• Other End-Use

In addition to the revenue predictions for the overall world market and segments, you will also find revenue forecasts for four regional and 20 leading national markets:
North America
• U.S.
• Canada
• Mexico
Europe
• Germany
• The Netherlands
• United Kingdom
• France
• Rest of Europe
Asia Pacific
• China
• Japan
• India
• Australia
• Rest of Asia Pacific
Middle East & Africa
• Turkey
• Saudi Arabia
• South Africa
• Israel
• Rest of Middle East & Africa
South America
• Brazil
• Colombia
• Rest of South America
Need industry data? Please contact us today.
The report also includes profiles and for some of the leading companies in the Anaerobic Digestion (AD) Market, 2022 to 2032, with a focus on this segment of these companies’ operations.
Leading companies and the potential for market growth
• 2G Energy GmbH
• Anaergia Inc.
• CGG
• Covanta Energy Corporation
• Harvest Power, Inc.
• Host Holding B.V.
• Organic Waste Systems (OWS), Inc.
• PlanET Biogas Global
• Schaumann BioEnergy GmbH
• Siemens AG
• Streisal GmbH
• Waterleau Group NV
• WELTEC BIOPOWER GmbH
Overall world revenue for Anaerobic Digestion (AD) Market, 2022 to 2032 in terms of value the market will surpass US$18,716 million in 2022, our work calculates. We predict strong revenue growth through to 2032. Our work identifies which organizations hold the greatest potential. Discover their capabilities, progress, and commercial prospects, helping you stay ahead.
How will the Anaerobic Digestion (AD) Market, 2022 to 2032 report help you?
In summary, our 253-page report provides you with the following knowledge:
• Revenue forecasts to 2032 for Anaerobic Digestion (AD) Market, 2022 to 2032 Market, with forecasts for, digester type, spending, feedstock, end-use and company size, each forecast at a global and regional level – discover the industry’s prospects, finding the most lucrative places for investments and revenues.
• Revenue forecasts to 2032 for four regional and 20 key national markets – See forecasts for the Anaerobic Digestion (AD) Market, 2022 to 2032 market in North America, Europe, Asia-Pacific and LAMEA. Also forecasted is the market in the US, Canada, Mexico, Brazil, Germany, France, UK, China, India, Japan, and Australia among other prominent economies.
• Prospects for established firms and those seeking to enter the market – including company profiles for 15 of the major companies involved in the Anaerobic Digestion (AD) Market, 2022 to 2032.
Find quantitative and qualitative analyses with independent predictions. Receive information that only our report contains, staying informed with invaluable business intelligence.
Information found nowhere else
With our new report, you are less likely to fall behind in knowledge or miss out on opportunities. See how our work could benefit your research, analyses, and decisions. Visiongain’s study is for everybody needing commercial analyses for the Anaerobic Digestion (AD) Market, 2022 to 2032, market-leading companies. You will find data, trends and predictions.
To access the data contained in this document please email contactus@visiongain.com
Buy our report today Anaerobic Digestion (AD) Market Report 2022-2032: Forecasts by Spending (CAPEX, OPEX), by Digester Type (Stand-Alone Digesters, On-Farm Digesters, Co-Digestion System), by Feedstock (Agricultural Residues, Food & Beverage Industry Waste, Residential Organic Wastes, Food Service Waste, Wastewater Solids (Sludge)), by End-use (Produce Heat and Electricity (CHP), Fuel Boilers and Furnaces to Heat Digesters, Produce Electricity, Produce Mechanical Power, Compressed to Vehicle Fuels, Other) AND Regional and Leading National Market Analysis PLUS Analysis of Leading Companies AND COVID-19 Impact and Recovery Pattern Analysis. Avoid missing out by staying informed – order our report now.
Visiongain is a trading partner with the US Federal Government
CCR Ref number: KD4R6
Do you have any custom requirements we can help you with? Any need for a specific country, geo region, market segment or specific company information? Contact us today, we can discuss your needs and see how we can help: contactus@visiongain.com
1. Report Overview
1.1 Objectives of the Study
1.2 Introduction to Anaerobic Digestion Market
1.3 What this Report Delivers
1.4 Why you Should Read this Report
1.5 Key Questions Answered by this Analytical Report Include:
1.6 Who is this Report for?
1.7 Methodology
1.7.1 Market Definitions
1.7.2 Market Evaluation & Forecasting Methodology
1.7.3 Data Validation
1.8 Frequently Asked Questions (FAQs)
1.9 Associated Visiongain Reports
1.10 About Visiongain
2 Executive Summary
3 Premium Insights
3.1 Geographical Snapshot: Global Anaerobic Digestion Market
3.2 Digester Type Segment: Market Attractiveness Index
3.3 Feedstock Segment: Market Attractiveness Index
3.4 End-users Segment: Market Attractiveness Index
4 Global Market Dynamics
4.1 Current Trends in the Global Market
4.2 Market Driving Factors
4.2.1 Low Construction Cost and Requires Less Space
4.2.2 Easy to operate
4.2.3 Low Emission from Digester
4.2.4 Minimization of Greenhouse Emission
4.2.5 Alternate Energy Generation from Waste
4.2.6 Organic Diversion from Landfills
4.3 Market Restraining Factors
4.3.1 Low Awareness
4.3.2 No Strict Regulations in Some Countries
4.4 Opportunities in the Global Market
4.4.1 Increasing Demand For Renewable Energy Resources
4.4.2 Various Anaerobic Digester Technology Now in Use
4.4.3 Biogas Potential from Agricultural Feedstock
4.5 Challenges in the Global Market
4.5.1 Organic Solid Waste Management
4.5.2 The Collecting System Has a Big Impact on the Characteristics of the Waste Materials Used For AD
4.5.3 Prior To Digestion, Most Feedstocks Require Pre-Treatment
4.6 SWOT Analysis
4.7 Porter’s Five Forces Model
4.7.1 Bargaining Power of Supplier - Low
4.7.2 Bargaining Power of Buyer - Moderate
4.7.3 Threat of Substitute Products - Moderate
4.7.4 Threat of New Entry - Moderate
4.7.5 Rivalry Among Existing Competitors - High
4.8 COVID-19 Impact Analysis
4.8.1 COVID-19 V-Shaped Recovery Scenario Analysis
4.8.2 COVID-19 W-Shaped Recovery Scenario Analysis
4.8.3 COVID-19 U-Shaped Recovery Scenario Analysis
4.8.4 COVID-19 L-Shaped Recovery Scenario Analysis
5 Global Anaerobic Digestion Market Analysis by Spending Type
5.1 Key Findings
5.2 Spending Type Segment Growth Prospects
5.3 Global Anaerobic Digestion Market Share by Spending Type, 2022 & 2032
5.4 Global Market Size Estimation and Forecast Spending Type
5.4.1 CAPEX
5.4.2 OPEX
6 Global Anaerobic Digestion Market Analysis by Digester Type
6.1 Key Findings
6.2 Digester Type Segment Growth Prospects
6.3 Global Anaerobic Digestion Market Share by Digester Type, 2022 & 2032
6.3.1 Global Anaerobic Digestion Market by Digester Type
7 Global Anaerobic Digestion Market Analysis by Feedstock
7.1 Key Findings
7.2 Feedstock Segment Growth Prospects
7.3 Global Anaerobic Digestion Market Share by Feedstock, 2022 & 2032
7.3.1 Global Market Size Estimation and Forecast by Feedstock
8 Global Anaerobic Digestion Market Analysis by End-Use
8.1 Key Findings
8.2 End-Use Segment Growth Prospects
8.3 Global Anaerobic Digestion Market Share by End-Use, 2022 & 2032
8.3.1 Global Market Size Estimation and Forecast by End-Use
9 Global Anaerobic Digestion Market Analysis by Region
9.1 Key Findings
9.2 Regional Market Size Estimation and Forecast
10 North America Anaerobic Digestion Market Analysis
10.1 Growing Demand for Bio-Based Products and Renewable Energy from a Variety of Organic Feedstock
10.2 Biogas is a Clean-Tech Alternative that Fosters Ongoing Agricultural Innovation
10.3 North America Anaerobic Digestion Market Attractiveness Index
10.4 North America Anaerobic Digestion Market by Country, 2022, 2027 & 2032 (US$ mn)
10.5 North America Anaerobic Digestion Market Forecast by Biogas Generation
10.6 North America Anaerobic Digestion Market Size Estimation and Forecast by Spending Type
10.7 North America Anaerobic Digestion Market Size Estimation and Forecast by Digester Type
10.8 North America Anaerobic Digestion Market Size Estimation and Forecast by Feedstock
10.9 North America Anaerobic Digestion Market Size Estimation and Forecast by End-users
10.10 North America Anaerobic Digestion Market Size Estimation and Forecast by Country
10.11 U.S. Market Analysis
10.11.1 There Are Around 2200 Biogas Production Facilities in the United States
10.11.2 The U.S. Biogas Business Has Enormous Potential for Growth
10.12 Canada Market Analysis
10.12.1 Canada Now Operates 61 Anaerobic Digestion or Biogas Plants
10.12.2 The Number of Operating Biogas Plants in Canada Has Increased by About 50%
10.13 Mexico Market Analysis
11 Europe Anaerobic Digestion Market Analysis
11.1 Each EU Member State Has a Separate Goal for the Proportion of Sustainable Energy Sources, as Well as a Different Strategy for Achieving that Goal
11.2 It is Expected that the Size of Europe's Anaerobic Digestion Industry Would Grow Moderately
11.3 The Benefits of AD Technology Will Encourage its Use During the Forecast Period in the Region of Europe
11.4 Europe Anaerobic Digestion Market Attractiveness Index
11.5 Europe Anaerobic Digestion Market by Country, 2022, 2027 & 2032 (US$ mn)
11.6 Europe Anaerobic Digestion Market Forecast by Biogas Generation
11.7 Europe Anaerobic Digestion Market Size Estimation and Forecast by Spending Type
11.8 Europe Anaerobic Digestion Market Size Estimation and Forecast by Digester Type
11.9 Europe Anaerobic Digestion Market Size Estimation and Forecast by Feedstock
11.10 Europe Anaerobic Digestion Market Size Estimation and Forecast by End-users
11.11 Europe Anaerobic Digestion Market Size Estimation and Forecast by Country
11.12 Germany Market Analysis
11.12.1 Germany is Now the World Leader in Renewable Energy Generation, with 9,527 Biogas Plants
11.13 France Market Analysis
11.13.1 France: Two New Biogas Plants
11.14 UK Market Analysis
11.15 The Netherlands Market Analysis
11.15.1 The Netherlands Is One of Just a Few Countries in the World that Have Implemented Large-Scale Biogas-to-Biomethane Conversion Projects
11.15.2 Currently, the Netherlands Has a Critical Biogas and Biomethane Support Instrument
11.15.3 The Netherlands Has a Very Consistent Biogas Policy
11.16 Rest of Europe Market Analysis
11.16.1 Biogas as a Sustainable Fuel for Heat, Power and Transport
11.16.2 EU Policies on Renewable Energy
12 Asia-Pacific Anaerobic Digestion Market Analysis
12.1 Anaerobic Digestion Biogas is Being Distributed Throughout Asia
12.2 Asia-Pacific Anaerobic Digestion Market Attractiveness Index
12.3 Asia-Pacific Anaerobic Digestion Market by Country, 2022, 2027 & 2032 (US$ mn)
12.4 Asia-Pacific Anaerobic Digestion Market Forecast by Biogas Generation
12.5 Asia-Pacific Anaerobic Digestion Market Size Estimation and Forecast by Spending Type
12.6 Asia-Pacific Anaerobic Digestion Market Size Estimation and Forecast by Digester Type
12.7 Asia-Pacific Anaerobic Digestion Market Size Estimation and Forecast by Feedstock
12.8 Asia-Pacific Anaerobic Digestion Market Size Estimation and Forecast by End-users
12.9 Asia-Pacific Anaerobic Digestion Market Size Estimation and Forecast by Country
12.10 China Market Analysis
12.10.1 The Central Government's Investment Subsidies for Biogas Plants Are Determined by the Level of Regional Economic Growth
12.11 India Market Analysis
12.11.1 The National Biogas and Manure Management Programme (NBMMP)
12.12 Japan Market Analysis
12.12.1 Japan Aspires to Be a Decarbonized, Carbon-Neutral Company that Reduces Greenhouse Gas Emissions to Zero by 2050
12.12.2 Renewable Energy Sources Have Steadily Increased their Share of Electricity Generation in Japan During the Last Five Years
12.13 Australia Market Analysis
12.13.1 The Government of Australia Has Launched a 'The First' Biomethane-To-Gas Project in Australia
12.14 Rest of Asia-Pacific Market Analysis
12.14.1 Biogas Support Programme in Nepal
13 Middle East & Africa Anaerobic Digestion Market Analysis
13.1 Middle East and Africa Market Outlook
13.1.1 In the Middle East, there is a Vast Untapped Potential for Biogas Generation
13.1.2 The Middle East Has a Vast Potential for Renewable Energy in the form of the Yet Mostly Undeveloped Solar, Wind and Biofuel Sectors
13.1.3 The Middle East is Well Placed for the Development of Biomass Energy
13.1.4 Africa Market Overview
13.2 Middle East & Africa Anaerobic Digestion Market Attractiveness Index
13.3 Middle East & Africa Anaerobic Digestion Market by Country, 2022, 2027 & 2032 (US$ mn)
13.4 Middle East & Africa Anaerobic Digestion Market Forecast by Biogas Generation
13.5 Middle East & Africa Anaerobic Digestion Market Size Estimation and Forecast by Spending Type
13.6 Middle East & Africa Anaerobic Digestion Market Size Estimation and Forecast by Digester Type
13.7 Middle East & Africa Anaerobic Digestion Market Size Estimation and Forecast by Feedstock
13.8 Middle East & Africa Anaerobic Digestion Market Size Estimation and Forecast by End-users
13.9 Middle East & Africa Anaerobic Digestion Market Size Estimation and Forecast by Country
13.10 Turkey Market Analysis
13.10.1 In the Past Decade Turkey's Energy Mix Has Undergone Tremendous Diversification
13.11 Saudi Arabia Market Analysis
13.11.1 Saudi Arabia Will Create 50% of Renewable Energy By 2030
13.12 South Africa Market Analysis
13.12.1 Waste-To-Energy Project South Africa with a Focus on the Use of Energy Produced from Organically Waste, Mainly
13.13 Israel Market Analysis
13.13.1 Biofuels Have Evolved to Improve Consumer Lives and to Generate Environmental Benefits
13.14 Rest of MEA Market Analysis
13.14.1 For Biogas and Digesters, there Are Various End Uses
14 South America Anaerobic Digestion Market Analysis
14.1.1 The World's Most Dynamic Renewable Energy Markets Are Located in South America
14.2 South America Anaerobic Digestion Market Attractiveness Index
14.3 South America Anaerobic Digestion Market by Country, 2022, 2027 & 2032 (US$ mn)
14.4 South America Anaerobic Digestion Market Forecast by Biogas Generation
14.5 South America Anaerobic Digestion Market Size Estimation and Forecast by Spending Type
14.6 South America Anaerobic Digestion Market Size Estimation and Forecast by Digester Type
14.7 South America Anaerobic Digestion Market Size Estimation and Forecast by Feedstock
14.8 South America Anaerobic Digestion Market Size Estimation and Forecast by End-users
14.9 South America Anaerobic Digestion Market Size Estimation and Forecast by Country
14.10 Brazil Market Analysis
14.10.1 Vinasse from Brazilian Sugarcane Biorefineries Was Tested For Anaerobic Digestion
14.10.2 Brazil Has a Very Varied Power Matrix Because it Has Hydrocarbon, Renewable and Nuclear Energy-Based Power Resources
14.10.3 Brazil Began Operating In 2020 with Over 400 Biogas Plants, Up 40 Percent Year on Average
14.11 Colombia Market Analysis
14.11.1 Colombia Has Adopted Several Strategies to Maximize the Use of Biomass as a Source of Energy
14.11.2 In Colombia, Multiple Entities Are Responsible for National Energy Policies
14.12 Rest of South America Market Analysis
14.12.1 Costa Rica is Known for Using Renewable Sources of Energy to Meet Overall Domestic Electricity Demand
15 Company Profiles
15.1 2G Energy GmbH
15.1.1 Company Snapshot
15.1.2 Company Overview
15.1.3 Financial Analysis
15.1.4 Product Benchmarking
15.2 Harvest Power, Inc
15.2.1 Company Snapshot
15.2.2 Company Overview
15.2.3 Product Benchmarking
15.3 Host Holding B.V.
15.3.1 Company Snapshot
15.3.2 Company Overview
15.3.3 Product Benchmarking
15.3.4 Strategic Outlook
15.4 Covanta Energy Corporation
15.4.1 Company Snapshot
15.4.2 Company Overview
15.4.3 Product Benchmarking
15.4.4 Strategic Outlook
15.5 Waterleau
15.5.1 Company Snapshot
15.5.2 Company Overview
15.5.3 Product Benchmarking
15.5.4 Strategic Outlook
15.6 WELTEC BIOPOWER GmbH
15.6.1 Company Snapshot
15.6.2 Company Overview
15.6.3 Product Benchmarking
15.6.4 Strategic Outlook
15.7 Organic Waste Systems (OWS), Inc
15.7.1 Company Snapshot
15.7.2 Company Overview
15.7.3 Product Benchmarking
15.7.4 Strategic Outlook
15.8 Anaergia Inc
15.8.1 Company Snapshot
15.8.2 Company Overview
15.8.3 Financial Analysis
15.8.4 Product Benchmarking
15.8.5 Strategic Outlook
15.9 CGG
15.9.1 Company Snapshot
15.9.2 Company Overview
15.9.3 Financial Analysis
15.9.4 Product Benchmarking
15.9.5 Strategic Outlook
15.10 PlanET Biogas Global
15.10.1 Company Snapshot
15.10.2 Company Overview
15.10.3 Product Benchmarking
15.11 Siemens AG
15.11.1 Company Snapshot
15.11.2 Company Overview
15.11.3 Financial Analysis
15.11.4 Product Benchmarking
15.11.5 Strategic Outlook
15.12 Schaumann BioEnergy GmbH
15.12.1 Company Snapshot
15.12.2 Company Overview
15.12.3 Product Benchmarking
15.13 Streisal GmbH
15.13.1 Company Snapshot
15.13.2 Company Overview
15.13.3 Product Benchmarking
16 Conclusion and Recommendations
16.1 Concluding Remarks from Visiongain
16.1.1 Renewed Efforts Have Been Undertaken for the Scaling-Up and Market Development of Domestic Level Biogas Projects in Asia
16.1.2 Anaerobic Digestion Technology Has Advanced Rapidly in Recent Years
16.1.3 The United Kingdom and the European Union Have Both Funded Numerous AD Projects Around the World
16.1.4 Numerous Waste-To-Biogas Plants Are Already Up and Running
16.1.5 Anaerobic Digestion is a Complex Reduction Process Involving a Number of Metabolic Processes
16.1.6 Any Successful Anaerobic Digestion System Depends on Reliable High Quality Supplies of Appropriate Feedstock
List of Tables
Table 1 Global Anaerobic Digestion Market Snapshot, 2022 & 2032 (US$ million, CAGR %)
Table 2 Global Anaerobic Digestion (AD) Market Forecast, 2022-2032 (USD Mn, AGR (%), CAGR (%)) (V-Shaped Recovery Scenario)
Table 3 Global Anaerobic Digestion (AD) Market by Region, 2022-2032 (USD Mn, AGR (%), CAGR (%)) (V-Shaped Recovery Scenario)
Table 4 Global Anaerobic Digestion (AD) Market Forecast, 2022-2032 (USD Mn, AGR (%), CAGR (%)) (W-Shaped Recovery Scenario)
Table 5 Global Anaerobic Digestion (AD) Market by Region, 2022-2032 (USD Mn, AGR (%), CAGR (%)) (W-Shaped Recovery Scenario)
Table 6 Global Anaerobic Digestion (AD) Market Forecast, 2022-2032 (USD Mn, AGR (%), CAGR (%)) (U-Shaped Recovery Scenario)
Table 7 Global Anaerobic Digestion (AD) Market by Region, 2022-2032 (USD Mn, AGR (%), CAGR (%)) (U-Shaped Recovery Scenario)
Table 8 Global Anaerobic Digestion (AD) Market Forecast, 2022-2032 (USD Mn, AGR (%), CAGR (%)) (L-Shaped Recovery Scenario)
Table 9 Global Anaerobic Digestion (AD) Market by Region, 2022-2032 (USD Mn, AGR (%), CAGR (%)) (L-Shaped Recovery Scenario)
Table 10 Global Anaerobic Digestion Market Forecast by Spending, 2022-2032 (USD Mn, AGR (%), CAGR (%), Cumulative)
Table 11 Global Anaerobic Digestion Market Forecast by Spending Type, 2022-2032 (USD Mn, AGR (%), CAGR (%), Cumulative)
Table 12 Global Anaerobic Digestion Market by Digester Type, 2022-2032 (m3/day, AGR (%), CAGR (%), Cumulative)
Table 13 Global Anaerobic Digestion Market by Feedstock, 2022-2032 (m3/day, AGR (%), CAGR (%), Cumulative)
Table 14 Global Anaerobic Digestion Market by End-Use, 2022-2032 (m3/day, AGR (%), CAGR (%), Cumulative)
Table 15 Global Anaerobic Digestion Market by Region, 2022-2032 (USD Million, AGR (%), CAGR (%), Cumulative)
Table 16 North America Anaerobic Digestion Market Forecast by Biogas Generation, 2022-2032 (m3/day, AGR (%), CAGR (%), Cumulative)
Table 17 North America Anaerobic Digestion Market Forecast by Spending, 2022-2032 (USD Mn, AGR (%), CAGR (%), Cumulative)
Table 18 North America Anaerobic Digestion Market Forecast by Spending Type, 2022-2032 (USD Mn, AGR (%), CAGR (%), Cumulative)
Table 19 North America Anaerobic Digestion Market by Digester Type, 2022-2032 (m3/day, AGR (%), CAGR (%), Cumulative)
Table 20 North America Anaerobic Digestion Market by Feedstock, 2022-2032 (m3/day, AGR (%), CAGR (%), Cumulative)
Table 21 North America Anaerobic Digestion Market by End-Use, 2022-2032 (m3/day, AGR (%), CAGR (%), Cumulative)
Table 22 North America Anaerobic Digestion Market by Country, 2022-2032 (m3/day, AGR (%), CAGR (%), Cumulative)
Table 23 US Anaerobic Digestion (AD) Market by Value, 2022-2032 (USD Mn, AGR (%), CAGR (%))
Table 24 US Anaerobic Digestion (AD) Market by Value, 2022-2032 (m3/day, AGR (%), CAGR (%))
Table 25 Canada Anaerobic Digestion (AD) Market by Value, 2022-2032 (USD Mn, AGR (%), CAGR (%))
Table 26 Canada Anaerobic Digestion (AD) Market by Value, 2022-2032 (m3/day, AGR (%), CAGR (%))
Table 27 Mexico Anaerobic Digestion (AD) Market by Value, 2022-2032 (USD Mn, AGR (%), CAGR (%))
Table 28 Mexico Anaerobic Digestion (AD) Market by Value, 2022-2032 (m3/day, AGR (%), CAGR (%))
Table 29 Europe Anaerobic Digestion (AD) Market by Region, 2022-2032 (USD Million, AGR (%), CAGR (%), Cumulative)
Table 30 Europe Anaerobic Digestion (AD) Market Forecast by Biogas Generation, 2022-2032 (m3/day, AGR (%), CAGR (%), Cumulative)
Table 31 Europe Anaerobic Digestion (AD) Market Forecast by Spending, 2022-2032 (USD Mn, AGR (%), CAGR (%), Cumulative)
Table 32 Europe Anaerobic Digestion (AD) Market Forecast by Spending Type, 2022-2032 (USD Mn, AGR (%), CAGR (%), Cumulative)
Table 33 Europe Anaerobic Digestion (AD) Market by Digester Type, 2022-2032 (m3/day, AGR (%), CAGR (%), Cumulative)
Table 34 Europe Anaerobic Digestion (AD) Market by Feedstock, 2022-2032 (m3/day, AGR (%), CAGR (%), Cumulative)
Table 35 Europe Anaerobic Digestion (AD) Market by End-Use, 2022-2032 (m3/day, AGR (%), CAGR (%), Cumulative)
Table 36 Europe Anaerobic Digestion (AD) Market by Country, 2022-2032 (m3/day, AGR (%), CAGR (%), Cumulative)
Table 37 Germany Anaerobic Digestion (AD) Market by Value, 2022-2032 (USD Mn, AGR (%), CAGR (%))
Table 38 Germany Anaerobic Digestion (AD) Market by Value, 2022-2032 (m3/day, AGR (%), CAGR (%))
Table 39 France Anaerobic Digestion (AD) Market by Value, 2022-2032 (USD Mn, AGR (%), CAGR (%))
Table 40 France Anaerobic Digestion (AD) Market by Value, 2022-2032 (m3/day, AGR (%), CAGR (%))
Table 41 UK Anaerobic Digestion (AD) Market by Value, 2022-2032 (USD Mn, AGR (%), CAGR (%))
Table 42 UK Anaerobic Digestion (AD) Market by Value, 2022-2032 (m3/day, AGR (%), CAGR (%))
Table 43 Netherlands Anaerobic Digestion (AD) Market by Value, 2022-2032 (USD Mn, AGR (%), CAGR (%))
Table 44 Netherlands Anaerobic Digestion (AD) Market by Value, 2022-2032 (m3/day, AGR (%), CAGR (%))
Table 45 Rest of Europe Anaerobic Digestion (AD) Market by Value, 2022-2032 (USD Mn, AGR (%), CAGR (%))
Table 46 Rest of Europe Anaerobic Digestion (AD) Market by Value, 2022-2032 (m3/day, AGR (%), CAGR (%))
Table 47 Asia-Pacific Anaerobic Digestion (AD) Market by Region, 2022-2032 (USD Million, AGR (%), CAGR (%), Cumulative)
Table 48 Asia-Pacific Anaerobic Digestion (AD) Market Forecast by Biogas Generation, 2022-2032 (m3/day, AGR (%), CAGR (%), Cumulative)
Table 49 Asia-Pacific Anaerobic Digestion (AD) Market Forecast by Spending, 2022-2032 (USD Mn, AGR (%), CAGR (%), Cumulative)
Table 50 Asia-Pacific Anaerobic Digestion (AD) Market Forecast by Spending Type, 2022-2032 (USD Mn, AGR (%), CAGR (%), Cumulative)
Table 51 Asia-Pacific Anaerobic Digestion (AD) Market by Digester Type, 2022-2032 (m3/day, AGR (%), CAGR (%), Cumulative)
Table 52 Asia-Pacific Anaerobic Digestion (AD) Market by Feedstock, 2022-2032 (m3/day, AGR (%), CAGR (%), Cumulative)
Table 53 Asia-Pacific Anaerobic Digestion (AD) Market by End-Use, 2022-2032 (m3/day, AGR (%), CAGR (%), Cumulative)
Table 54 Asia-Pacific Anaerobic Digestion (AD) Market by Country, 2022-2032 (m3/day, AGR (%), CAGR (%), Cumulative)
Table 55 China Anaerobic Digestion (AD) Market by Value, 2022-2032 (USD Mn, AGR (%), CAGR (%))
Table 56 China Anaerobic Digestion (AD) Market by Value, 2022-2032 (m3/day, AGR (%), CAGR (%))
Table 57 India Anaerobic Digestion (AD) Market by Value, 2022-2032 (USD Mn, AGR (%), CAGR (%))
Table 58 India Anaerobic Digestion (AD) Market by Value, 2022-2032 (m3/day, AGR (%), CAGR (%))
Table 59 Japan Anaerobic Digestion (AD) Market by Value, 2022-2032 (USD Mn, AGR (%), CAGR (%))
Table 60 Japan Anaerobic Digestion (AD) Market by Value, 2022-2032 (m3/day, AGR (%), CAGR (%))
Table 61 Australia Anaerobic Digestion (AD) Market by Value, 2022-2032 (USD Mn, AGR (%), CAGR (%))
Table 62 Australia Anaerobic Digestion (AD) Market by Value, 2022-2032 (m3/day, AGR (%), CAGR (%))
Table 63 Rest of Asia-Pacific Anaerobic Digestion (AD) Market by Value, 2022-2032 (USD Mn, AGR (%), CAGR (%))
Table 64 Rest of Asia-Pacific Anaerobic Digestion (AD) Market by Value, 2022-2032 (m3/day, AGR (%), CAGR (%))
Table 65 Middle East & Africa Anaerobic Digestion (AD) Market by Region, 2022-2032 (USD Million, AGR (%), CAGR (%), Cumulative)
Table 66 Middle East & Africa Anaerobic Digestion (AD) Market Forecast by Biogas Generation, 2022-2032 (m3/day, AGR (%), CAGR (%), Cumulative)
Table 67 Middle East & Africa Anaerobic Digestion (AD) Market Forecast by Spending, 2022-2032 (USD Mn, AGR (%), CAGR (%), Cumulative)
Table 68 Middle East & Africa Anaerobic Digestion (AD) Market Forecast by Spending Type, 2022-2032 (USD Mn, AGR (%), CAGR (%), Cumulative)
Table 69 Middle East & Africa Anaerobic Digestion (AD) Market by Digester Type, 2022-2032 (m3/day, AGR (%), CAGR (%), Cumulative)
Table 70 Middle East & Africa Anaerobic Digestion (AD) Market by Feedstock, 2022-2032 (m3/day, AGR (%), CAGR (%), Cumulative)
Table 71 Middle East & Africa Anaerobic Digestion (AD) Market by End-Use, 2022-2032 (m3/day, AGR (%), CAGR (%), Cumulative)
Table 72 Middle East & Africa Anaerobic Digestion (AD) Market by Country, 2022-2032 (m3/day, AGR (%), CAGR (%), Cumulative)
Table 73 Turkey Anaerobic Digestion (AD) Market by Value, 2022-2032 (USD Mn, AGR (%), CAGR (%))
Table 74 Turkey Anaerobic Digestion (AD) Market by Value, 2022-2032 (m3/day, AGR (%), CAGR (%))
Table 75 Saudi Arabia Anaerobic Digestion (AD) Market by Value, 2022-2032 (USD Mn, AGR (%), CAGR (%))
Table 76 Saudi Arabia Anaerobic Digestion (AD) Market by Value, 2022-2032 (m3/day, AGR (%), CAGR (%))
Table 77 South Africa Anaerobic Digestion (AD) Market by Value, 2022-2032 (USD Mn, AGR (%), CAGR (%))
Table 78 South Africa Anaerobic Digestion (AD) Market by Value, 2022-2032 (m3/day, AGR (%), CAGR (%))
Table 79 Israel Anaerobic Digestion (AD) Market by Value, 2022-2032 (USD Mn, AGR (%), CAGR (%))
Table 80 Israel Anaerobic Digestion (AD) Market by Value, 2022-2032 (m3/day, AGR (%), CAGR (%))
Table 81 Rest of MEA Anaerobic Digestion (AD) Market by Value, 2022-2032 (USD Mn, AGR (%), CAGR (%))
Table 82 Rest of MEA Anaerobic Digestion (AD) Market by Value, 2022-2032 (m3/day, AGR (%), CAGR (%))
Table 83 South America Anaerobic Digestion (AD) Market Forecast by Biogas Generation, 2022-2032 (m3/day, AGR (%), CAGR (%), Cumulative)
Table 84 South America Anaerobic Digestion (AD) Market Forecast by Spending, 2022-2032 (USD Mn, AGR (%), CAGR (%), Cumulative)
Table 85 South America Anaerobic Digestion (AD) Market Forecast by Spending Type, 2022-2032 (USD Mn, AGR (%), CAGR (%), Cumulative)
Table 86 South America Anaerobic Digestion (AD) Market by Digester Type, 2022-2032 (m3/day, AGR (%), CAGR (%), Cumulative)
Table 87 South America Anaerobic Digestion (AD) Market by Feedstock, 2022-2032 (m3/day, AGR (%), CAGR (%), Cumulative)
Table 88 South America Anaerobic Digestion (AD) Market by End-Use, 2022-2032 (m3/day, AGR (%), CAGR (%), Cumulative)
Table 89 South America Anaerobic Digestion (AD) Market by Country, 2022-2032 (m3/day, AGR (%), CAGR (%), Cumulative)
Table 90 Brazil Anaerobic Digestion (AD) Market by Value, 2022-2032 (USD Mn, AGR (%), CAGR (%))
Table 91 Brazil Anaerobic Digestion (AD) Market by Value, 2022-2032 (m3/day, AGR (%), CAGR (%))
Table 92 Colombia Anaerobic Digestion (AD) Market by Value, 2022-2032 (USD Mn, AGR (%), CAGR (%))
Table 93 Colombia Anaerobic Digestion (AD) Market by Value, 2022-2032 (m3/day, AGR (%), CAGR (%))
Table 94 Rest of South America Anaerobic Digestion (AD) Market by Value, 2022-2032 (USD Mn, AGR (%), CAGR (%))
Table 95 Rest of South America Anaerobic Digestion (AD) Market by Value, 2022-2032 (m3/day, AGR (%), CAGR (%))
Table 96 2G Energie: Key Details, (CEO, HQ, Revenue, Founded, No. of Employees, Company Type, Website, Business Segment)
Table 97 2G Energy : Product Benchmarking
Table 98 Harvest Power, Inc: Key Details, (CEO, HQ, Revenue, Founded, No. of Employees, Company Type, Website, Business Segment)
Table 99 Harvest Power, Inc: Product Benchmarking
Table 100 Host Holding : Key Details, (CEO, HQ, Revenue, Founded, No. of Employees, Company Type, Website, Business Segment)
Table 101 Host Holding: Product Benchmarking
Table 102 Host Holding: Strategic Outlook
Table 103 Covanta: Key Details, (CEO, HQ, Revenue, Founded, No. of Employees, Company Type, Website, Business Segment)
Table 104 Covanta: Product Benchmarking
Table 105 Covanta: Strategic Outlook
Table 106 Waterleau NV: Key Details, (CEO, HQ, Revenue, Founded, No. of Employees, Company Type, Website, Business Segment)
Table 107 Waterleau NV: Product Benchmarking
Table 108 Waterleau NV: Strategic Outlook
Table 109 WELTEC: Key Details, (CEO, HQ, Revenue, Founded, No. of Employees, Company Type, Website, Business Segment)
Table 110 WELTEC: Product Benchmarking
Table 111 WELTEC: Strategic Outlook
Table 112 OWS: Key Details, (CEO, HQ, Revenue, Founded, No. of Employees, Company Type, Website, Business Segment)
Table 113 OWS: Product Benchmarking
Table 114 OWS: Strategic Outlook
Table 115 Anaergia: Key Details, (CEO, HQ, Revenue, Founded, No. of Employees, Company Type, Website, Business Segment)
Table 116 Anaergia: Product Benchmarking
Table 117 Anaergia: Strategic Outlook
Table 118 CGG: Key Details, (CEO, HQ, Revenue, Founded, No. of Employees, Company Type, Website, Business Segment)
Table 119 CGG: Product Benchmarking
Table 120 CGG: Strategic Outlook
Table 121 PlanET: Key Details, (CEO, HQ, Revenue, Founded, No. of Employees, Company Type, Website, Business Segment)
Table 122 PlanET: Product Benchmarking
Table 123 Siemens AG: Key Details, (CEO, HQ, Revenue, Founded, No. of Employees, Company Type, Website, Business Segment)
Table 124 Siemens AG: Product Benchmarking
Table 125 Siemens AG: Strategic Outlook
Table 126 Schaumann BioEnergy: Key Details, (CEO, HQ, Revenue, Founded, No. of Employees, Company Type, Website, Business Segment)
Table 127 Schaumann BioEnergy: Product Benchmarking
Table 128 Streisal: Key Details, (CEO, HQ, Revenue, Founded, No. of Employees, Company Type, Website, Business Segment)
Table 129 Streisal: Product Benchmarking
List of Figures
Figure 1 Global Anaerobic Digestion Market Segmentation
Figure 2 Global Anaerobic Digestion Market Forecast by Region: Market Attractiveness Index
Figure 3 Global Anaerobic Digestion Market by Digester Type: Market Attractiveness Index
Figure 4 Global Anaerobic Digestion Market by Feedstock: Market Attractiveness Index
Figure 5 Global Anaerobic Digestion Market by End-users: Market Attractiveness Index
Figure 6 Global Anaerobic Digestion (AD) Market Forecast, 2022-2032 (USD Mn, AGR (%)) (V-Shaped Recovery Scenario)
Figure 7 Global Anaerobic Digestion (AD) Market Forecast by Region, 2022-2032 (USD Mn, AGR (%)) (V-Shaped Recovery Scenario)
Figure 8 Global Anaerobic Digestion (AD) Market Forecast, 2022-2032 (USD Mn, AGR (%)) (W-Shaped Recovery Scenario)
Figure 9 Global Anaerobic Digestion (AD) Market Forecast by Region, 2022-2032 (USD Mn, AGR (%)) (W-Shaped Recovery Scenario)
Figure 10 Global Anaerobic Digestion (AD) Market Forecast, 2022-2032 (USD Mn, AGR (%)) (U-Shaped Recovery Scenario)
Figure 11 Global Anaerobic Digestion (AD) Market Forecast by Region, 2022-2032 (USD Mn, AGR (%)) (U-Shaped Recovery Scenario)
Figure 12 Global Anaerobic Digestion (AD) Market Forecast by Region, 2022-2032 (USD Mn, AGR (%)) (L-Shaped Recovery Scenario)
Figure 13 Global Anaerobic Digestion (AD) Market Forecast by Region, 2022-2032 (USD Mn, AGR (%)) (L-Shaped Recovery Scenario)
Figure 1 Global Anaerobic Digestion Market Forecast by Spending 2022, 2027, 2032 (Revenue, CAGR%)
Figure 2 Global Anaerobic Digestion Market Share Forecast by Spending Type, 2022, 2032 (%)
Figure 3 Global Anaerobic Digestion Market Forecast by Spending, 2022-2032 (USD Mn, AGR (%), Cumulative)
Figure 4 Global Anaerobic Digestion Market Forecast by Spending Type, 2022-2032 (USD Mn, AGR (%), Cumulative)
Figure 5 Global Anaerobic Digestion Market Forecast by Digester Type 2022, 2027, 2032 (Revenue, CAGR%)
Figure 6 Global Anaerobic Digestion Market Share Forecast by Digester Type, 2022, 2032 (%)
Figure 7 Global Anaerobic Digestion Market by Digester Type, 2022-2032 (m3/day,AGR (%), Cumulative)
Figure 8 Global Anaerobic Digestion Market Forecast by Feedstock 2022, 2027, 2032 (Revenue, CAGR%)
Figure 9 Global Anaerobic Digestion Market Share Forecast by Feedstock, 2022, 2032 (%)
Figure 10 Global Anaerobic Digestion Market by Feedstock, 2022-2032 (m3/day, AGR (%), Cumulative)
Figure 11 Global Anaerobic Digestion Market Forecast by End-Use 2022, 2027, 2032 (Revenue, CAGR%)
Figure 12 Global Anaerobic Digestion Market Share Forecast by End-Use, 2022, 2032 (%)
Figure 13 Global Anaerobic Digestion Market by End-Use, 2022-2032 (m3/day, AGR (%), Cumulative)
Figure 14 Global Anaerobic Digestion Market Forecast by Region 2022, 2027, 2032 (Revenue, CAGR%)
Figure 15 Global Anaerobic Digestion Market Share Forecast by Region 2022, 2027, 2032(%)
Figure 16 Global Anaerobic Digestion Market by Region, 2022-2032 (USD Million, AGR (%), Cumulative)
Figure 17 North America Anaerobic Digestion Market Attractiveness Index
Figure 18 North America Anaerobic Digestion Market by Region, 2022, 2027 & 2032 (US$ million)
Figure 19 North America Anaerobic Digestion Market Forecast by Biogas Generation, 2022-2032 (m3/day, AGR (%), Cumulative)
Figure 20 North America Anaerobic Digestion Market Forecast by Spending, 2022-2032 (USD Mn, AGR (%), Cumulative)
Figure 21 North America Anaerobic Digestion Market Forecast by Spending Type, 2022-2032 (USD Mn, AGR (%), Cumulative)
Figure 22 North America Anaerobic Digestion Market Share Forecast by Spending Type, 2022 & 2032 (%)
Figure 23 North America Anaerobic Digestion Market by Digester Type, 2022-2032 (m3/day, AGR (%), Cumulative)
Figure 24 North America Anaerobic Digestion Market Share Forecast by Digester Type, 2022 & 2032 (%)
Figure 25 North America Anaerobic Digestion Market by Feedstock, 2022-2032 (m3/day, AGR (%), Cumulative
Figure 26 North America Anaerobic Digestion Market Share Forecast by Feedstock, 2022 & 2032 (%)
Figure 27 North America Anaerobic Digestion Market by End-Use, 2022-2032 (m3/day, AGR (%), Cumulative)
Figure 28 North America Anaerobic Digestion Market Share Forecast by End-users, 2022 & 2032 (%)
Figure 29 North America Anaerobic Digestion Market by Country, 2022-2032 (m3/day, AGR (%), Cumulative)
Figure 30 North America Anaerobic Digestion Market Share Forecast by Country, 2022 & 2032 (%)
Figure 31 US Anaerobic Digestion (AD) Market by Value, 2022-2032 (USD Mn, AGR (%))
Figure 32 US Anaerobic Digestion (AD) Market by Value, 2022-2032 (m3/day, AGR (%))
Figure 33 Canada Anaerobic Digestion (AD) Market by Value, 2022-2032 (USD Mn, AGR (%))
Figure 34 Canada Anaerobic Digestion (AD) Market by Value, 2022-2032 (m3/day, AGR (%))
Figure 35 Mexico Anaerobic Digestion (AD) Market by Value, 2022-2032 (USD Mn, AGR (%))
Figure 36 Mexico Anaerobic Digestion (AD) Market by Value, 2022-2032 (m3/day, AGR (%))
Figure 37 Europe Anaerobic Digestion (AD) Market by Region, 2022-2032 (USD Million, AGR (%)), Cumulative)
Figure 38 Europe Anaerobic Digestion Market Attractiveness Index
Figure 39 Europe Anaerobic Digestion Market by Region, 2022, 2027 & 2032 (US$ million)
Figure 40 Europe Anaerobic Digestion (AD) Market Forecast by Biogas Generation, 2022-2032 (m3/day, AGR (%)), Cumulative)
Figure 41 Europe Anaerobic Digestion (AD) Market Forecast by Spending, 2022-2032 (USD Mn, AGR (%)), Cumulative)
Figure 42 Europe Anaerobic Digestion (AD) Market Forecast by Spending Type, 2022-2032 (USD Mn, AGR (%)), Cumulative)
Figure 43 Europe Anaerobic Digestion Market Share Forecast by Spending Type, 2022 & 2032 (%)
Figure 44 Europe Anaerobic Digestion (AD) Market by Digester Type, 2022-2032 (m3/day, AGR (%)), Cumulative)
Figure 45 Europe Anaerobic Digestion Market Share Forecast by Digester Type, 2022 & 2032 (%)
Figure 46 Europe Anaerobic Digestion (AD) Market by Feedstock, 2022-2032 (m3/day, AGR (%)), Cumulative)
Figure 47 Europe Anaerobic Digestion Market Share Forecast by Feedstock, 2022 & 2032 (%)
Figure 48 Europe Anaerobic Digestion (AD) Market by End-Use, 2022-2032 (m3/day, AGR (%)), Cumulative)
Figure 49 Europe Anaerobic Digestion Market Share Forecast by End-users, 2022 & 2032 (%)
Figure 50 Europe Anaerobic Digestion (AD) Market by Country, 2022-2032 (m3/day, AGR (%)), Cumulative)
Figure 51 Europe Anaerobic Digestion Market Share Forecast by Country, 2022 & 2032 (%)
Figure 52 Germany Anaerobic Digestion (AD) Market by Value, 2022-2032 (USD Mn, AGR (%))
Figure 53 Germany Anaerobic Digestion (AD) Market by Value, 2022-2032 (m3/day, AGR (%))
Figure 54 France Anaerobic Digestion (AD) Market by Value, 2022-2032 (USD Mn, AGR (%))
Figure 55 France Anaerobic Digestion (AD) Market by Value, 2022-2032 (m3/day, AGR (%))
Figure 56 UK Anaerobic Digestion (AD) Market by Value, 2022-2032 (USD Mn, AGR (%))
Figure 57 UK Anaerobic Digestion (AD) Market by Value, 2022-2032 (m3/day, AGR (%))
Figure 58 Netherlands Anaerobic Digestion (AD) Market by Value, 2022-2032 (USD Mn, AGR (%))
Figure 59 Netherlands Anaerobic Digestion (AD) Market by Value, 2022-2032 (m3/day, AGR (%))
Figure 60 Rest of Europe Anaerobic Digestion (AD) Market by Value, 2022-2032 (USD Mn, AGR (%))
Figure 61 Rest of Europe Anaerobic Digestion (AD) Market by Value, 2022-2032 (m3/day, AGR (%))
Figure 62 Asia-Pacific Anaerobic Digestion (AD) Market by Region, 2022-2032 (USD Million, AGR (%)), Cumulative)
Figure 63 Asia-Pacific Anaerobic Digestion Market Attractiveness Index
Figure 64 Asia-Pacific Anaerobic Digestion Market by Region, 2022, 2027 & 2032 (US$ million)
Figure 65 Asia-Pacific Anaerobic Digestion (AD) Market Forecast by Biogas Generation, 2022-2032 (m3/day, AGR (%), Cumulative)
Figure 66 Asia-Pacific Anaerobic Digestion (AD) Market Forecast by Spending, 2022-2032 (USD Mn, AGR (%),Cumulative)
Figure 67 Asia-Pacific Anaerobic Digestion (AD) Market Forecast by Spending Type, 2022-2032 (USD Mn, AGR (%), Cumulative)
Figure 68 Asia-Pacific Anaerobic Digestion Market Share Forecast by Spending Type, 2022 & 2032 (%)
Figure 69 Asia-Pacific Anaerobic Digestion (AD) Market by Digester Type, 2022-2032 (m3/day, AGR (%), Cumulative)
Figure 70 Asia-Pacific Anaerobic Digestion Market Share Forecast by Digester Type, 2022 & 2032 (%)
Figure 71 Asia-Pacific Anaerobic Digestion (AD) Market by Feedstock, 2022-2032 (m3/day, AGR (%), Cumulative)
Figure 72 Asia-Pacific Anaerobic Digestion Market Share Forecast by Feedstock, 2022 & 2032 (%)
Figure 73 Asia-Pacific Anaerobic Digestion (AD) Market by End-Use, 2022-2032 (m3/day, AGR (%), Cumulative)
Figure 74 Asia-Pacific Anaerobic Digestion Market Share Forecast by End-users, 2022 & 2032 (%)
Figure 75 Asia-Pacific Anaerobic Digestion (AD) Market by Country, 2022-2032 (m3/day, AGR (%), Cumulative)
Figure 76 Asia-Pacific Anaerobic Digestion Market Share Forecast by Country, 2022 & 2032 (%)
Figure 77 China Anaerobic Digestion (AD) Market by Value, 2022-2032 (USD Mn, AGR (%))
Figure 78 China Anaerobic Digestion (AD) Market by Value, 2022-2032 (m3/day, AGR (%))
Figure 79 India Anaerobic Digestion (AD) Market by Value, 2022-2032 (USD Mn, AGR (%))
Figure 80 India Anaerobic Digestion (AD) Market by Value, 2022-2032 (m3/day, AGR (%))
Figure 81 Japan Anaerobic Digestion (AD) Market by Value, 2022-2032 (USD Mn, AGR (%))
Figure 82 Japan Anaerobic Digestion (AD) Market by Value, 2022-2032 (m3/day, AGR (%))
Figure 83 Australia Anaerobic Digestion (AD) Market by Value, 2022-2032 (USD Mn, AGR (%))
Figure 84 Australia Anaerobic Digestion (AD) Market by Value, 2022-2032 (m3/day, AGR (%))
Figure 85 Rest of Asia-Pacific Anaerobic Digestion (AD) Market by Value, 2022-2032 (USD Mn, AGR (%))
Figure 86 Rest of Asia-Pacific Anaerobic Digestion (AD) Market by Value, 2022-2032 (m3/day, AGR (%))
Figure 87 Middle East & Africa Anaerobic Digestion (AD) Market by Region, 2022-2032 (USD Million, AGR (%), Cumulative)
Figure 88 Middle East & Africa Anaerobic Digestion Market Attractiveness Index
Figure 89 Middle East & Africa Anaerobic Digestion Market by Region, 2022, 2027 & 2032 (US$ million)
Figure 90 Middle East & Africa Anaerobic Digestion (AD) Market Forecast by Biogas Generation, 2022-2032 (m3/day, AGR (%), Cumulative)
Figure 91 Middle East & Africa Anaerobic Digestion (AD) Market Forecast by Spending, 2022-2032 (USD Mn, AGR (%), Cumulative)
Figure 92 Middle East & Africa Anaerobic Digestion (AD) Market Forecast by Spending Type, 2022-2032 (USD Mn, AGR (%), Cumulative)
Figure 93 Middle East & Africa Anaerobic Digestion Market Share Forecast by Spending Type, 2022 & 2032 (%)
Figure 94 Middle East & Africa Anaerobic Digestion (AD) Market by Digester Type, 2022-2032 (m3/day, AGR (%), Cumulative)
Figure 95 Middle East & Africa Anaerobic Digestion Market Share Forecast by Digester Type, 2022 & 2032 (%)
Figure 96 Middle East & Africa Anaerobic Digestion (AD) Market by Feedstock, 2022-2032 (m3/day, AGR (%), Cumulative)
Figure 97 Middle East & Africa Anaerobic Digestion Market Share Forecast by Feedstock, 2022 & 2032 (%)
Figure 98 Middle East & Africa Anaerobic Digestion (AD) Market by End-Use, 2022-2032 (m3/day, AGR (%), Cumulative)
Figure 99 Middle East & Africa Anaerobic Digestion Market Share Forecast by End-users, 2022 & 2032 (%)
Figure 100 Middle East & Africa Anaerobic Digestion (AD) Market by Country, 2022-2032 (m3/day, AGR (%), Cumulative)
Figure 101 Middle East & Africa Anaerobic Digestion Market Share Forecast by Country, 2022 & 2032 (%)
Figure 102 Turkey Anaerobic Digestion (AD) Market by Value, 2022-2032 (USD Mn, AGR (%))
Figure 103 Turkey Anaerobic Digestion (AD) Market by Value, 2022-2032 (m3/day, AGR (%))
Figure 104 Saudi Arabia Anaerobic Digestion (AD) Market by Value, 2022-2032 (USD Mn, AGR (%))
Figure 105 Saudi Arabia Anaerobic Digestion (AD) Market by Value, 2022-2032 (m3/day, AGR (%))
Figure 106 South Africa Anaerobic Digestion (AD) Market by Value, 2022-2032 (USD Mn, AGR (%))
Figure 107 South Africa Anaerobic Digestion (AD) Market by Value, 2022-2032 (m3/day, AGR (%))
Figure 108 Israel Anaerobic Digestion (AD) Market by Value, 2022-2032 (USD Mn, AGR (%))
Figure 109 Israel Anaerobic Digestion (AD) Market by Value, 2022-2032 (m3/day, AGR (%))
Figure 110 Rest of MEA Anaerobic Digestion (AD) Market by Value, 2022-2032 (USD Mn, AGR (%))
Figure 111 Rest of MEA Anaerobic Digestion (AD) Market by Value, 2022-2032 (m3/day, AGR (%))
Figure 112 South America Anaerobic Digestion Market Attractiveness Index
Figure 113 South America Anaerobic Digestion Market by Region, 2022, 2027 & 2032 (US$ million)
Figure 114 South America Anaerobic Digestion (AD) Market Forecast by Biogas Generation, 2022-2032 (m3/day, AGR (%), Cumulative)
Figure 115 South America Anaerobic Digestion (AD) Market Forecast by Spending, 2022-2032 (USD Mn, AGR (%), Cumulative)
Figure 116 South America Anaerobic Digestion (AD) Market Forecast by Spending Type, 2022-2032 (USD Mn, AGR (%), Cumulative)
Figure 117 South America Anaerobic Digestion Market Share Forecast by Spending Type, 2022 & 2032 (%)
Figure 118 South America Anaerobic Digestion (AD) Market by Digester Type, 2022-2032 (m3/day, AGR (%), Cumulative)
Figure 119 South America Anaerobic Digestion Market Share Forecast by Digester Type, 2022 & 2032 (%)
Figure 120 South America Anaerobic Digestion (AD) Market by Feedstock, 2022-2032 (m3/day, AGR (%), Cumulative)
Figure 121 South America Anaerobic Digestion Market Share Forecast by Feedstock, 2022 & 2032 (%)
Figure 122 South America Anaerobic Digestion (AD) Market by End-Use, 2022-2032 (m3/day, AGR (%), Cumulative)
Figure 123 South America Anaerobic Digestion Market Share Forecast by End-users, 2022 & 2032 (%)
Figure 124 South America Anaerobic Digestion (AD) Market by Country, 2022-2032 (m3/day, AGR (%), Cumulative)
Figure 125 South America Anaerobic Digestion Market Share Forecast by Country, 2022 & 2032 (%)
Figure 126 Brazil Anaerobic Digestion (AD) Market by Value, 2022-2032 (USD Mn, AGR (%))
Figure 127 Brazil Anaerobic Digestion (AD) Market by Value, 2022-2032 (m3/day, AGR (%))
Figure 128 Colombia Anaerobic Digestion (AD) Market by Value, 2022-2032 (USD Mn, AGR (%))
Figure 129 Colombia Anaerobic Digestion (AD) Market by Value, 2022-2032 (m3/day, AGR (%))
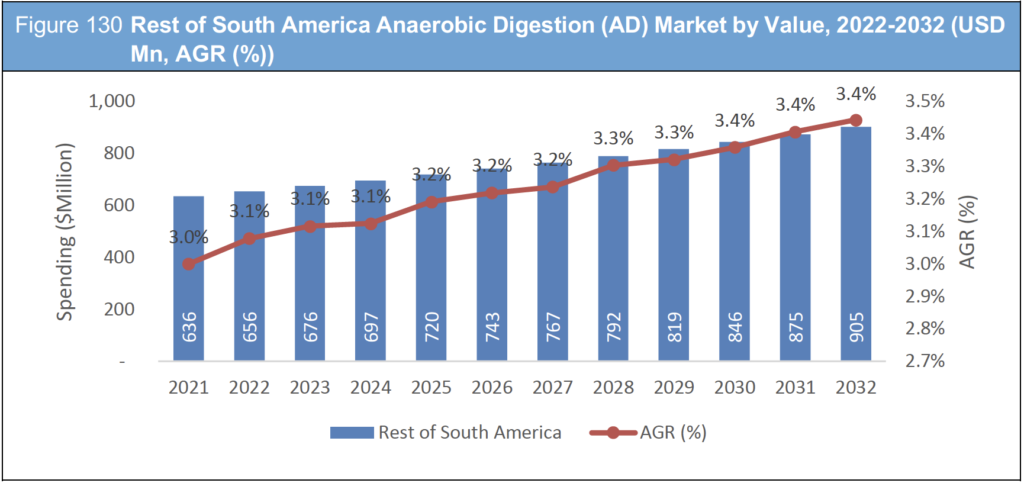
Figure 130 Rest of South America Anaerobic Digestion (AD) Market by Value, 2022-2032 (USD Mn, AGR (%))
Figure 131 Rest of South America Anaerobic Digestion (AD) Market by Value, 2022-2032 (m3/day, AGR (%))
Figure 132 2G Energy : Net Revenue, 2017-2021 (US$ million, AGR%)
Figure 133 2G Energy : Gross Profit, 2017-2021 (US$ million, AGR%)
Figure 134 2G Energy : Net Profit 2017-2021 (US$ million, AGR%)
Figure 135 2G Energy : EBITDA, 2017-2021 (US$ million, AGR%)
Figure 136 Anaergia: Net Revenue, 2017-2021 (US$ million, AGR%)
Figure 137 Anaergia: Gross Profit, 2017-2021 (US$ million, AGR%)
Figure 138 Anaergia: Net Profit 2017-2021 (US$ million, AGR%)
Figure 139 Anaergia: EBITDA, 2017-2021 (US$ million, AGR%)
Figure 140 CGG: Net Revenue, 2017-2021 (US$ million, AGR%)
Figure 141 CGG: Gross Profit, 2017-2021 (US$ million, AGR%)
Figure 142 CGG: Net Profit 2017-2021 (US$ million, AGR%)
Figure 143 CGG: EBITDA, 2017-2021 (US$ million, AGR%)
Figure 144 Siemens AG: Net Revenue, 2017-2021 (US$ million, AGR%)
Figure 145 Siemens AG: Gross Profit, 2017-2021 (US$ million, AGR%)
Figure 146 Siemens AG: Net Profit 2017-2021 (US$ million, AGR%)
Figure 147 Siemens AG: EBITDA, 2017-2021 (US$ million, AGR%)
List of Companies Profiled in the report
2G Energy GmbH
Anaergia Inc.
CGG
Covanta Energy Corporation
Harvest Power, Inc.
Host Holding B.V.
Organic Waste Systems (OWS), Inc.
PlanET Biogas Global
Schaumann BioEnergy GmbH
Siemens AG
Streisal GmbH
Waterleau Group NV
WELTEC BIOPOWER GmbH
List of Other Companies Mentioned in the report
Acti-Zyme Products Ltd.
Addinol Lube Oil GmbH
Adnams Bio Energy Ltd
AgPower Group, LLC
Agraferm Technologies AG
AGreen Energy (AGE)
Agrivert Ltd
All Power Labs
All Waste Services Ltd
Anaergia Inc
Applied Technologies, Inc.
Aprovis Energy Systems GmBH
AQUA Engineers, Inc.
Arisdyne Systems
Avant Energy
Awite Bioenergie GmbH
Barfoot Energy Projects Ltd
Bauer North America
BDI - BioEnergy International AG
BGreen Energy (BGE)
Big Ox Energy
Bigadan A/S
BioCycle
BioEarth Energy
Bio-en Power Inc.
BIOFerm Energy Systems
Biogas Direct, LLC
Biogas Energy Partners
Biogas Recovery in the Agricultural Sector
Biogas Researchers Inc
Biogest
Biogest Energie un Wassertechnik GmbH
Bio-Terre Systems, Inc.
Blue Electron
Boerger, LLC
BTA International GmbH
BTS Biogas Srl/GmbH
California Bioenergy LLC
Cambi, Inc.
Camco Clean Energy
Cargill, Inc.
CG Schmidt, LLC.
CH Four Biogas, LLC
Clean Energy Fuels
Clean Fuel Partners, LLC
Clean Methane Systems LLC
ClearCove Systems
Clearfleau Limited
Cory Environmental Ltd
Covanta Energy Corporation
Covanta Holding Corporation
DCO Energy
DESOTEC
Deutches BiomassForschungsZentrum GmbH
DFI Dairy Industry Task Force on digesters
Digested Organics LLC
DODA USA, Inc
DVO, Inc.
Eco Sustainable Solutions Ltd
EcoEngineers
Ecomembrane LLC
Egmere Energy Ltd
Emerald Biogas Ltd
Energy 2001 Inc
Entec Biogas USA
entice Biogas USA
Environmental Fabrics, Inc.
Environmental Management Group International, Inc. (EMG)
EnviTec Biogas USA, Inc.
EUROTEC WTT
Evobios
Evolution of Biogas Systems
Evonik Industries
Exergy New Energy
Fernbrook Bio
FirmGreen, Inc.
Future Biogas
Gasunie
GE Jenbacher
Geomembrane Technologies, Inc. (GTI)
Governor’s Inter-Agency Bioenergy Working Group
GrDF
Green Energy Solutions
Greenlane Biogas
Greenville Energy
GWE Biogas
Hallwick Energy
Harvest Power, Inc
Himark BioGas
Hitachi Zosen Inova U.S.A. LLC
HRS Heat Exchangers
IES Biogas
Industrial & Environmental Concepts, Inc. (IEC)
Inland Power Group
Institute for Biogas, Waste Management & Energy
Interstate Power Systems, Inc.
Invite Biogas USA, Inc.
Kurtz Bros., Inc
KWS SAAT SE
Landwarme GmbH
Liquid Dynamics Corporation
Local Generation Ltd
Malmberg Water AB
MT Energie GmbH
Northern Biogas
Organic Waste Systems (OWS), Inc.
Oxford Renewable Energy Ltd
Pacific Gas and Electric (PG & E)
Parker Hannifin Corporation
Parker Hannifin GmbH
Pentair Haffmans
Pharmer Engineering
Phoenix Energy
PlanET Biogas USA
Quasar Energy group
RCM International LLC
Regenis
Ringler Energy
Rio Tinto plc
R-Qubed Energy
Sattler AG
Schaumann BioEnergy GmbH
Schmack Biogas GmbH
Serge Ferrari S.A.S.
Shanks Waste Management
Siemens Industry, Inc.
Sierra Energy
Southern Californian Gas
Streisal GmbH
Subsea 7 SA
Tamar Energy
The Evolution of Biogas Systems (Evobios)
Tiry Engineering, Inc.
TNO
U.S. Biogas LLC
UEM Inc.
Unilever
Universal Sanitary Equipment Manufacturing Company (USEMCO)
UTS Bioenergy
Vanguard Renewables
Veolia
Veolia Biothane Anaerobic Treatment
Vulcan Renewables
Wal-Mart
Waste Management, Inc.
West Biofuels
Weston & Sampson
Williams Engineering Associates
Wilson Engineering Services, PC
Xylem Water Solutions
Yield Energy, Inc.
Zero Waste Energy LLC
List of Associations Mentioned in the Report
American Biogas Council (ABC)
Anaerobic Digestion and Bioresources Association (ADBA)
Anaerobic Digestion Development Centre (ADDC)
Austrian Environment Agency
Bioenergy Association of California (BAC)
British Anaerobic Digestion Association
California Energy Commission
Californian Air Resources Board
Canadian Biogas Association (CBA)
Climate Change Select Committee
Colgate University
Commonwealth of Independent States (CIS)
Department for Environment, Food & Rural Affairs (DEFRA)
Department of Energy and Climate Change (DECC)
Energie Méthanisation Autonomie Azote (EMAA)
Energy Information Administration (EIA)
European Biogas Association (EBA)
European Union (EU)
European Union Environment Agency (EUEA)
Fraunhofer Institute for Wind Energy and Energy System Technology IWES
French Environment Agency
German Centre for Bioenergy Research (DBFZ)
Global Methane Initiative (GMI)
Groceries Manufacturers Association
HM Treasury
Institute for Biogas, Waste Management and Energy
International Energy Administration (IEA)
International Methane to Markets Partnership (IMMP)
Italian Agency for Environmental Protection and for Technical Services (APAT)
Landfill Methane Outreach Programme (LMOP)
National Waste & Recycling Association (NWRA)
Public Utilities Commission (PUC)
Solid Waste Association of North America (SWANA)
State of Oregon’s Department of Environmental Quality
The Anaerobic Digestion and Bioresources Association (ADBA)
The Bioenergy Association of California (BAC)
The California Association of Sanitation Agencies
The Climate Trust
The Institute for Biogas
The University of California
The US Department of Agriculture (USDA)
UK Anaerobic Digestion and Bioresources Association (ADBA)
UK Environment Agency (EA)
United Nations – Convention on Climate Change (UNFCCC)
United Nations (UN)
 Market Report 2022-2032")