The Energy Storage Technologies (EST) Market Report 2022-2032: This report will prove invaluable to leading firms striving for new revenue pockets if they wish to better understand the industry and its underlying dynamics. It will be useful for companies that would like to expand into different industries or to expand their existing operations in a new region.
Governments from All Across the World Are Taking Action to Promote Energy Storage
The storage industry is primed for rapid expansion. Owners of energy storage systems will be able to generate income from an increasing number of sources thanks to new market regulations, including postponed transmission and distribution upgrades, the incorporation of intermittent resources, decreased demand or increased generating capacity to handle peak loads, the offering of ancillary services, and improved grid reliability and resiliency. Storage used to fit like a square peg into a round hole called historical regulation. The federal regulation that is now in place for wholesale power sales and transmission in interstate commerce was created for a world that had any meaningful energy storage.
Even while pumped-storage hydroelectricity has been around for a while, it differs significantly from more recent storage technologies like batteries, flywheels, and thermal energy storage projects in terms of its properties. Governments from all across the world are taking action to promote storage. The US Department of Energy’s focused loan and incentive programmes, as well as the Federal Energy Regulatory Commission’s initiatives to open up a road to participation in the wholesale market, have helped storage on a global scale.
Deal Between BMW Group and Our Next Energy (ONE), an Energy Storage Business
The deal between BMW Group and Our Next Energy (ONE), an energy storage business with headquarters in Michigan, calls for the integration of ONE’s Gemini Dual-Chemistry battery technology into the BMW iX electric SUV. According to ONE, the BMW iX will be able to go 600 miles (965 kilometres) on a single charge because to its exclusive long-range Gemini technology, which it first showed in January 2022 on a Tesla Model S that travelled 752 miles on a single charge. The iX prototype car, which is expected to be finished by the end of the year, will have nearly double the range of the standard BMW iX xDrive50, which has the greatest EPA-rated range in the lineup at 324 miles (521 kilometers). Through its Silicon Valley-based venture capital arm BMW I Ventures, which recently oversaw a $65M investment round, BMW is a shareholder in ONE.
What Questions Should You Ask before Buying a Market Research Report?
• How is the energy storage technologies market evolving?
• What is driving and restraining the energy storage technologies market?
• How will each energy storage technologies submarket segment grow over the forecast period and how much revenue will these submarkets account for in 2032?
• How will the market shares for each energy storage technologies submarket develop from 2022 to 2032?
• What will be the main driver for the overall market from 2022 to 2032?
• Will leading energy storage technologies markets broadly follow the macroeconomic dynamics, or will individual national markets outperform others?
• How will the market shares of the national markets change by 2032 and which geographical region will lead the market in 2032?
• Who are the leading players and what are their prospects over the forecast period?
• What are the energy storage technologies projects for these leading companies?
• How will the industry evolve during the period between 2020 and 2032? What are the implications of energy storage technologies projects taking place now and over the next 10 years?
• Is there a greater need for product commercialisation to further scale the energy storage technologies market?
• Where is the energy storage technologies market heading and how can you ensure you are at the forefront of the market?
• What are the best investment options for new product and service lines?
• What are the key prospects for moving companies into a new growth path and C-suite?
You need to discover how this will impact the energy storage technologies market today, and over the next 10 years:
• Our 316-page report provides 194 tables and 189 charts/graphs exclusively to you.
• The report highlights key lucrative areas in the industry so you can target them – NOW.
• It contains in-depth analysis of global, regional and national sales and growth.
• It highlights for you the key successful trends, changes and revenue projections made by your competitors.
This report tells you TODAY how the energy storage technologies market will develop in the next 10 years, and in line with the variations in COVID-19 economic recession and bounce. This market is more critical now than at any point over the last 10 years.
The report delivers exclusive COVID-19 variations and economic data specific to your market.
To access the data contained in this document please email contactus@visiongain.com
Forecasts to 2032 and other analyses reveal commercial prospects
• In addition to revenue forecasting to 2032, our new study provides you with recent results, growth rates, and market shares.
• You will find original analyses, with business outlooks and developments.
• Discover qualitative analyses (including market dynamics, drivers, opportunities, restraints and challenges), cost structure, impact of rising energy storage technologies prices and recent developments.
This report includes data analysis and invaluable insight into how COVID-19 will affect the industry and your company. Four COVID-19 recovery patterns and their impact, namely, “V”, “L”, “W” and “U” are discussed in this report.
Segments Covered in the Report
Market Segment by Application
• Stationary Energy Storage Application
• Transportation Energy Storage Application
Market Segment by Stationary Type
• Industrial and Military Use
• Grid-Related-Utility
• Grid-Related-Residential
Market Segment by Utility Type
• Ancillary Services
• Peaking Capacity
• Energy Shifting
• Transmission & Distribution Level
Market Segment by Industrial Type
• Uninterruptible Power Source (UPS) + Data
• Telecom Backup Power
• Air Conditioning/ Refrigeration
• Hydrogen Refueling Stations
• Other Industrial/Military Uses
Market Segment by Technology
• Pumped Storage Hydropower
• Lithium-ion Batteries
• Lead–acid Batteries
• Compressed-Air Energy Storage (CAES)
• Redox Flow Batteries (RFBs)
• Other Technologies

In addition to the revenue predictions for the overall world market and segments, you will also find revenue forecasts for four regional and 20 leading national markets:
North America
• U.S.
• Canada
Europe
• Germany
• Spain
• United Kingdom
• France
• Italy
• Rest of Europe
Asia Pacific
• China
• Japan
• India
• Australia
• South Korea
• Rest of Asia Pacific
Middle East & Africa
• Turkey
• Brazil
• Saudi Arabia
• South Africa
• Rest of Middle East & Africa
South America
• Brazil
• Mexico
• Rest of South America
Need industry data? Please contact us today.
The report also includes profiles and for some of the leading companies in the Energy Storage Technologies Market, 2022 to 2032, with a focus on this segment of these companies’ operations.
Leading companies and the potential for market growth
• Altair Nanotechnologies
• Eguana Technologies Inc.
• Electrovaya Inc.,
• Exide Industries Limited
• Fluence Energy, Inc.
• Furukawa Battery Co., Ltd.
• General Electric Company
• Langley Holdings plc (Langley)
• LG Chem Ltd
• Samsung SDI Co Ltd
• Schneider Electric SE
• Showa Denko K.K.
• SK Holdings Co Ltd,
• SMA Solar Technology AG
• Tata Power Company Limited
Overall world revenue for Energy Storage Technologies Market, 2022 to 2032 in terms of value the market will surpass US$14,380 million in 2022, our work calculates. We predict strong revenue growth through to 2032. Our work identifies which organizations hold the greatest potential. Discover their capabilities, progress, and commercial prospects, helping you stay ahead.
How will the Energy Storage Technologies Market, 2022 to 2032 report help you?
In summary, our 316-page report provides you with the following knowledge:
• Revenue forecasts to 2032 for Energy Storage Technologies Market, 2022 to 2032 Market, with forecasts for application, stationary type, industrial type, technology and company size, each forecast at a global and regional level – discover the industry’s prospects, finding the most lucrative places for investments and revenues.
• Revenue forecasts to 2032 for four regional and 20 key national markets – See forecasts for the Energy Storage Technologies Market, 2022 to 2032 market in North America, Europe, Asia-Pacific and LAMEA. Also forecasted is the market in the US, Canada, Mexico, Brazil, Germany, France, UK, Italy, China, India, Japan, and Australia among other prominent economies.
• Prospects for established firms and those seeking to enter the market – including company profiles for 15 of the major companies involved in the Energy Storage Technologies Market, 2022 to 2032.
Find quantitative and qualitative analyses with independent predictions. Receive information that only our report contains, staying informed with invaluable business intelligence.
Information found nowhere else
With our new report, you are less likely to fall behind in knowledge or miss out on opportunities. See how our work could benefit your research, analyses, and decisions. Visiongain’s study is for everybody needing commercial analyses for the Energy Storage Technologies Market, 2022 to 2032, market-leading companies. You will find data, trends and predictions.
To access the data contained in this document please email contactus@visiongain.com
Buy our report today Energy Storage Technologies (EST) Market Report 2022-2032: Forecasts by Application (Stationary Energy Storage, Transportation Energy Storage), by Stationary Type (Industrial and Military Use, Grid-Related-Utility, Grid-Related-Residential), by Utility Type (Ancillary Services, Peaking Capacity, Energy Shifting, Transmission & Distribution Level), by Industrial Type (Uninterruptible Power Source (UPS) + Data, Telecom Backup Power, Air Conditioning/Refrigeration, Hydrogen Refuelling Stations, Other Industrial/Military Uses), by Technology (Pumped Storage Hydropower, Lithium-ion Batteries, Lead–acid Batteries, Compressed-Air Energy Storage (CAES), Redox Flow Batteries (RFBs), Other) AND Regional and Leading National Market Analysis PLUS Analysis of Leading Companies AND COVID-19 Impact and Recovery Pattern Analysis. Avoid missing out by staying informed – order our report now.
Visiongain is a trading partner with the US Federal Government
CCR Ref number: KD4R6
Do you have any custom requirements we can help you with? Any need for a specific country, geo region, market segment or specific company information? Contact us today, we can discuss your needs and see how we can help: contactus@visiongain.com
1. Report Overview
1.1 Objectives of the Study
1.2 Introduction to Energy Storage Market
1.2.1 Volvo Energy Made a $4.7 Million Investment in a Battery Energy Storage Company in Newcastle
1.2.2 The Construction of KOREPlex, a $1.25 billion Gigafactory in Buckeye, Arizona
1.3 What this Report Delivers
1.4 Why you Should Read this Report
1.5 Key Questions Answered by this Analytical Report Include:
1.6 Who is this Report for?
1.7 Methodology
1.7.1 Market Definitions
1.7.2 Market Evaluation & Forecasting Methodology
1.7.3 Data Validation
1.8 Frequently Asked Questions (FAQs)
1.9 Associated Visiongain Reports
1.10 About Visiongain
2 Executive Summary
3 Premium Insights
3.1 Geographical Snapshot: Global Energy Storage Market
3.1.1 Construction of Two Solar Projects in California Has Been Approved by the Biden-Harris Administration
3.2 Application Segment: Market Attractiveness Index
3.3 Stationary Type Segment: Market Attractiveness Index
3.3.1 Pre-orders for Toyota's O-Uchi Kyuden System Have Begun
3.4 Utility Type Segment: Market Attractiveness Index
3.5 Industrial Type Segment: Market Attractiveness Index
3.6 Technology Segment: Market Attractiveness Index
4 Market Overview
4.1 Key Findings
4.2 Market Dynamics
4.2.1 Market Driving Factors
4.2.2 Market Restraining Factors
4.2.3 Market Opportunities
4.3 COVID-19 Impact Analysis
4.3.1 “V-Shaped Recovery”
4.3.2 “U-Shaped Recovery”
4.3.3 “W-Shaped Recovery”
4.3.4 “L-Shaped Recovery”
4.4 Porter’s Five Forces Analysis
4.4.1 Supplier Power
4.4.2 Buyer Power
4.4.3 Competitive Rivalry
4.4.4 Threat from Substitutes
4.4.5 Threat of New Entrants
4.5 PESTLE Analysis
4.5.1 Political Factors
4.5.2 Economic Factors
4.5.3 Social Factors
4.5.4 Technological Factors
4.5.5 Environment Factors
4.6 Recent Developments in the Market
4.6.1 The Planned Goldendale Energy Storage Project in Klickitat County
4.6.2 CleanBC to Connect a Battery Energy Storage System (BESS) to the Nelson Hydro Grid
4.6.3 Deal Between BMW Group and Our Next Energy (ONE), an Energy Storage Business
4.6.4 The East Bay Community Energy Budget is Worth $15 Million
4.6.5 The Advanced Clean Energy Storage Project in Utah Received a US$504.4 million Loan Guarantee from the U.S. Department of Energy (DOE)
4.6.6 The Atlanta-Based Company Will Halt Plans to Create 1,000 Megawatts of Battery-Based Energy Generation Capacity by 2030
4.6.7 The Advanced Clean Energy Storage Joint Venture (ACES Delta, LLC) Building Largest Green Hydrogen Platform in the World
4.6.8 The Mango Power M Series, an All-In-One Home Energy Storage Solution
4.6.9 The National Grid Corporation of the Philippines (NGCP) Has Received Approval for 28 Projects
4.6.10 Summit Ridge Energy Has Accepted a $15 million Project Finance Offer from Fundamental Renewables
4.6.11 The First Multi-Customer, 100% Renewable Micro-grid in California is Up and Running
5 Global Energy Storage Market Analysis
5.1 Key Findings
5.1.1 Amidst a Tightening of the Global Supply Chain, GE Will Treble the Production of Solar and Storage Products
5.1.2 The Largest Floating Solar Array in the Southeast Sits on Tte Lake Near Fort Bragg
5.1.3 Researchers from NREL Map Potential New Pumped Storage Locations in the US
5.2 Innovations in the Global Market
5.2.1 Lift Energy Storage System
5.2.2 Applications of Microfluidics and Nanomaterials in Energy Storage
5.2.3 Hydroelectric Truck Electric
5.2.4 Future Thermal Management Strategies Will Benefit from the Recent Discoveries Made by Researchers
5.3 Global Energy Storage Technologies Market Forecast
5.4 Global Energy Storage Technologies Market by Region
5.5 Global Energy Storage Technologies Market by Application
5.6 Global Energy Storage Technologies Market by Stationary Type
5.7 Global Energy Storage Technologies Market by Utility Type
5.8 Global Energy Storage Technologies Market by Industrial Type
5.9 Global Energy Storage Technologies Market by Technology
6 Global Energy Storage Technologies Market Analysis by Application
6.1 Segment Overview
6.1.1 Market Size Estimation and Forecast by Application
6.2 Stationery Energy Storage Application
6.2.1 Global Stationary Energy Storage Application Market Forecast
6.2.2 Global Stationary Energy Storage Application Market by Region
6.3 Transportation Energy Storage Application
6.3.1 Global Transportation Energy Storage Application Market Forecast
6.3.2 Global Transportation Energy Storage Application Market by Region
7 Global Energy Storage Technologies Market Analysis by Stationary Type
7.1 Segment Overview
7.1.1 Market Size Estimation and Forecast by Stationary Type
7.2 Industrial and Military Use
7.2.1 Global Industrial and Military Use Market Forecast
7.2.2 Global Industrial and Military Use Market by Region
7.3 Grid-Related-Utility
7.3.1 Global Grid-Related-Utility Market Forecast
7.3.2 Global Grid-Related-Utility Market by Region
7.4 Grid-Related-Residential
7.4.1 Global Grid-Related-Residential Market Forecast
7.4.2 Global Grid-Related-Residential Market by Region
8 Global Energy Storage Technologies Market Analysis by Utility Type
8.1 Segment Overview
8.1.1 Market Size Estimation and Forecast Analysis
8.2 Ancillary Services Segment
8.2.1 Global Ancillary Services Market Forecast
8.2.2 Global Ancillary Services Market by Region
8.3 Peaking Capacity
8.3.1 Global Peaking Capacity Market Forecast
8.3.2 Global Peaking Capacity Market by Region
8.4 Energy Shifting
8.4.1 Global Energy Shifting Market Forecast
8.4.2 Global Energy Shifting Market by Region
8.5 Transmission & Distribution Level
8.5.1 Global Transmission & Distribution Level Market Forecast
8.5.2 Global Transmission & Distribution Level Market by Region
9 Global Energy Storage Technologies Market Analysis by Industrial Type
9.1 Segment Overview
9.2 Market Size Estimation and Forecast Analysis
9.3 Uninterruptible Power Source (UPS) + Data Segment
9.3.1 Global Uninterruptible Power Source (UPS) + Data Market Forecast
9.3.2 Global Uninterruptible Power Source (UPS) + Data Market by Region
9.4 Telecom Backup Power Segment
9.4.1 Global Telecom Backup Power Market Forecast
9.4.2 Global Telecom Backup Power Market by Region
9.5 Air Conditioning/ Refrigeration Segment
9.5.1 Global Air Conditioning/ Refrigeration Market Forecast
9.5.2 Global Air Conditioning/ Refrigeration Market by Region
9.6 Hydrogen Refuelling Stations Segment
9.6.1 Global Hydrogen Refuelling Stations Market Forecast
9.6.2 Global Hydrogen Refuelling Stations Market by Region
9.7 Other Industrial/Military Segment Analysis
9.7.1 Global Other Industrial/Military Uses Market Forecast
9.7.2 Global Other Industrial/Military Uses Market by Region
10 Global Energy Storage Technologies Market Analysis by Technology
10.1 Segment Overview
10.1.1 Market Size Estimation and Forecast Analysis
10.2 Pumped Storage Hydropower Segment
10.2.1 Global Pumped Storage Hydropower Market Forecast
10.2.2 Global Pumped Storage Hydropower Market by Region
10.3 Lithium-ion Batteries Segment
10.3.1 Global Lithium-ion Batteries Market Forecast
10.3.2 Global Lithium-ion Batteries Market by Region
10.4 Lead–acid Batteries Segment
10.4.1 Global Lead–acid Batteries Market Forecast
10.4.2 Global Lead–acid Batteries Market by Region
10.5 Compressed-Air Energy Storage (CAES) Segment
10.5.1 Global Compressed-Air Energy Storage (CAES) Market Forecast
10.5.2 Global Compressed-Air Energy Storage (CAES) Market by Region
10.6 Redox Flow Batteries (RFBs) Segment
10.6.1 Global Redox Flow Batteries (RFBs) Market Forecast
10.6.2 Global Redox Flow Batteries (RFBs) Market by Region
10.7 Other Technologies Segment
10.7.1 Global Other Technologies Market Forecast
10.7.2 Global Other Technologies Market by Region
11 North America Energy Storage Market Analysis
11.1 Key Findings
11.1.1 In The First Quarter of 2022, 25 Energy Storage Contracts Were Announced in the North American Region
11.1.2 The Energy Storage Market in North America Is Booming
11.1.3 The 250 MW/1,000 MWh Oneida Project
11.1.4 Completed Oregon Wind, Solar, And Storage Facility
11.1.5 A $253 Million Wind Farm and Energy Storage Facility in Central Montana
11.1.6 1 GW of NYSERDA Solar and Storage Contracts Are Signed by EDF Renewables
11.2 North America Energy Storage Market Attractiveness Index
11.3 North America Energy Storage Technologies Market by Value
11.4 North America Energy Storage Technologies Market by Country
11.5 North America Energy Storage Technologies Market by Application
11.6 North America Energy Storage Technologies Market by Stationary Type
11.7 North America Energy Storage Technologies Market by Utility Type
11.8 North America Energy Storage Technologies Market by Industrial Type
11.9 North America Energy Storage Technologies Market by Technology
11.10 U.S. Market Analysis
11.10.1 Enphase Energy Increases their Use of Battery Storage in Puerto Rico
11.10.2 The Joppa Power Plant Will Be Transformed into an Energy Storage System with a $50 Million Investment
11.10.3 Companies Agree to a $78.2 Million Loan for California Energy Storage Facilities
11.10.4 The First Large-Scale Wind, Solar, and Battery Complex in the Country is Powered by an Oregon Utility
11.10.5 Energy Storage Facilities Are Anticipated to Start Functioning in 2025 at Five Illinois Coal Plants
11.10.6 US Energy Storage Technologies Market by Value
11.11 Canada Market Analysis
11.11.1 Sunnynook Battery Energy Storage
11.11.2 Ontario Advanced Compressed Air Energy Storage (A-CAES) Facility
11.11.3 Canada Energy Storage Target
11.11.4 Canada Energy Storage Technologies Market by Value
12 Europe Energy Storage Market Analysis
12.1 Key Findings
12.1.1 Europe's Storage Issue with Green Energy is Highlighted by the Russia Gas Crisis
12.1.2 A SIGNIFICANT British Company Plans to Construct One of Europe's Largest Battery Storage Facilities
12.1.3 Drax Has Requested Permission to Expand its Cruachan Pumped Hydro Power Station in Scotland to 1GW
12.2 Europe Energy Storage Market Attractiveness Index
12.3 Europe Energy Storage Technologies Market by Value
12.4 Europe Energy Storage Technologies Market by Country
12.5 Europe Energy Storage Technologies Market by Application
12.6 Europe Energy Storage Technologies Market by Stationary Type
12.7 Europe Energy Storage Technologies Market by Utility Type
12.8 Europe Energy Storage Technologies Market by Industrial Type
12.9 Europe Energy Storage Technologies Market by Technology
12.10 Germany Market Analysis
12.10.1 Opportunities and Market Entry for Companies
12.10.2 Bordesholm Battery Energy Storage System
12.10.3 Energy Storage Systems Permit
12.10.4 Germany Energy Storage Technologies Market by Value
12.11 UK Market Analysis
12.11.1 Current Scenario of UK Energy Storage Market
12.11.2 Pipeline of UK Energy Storage Projects Doubles Within 12 Months
12.11.3 Flexitricity and Gore Street Capital Have Expanded their Current Cooperation
12.11.4 UK Energy Storage Technologies Market by Value
12.12 France Market Analysis
12.12.1 Venteea: France's Largest Battery-Based Storage Solution
12.12.2 Energy Transition Law in France
12.12.3 France Energy Storage Technologies Market by Value
12.13 Italy Market Analysis
12.13.1 Energy Dome Carbon Dioxide-Based Energy Storage Solution
12.13.2 Current Projects in Italy
12.13.3 Regulations/Framework for Energy Storage
12.13.4 The first "CO2 Battery facility" Ever Opened by the Energy Storage Company Energy Dome is Located in Sardinia, Italy
12.13.5 Italy Energy Storage Technologies Market by Value
12.14 Spain Market Analysis
12.14.1 Spain’s Energy Storage Target
12.14.2 Aragon Solar PV Phase III- Battery Energy Storage System
12.14.3 Spain Energy Storage Technologies Market by Value
12.15 Rest of Europe
12.15.1 In Caithness, a Site Near Thurso Might Be Used to Build an Energy Storage Plant
12.15.2 Rest of Europe Energy Storage Technologies Market by Value
13 Asia-Pacific Energy Storage Market Analysis
13.1 Key Findings
13.1.1 Launch of China's First Compressed Air Energy Storage Salt Cavern
13.2 Asia-Pacific Energy Storage Market Attractiveness Index
13.3 Asia-Pacific Energy Storage Technologies Market by Value
13.4 Asia-Pacific Energy Storage Technologies Market by Country
13.5 Asia-Pacific Energy Storage Technologies Market by Application
13.6 Asia-Pacific Energy Storage Technologies Market by Stationary Type
13.7 Asia-Pacific Energy Storage Technologies Market by Utility Type
13.8 Asia-Pacific Energy Storage Technologies Market by Industrial Type
13.9 Asia-Pacific Energy Storage Technologies Market by Technology
13.10 China
13.10.1 China’s Energy Storage Market Target
13.10.2 Jiangsu Electric Power-Zhenjiang Battery Energy Storage System
13.10.3 China Energy Storage Tower
13.10.4 The Nation is Starting an Even Bigger Drive to Construct Hydro Energy Storage to Supplement Renewable Power
13.10.5 China Energy Storage Technologies Market by Value
13.11 India
13.11.1 Guidelines for Energy Storage Market in India
13.11.2 Opportunities for Energy Storage in India
13.11.3 The Greenko Group is Responsible for the Gummitham Tanda Project in India
13.11.4 India Energy Storage Technologies Market by Value
13.12 Japan
13.12.1 Japan’s Current Legal and Regulatory Infrastructure
13.12.2 Shiriuchi Solar PV Park – Battery Energy Storage System
13.12.3 Japan Energy storage Target
13.12.4 Toyota to Use the Batteries from its Electric Vehicles for Home Energy Storage
13.12.5 Japan Energy Storage Technologies Market by Value
13.13 South Korea
13.13.1 Kokam-Chungchoeng Battery Energy Storage Systems
13.13.2 Incentives Program by the Government
13.13.3 Lithium-ion Battery Energy Storage
13.13.4 South Korea Energy Storage Technologies Market by Value
13.14 Australia
13.14.1 World’s Biggest Battery Storage Project Announced by Australian Renewables Fund
13.14.2 Australia Energy Storage Target
13.14.3 First Transactions Made Using Renewable Energy Hub’s ‘Virtual Storage’ Contract in Australia
13.14.4 The Queensland Government Has Pledged $48 Million to Advance Two Pumped Hydro Projects
13.14.5 Australia Energy Storage Technologies Market by Value
13.15 Rest of Asia-Pacific
13.15.1 Prime Infrastructure Holdings, Based in the Philippines, Has Announced Plans to Build the Largest Solar Power Facility in the World
13.15.2 Rest of Asia-Pacific Energy Storage Technologies Market by Value
14 South America Energy Storage Market Analysis
14.1 Key Findings
14.2 South America Energy Storage Market Attractiveness Index
14.3 South America Energy Storage Technologies Market by Value
14.4 South America Energy Storage Technologies Market by Country
14.5 South America Energy Storage Technologies Market by Application
14.6 South America Energy Storage Technologies Market by Stationary Type
14.7 South America Energy Storage Technologies Market by Utility Type
14.8 South America Energy Storage Technologies Market by Industrial Type
14.9 South America Energy Storage Technologies Market by Technology
14.10 Brazil
14.11 Mexico
14.12 Rest of South America
15 Middle East and African Energy Storage Market Analysis
15.1 Key Findings
15.2 Middle East and African Energy Storage Market Attractiveness Index
15.3 Middle East & Africa Energy Storage Technologies Market by Value
15.4 Middle East & Africa Energy Storage Technologies Market by Country
15.5 Middle East & Africa Energy Storage Technologies Market by Application
15.6 Middle East & Africa Energy Storage Technologies Market by Stationary Type
15.7 Middle East & Africa Energy Storage Technologies Market by Utility Type
15.8 Middle East & Africa Energy Storage Technologies Market by Industrial Type
15.9 Middle East & Africa Energy Storage Technologies Market by Technology
15.10 South Africa
15.10.1 Azelio and Jet Energy in MoU to Develop Storage Projects with Solar PV in Francophone Africa
15.10.2 The 2 GW Risk Mitigation Procurement in South Africa and its Implications for Gas, Renewable Energy, and Energy Storage
15.11 Saudi Arabia
15.11.1 Saudi Arabia to Construct the World’s Largest Battery Storage Facility
15.11.2 Consent and Permit Required to Build an Energy Storage Facility
15.12 Turkey
15.13 Rest of Middle East & Africa
15.13.1 A Roadmap for New Energy Technologies, Electric Vehicles, and Energy Storage in Egypt is Being Developed by the German Business Siemens
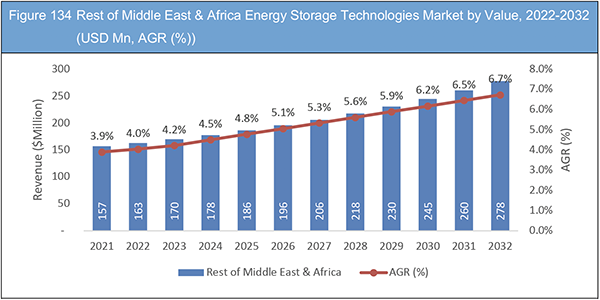
15.13.2 Rest of Middle East & Africa Energy Storage Technologies Market by Value
16 Company Profiles
16.1 Tata Powers
16.1.1 Company Snapshot
16.1.2 Company Overview
16.1.3 Financial Analysis
16.1.4 Product Benchmarking
16.1.5 Strategic Outlook
16.2 GENERAL ELECTRIC
16.2.1 Company Snapshot
16.2.2 Company Overview
16.2.3 Financial Analysis
16.2.4 Product Benchmarking
16.2.5 Strategic Outlook
16.3 LG CHEM
16.3.1 Company Overview
16.3.2 Company Snapshot
16.3.3 Financial Analysis
16.3.4 Product Benchmarking
16.3.5 Strategic Outlook
16.4 Showa Denko
16.4.1 Company Snapshot
16.4.2 Company Overview
16.4.3 Financial Analysis
16.4.4 Product Benchmarking
16.4.5 Strategic Outlook
16.5 Electrovaya
16.5.1 Company Snapshot
16.5.2 Company Overview
16.5.3 Financial Analysis
16.5.4 Product Benchmarking
16.5.5 Strategic Outlook
16.6 Samsung SDI Co., Ltd
16.6.1 Company Snapshot
16.6.2 Company Overview
16.6.3 Financial Analysis
16.6.4 Product Benchmarking
16.6.5 Strategic Outlook
16.7 Exide Industries Limited
16.7.1 Company Snapshot
16.7.2 Company Overview
16.7.3 Financial Analysis
16.7.4 Product Benchmarking
16.7.5 Strategic Outlook
16.8 SK Holdings
16.8.1 Company Snapshot
16.8.2 Company Overview
16.8.3 Financial Analysis
16.8.4 Product Benchmarking
16.8.5 Strategic Outlook
16.9 SMA Solar Technology AG
16.9.1 Company Snapshot
16.9.2 Company Overview
16.9.3 Financial Analysis
16.9.4 Product Benchmarking
16.9.5 Strategic Outlook
16.10 Scheider Electric
16.10.1 Company Snapshot
16.10.2 Company Overview
16.10.3 Financial Analysis
16.10.4 Product Benchmarking
16.10.5 Strategic Outlook
16.11 Eguana Technologies Inc
16.11.1 Company Snapshot
16.11.2 Company Overview
16.11.3 Financial Analysis
16.11.4 Product Benchmarking
16.11.5 Strategic Outlook
16.12 Fluence Energy Inc
16.12.1 Company Snapshot
16.12.2 Company Overview
16.12.3 Financial Analysis
16.12.4 Product Benchmarking
16.12.5 Strategic Outlook
16.13 Furukawa Battery Co. Ltd.
16.13.1 Company Snapshot
16.13.2 Company Overview
16.13.3 Financial Analysis
16.13.4 Product Benchmarking
16.13.5 Strategic Outlook
16.14 Langley Holdings Plc
16.14.1 Company Snapshot
16.14.2 Company Overview
16.14.3 Financial Analysis
16.14.4 Product Benchmarking
16.14.5 Strategic Outlook
16.15 Altair Nanotechnologies
16.15.1 Company Snapshot
16.15.2 Company Overview
16.15.3 Product Benchmarking
17 Conclusion and Recommendations
17.1 Concluding Remarks from Visiongain
17.2 Recommendations for Market Players
17.2.1 Focus on Upcoming Technologies
17.2.2 18 Projects Aiming to Develop Technologies that can Turn Buildings into Net Carbon Storage Structures
List of Tables
Table 1 Global Energy Storage Market Snapshot, 2022 & 2032 (US$million, CAGR %)
Table 2 Global Energy Storage Technologies Market Forecast, 2022-2032 (USD Mn, AGR (%), CAGR(%)) (V-Shaped Recovery Scenario)
Table 3 Global Energy Storage Technologies Market by Region, 2022-2032 (USD Mn, AGR (%), CAGR(%)) (V-Shaped Recovery Scenario)
Table 4 Global Energy Storage Technologies Market Forecast, 2022-2032 (USD Mn, AGR (%), CAGR(%)) (U-Shaped Recovery Scenario)
Table 5 Global Energy Storage Technologies Market by Region, 2022-2032 (USD Mn, AGR (%), CAGR(%)) (U-Shaped Recovery Scenario)
Table 6 Global Energy Storage Technologies Market Forecast, 2022-2032 (USD Mn, AGR (%), CAGR(%)) (W-Shaped Recovery Scenario)
Table 7 Global Energy Storage Technologies Market by Region, 2022-2032 (USD Mn, AGR (%), CAGR(%)) (W-Shaped Recovery Scenario)
Table 8 Global Energy Storage Technologies Market Forecast, 2022-2032 (USD Mn, AGR (%), CAGR(%)) (L-Shaped Recovery Scenario)
Table 9 Global Energy Storage Technologies Market by Region, 2022-2032 (USD Mn, AGR (%), CAGR(%)) (L-Shaped Recovery Scenario)
Table 10 Global Energy Storage Technologies Market Forecast, 2022-2032 (USD Mn, AGR (%), CAGR(%))
Table 11 Global Energy Storage Technologies Market by Region, 2022-2032 (USD Mn, AGR (%), CAGR(%))
Table 12 Global Energy Storage Technologies Market by Application, 2022-2032 (USD Mn, AGR (%), CAGR(%))
Table 13 Global Energy Storage Technologies Market by Stationary Type, 2022-2032 (USD Mn, AGR (%), CAGR(%))
Table 14 Global Energy Storage Technologies Market by Utility Type, 2022-2032 (USD Mn, AGR (%), CAGR(%))
Table 15 Global Energy Storage Technologies Market by Industrial Type, 2022-2032 (USD Mn, AGR (%), CAGR(%))
Table 16 Global Energy Storage Technologies Market by Technology, 2022-2032 (USD Mn, AGR (%), CAGR(%))
Table 17 Global Energy Storage Technologies Market by Application, 2022-2032 (USD Mn, AGR (%), CAGR (%))
Table 18 Global Stationary Energy Storage Application Market Forecast, 2022-2032 (USD Mn, AGR (%), CAGR(%))
Table 19 Global Stationary Energy Storage Application Market by Region, 2022-2032 (USD Mn, AGR (%), CAGR(%))
Table 20 Global Transportation Energy Storage Application Market Forecast, 2022-2032 (USD Mn, AGR (%), CAGR(%))
Table 21 Global Transportation Energy Storage Application Market by Region, 2022-2032 (USD Mn, AGR (%), CAGR(%))
Table 22 Global Energy Storage Technologies Market by Stationary Type, 2022-2032 (USD Mn, AGR (%), CAGR(%))
Table 23 Global Industrial and Military Use Market Forecast, 2022-2032 (USD Mn, AGR (%), CAGR(%))
Table 24 Global Industrial and Military Use Market by Region, 2022-2032 (USD Mn, AGR (%), CAGR(%))
Table 25 Global Grid-Related-Utility Market Forecast, 2022-2032 (USD Mn, AGR (%), CAGR(%))
Table 26 Global Grid-Related-Utility Market by Region, 2022-2032 (USD Mn, AGR (%), CAGR(%))
Table 27 Global Grid-Related-Residential Market Forecast, 2022-2032 (USD Mn, AGR (%), CAGR(%))
Table 28 Global Grid-Related-Residential Market by Region, 2022-2032 (USD Mn, AGR (%), CAGR(%))
Table 29 Global Energy Storage Technologies Market by Utility Type, 2022-2032 (USD Mn, AGR (%), CAGR(%))
Table 30 Global Ancillary Services Market Forecast, 2022-2032 (USD Mn, AGR (%), CAGR(%))
Table 31 Global Ancillary Services Market by Region, 2022-2032 (USD Mn, AGR (%), CAGR(%))
Table 32 Global Peaking Capacity Market Forecast, 2022-2032 (USD Mn, AGR (%), CAGR(%))
Table 33 Global Peaking Capacity Market by Region, 2022-2032 (USD Mn, AGR (%), CAGR(%))
Table 34 Global Energy Shifting Market Forecast, 2022-2032 (USD Mn, AGR (%), CAGR(%))
Table 35 Global Energy Shifting Market by Region, 2022-2032 (USD Mn, AGR (%), CAGR(%))
Table 36 Global Transmission & Distribution Level Market Forecast, 2022-2032 (USD Mn, AGR (%), CAGR(%))
Table 37 Global Transmission & Distribution Level Market by Region, 2022-2032 (USD Mn, AGR (%), CAGR(%))
Table 38 Global Energy Storage Technologies Market by Industrial Type, 2022-2032 (USD Mn, AGR (%), CAGR(%))
Table 39 Global Uninterruptible Power Source (UPS) + Data Market Forecast, 2022-2032 (USD Mn, AGR (%), CAGR(%))
Table 40 Global Uninterruptible Power Source (UPS) + Data Market by Region, 2022-2032 (USD Mn, AGR (%), CAGR(%))
Table 41 Global Telecom Backup Power Market Forecast, 2022-2032 (USD Mn, AGR (%), CAGR(%))
Table 42 Global Telecom Backup Power Market by Region, 2022-2032 (USD Mn, AGR (%), CAGR(%))
Table 43 Global Air Conditioning/ Refrigeration Market Forecast, 2022-2032 (USD Mn, AGR (%), CAGR(%))
Table 44 Global Air Conditioning/ Refrigeration Market by Region, 2022-2032 (USD Mn, AGR (%), CAGR(%))
Table 45 Global Hydrogen Refuelling Stations Market Forecast, 2022-2032 (USD Mn, AGR (%), CAGR(%))
Table 46 Global Hydrogen Refuelling Stations Market by Region, 2022-2032 (USD Mn, AGR (%), CAGR(%))
Table 47 Global Other Industrial/Military Uses Market Forecast, 2022-2032 (USD Mn, AGR (%), CAGR(%))
Table 48 Global Other Industrial/Military Uses Market by Region, 2022-2032 (USD Mn, AGR (%), CAGR(%))
Table 49 Global Energy Storage Technologies Market by Technology, 2022-2032 (USD Mn, AGR (%), CAGR(%))
Table 50 Global Pumped Storage Hydropower Market Forecast, 2022-2032 (USD Mn, AGR (%), CAGR(%))
Table 51 Global Pumped Storage Hydropower Market by Region, 2022-2032 (USD Mn, AGR (%), CAGR(%))
Table 52 Global Lithium-ion Batteries Market Forecast, 2022-2032 (USD Mn, AGR (%), CAGR(%))
Table 53 Global Lithium-ion Batteries Market by Region, 2022-2032 (USD Mn, AGR (%), CAGR(%))
Table 54 Global Lead–acid Batteries Market Forecast, 2022-2032 (USD Mn, AGR (%), CAGR(%))
Table 55 Global Lead–acid Batteries Market by Region, 2022-2032 (USD Mn, AGR (%), CAGR(%))
Table 56 Global Compressed-Air Energy Storage (CAES) Market Forecast, 2022-2032 (USD Mn, AGR (%), CAGR(%))
Table 57 Global Compressed-Air Energy Storage (CAES) Market by Region, 2022-2032 (USD Mn, AGR (%), CAGR(%))
Table 58 Global Redox Flow Batteries (RFBs) Market Forecast, 2022-2032 (USD Mn, AGR (%), CAGR(%))
Table 59 Global Redox Flow Batteries (RFBs) Market by Region, 2022-2032 (USD Mn, AGR (%), CAGR(%))
Table 60 Global Other Technologies Market Forecast, 2022-2032 (USD Mn, AGR (%), CAGR(%))
Table 61 Global Other Technologies Market by Region, 2022-2032 (USD Mn, AGR (%), CAGR(%))
Table 62 North America Energy Storage Technologies Market by Value, 2022-2032 (USD Mn, AGR (%), CAGR(%))
Table 63 North America Energy Storage Technologies Market by Country, 2022-2032 (USD Mn, AGR (%), CAGR(%))
Table 64 North America Energy Storage Technologies Market by Application, 2022-2032 (USD Mn, AGR (%), CAGR(%))
Table 65 North America Energy Storage Technologies Market by Stationary Type, 2022-2032 (USD Mn, AGR (%), CAGR(%))
Table 66 North America Energy Storage Technologies Market by Utility Type, 2022-2032 (USD Mn, AGR (%), CAGR(%))
Table 67 North America Energy Storage Technologies Market by Industrial Type, 2022-2032 (USD Mn, AGR (%), CAGR(%))
Table 68 North America Energy Storage Technologies Market by Technology, 2022-2032 (USD Mn, AGR (%), CAGR(%))
Table 69 US Energy Storage Technologies Market by Value, 2022-2032 (USD Mn, AGR (%), CAGR(%))
Table 70 Canada Energy Storage Technologies Market by Value, 2022-2032 (USD Mn, AGR (%), CAGR(%))
Table 71 Europe Energy Storage Technologies Market by Value, 2022-2032 (USD Mn, AGR (%), CAGR(%))
Table 72 Europe Energy Storage Technologies Market by Country, 2022-2032 (USD Mn, AGR (%), CAGR(%))
Table 73 Europe Energy Storage Technologies Market by Application, 2022-2032 (USD Mn, AGR (%), CAGR(%))
Table 74 Europe Energy Storage Technologies Market by Stationary Type, 2022-2032 (USD Mn, AGR (%), CAGR(%))
Table 75 Europe Energy Storage Technologies Market by Utility Type, 2022-2032 (USD Mn, AGR (%), CAGR(%))
Table 76 Europe Energy Storage Technologies Market by Industrial Type, 2022-2032 (USD Mn, AGR (%), CAGR(%))
Table 77 Europe Energy Storage Technologies Market by Technology, 2022-2032 (USD Mn, AGR (%), CAGR(%))
Table 78 Germany Energy Storage Technologies Market by Value, 2022-2032 (USD Mn, AGR (%), CAGR(%))
Table 79 UK Energy Storage Technologies Market by Value, 2022-2032 (USD Mn, AGR (%), CAGR(%))
Table 80 France Energy Storage Technologies Market by Value, 2022-2032 (USD Mn, AGR (%), CAGR(%))
Table 81 Italy Energy Storage Technologies Market by Value, 2022-2032 (USD Mn, AGR (%), CAGR(%))
Table 82 Spain Energy Storage Technologies Market by Value, 2022-2032 (USD Mn, AGR (%), CAGR(%))
Table 83 Rest of Europe Energy Storage Technologies Market by Value, 2022-2032 (USD Mn, AGR (%), CAGR(%))
Table 84 Asia-Pacific Energy Storage Technologies Market by Value, 2022-2032 (USD Mn, AGR (%), CAGR(%))
Table 85 Asia-Pacific Energy Storage Technologies Market by Country, 2022-2032 (USD Mn, AGR (%), CAGR(%))
Table 86 Asia-Pacific Energy Storage Technologies Market by Application, 2022-2032 (USD Mn, AGR (%), CAGR(%))
Table 87 Asia-Pacific Energy Storage Technologies Market by Stationary Type, 2022-2032 (USD Mn, AGR (%), CAGR(%))
Table 88 Asia-Pacific Energy Storage Technologies Market by Utility Type, 2022-2032 (USD Mn, AGR (%), CAGR(%))
Table 89 Asia-Pacific Energy Storage Technologies Market by Industrial Type, 2022-2032 (USD Mn, AGR (%), CAGR(%))
Table 90 Asia-Pacific Energy Storage Technologies Market by Technology, 2022-2032 (USD Mn, AGR (%), CAGR(%))
Table 91 China Energy Storage Technologies Market by Value, 2022-2032 (USD Mn, AGR (%), CAGR(%))
Table 92 India Energy Storage Technologies Market by Value, 2022-2032 (USD Mn, AGR (%), CAGR(%))
Table 93 Japan Energy Storage Technologies Market by Value, 2022-2032 (USD Mn, AGR (%), CAGR(%))
Table 94 South Korea Energy Storage Technologies Market by Value, 2022-2032 (USD Mn, AGR (%), CAGR(%))
Table 95 Australia Energy Storage Technologies Market by Value, 2022-2032 (USD Mn, AGR (%), CAGR(%))
Table 96 Rest of Asia-Pacific Energy Storage Technologies Market by Value, 2022-2032 (USD Mn, AGR (%), CAGR(%))
Table 97 South America Energy Storage Technologies Market by Value, 2022-2032 (USD Mn, AGR (%), CAGR(%))
Table 98 South America Energy Storage Technologies Market by Country, 2022-2032 (USD Mn, AGR (%), CAGR(%))
Table 99 South America Energy Storage Technologies Market by Application, 2022-2032 (USD Mn, AGR (%), CAGR(%))
Table 100 South America Energy Storage Technologies Market by Stationary Type, 2022-2032 (USD Mn, AGR (%), CAGR(%))
Table 101 South America Energy Storage Technologies Market by Utility Type, 2022-2032 (USD Mn, AGR (%), CAGR(%))
Table 102 South America Energy Storage Technologies Market by Industrial Type, 2022-2032 (USD Mn, AGR (%), CAGR(%))
Table 103 South America Energy Storage Technologies Market by Technology, 2022-2032 (USD Mn, AGR (%), CAGR(%))
Table 104 Brazil Energy Storage Technologies Market by Value, 2022-2032 (USD Mn, AGR (%), CAGR(%))
Table 105 Mexico Energy Storage Technologies Market by Value, 2022-2032 (USD Mn, AGR (%), CAGR(%))
Table 106 Rest of South America Energy Storage Technologies Market by Value, 2022-2032 (USD Mn, AGR (%), CAGR(%))
Table 107 Middle East & Africa Energy Storage Technologies Market by Value, 2022-2032 (USD Mn, AGR (%), CAGR(%))
Table 108 Middle East & Africa Energy Storage Technologies Market by Country, 2022-2032 (USD Mn, AGR (%), CAGR(%))
Table 109 Middle East & Africa Energy Storage Technologies Market by Application, 2022-2032 (USD Mn, AGR (%), CAGR(%))
Table 110 Middle East & Africa Energy Storage Technologies Market by Stationary Type, 2022-2032 (USD Mn, AGR (%), CAGR(%))
Table 111 Middle East & Africa Energy Storage Technologies Market by Utility Type, 2022-2032 (USD Mn, AGR (%), CAGR(%))
Table 112 Middle East & Africa Energy Storage Technologies Market by Industrial Type, 2022-2032 (USD Mn, AGR (%), CAGR(%))
Table 113 Middle East & Africa Energy Storage Technologies Market by Technology, 2022-2032 (USD Mn, AGR (%), CAGR(%))
Table 114 South Africa Energy Storage Technologies Market by Value, 2022-2032 (USD Mn, AGR (%), CAGR(%))
Table 115 Saudi Arabia Energy Storage Technologies Market by Value, 2022-2032 (USD Mn, AGR (%), CAGR(%))
Table 116 Turkey Energy Storage Technologies Market by Value, 2022-2032 (USD Mn, AGR (%), CAGR(%))
Table 117 Rest of Middle East & Africa Energy Storage Technologies Market by Value, 2022-2032 (USD Mn, AGR (%), CAGR(%))
Table 118 Tata Powers : Key Details, (CEO, HQ, Revenue, Founded, No. of Employees, Company Type, Website, Business Segment)
Table 119 Tata Powers : Product Benchmarking
Table 120 Tata Powers : Strategic Outlook
Table 121 GENERAL ELECTRIC: Key Details, (CEO, HQ, Revenue, Founded, No. of Employees, Company Type, Website, Business Segment)
Table 122 GENERAL ELECTRIC: Product Benchmarking
Table 123 GENERAL ELECTRIC: Strategic Outlook
Table 124 LG CHEM: Key Details, (CEO, HQ, Revenue, Founded, No. of Employees, Company Type, Website, Business Segment)
Table 125 LG CHEM: Product Benchmarking
Table 126 LG CHEM: Strategic Outlook
Table 127 Showa Denko: Key Details, (CEO, HQ, Revenue, Founded, No. of Employees, Company Type, Website, Business Segment)
Table 128 Showa Denko: Product Benchmarking
Table 129 Showa Denko : Strategic Outlook
Table 130 Electrovaya: Key Details, (CEO, HQ, Revenue, Founded, No. of Employees, Company Type, Website, Business Segment)
Table 131 Electrovaya: Product Benchmarking
Table 132 Electrovaya: Strategic Outlook
Table 133 Samsung SDI Co., Ltd: Key Details, (CEO, HQ, Revenue, Founded, No. of Employees, Company Type, Website, Business Segment)
Table 134 Samsung SDI Co., Ltd: Product Benchmarking
Table 135 Samsung SDI Co., Ltd: Strategic Outlook
Table 136 Exide Industries Limited: Key Details, (CEO, HQ, Revenue, Founded, No. of Employees, Company Type, Website, Business Segment)
Table 137 Exide Industries Limited: Product Benchmarking
Table 138 Exide Industries Limited: Strategic Outlook
Table 139 SK Holdings.: Key Details, (CEO, HQ, Revenue, Founded, No. of Employees, Company Type, Website, Business Segment)
Table 140 SK Holdings.: Product Benchmarking
Table 141 SK Holdings.: Strategic Outlook
Table 142 SMA Solar Technology AG: Key Details, (CEO, HQ, Revenue, Founded, No. of Employees, Company Type, Website, Business Segment)
Table 143 SMA Solar Technology AG: Product Benchmarking
Table 144 SMA Solar Technology AG: Strategic Outlook
Table 145 Scheider Electric: Key Details, (CEO, HQ, Revenue, Founded, No. of Employees, Company Type, Website, Business Segment)
Table 146 Scheider Electric: Product Benchmarking
Table 147 Scheider Electric: Strategic Outlook
Table 148 Eguana Technologies Inc: Key Details, (CEO, HQ, Revenue, Founded, No. of Employees, Company Type, Website, Business Segment)
Table 149 Eguana Technologies Inc: Product Benchmarking
Table 150 Eguana Technologies Inc: Strategic Outlook
Table 151 Fluence Energy Inc: Key Details, (CEO, HQ, Revenue, Founded, No. of Employees, Company Type, Website, Business Segment)
Table 152 Fluence Energy Inc: Product Benchmarking
Table 153 Fluence Energy Inc: Strategic Outlook
Table 154 Furukawa Battery Co. Ltd.: Key Details, (CEO, HQ, Revenue, Founded, No. of Employees, Company Type, Website, Business Segment)
Table 155 Furukawa Battery Co. Ltd.: Product Benchmarking
Table 156 Furukawa Battery Co. Ltd.: Strategic Outlook
Table 157 Langley Holdings Plc: Key Details, (CEO, HQ, Revenue, Founded, No. of Employees, Company Type, Website, Business Segment)
Table 158 Langley Holdings Plc: Product Benchmarking
Table 159 Langley Holdings Plc: Strategic Outlook
Table 160 Altair Nanotechnologies : Key Details, (CEO, HQ, Revenue, Founded, No. of Employees, Company Type, Website, Business Segment)
Table 161 Altair Nanotechnologies : Product Benchmarking
List of Figures
Figure 1 Global Energy Storage Market Segmentation
Figure 2 Breakdown of Primary Interviews: By Company Type, Designation, & Region
Figure 3 Global Energy Storage Market Forecast by Region: Market Attractiveness Index
Figure 4 Global Energy Storage Market by Application: Market Attractiveness Index
Figure 5 Global Energy Storage Market by Stationary Type: Market Attractiveness Index
Figure 6 Global Energy Storage Market by End-users: Market Attractiveness Index
Figure 7 Global Energy Storage Market by End-users: Market Attractiveness Index
Figure 8 Global Energy Storage Market by End-users: Market Attractiveness Index
Figure 9 Global Energy Storage Market: Market Dynamics
Figure 10 Global Energy Storage Technologies Market Forecast, 2022-2032 (USD Mn, AGR(%))(V-Shaped Recovery Scenario)
Figure 11 Global Energy Storage Technologies Market by Region, 2022-2032 (USD Mn, AGR (%)) (V-Shaped Recovery Scenario)
Figure 12 Global Energy Storage Technologies Market Forecast, 2022-2032 (USD Mn, AGR (%)) (U-Shaped Recovery Scenario)
Figure 13 Global Energy Storage Technologies Market by Region, 2022-2032 (USD Mn, AGR (%)) (U-Shaped Recovery Scenario)
Figure 14 Global Energy Storage Technologies Market Forecast, 2022-2032 (USD Mn, AGR (%)) (W-Shaped Recovery Scenario)
Figure 15 Global Energy Storage Technologies Market by Region, 2022-2032 (USD Mn, AGR (%)) (W-Shaped Recovery Scenario)
Figure 16 Global Energy Storage Technologies Market Forecast, 2022-2032 (USD Mn, AGR (%)) (L-Shaped Recovery Scenario)
Figure 17 Global Energy Storage Technologies Market by Region, 2022-2032 (USD Mn, AGR (%)) (L-Shaped Recovery Scenario)
Figure 18 Global Energy Storage Market: Porter’s Five Forces Analysis
Figure 19 Global Energy Storage Market: PESTLE Analysis
Figure 20 Lift Energy Storage System
Figure 21 Hydroelectric Truck System Overview
Figure 22 Global Energy Storage Technologies Market Forecast, 2022-2032 (USD Mn, AGR (%))
Figure 23 Global Energy Storage Technologies Market by Region, 2022-2032 (USD Mn, AGR (%))
Figure 24 Global Energy Storage Technologies Market by Application, 2022-2032 (USD Mn, AGR (%))
Figure 25 Global Energy Storage Technologies Market by Stationary Type, 2022-2032 (USD Mn, AGR (%))
Figure 26 Global Energy Storage Technologies Market by Utility Type, 2022-2032 (USD Mn, AGR (%))
Figure 27 Global Energy Storage Technologies Market by Industrial Type, 2022-2032 (USD Mn, AGR (%))
Figure 28 Global Energy Storage Technologies Market by Technology, 2022-2032 (USD Mn, AGR (%))
Figure 29 Global Energy Storage Technologies Market by Application, 2022-2032 (USD Mn, AGR (%))
Figure 30 Global Stationary Energy Storage Application Market Forecast, 2022-2032 (USD Mn, AGR (%))
Figure 31 Global Stationary Energy Storage Application Market by Region, 2022-2032 (USD Mn, AGR (%))
Figure 32 Global Transportation Energy Storage Application Market Forecast, 2022-2032 (USD Mn, AGR (%))
Figure 33 Global Transportation Energy Storage Application Market by Region, 2022-2032 (USD Mn, AGR (%))
Figure 34 Global Energy Storage Technologies Market by Stationary Type, 2022-2032 (USD Mn, AGR (%))
Figure 35 Global Industrial and Military Use Market Forecast, 2022-2032 (USD Mn, AGR (%))
Figure 36 Global Industrial and Military Use Market by Region, 2022-2032 (USD Mn, AGR (%))
Figure 37 Global Grid-Related-Utility Market Forecast, 2022-2032 (USD Mn, AGR (%))
Figure 38 Global Grid-Related-Utility Market by Region, 2022-2032 (USD Mn, AGR (%))
Figure 39 Global Grid-Related-Residential Market Forecast, 2022-2032 (USD Mn, AGR (%))
Figure 40 Global Grid-Related-Residential Market by Region, 2022-2032 (USD Mn, AGR (%))
Figure 41 Global Energy Storage Technologies Market by Utility Type, 2022-2032 (USD Mn, AGR (%))
Figure 42 Global Ancillary Services Market Forecast, 2022-2032 (USD Mn, AGR (%))
Figure 43 Global Ancillary Services Market by Region, 2022-2032 (USD Mn, AGR (%))
Figure 44 Global Peaking Capacity Market Forecast, 2022-2032 (USD Mn, AGR (%))
Figure 45 Global Peaking Capacity Market by Region, 2022-2032 (USD Mn, AGR (%))
Figure 46 Global Energy Shifting Market Forecast, 2022-2032 (USD Mn, AGR (%))
Figure 47 Global Energy Shifting Market by Region, 2022-2032 (USD Mn, AGR (%))
Figure 48 Global Transmission & Distribution Level Market Forecast, 2022-2032 (USD Mn, AGR (%))
Figure 49 Global Transmission & Distribution Level Market by Region, 2022-2032 (USD Mn, AGR (%))
Figure 50 Global Energy Storage Technologies Market by Industrial Type, 2022-2032 (USD Mn, AGR (%))
Figure 51 Global Uninterruptible Power Source (UPS) + Data Market Forecast, 2022-2032 (USD Mn, AGR (%))
Figure 52 Global Uninterruptible Power Source (UPS) + Data Market by Region, 2022-2032 (USD Mn, AGR (%))
Figure 53 Global Telecom Backup Power Market Forecast, 2022-2032 (USD Mn, AGR (%))
Figure 54 Global Telecom Backup Power Market by Region, 2022-2032 (USD Mn, AGR (%))
Figure 55 Global Air Conditioning/ Refrigeration Market Forecast, 2022-2032 (USD Mn, AGR (%) )
Figure 56 Global Air Conditioning/ Refrigeration Market by Region, 2022-2032 (USD Mn, AGR (%))
Figure 57 Global Hydrogen Refuelling Stations Market Forecast, 2022-2032 (USD Mn, AGR (%))
Figure 58 Global Hydrogen Refuelling Stations Market by Region, 2022-2032 (USD Mn, AGR (%))
Figure 59 Global Other Industrial/Military Uses Market Forecast, 2022-2032 (USD Mn, AGR (%))
Figure 60 Global Other Industrial/Military Uses Market by Region, 2022-2032 (USD Mn, AGR (%))
Figure 61 Global Energy Storage Technologies Market by Technology, 2022-2032 (USD Mn, AGR (%))
Figure 62 Global Pumped Storage Hydropower Market Forecast, 2022-2032 (USD Mn, AGR (%))
Figure 63 Global Pumped Storage Hydropower Market by Region, 2022-2032 (USD Mn, AGR (%))
Figure 64 Global Lithium-ion Batteries Market Forecast, 2022-2032 (USD Mn, AGR (%))
Figure 65 Global Lithium-ion Batteries Market by Region, 2022-2032 (USD Mn, AGR (%))
Figure 66 Global Lead–acid Batteries Market Forecast, 2022-2032 (USD Mn, AGR (%))
Figure 67 Global Lead–acid Batteries Market by Region, 2022-2032 (USD Mn, AGR (%))
Figure 68 Global Compressed-Air Energy Storage (CAES) Market Forecast, 2022-2032 (USD Mn, AGR (%))
Figure 69 Global Compressed-Air Energy Storage (CAES) Market by Region, 2022-2032 (USD Mn, AGR (%))
Figure 70 Global Redox Flow Batteries (RFBs) Market Forecast, 2022-2032 (USD Mn, AGR (%))
Figure 71 Global Redox Flow Batteries (RFBs) Market by Region, 2022-2032 (USD Mn, AGR (%))
Figure 72 Cancer Market Forecast by Region, 2022-2032 (US$billion)
Figure 73 Global Other Technologies Market by Region, 2022-2032 (USD Mn, AGR (%), CAGR(%))
Figure 74 North America Energy Storage Market Attractiveness Index
Figure 75 North America Energy Storage Technologies Market by Value, 2022-2032 (USD Mn, AGR (%))
Figure 76 North America Energy Storage Technologies Market by Country, 2022-2032 (USD Mn, AGR (%))
Figure 77 North America Energy Storage Technologies Market by Application, 2022-2032 (USD Mn, AGR (%))
Figure 78 North America Energy Storage Technologies Market by Stationary Type, 2022-2032 (USD Mn, AGR (%))
Figure 79 North America Energy Storage Technologies Market by Utility Type, 2022-2032 (USD Mn, AGR (%))
Figure 80 North America Energy Storage Technologies Market by Industrial Type, 2022-2032 (USD Mn, AGR (%))
Figure 81 North America Energy Storage Technologies Market by Technology, 2022-2032 (USD Mn, AGR (%))
Figure 82 US Energy Storage Technologies Market by Value, 2022-2032 (USD Mn, AGR (%))
Figure 83 Canada Energy Storage Technologies Market by Value, 2022-2032 (USD Mn, AGR (%))
Figure 84 Europe Energy Storage Market Attractiveness Index
Figure 85 Europe Energy Storage Technologies Market by Value, 2022-2032 (USD Mn, AGR (%))
Figure 86 Europe Energy Storage Technologies Market by Country, 2022-2032 (USD Mn, AGR (%))
Figure 87 Europe Energy Storage Technologies Market by Application, 2022-2032 (USD Mn, AGR (%))
Figure 88 Europe Energy Storage Technologies Market by Stationary Type, 2022-2032 (USD Mn, AGR (%))
Figure 89 Europe Energy Storage Technologies Market by Utility Type, 2022-2032 (USD Mn, AGR (%))
Figure 90 Europe Energy Storage Technologies Market by Industrial Type, 2022-2032 (USD Mn, AGR (%))
Figure 91 Europe Energy Storage Technologies Market by Technology, 2022-2032 (USD Mn, AGR (%))
Figure 92 Germany Energy Storage Technologies Market by Value, 2022-2032 (USD Mn, AGR (%))
Figure 93 UK Energy Storage Technologies Market by Value, 2022-2032 (USD Mn, AGR (%))
Figure 94 France Energy Storage Technologies Market by Value, 2022-2032 (USD Mn, AGR (%))
Figure 95 Italy Energy Storage Technologies Market by Value, 2022-2032 (USD Mn, AGR (%))
Figure 96 Spain Energy Storage Technologies Market by Value, 2022-2032 (USD Mn, AGR (%))
Figure 97 Rest of Europe Energy Storage Technologies Market by Value, 2022-2032 (USD Mn, AGR (%))
Figure 98 Asia-Pacific Energy Storage Market Attractiveness Index
Figure 99 Asia-Pacific Energy Storage Technologies Market by Value, 2022-2032 (USD Mn, AGR (%))
Figure 100 Asia-Pacific Energy Storage Technologies Market by Country, 2022-2032 (USD Mn, AGR (%))
Figure 101 Asia-Pacific Energy Storage Technologies Market by Application, 2022-2032 (USD Mn, AGR (%))
Figure 102 Asia-Pacific Energy Storage Technologies Market by Stationary Type, 2022-2032 (USD Mn, AGR (%))
Figure 103 Asia-Pacific Energy Storage Technologies Market by Utility Type, 2022-2032 (USD Mn, AGR (%))
Figure 104 Asia-Pacific Energy Storage Technologies Market by Industrial Type, 2022-2032 (USD Mn, AGR (%))
Figure 105 Asia-Pacific Energy Storage Technologies Market by Technology, 2022-2032 (USD Mn, AGR (%))
Figure 106 China Energy Storage Technologies Market by Value, 2022-2032 (USD Mn, AGR (%))
Figure 107 India Energy Storage Technologies Market by Value, 2022-2032 (USD Mn, AGR (%))
Figure 108 Japan Energy Storage Technologies Market by Value, 2022-2032 (USD Mn, AGR (%))
Figure 109 South Korea Energy Storage Technologies Market by Value, 2022-2032 (USD Mn, AGR (%))
Figure 110 Australia Energy Storage Technologies Market by Value, 2022-2032 (USD Mn, AGR (%))
Figure 111 Rest of Asia-Pacific Energy Storage Technologies Market by Value, 2022-2032 (USD Mn, AGR (%))
Figure 112 South America Energy Storage Market Attractiveness Index
Figure 113 South America Energy Storage Technologies Market by Value, 2022-2032 (USD Mn, AGR (%))
Figure 114 South America Energy Storage Technologies Market by Country, 2022-2032 (USD Mn, AGR (%))
Figure 115 South America Energy Storage Technologies Market by Application, 2022-2032 (USD Mn, AGR (%))
Figure 116 South America Energy Storage Technologies Market by Stationary Type, 2022-2032 (USD Mn, AGR (%))
Figure 117 South America Energy Storage Technologies Market by Utility Type, 2022-2032 (USD Mn, AGR (%))
Figure 118 South America Energy Storage Technologies Market by Industrial Type, 2022-2032 (USD Mn, AGR (%))
Figure 119 South America Energy Storage Technologies Market by Technology, 2022-2032 (USD Mn, AGR (%))
Figure 120 Brazil Energy Storage Technologies Market by Value, 2022-2032 (USD Mn, AGR (%))
Figure 121 Mexico Energy Storage Technologies Market by Value, 2022-2032 (USD Mn, AGR (%))
Figure 122 Rest of South America Energy Storage Technologies Market by Value, 2022-2032 (USD Mn, AGR (%))
Figure 123 MEA Energy Storage Market Attractiveness Index
Figure 124 Middle East & Africa Energy Storage Technologies Market by Value, 2022-2032 (USD Mn, AGR (%))
Figure 125 Middle East & Africa Energy Storage Technologies Market by Country, 2022-2032 (USD Mn, AGR (%))
Figure 126 Middle East & Africa Energy Storage Technologies Market by Application, 2022-2032 (USD Mn, AGR (%))
Figure 127 Middle East & Africa Energy Storage Technologies Market by Stationary Type, 2022-2032 (USD Mn, AGR (%))
Figure 128 Middle East & Africa Energy Storage Technologies Market by Utility Type, 2022-2032 (USD Mn, AGR (%))
Figure 129 Middle East & Africa Energy Storage Technologies Market by Industrial Type, 2022-2032 (USD Mn, AGR (%))
Figure 130 Middle East & Africa Energy Storage Technologies Market by Technology, 2022-2032 (USD Mn, AGR (%))
Figure 131 South Africa Energy Storage Technologies Market by Value, 2022-2032 (USD Mn, AGR (%))
Figure 132 Saudi Arabia Energy Storage Technologies Market by Value, 2022-2032 (USD Mn, AGR (%))
Figure 133 Turkey Energy Storage Technologies Market by Value, 2022-2032 (USD Mn, AGR (%))
Figure 134 Rest of Middle East & Africa Energy Storage Technologies Market by Value, 2022-2032 (USD Mn, AGR (%))
Figure 135 Tata Powers : Net Revenue, 2017-2021 (US$million, AGR%)
Figure 136 Tata Powers : Gross Profit, 2017-2021 (US$million, AGR%)
Figure 137 Tata Powers : Net Profit 2017-2021 (US$million, AGR%)
Figure 138 Tata Powers: EBITDA, 2017-2021 (US$million, AGR%)
Figure 139 GENERAL ELECTRIC: Net Revenue, 2017-2021 (US$million, AGR%)
Figure 140 GENERAL ELECTRIC: Gross Profit, 2017-2021 (US$million, AGR%)
Figure 141 GENERAL ELECTRIC: Net Profit 2017-2021 (US$million, AGR%)
Figure 142 GENERAL ELECTRIC: EBITDA, 2017-2021 (US$million, AGR%)
Figure 143 LG CHEM: Net Revenue, 2017-2021 (US$million, AGR%)
Figure 144 LG CHEM: Gross Profit, 2017-2021 (US$million, AGR%)
Figure 145 LG CHEM: Net Profit 2017-2021 (US$million, AGR%)
Figure 146 LG CHEM: EBITDA, 2017-2021 (US$million, AGR%)
Figure 147 Showa Denko : Net Revenue, 2017-2021 (US$million, AGR%)
Figure 148 Showa Denko : Gross Profit, 2017-2021 (US$million, AGR%)
Figure 149 Showa Denko : Net Profit 2017-2021 (US$million, AGR%)
Figure 150 Showa Denko: EBITDA, 2017-2021 (US$million, AGR%)
Figure 151 Electrovaya: Net Revenue, 2017-2021 (US$million, AGR%)
Figure 152 Electrovaya: Gross Profit, 2017-2021 (US$million, AGR%)
Figure 153 Electrovaya: Net Profit 2017-2021 (US$million, AGR%)
Figure 154 Electrovaya: EBITDA, 2017-2021 (US$million, AGR%)
Figure 155 Samsung SDI Co., Ltd: Net Revenue, 2017-2021 (US$million, AGR%)
Figure 156 Samsung SDI Co., Ltd: Gross Profit, 2017-2021 (US$million, AGR%)
Figure 157 Samsung SDI Co., Ltd: Net Profit 2017-2021 (US$million, AGR%)
Figure 158 Samsung SDI Co., Ltd: EBITDA, 2017-2021 (US$million, AGR%)
Figure 159 Exide Industries Limited: Net Revenue, 2017-2021 (US$million, AGR%)
Figure 160 Exide Industries Limited: Gross Profit, 2017-2021 (US$million, AGR%)
Figure 161 Exide Industries Limited: Net Profit 2017-2021 (US$million, AGR%)
Figure 162 Exide Industries Limited: EBITDA, 2017-2021 (US$million, AGR%)
Figure 163 SK Holdings.: Net Revenue, 2017-2021 (US$million, AGR%)
Figure 164 SK Holdings.: Gross Profit, 2017-2021 (US$million, AGR%)
Figure 165 SK Holdings.: Net Profit 2017-2021 (US$million, AGR%)
Figure 166 SK Holdings.: EBITDA, 2017-2021 (US$million, AGR%)
Figure 167 SMA Solar Technology AG: Net Revenue, 2017-2021 (US$million, AGR%)
Figure 168 SMA Solar Technology AG: Gross Profit, 2017-2021 (US$million, AGR%)
Figure 169 SMA Solar Technology AG: Net Profit 2017-2021 (US$million, AGR%)
Figure 170 SMA Solar Technology AG: EBITDA, 2017-2021 (US$million, AGR%)
Figure 171 Scheider Electric: Net Revenue, 2017-2021 (US$million, AGR%)
Figure 172 Scheider Electric: Gross Profit, 2017-2021 (US$million, AGR%)
Figure 173 Scheider Electric: Net Profit 2017-2021 (US$million, AGR%)
Figure 174 Scheider Electric: EBITDA, 2017-2021 (US$million, AGR%)
Figure 175 Eguana Technologies Inc: Net Revenue, 2017-2021 (US$million, AGR%)
Figure 176 Eguana Technologies Inc: Gross Profit, 2017-2021 (US$million, AGR%)
Figure 177 Eguana Technologies Inc: Net Profit 2017-2021 (US$million, AGR%)
Figure 178 Eguana Technologies Inc: EBITDA, 2017-2021 (US$million, AGR%)
Figure 179 Fluence Energy Inc: Net Revenue, 2017-2021 (US$million, AGR%)
Figure 180 Fluence Energy Inc: Gross Profit, 2017-2021 (US$million, AGR%)
Figure 181 Fluence Energy Inc: Net Profit 2017-2021 (US$million, AGR%)
Figure 182 Fluence Energy Inc: EBITDA, 2017-2021 (US$million, AGR%)
Figure 183 Furukawa Battery Co. Ltd.: Net Revenue, 2017-2021 (US$million, AGR%)
Figure 184 Furukawa Battery Co. Ltd.: Gross Profit, 2017-2021 (US$million, AGR%)
Figure 185 Furukawa Battery Co. Ltd.: Net Profit 2017-2021 (US$million, AGR%)
Figure 186 Furukawa Battery Co. Ltd.: EBITDA, 2017-2021 (US$million, AGR%)
Figure 187 Langley Holdings Plc: Net Revenue, 2017-2021 (US$million, AGR%)
Figure 188 Langley Holdings Plc: Gross Profit, 2017-2021 (US$million, AGR%)
Figure 189 Langley Holdings Plc: Net Profit 2017-2021 (US$million, AGR%)
List of Companies Profiled in the report
Altair Nanotechnologies
Eguana Technologies Inc.
Electrovaya Inc.,
Exide Industries Limited
Fluence Energy, Inc.
Furukawa Battery Co., Ltd.
General Electric Company
Langley Holdings plc (Langley)
LG Chem Ltd
Samsung SDI Co Ltd
Schneider Electric SE
Showa Denko K.K.
SK Holdings Co Ltd,
SMA Solar Technology AG
Tata Power Company Limited
List of Other Companies Mentioned in the report
24M Technologies Inc.
A123 Systems
ABB Group
Advanced Microgrid Solutions
AES Energy Storage
Aggreko
Air Liquide
Air Products
Airbus Defence and Space
ALACAES
Alpig
Amber Kinetics
Ambri
Ameresco Inc.
American Electric Power
ARPA-E
Axpo
Ballard Power Systems
Beacon Power
Bosch Energy Storage Solutions, LLC.
Bruker
BYD Co. Ltd
Centrica
China Electrical Power Research Institute (CEPRI)
Chubu Electric
Clean Energy Storage Inc.
Con Edison
Daimler AG
Demand Energy
DLR
Dressen-Rand
Duke Energy Corporation
Dynapower Company LLC
E.ON
Eagle Crest Energy
EDF
EDF Renewable Energy
Edison Energy Group.
Edison International
EGP North America
Electric Power Development
eMotorWorks
Enel Green Power
Enel Group
Enel X
Ener1
Enercom
Energias de Portugal
EnerNOC
Engie
EnZinc
Eos Energy Storage
Eos Systems
Florida Power & Light (FPL) Company
Fluidic Energy
Fraunhofer IOSB
Fujikura
Furukawa Electric
General Compression
General Electric
General Motors
Greensmith (Wärtsilä)
Grid Logic
Gridflex Energy LLC Principals
GTM
Highview Power Storage
Hitachi
Honda
Hydrogenics Corporation
Hydrostor
Hyundai
IBM
Illwerke AG
Invenergy LLC
ITM Power
Johnson Controls
J-Power
KWO Grimselstrom
Kyushu Electric Power
LG Chem Ltd.
Linde
llwerke AG
Lockheed Martin Energy
Magnum Energy Storage
Maxwell Technologies
Mercedes-Benz
Mitsubishsi Electric Corporation
National Grid
NextEra Energy Resources, LLC (NEER)
NextEra Energy, Inc. (NEE)
Nissan
Norsk Hydro
NRG
Nuvation Energy
OXIS Energy
Pacific Gas And Electric
Panasonic
Peak Hour Power
Pellion Technologies
Phinergy
PowerSecure Inc.
Proinso
Proton Motor
PSE&G
RES group
ReVolt Technology
Robert Bosch GmbH
RWE
S&C Electric
Samsung SDI Co. Ltd
Sharp Electronics
Siemens
Sion Power
SNC
Sony
Southern California Edison
Starwood Energy Group
State Grid Corporation of China (SGCC)
Sungrow
Sunwoda Electronic Co., Ltd.
Super-conductor Technologies
SuperPower
SustainX
Tesla
Texas Dispatchable Wind
The Linde Group
Thüga Group
Toyota
Trina Energy Storage Solutions CO. Ltd.
Uniper
UTC
Valence Technology
Verbund
Viridor
Volkswagen
Younicos
ZAF Energy Systems
Zhangbei National Wind and Solar Energy Storage
Züblin
List of Associations Mentioned in the Report
Advanced Research Projects Agency-Energy (ARPA-E)
Brookhaven National Laboratory
California Public Utility Commission (CPUC)
Cambridge University
Canadian Ministry of Energy
China Electrical Power Research Institute (CEPRI)
Energy Information Administration (EIA)
European Consortium for Lithium-Sulphur power for Space Environments
Federal Association of Energy Storage (BVES)
Federal Energy Regulatory Commission (FERC)
FP7 (The 7th Framework Programme for Research and Technological Development)
Fraunhofer Center for Energy Storage
Fraunhofer Society
Fuel Cell Bus Club
Fuel Cells and Hydrogen (FCH) Joint Technology Initiative (JTI)
German National Research Center for Aeronautics
Hessian Ministry for the Environment, Energy, Agriculture and Consumer Protection
High Energy Research Organisation
International Atomic Energy Agency (IAEA)
International Energy Agency (IEA)
Joint Technology Initiative
Korea Institute of Energy Research (KIER)
Ministry of Economy, Trade and Industry (METI)
Ministry of Industry and Information Technology (MIIT)
San Onofre Community Engagement Panel (CEP)
Swiss Federal Office of Energy
Texas Center for Superconductivity
Toyota Research Institute of North America (TRINA)
UK Department of Energy and Climate Change (DECC)
UNFCCC
Universität Magdeburg-
US Department of Energy (DOE)
Vehicle Technologies Office (VTO)
 Market Report 2022-2032")