Find out, How Zero Emission Programs Are Creating Opportunities for the Airline Companies?
Transitioning to low-emission growth paths around the world is needed to meet these emission reduction targets. This entails decoupling carbon emissions from economic development across a variety of initiatives across all economic industries, including energy efficiency upgrades, fuel balance reforms, land use transition management, and so on. Many countries have recognised that long-term economic development and the need to transition to low-emission manufacturing are inextricably tied. Economic priorities that are mutually reinforcing include energy supply and efficiency, energy management, and climate change mitigation.
Discover how to stay ahead
Our 200+ pages report provides 71+ tables and 83+ charts/graphs. Read on to discover the most lucrative areas in the industry and the future market prospects. Our new study lets you assess forecasted sales at overall world market and regional level. See financial results, trends, opportunities, and revenue predictions. Much opportunity remains in this growing zero-emission aircraft market. See how to exploit the opportunities.
Forecasts to 2031 and other analyses reveal the commercial prospects
• In addition to revenue forecasting to 2031, our new study provides you with recent results, growth rates, and market shares of your main competitors.
• Original analyses – this is not available anywhere else
• Discover qualitative analyses (including market dynamics, drivers, opportunities, restraints and challenges), Product Pipeline Analysis, product profiles and commercial developments.
This report includes data analysis and invaluable insight into how COVID-19 will affect your industry. Access this report today.
To access the data contained in this document please email contactus@visiongain.com
Market Breakdown by Fuel Type, Forecast 2021-2031 (USD Million, AGR, CAGR)
• SAF (Biofuels)
• Electrification
• Hydrogen
• Solar
• Other Fuel Type
Market Breakdown by Technology, Forecast 2021-2031 (USD Million, AGR, CAGR)
• Electric Motor Technology
• Fuel Cell Technology
• Hydrogen Fuel Storage
• Power Management and Distribution Technology
• Other Technology
Market Breakdown by Passengers Capacity, Forecast 2021-2031 (USD Million, AGR, CAGR)
• <100 Passengers
• 100-200 Passengers
• 200-500 Passengers
• Above 500 Passengers
Market Breakdown by Travel Range, Forecast 2021-2031 (USD Million, AGR, CAGR)
• Up to 100 Miles
• 100-200 Miles
• 200-300 Miles
• Above 300 Miles

In addition to the revenue predictions for the overall world market and segments, you will also find revenue forecasts for 5 regional and 20 leading national markets:
By Region
North America
• U.S.
• Canada
• Mexico
Europe
• Germany
• France
• UK
• Italy
• Spain
• Rest of Europe
Asia Pacific
• China
• Japan
• India
• South Korea
• Australia
• Rest of Asia Pacific
Latin America, Middle East & Africa
• Brazil
• Turkey
• Saudi Arabia
• South Africa
• UAE
• Rest of LAMEA
Need industry data? Please contact us today.
Leading companies and the potential for market growth
Overall world revenue for Zero Emission Aircraft Market will surpass $xx million in 2021, our work calculates. We predict strong revenue growth through to 2031. Our work identifies which organizations hold the greatest potential. Discover their capabilities, progress, and commercial prospects, helping you stay ahead.
How the Zero Emission Aircraft Market report helps you?
In summary, our 190+ page report provides you with the following knowledge:
• Revenue forecasts to 2031 for Zero Emission Aircraft Market, forecasted at a global and regional level– discover the industry’s prospects, finding the most lucrative places for investments and revenues
• Revenue forecasts to 2031 for 4 regional and 20 key national markets – See forecasts for the Zero Emission Aircraft Markets market in North America, Europe, Asia-Pacific and Rest of the World. Also forecasted is the market in the US, Canada, Brazil, Germany, France, UK, Italy, China, India, and Japan, among other prominent economies.
• Prospects for established firms and those seeking to enter the market– including company profiles for 10 of the major companies involved in the Zero Emission Aircraft Market.
• Airbus S.A.S
• Thales SA
• Lockheed Martin Corporation
• Blue Origin Federation, LLC
• Boeing Aerospace
• Northrop Grumman Corporation
• Reaction Engines
• SpaceX Aerospace Company
• Rolls-Royce Holdings PLC
• ZeroAvia
To access the data contained in this document please email contactus@visiongain.com
Buy our report today Zero Emission Aircraft Market Report 2021-2031: Forecasts by Fuel Type (SAF (Biofuels), Electrification, Hydrogen, Solar, Other), by Technology (Electric Motor Technology, Fuel Cell Technology, Hydrogen Fuel Storage, Power Management and Distribution Technology, Other), by Passenger Capacity (up to 100, 100-200, 200-500, Above 500), by Travel Range (up to 100 Miles, 100-200 Miles, 200-300 Miles, Above 300 Miles) AND Regional and Leading National Market Analysis PLUS Analysis of Leading Zero Emission Aircraft Companies AND COVID-19 Recovery Scenarios. Avoid missing out by staying informed – order our report now.
Visiongain is a trading partner with the US Federal Government
CCR Ref number: KD4R6
Do you have any custom requirements we can help you with? Any need for a specific country, geo region, market segment or specific company information? Contact us today, we can discuss your needs and see how we can help: sara.peerun@visiongain.com
1. Report Overview
1.1 Introduction to Zero Emission Aircraft Market
1.2 Global Zero Emission Aircraft Market Overview
1.2.1 Innovative Power System Description
1.3 What are the Objectives of this Report?
1.4 What is the Scope of the Report?
1.5 Zero Emission Aircraft Market Definition
1.5.1 Solar cells
1.5.2 Batteries
1.5.3 Ultracapacitors
1.5.4 Fuel cells
1.5.5 Microwaves
1.5.6 External power cables
1.5.7 Ion wind
1.5.8 Hybrid power
1.5.9 Hydrogen-fuel
1.5.10 Methane-fuel
1.6 Why You Should Read This Report
1.7 What This Report Delivers
1.8 Key Questions Answered By This Analytical Report Include:
1.9 Who is This Report for?
1.10 Research Methodology
1.10.1 Primary Research
1.10.2 Secondary Research
1.10.3 Market Evaluation & Forecasting Methodology
1.11 Frequently Asked Questions (FAQs)
1.12 Associated Visiongain Reports
1.13 About Visiongain
2 Executive Summary
3 Zero Emission Aircraft Industry Structure
3.1 Overview
3.1.1 Propulsion Alternatives
3.1.2 Fuel cells and hydrogen
3.1.3 General Aviation Aircraft Design
3.1.4 Configuration Layout
3.1.5 Initial sizing and constraint diagram
3.1.6 Wing design
3.1.7 Tail design
3.1.8 Propulsion design
3.1.9 Design visualization
3.1.10 Simulation Methods
3.1.11 Energy network model
3.1.12 Optimization
4 Global Market Dynamics
4.1 Current Trends in the Global Market
4.1.1 Increased Government Policy Driving Investment
4.1.2 Shifting to Sustainable Aviation Fuel (SAF)
4.1.3 Changes in Aircraft Design and Components to Reduce Fuel Consumption
4.1.4 Aviation Efficiency Can Be Improved Significantly
4.1.5 Global Emission Trends And Climate Change
4.2 Market Driving Factors
4.2.1 Environmental Trends in Aviation
4.2.2 Aircraft Emissions Have Declined Over Time
4.2.3 Transformation in Global Investment and Development Patterns
4.2.4 Transition to Low-Carbon Development
4.3 Market Restraining Factors
4.3.1 Electric Plane Construction Has Been Demonstrated But The Technology Has Some Limitations
4.3.2 Focusing On Market-Based Mechanisms Is The Wrong Approach
4.3.3 Influence of Air Traffic On Climate
4.3.4 Fuel Impacts Are Complex And Affect Different Disciplines And Industries
4.4 Opportunities in the Global Market
4.4.1 Passenger Vehicles – an Area of Opportunity
4.4.2 Steps Are Being Taken To Reduce Aviation Emissions In The Longer-Term
4.4.3 Aggressive Research Goals
4.4.4 Research On The Flying System Itself Is Mainly Carried Out By Start-Ups
4.4.5 Operational and Technical Abatement Opportunities Open to the Aviation Sector
4.5 Challenges in the Global Market
4.5.1 Hydrogen Fuels Propose Challenges for Designers in Terms of Mass and Volume Requirements
4.5.2 Aircraft Design Improvements Mostly Fall Into One Of Three Areas
4.5.3 Aircraft Technology Development And Capital Turnover
4.5.4 Storage and Safety Is The Biggest Challenge When It Comes To Using Hydrogen
4.5.5 More Stakeholders for Sustainable Aviation Fuel
4.5.6 Weight Management
4.5.7 Aircraft Fuelled by Hydrogen Have A Reputation For Being A Dangerous Endeavor
4.6 Air Transport Statistics
4.6.1 Air Transport Freight 2010-2019
4.6.2 Air Transport Registered Carrier Departures by Region 2010 – 2019
4.6.3 Passengers carried by air transport by Region 2010 – 2019
4.7 Swot Analysis for Global Market
4.8 PESTLE Analysis for Global Market
5 Global Zero Emission Aircraft Market Analysis
5.1 Global Market Outlook
5.1.1 Market Scenario by Value
5.2 Regional Market Size Estimation and Forecast
5.2.1 Market Scenario
5.3 Global Market Size Estimation and Forecast by Fuel Type
5.3.1 Sustainable aviation fuels (SAF)
5.3.2 Hydrogen
5.3.3 Solar
5.3.4 Market Scenario
5.4 Global Market Size Estimation and Forecast by Technology
5.4.1 Electric Motor Technology
5.4.2 Power Management and Distribution Technology
5.4.3 Fuel Cell Technology
5.4.4 Hydrogen Fuel Storage
5.4.5 Market Scenario
5.5 Global Market Size Estimation and Forecast by Passenger Capacity
5.5.1 100-passenger capacity
5.5.2 100 to 200 passengers Capacity
5.5.3 Market Scenario
5.6 Global Market Size Estimation and Forecast by Travel Range
5.6.1 Market Scenario
6 North America Zero Emission Aircraft Market Analysis
6.1 North America Market Outlook
6.2 North America Market Size Estimation and Forecast by Investment
6.2.1 Market Scenario
6.3 Country Market Size Estimation and Forecast
6.3.1 US Zero Emission Aircraft Market Analysis
6.3.2 Canada Zero Emission Aircraft Market Analysis
6.3.3 Mexico Zero Emission Aircraft Market Analysis
6.3.4 Market Scenario
6.4 North America Market Size Estimation and Forecast Fuel Type
6.4.1 Market Scenario
6.5 North America Market Size Estimation and Forecast by Technology
6.5.1 Market Scenario
6.6 North America Market Size Estimation and Forecast by Passenger Capacity
6.6.1 Market Scenario
6.7 North America Market Size Estimation and Forecast by Travel Range
6.7.1 Market Scenario
7 Europe Zero Emission Aircraft Market Analysis
7.1 Europe Market Outlook
7.2 Europe Market Size Estimation and Forecast
7.2.1 Market Scenario
7.3 Country Market Size Estimation and Forecast
7.3.1 Germany Zero Emission Aircraft Market Analysis
7.3.2 UK Zero Emission Aircraft Market Analysis
7.3.3 France Zero Emission Aircraft Market Analysis
7.3.4 Italy Zero Emission Aircraft Market Analysis
7.3.5 Spain Zero Emission Aircraft Market Analysis
7.3.6 Market Scenario
7.4 Europe Market Size Estimation and Forecast Fuel Type
7.4.1 Market Scenario
7.5 Europe Market Size Estimation and Forecast by Technology
7.5.1 Market Scenario
7.6 Europe Market Size Estimation and Forecast by Passengers Capacity
7.6.1 Market Scenario
7.7 Europe Market Size Estimation and Forecast by Travel Range
7.7.1 Market Scenario
8 Asia-Pacific Zero Emission Aircraft Market Analysis
8.1 Asia-Pacific Market Outlook
9 Asia-Pacific Market Size Estimation and Forecast
9.1.1 Market Scenario
9.2 Country Market Size Estimation and Forecast
9.2.1 China Zero Emission Aircraft Market Analysis
9.2.2 India Zero Emission Aircraft Market Analysis
9.2.3 Japan Zero Emission Aircraft Market Analysis
9.2.4 South Korea Zero Emission Aircraft Market Analysis
9.2.5 Australia Zero Emission Aircraft Market Analysis
9.2.6 Market Scenario
9.3 Asia-Pacific Market Size Estimation and Forecast Fuel Type
9.3.1 Market Scenario
9.4 Asia-Pacific Market Size Estimation and Forecast by Technology
9.4.1 Market Scenario
9.5 Asia-Pacific Market Size Estimation and Forecast by Passenger Capacity
9.5.1 Market Scenario
9.6 Asia-Pacific Market Size Estimation and Forecast by Travel Range
9.6.1 Market Scenario
10 LAMEA Zero Emission Aircraft Market Analysis
10.1 LAMEA Market Outlook
10.2 LAMEA Market Size Estimation and Forecast
10.2.1 Market Scenario
10.3 Country Market Size Estimation and Forecast
10.3.1 Brazil Zero Emission Aircraft Market Analysis
10.3.2 South Africa Zero Emission Aircraft Market Analysis
10.3.3 Saudi Arabia Zero Emission Aircraft Market Analysis
10.3.4 Turkey Zero Emission Aircraft Market Analysis
10.3.5 UAE Zero Emission Aircraft Analysis
10.3.6 Market Scenario
10.4 LAMEA Market Size Estimation and Forecast Fuel Type
10.4.1 Market Scenario
10.5 LAMEA Market Size Estimation and Forecast by Technology
10.5.1 Market Scenario
10.6 LAMEA Market Size Estimation and Forecast by Passenger Capacity
10.6.1 Market Scenario
10.7 LAMEA Market Size Estimation and Forecast by Travel Range
10.7.1 Market Scenario
11 Leading Company Profiles
11.1 Airbus S.A.S
11.1.1 Company Snapshot
11.1.2 Company Overview
11.1.3 Airbus Future Project
11.1.4 Company Financial Profile
11.1.5 Company Product Benchmarking
11.1.6 Company Recent Developments
11.2 Thales SA
11.2.1 Company Snapshot
11.2.2 Company Overview
11.2.3 Company Financial Profile
11.2.4 Company Product Benchmarking
11.2.5 Company Recent Developments
11.3 Lockheed Martin Corporation
11.3.1 Company Snapshot
11.3.2 Company Overview
11.3.3 Company Financial Profile
11.3.4 Company Product Benchmarking
11.3.5 Company Recent Developments
11.4 Blue Origin
11.4.1 Company Snapshot
11.4.2 Company Overview
11.4.3 Company Financial Profile
11.4.4 Company Product Benchmarking
11.4.5 Company Recent Developments
11.5 Boeing Aerospace
11.5.1 Company Snapshot
11.5.2 Company Overview
11.5.3 Company Financial Profile
11.5.4 Company Product Benchmarking
11.5.5 Company Recent Developments
11.6 Northrop Grumman Corporation
11.6.1 Company Snapshot
11.6.2 Company Overview
11.6.3 Company Financial Profile
11.6.4 Company Product Benchmarking
11.6.5 Company Recent Developments
11.7 Reaction Engines
11.7.1 Company Snapshot
11.7.2 Company Overview
11.7.3 Company Financial Profile
11.7.4 Company Product Benchmarking
11.7.5 Company Recent Developments
11.8 SpaceX Aerospace company
11.8.1 Company Snapshot
11.8.2 Company Overview
11.8.3 Company Financial Profile
11.8.4 Company Product Benchmarking
11.8.5 Company Recent Developments
11.9 Rolls-Royce Holdings PLC
11.9.1 Company Snapshot
11.9.2 Company Overview
11.9.3 Company Financial Profile
11.9.4 Company Product Benchmarking
11.9.5 Company Recent Developments
11.10 ZeroAvia Company
11.10.1 Company Snapshot
11.10.2 Company Overview
11.10.3 Company Financial Profile
11.10.4 Company Product Benchmarking
11.10.5 Company Recent Developments
12 Conclusion and Recommendations
12.1.1 Aviation Emissions Are Being Responsibly Controlled.
12.1.2 Hybrid propulsion and authorization for a secondary aircraft energy system
12.1.3 Smarter Investment In Technology And Changes In Operations
12.1.4 New models have highly powerful engines and new long-haul twin-engine aircraft
12.1.5 Retrofitting A Regional Aircraft Engine For Hydrogen Combustion
13 Glossary Terms
List of Tables
Table 1. Global Zero Emission Aircraft Market Segmentation
Table 2. Global Zero Emission Aircraft Market Snapshot, 2021 & 2031 (US$million, CAGR %)
Table 3. Properties of hydrogen compared to jet fuel
Table 4. Design requirements and specifications
Table 5. Wing parameters
Table 6. Fuel Consumption Flights
Table 7. North America Air Transport Freight (2010- 2019)
Table 8. Europe Air Transport Freight (2010- 2019)
Table 9. Asia-Pacific Air Transport Freight (2010- 2019)
Table 10. Latin America Air Transport Freight (2010- 2019)
Table 11. North America Air Transport Registered Carrier Departures (2010- 2019)
Table 12. Europe Air Transport Registered Carrier Departures (2010- 2019)
Table 13. Asia-Pacific Air Transport Registered Carrier Departures (2010- 2019)
Table 14. Latin America Air Transport Registered Carrier Departures (2010- 2019)
Table 15. North America Passengers Carried By Air Transport (2010- 2019)
Table 16. Europe Passengers Carried By Air Transport (2010- 2019)
Table 17. Asia-Pacific Passengers Carried By Air Transport (2010- 2019)
Table 1. Latin America Passengers Carried By Air Transport (2010- 2019)
Table 2. Zero Emission Aircraft Swot Analysis
Table 3. Global Zero Emission Aircraft Market Forecast, 2021-2031 (USD Mn, AGR (%), CAGR (%))
Table 4. Global Zero Emission Aircraft Market by Region, 2021-2031 (USD Mn, AGR (%), CAGR (%))
Table 5. Global Zero Emission Aircraft Market by Fuel Type, 2021-2031 (USD Mn, AGR (%), CAGR(%))
Table 6. Global Zero Emission Aircraft Market by Technology, 2021-2031 (USD Mn, AGR (%), CAGR (%))
Table 7. Global Zero Emission Aircraft Market by Passenger Capacity, 2021-2031 (USD Mn, AGR (%), CAGR(%))
Table 8. Global Zero Emission Aircraft Market by Travel Range, 2021-2031 (USD Mn, AGR (%), CAGR(%))
Table 9. North America Zero Emission Aircraft Market by Investment, 2021-2031 (USD Mn, AGR (%), CAGR(%))
Table 10. North America Zero Emission Aircraft Market by Country, 2021-2031 (USD Mn, AGR (%), CAGR(%))
Table 11. North America Zero Emission Aircraft Market by Fuel Type, 2021-2031 (USD Mn, AGR (%), CAGR(%))
Table 12. North America Zero Emission Aircraft Market by Technology, 2021-2031 (USD Mn, AGR (%), CAGR(%))
Table 13. North America Zero Emission Aircraft Market by Passenger Capacity, 2021-2031 (USD Mn, AGR (%), CAGR(%))
Table 14. North America Zero Emission Aircraft Market by Travel Range, 2021-2031 (USD Mn, AGR (%), CAGR(%))
Table 15. Europe Zero Emission Aircraft Market by Investment, 2021-2031 (USD Mn, AGR (%), CAGR(%))
Table 16. Europe Zero Emission Aircraft Market by Country, 2021-2031 (USD Mn, AGR (%), CAGR(%))
Table 17. Europe Zero Emission Aircraft Market by Fuel Type, 2021-2031 (USD Mn, AGR (%), CAGR(%))
Table 18. Europe Zero Emission Aircraft Market by Technology, 2021-2031 (USD Mn, AGR (%), CAGR(%))
Table 19. Europe Zero Emission Aircraft Market by Passenger Capacity, 2021-2031 (USD Mn, AGR (%), CAGR (%))
Table 20. Europe Zero Emission Aircraft Market by Travel Range, 2021-2031 (USD Mn, AGR (%), CAGR(%))
Table 21. Asia-Pacific Zero Emission Aircraft Market by Investment, 2021-2031 (USD Mn, AGR (%), CAGR(%))
Table 22. Asia-Pacific Zero Emission Aircraft Market by Country, 2021-2031 (USD Mn, AGR (%), CAGR(%))
Table 23. Asia-Pacific Zero Emission Aircraft Market by Fuel Type, 2021-2031 (USD Mn, AGR (%), CAGR(%))
Table 24. Asia-Pacific Zero Emission Aircraft Market by Technology, 2021-2031 (USD Mn, AGR (%), CAGR(%))
Table 25. Asia-Pacific Zero Emission Aircraft Market by Passenger Capacity, 2021-2031 (USD Mn, AGR (%), CAGR(%))
Table 26. Asia-Pacific Zero Emission Aircraft Market by Travel Range, 2021-2031 (USD Mn, AGR (%), CAGR(%))
Table 27. LAMEA Zero Emission Aircraft Market by Investment, 2021-2031 (USD Mn, AGR (%), CAGR(%))
Table 28. LAMEA Zero Emission Aircraft Market by Country, 2021-2031 (USD Mn, AGR (%), CAGR(%))
Table 29. LAMEA Zero Emission Aircraft Market by Fuel Type, 2021-2031 (USD Mn, AGR (%), CAGR(%))
Table 30. LAMEA Zero Emission Aircraft Market by Technology, 2021-2031 (USD Mn, AGR (%), CAGR(%))
Table 31. LAMEA Zero Emission Aircraft Market by Passenger Capacity, 2021-2031 (USD Mn, AGR (%), CAGR(%))
Table 32. LAMEA Zero Emission Aircraft Market by Travel Range, 2021-2031 (USD Mn, AGR (%), CAGR(%))
Table 34. Airbus S.A.S: Company Information
Table 35. Airbus S.A.S: Company Revenue 2016-2020 (US$Mn, AGR %)
Table 36. Airbus S.A.S: Company Product and Service Benchmarking
Table 37. Airbus S.A.S: Company Recent Developments till April,2021
Table 38. Thales SA: Company Information
Table 39. Thales SA: Company Revenue 2016-2020 (US$Mn, AGR %)
Table 40. Thales SA: Company Product and Service Benchmarking
Table 41. Thales SA: Company Recent Developments till April,2021
Table 42. Lockheed Martin Corporation: Company Information
Table 43. Lockheed Martin Corporation: Company Revenue 2016-2020 (US$Mn, AGR %)
Table 44. Lockheed Martin Corporation: Company Product and Service Benchmarking
Table 45. Lockheed Martin Corporation: Company Recent Developments till April,2021
Table 46. Blue Origin Federation, LLC: Company Information
Table 47. Blue Origin Federation, LLC: Company Product and Service Benchmarking
Table 48. Blue Origin Federation, LLC: Company Recent Developments till April,2021
Table 49. Boeing Aerospace: Company Information
Table 50. Boeing Aerospace: Company Revenue 2016-2020 (US$Mn, AGR %)
Table 51. Boeing Aerospace: Company Product and Service Benchmarking
Table 52. Boeing Aerospace: Company Recent Developments till April,2021
Table 53. Northrop Grumman Corporation: Company Information
Table 54. Northrop Grumman Corporation: Company Revenue 2016-2020 (US$Mn, AGR %)
Table 55. Northrop Grumman Corporation: Company Product and Service Benchmarking
Table 56. Northrop Grumman Corporation: Company Recent Developments till April,2021
Table 57. Reaction Engines: Company Information
Table 58. Reaction Engines: Company Product and Service Benchmarking
Table 59. Reaction Engines: Company Recent Developments till April,2021
Table 60. SpaceX Aerospace: Company Information
Table 61. SpaceX Aerospace: Company Product and Service Benchmarking
Table 62. SpaceX Aerospace: Company Recent Developments till April,2021
Table 63. Rolls-Royce Holdings PLC: Company Information
Table 64. Rolls-Royce Holdings PLC: Company Revenue 2016-2020 (US$Mn, AGR %)
Table 65. Rolls-Royce Holdings PLC: Company Product and Service Benchmarking
Table 66. Rolls-Royce Holdings PLC: Company Recent Developments till April,2021
Table 67. ZeroAvia Company: Company Information
Table 68. ZeroAvia Company: Company Recent Developments till April,2021
List of Figures
Figure 1. Power System Schematic.
Figure 2. Workflow diagram of the design and optimization process
Figure 3. Front view
Figure 4. Top view
Figure 5. Fuselage shape and tank integration
Figure 6. Fuselage shape and tank integration
Figure 7. Current Trends in the Global Market
Figure 8. Market Driving Factors
Figure 9. Market Restraining Factors
Figure 10. Opportunities in the Industry
Figure 11. Challenges in the Industry
Figure 12. Proposed integral tank configurations for a regional aircraft (a) and for a long-range wide- body aircraft
Figure 13. North America Air Transport Freight (2010- 2019)
Figure 14. Europe Air Transport Freight (2010- 2019)
Figure 15. Asia-Pacific Air Transport Freight (2010- 2019)
Figure 16. Latin America Air Transport Freight (2010- 2019)
Figure 17. North America Air Transport Registered Carrier Departures (2010- 2019)
Figure 18. Europe Air Transport Registered Carrier Departures (2010- 2019)
Figure 19. Asia-Pacific Air Transport Registered Carrier Departures (2010- 2019)
Figure 20. Latin America Air Transport Registered Carrier Departures (2010- 2019)
Figure 21. North America Passengers Carried By Air Transport (2010- 2019)
Figure 22. Europe Passengers Carried By Air Transport (2010- 2019)
Figure 23. Asia-Pacific Passengers Carried By Air Transport (2010- 2019)
Figure 24. Latin America Passengers Carried By Air Transport (2010- 2019)
Figure 25. Global Zero-Emission Aircraft Market by Value, 2021-2031 (USD Mn, AGR (%)
Figure 26. Global Zero-Emission Aircraft Market by Region, 2021-2031 (USD Mn, AGR (%)
Figure 27. Global Zero-Emission Aircraft Market Share Forecast by Region, 2021, 2026, 2031 (%)
Figure 28. Global Zero-Emission Aircraft Market by Fuel Type, 2021-2031 (USD Mn, AGR (%)
Figure 29. Global Zero-Emission Aircraft Market Share Forecast by Fuel Type, 2021, 2026, 2031 (%)
Figure 30. Global Zero-Emission Aircraft Market by Technology, 2021-2031 (USD Mn, AGR (%)
Figure 31. Global Zero-Emission Aircraft Market Share Forecast by Technology, 2021, 2026, 2031 (%)
Figure 32. Global Zero-Emission Aircraft Market by Passenger Capacity, 2021-2031 (USD Mn, AGR (%)
Figure 33. Global Zero-Emission Aircraft Market Share Forecast by Passengers Capacity, 2021, 2026, 2031 (%)
Figure 34. Global Zero-Emission Aircraft Market by Travel Range, 2021-2031 (USD Mn, AGR (%)
Figure 35. Global Zero-Emission Aircraft Market Share Forecast by Travel Range, 2021, 2026, 2031 (%)
Figure 36. North America Zero-Emission Aircraft Market by Investment, 2021-2031 (USD Mn, AGR (%)
Figure 37. North America Zero-Emission Aircraft Market by Country, 2021-2031 (USD Mn, AGR (%)
Figure 38. North America Zero-Emission Aircraft Market by Fuel Type, 2021-2031 (USD Mn, AGR (%)
Figure 39. North America Zero-Emission Aircraft Market by Technology, 2021-2031 (USD Mn, AGR (%)
Figure 40. North America Zero-Emission Aircraft Market by Passenger Capacity, 2021-2031 (USD Mn, AGR (%)
Figure 41. North America Zero-Emission Aircraft Market by Travel Range, 2021-2031 (USD Mn, AGR (%)
Figure 42. Europe Zero-Emission Aircraft Market by Value, 2021-2031 (USD Mn, AGR (%)
Figure 43. Europe Zero-Emission Aircraft Market by Country, 2021-2031 (USD Mn, AGR (%)
Figure 44. Europe Zero-Emission Aircraft Market by Fuel Type, 2021-2031 (USD Mn, AGR (%)
Figure 45. Europe Zero-Emission Aircraft Market by Technology, 2021-2031 (USD Mn, AGR (%)
Figure 46. Europe Zero-Emission Aircraft Market by Passengers Capacity, 2021-2031 (USD Mn, AGR (%)
Figure 47. Europe Zero-Emission Aircraft Market by Travel Range, 2021-2031 (USD Mn, AGR (%)
Figure 48. Asia-Pacific Zero-Emission Aircraft Market by Value, 2021-2031 (USD Mn, AGR (%)
Figure 49. Asia-Pacific Zero-Emission Aircraft Market by Country, 2021-2031 (USD Mn, AGR (%)
Figure 50. Asia-Pacific Zero-Emission Aircraft Market by Fuel Type, 2021-2031 (USD Mn, AGR (%)
Figure 51. Asia-Pacific Zero-Emission Aircraft Market by Technology, 2021-2031 (USD Mn, AGR (%)
Figure 52. Asia-Pacific Zero-Emission Aircraft Market by Passenger Capacity, 2021-2031 (USD Mn, AGR (%)
Figure 53. Asia-Pacific Zero-Emission Aircraft Market by Travel Range, 2021-2031 (USD Mn, AGR (%)
Figure 54. LAMEA Zero-Emission Aircraft Market by Value, 2021-2031 (USD Mn, AGR (%)
Figure 55. LAMEA Zero-Emission Aircraft Market by Country, 2021-2031 (USD Mn, AGR (%)
Figure 56. LAMEA Zero-Emission Aircraft Market by Fuel Type, 2021-2031 (USD Mn, AGR (%)
Figure 57. LAMEA Zero-Emission Aircraft Market by Technology, 2021-2031 (USD Mn, AGR (%)
Figure 58. LAMEA Zero-Emission Aircraft Market by Passenger Capacity, 2021-2031 (USD Mn, AGR (%)
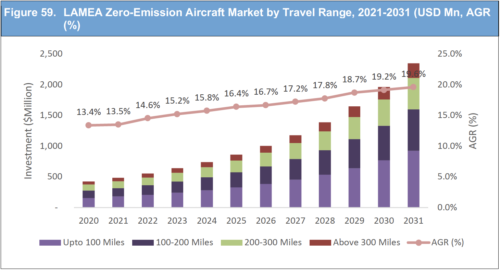
Figure 59. LAMEA Zero-Emission Aircraft Market by Travel Range, 2021-2031 (USD Mn, AGR (%)
Figure 60. Airbus S.A.S: Company Revenue 2016-2020 (US$Mn, AGR %)
Figure 61. Airbus S.A.S: Company Operating Income 2016-2020 (US$Mn, AGR %)
Figure 62. Airbus S.A.S: Company Net Income 2016-2020 (US$Mn, AGR %)
Figure 63. Airbus S.A.S: Company EBITDA 2016-2020 (US$Mn, AGR %)
Figure 64. Thales SA: Company Revenue 2016-2020 (US$Mn, AGR %)
Figure 65. Thales SA: Company Operating Income 2016-2020 (US$Mn, AGR %)
Figure 66. Thales SA: Company Net Income 2016-2020 (US$Mn, AGR %)
Figure 67. Thales SA: Company EBITDA 2016-2020 (US$Mn, AGR %)
Figure 68. Lockheed Martin Corporation: Company Revenue 2016-2020 (US$Mn, AGR %)
Figure 69. Lockheed Martin Corporation: Company Operating Income 2016-2020 (US$Mn, AGR %)
Figure 70. Lockheed Martin Corporation: Company Net Income 2016-2020 (US$Mn, AGR %)
Figure 71. Lockheed Martin Corporation: Company EBITDA 2016-2020 (US$Mn, AGR %)
Figure 72. Boeing Aerospace: Company Revenue 2016-2020 (US$Mn, AGR %)
Figure 73. Boeing Aerospace: Company Operating Income 2016-2020 (US$Mn, AGR %)
Figure 74. Boeing Aerospace: Company Net Income 2016-2020 (US$Mn, AGR %)
Figure 75. Boeing Aerospace: Company EBITDA 2016-2020 (US$Mn, AGR %)
Figure 76. Northrop Grumman Corporation: Company Revenue 2016-2020 (US$Mn, AGR %)
Figure 77. Northrop Grumman Corporation: Company Operating Income 2016-2020 (US$Mn, AGR %)
Figure 78. Northrop Grumman Corporation: Company Net Income 2016-2020 (US$Mn, AGR %)
Figure 79. Northrop Grumman Corporation: Company EBITDA 2016-2020 (US$Mn, AGR %)
Figure 80. Rolls-Royce Holdings PLC: Company Revenue 2016-2020 (US$Mn, AGR %)
Figure 81. Rolls-Royce Holdings PLC: Company Operating Income 2016-2020 (US$Mn, AGR %)
Figure 82. Rolls-Royce Holdings PLC: Company Net Income 2016-2020 (US$Mn, AGR %)
Figure 83. Rolls-Royce Holdings PLC: Company EBITDA 2016-2020 (US$Mn, AGR %)
List of Companies Profiled
Airbus S.A.S
Blue Origin Federation, LLC
Boeing Aerospace
Lockheed Martin Corporation
Northrop Grumman Corporation
Reaction Engines
Rolls-Royce Holdings PLC
SpaceX Aerospace Company
Thales SA
ZeroAvia
List of Association and Organization
Air Transport Association
Environmental Working Group
Experimental Aircraft Association (EAA)
Flight Safety Foundation (FSA)
General Aviation Manufacturers Association (GAMA)
Greenpeace Fund
International Air Transport Association (IATA)
International Civil Aviation Organization (ICAO)
International Union of Air Pollution Prevention and Environmental Protection Associations (IUAPPA)
National Rural Electric Cooperative Association
Natural Resources Defense Council
The Zero Emission Transportation Association (ZETA)
Union of Concerned Scientists
World Health Organization (WHO)