Industries > Chemicals > Water and Wastewater Treatment Equipment Market Report 2019-2029
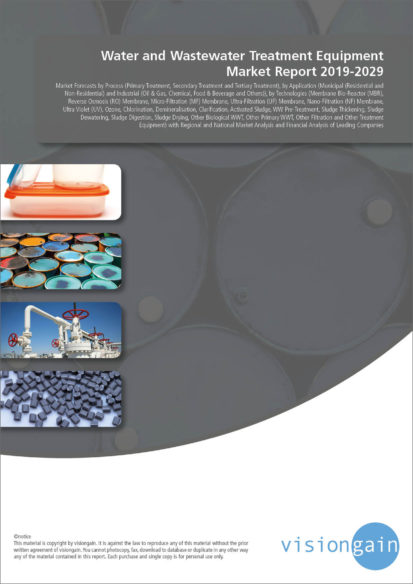
Water and Wastewater Treatment Equipment Market Report 2019-2029
Market Forecasts by Process (Primary Treatment, Secondary Treatment and Tertiary Treatment), by Application (Municipal (Residential and Non-Residential) and Industrial (Oil & Gas, Chemical, Food & Beverage and Others)), by Technologies (Membrane Bio-Reactor (MBR), Reverse Osmosis (RO) Membrane, Micro-Filtration (MF) Membrane, Ultra-Filtration (UF) Membrane, Nano-Filtration (NF) Membrane, Ultra Violet (UV), Ozone, Chlorination, Demineralisation, Clarification, Activated Sludge, WW Pre-Treatment, Sludge Thickening, Sludge Dewatering, Sludge Digestion, Sludge Drying, Other Biological WWT, Other Primary WWT, Other Filtration and Other Treatment Equipment) with Regional and National Market Analysis and Financial Analysis of Leading Companies
The Water and Wastewater Treatment Equipment Market was valued at $31.15 billion in 2018 and is expected to grow at a CAGR of 3.5% over the forecast period from 2019-2029. Increasing infrastructure investment in setting up water and wastewater treatment facilities across the globe due to increasing environmental and health concern along with strict government regulations is expected to fuel the demand overall market. Increasing demand for clean water from emerging markets as a result of increasing population, industrialization, and fast urbanization results in a marked increase in equipment acceptance.
Key government agencies including the U.S. Environmental Protection Agency (EPA), the European Environment Agency (EEA), and the Central Pollution Control Board (CPCB) play a important role in enhancing water quality and pollution prevention. Increasing stringent government regulations to supply fresh water to municipal and industrial application to reduce the environmental and health impact is expected to enhance the overall market growth.
APAC region is expected to dominate the overall market with more than 35% of market share in 2018 and will grow with highest CAGR in coming years. The major driving factors include presence of major industries, huge population base, increasing level of contaminated water, water scarcity, growing industrialization and urbanization.
Leading companies featured in the Water and Wastewater Treatment Equipment Market Report 2019-2029 report include 3M, Aquatech International, Calgon Carbon Corporation, DowDuPont Inc., Ecolab Inc., Evoqua Water Technologies, Pentair Plc., Suez Environnement S.A., Veolia Environment SA, Xylem Inc. among others. Mergers, acquisitions, and joint ventures constitute some of the industry players’ common strategies for reducing product price overall and maintaining extremely competitive conditions. In order to guarantee continued raw material supplies and ease of installation services, many actors in the sector create alliances with raw material providers and third-party installers.
The comprehensive report provides market estimates and forecasts for leading domestic markets across the world for the period from 2019 to 2029. In addition, the report includes dedicated leading companies covering 10 leading water and wastewater treatment equipment producers.
The report on the Water and Wastewater Treatment Equipment Market Report 2019-2029 will appreciate anyone who wants to better understand the market in various end use industries. It will be useful for companies that want to better understand the part of the market in which they are already involved or those that want to enter or expand into another regional or technical part of the water and wastewater treatment equipment industry.
Visiongain is a trading partner with the US Federal Government
CCR Ref number: KD4R6
Do you have any custom requirements we can help you with? Any need for specific country, geo region, market segment or specific company information? Contact us today, we can discuss your needs and see how we can help: sara.peerun@visiongain.com
1. Report Overview
1.1. Water and Wastewater Treatment Equipment Market Overview
1.2. Why You Should Read This Report
1.3. How This Report Delivers
1.4. Key Questions Answered by This Analytical Report Include
1.5. Who is This Report For?
1.6. Methodology
1.6.1. Primary Research
1.6.2. Secondary Research
1.6.3. Market Evaluation & Forecasting Methodology
1.7. Frequently Asked Questions (FAQ)
1.8. Associated visiongain Reports
1.9. About visiongain
2. Introduction to the Water and Wastewater Treatment Equipment Market
2.1. Overview
2.2. Global Water and Wastewater Treatment Equipment Market Structure
2.3. Water and Wastewater Treatment Equipment Market Definition
2.4. Water and Wastewater Treatment Equipment Submarkets Definition by Process
2.4.1. Primary Treatment
2.4.2. Secondary Treatment
2.4.3. Tertiary Treatment
2.5. Water and Wastewater Treatment Equipment Submarkets Definition by Application
2.5.1. Municipal
2.5.1.1. Residential
2.5.1.2. Non-Residential
2.5.2. Industrial
2.5.2.1. Oil & Gas
2.5.2.2. Chemical
2.5.2.3. Food & Beverage
2.5.2.4. Others
2.6. Water and Wastewater Treatment Equipment Submarkets Definition by Technologies
2.6.1. Membrane Bio-Reactor (MBR)
2.6.2. Reverse Osmosis (RO) Membrane
2.6.3. Micro-Filtration (MF) Membrane
2.6.4. Ultra-Filtration (UF) Membrane
2.6.5. Nano-Filtration (NF) Membrane
2.6.6. Ultra Violet (UV)
2.6.7. Ozone
2.6.8. Chlorination
2.6.9. Demineralisation
2.6.10. Clarification
2.6.11. Activated Sludge
2.6.12. WW Pre-Treatment
2.6.13. Sludge Thickening
2.6.14. Sludge Dewatering
2.6.15. Sludge Digestion
2.6.16. Sludge Drying
2.6.17. Other Biological WWT
2.6.18. Other Primary WWT
2.6.19. Other Filtration
2.6.20. Other Treatment Equipment
3. Global Water and Wastewater Treatment Equipment Market Dynamics
3.1. Global Water and Wastewater Treatment Equipment Market Overview
3.2. Global Water and Wastewater Treatment Equipment Market Drivers & Restraints 2019
3.2.1. Global Water and Wastewater Treatment Equipment Market Drivers 2019
3.2.1.1. Driver 1
3.2.1.2. Driver 2
3.2.1.3. Driver 3
3.2.2. Global Water and Wastewater Treatment Equipment Market Restraints 2019
3.2.2.1. Restraints 1
3.2.2.2. Restraints 2
3.2.2.3. Restraints 3
3.2.3. Global Water and Wastewater Treatment Equipment Market Trends 2019
3.2.3.1. Trend 1
3.2.3.2. Trend 2
3.2.3.3. Trend 3
4. Global Water and Wastewater Treatment Equipment Market by Process Forecast 2019-2029
5. Global Water and Wastewater Treatment Equipment Market by Application Forecast 2019-2029
6. Global Water and Wastewater Treatment Equipment Market by Technologies Forecast 2019-2029
7. Regional & Leading National Water and Wastewater Treatment Equipment Market Forecast 2019-2029
7.1. North America Water and Wastewater Treatment Equipment Market 2019-2029
7.1.1. Overview of the North America Water and Wastewater Treatment Equipment Market 2019-2029
7.1.2. Drivers & Restraints of the North America Water and Wastewater Treatment Equipment Market 2019-2029
7.1.3. North America Water and Wastewater Treatment Equipment Market by Process 2019-2029
7.1.4. North America Water and Wastewater Treatment Equipment Market by Application 2019-2029
7.1.5. North America Water and Wastewater Treatment Equipment Market by Technologies 2019-2029
7.1.6. North America Water and Wastewater Treatment Equipment Market by County 2019-2029
7.2. South America Water and Wastewater Treatment Equipment Market 2019-2029
7.2.1. Overview of the South America Water and Wastewater Treatment Equipment Market 2019-2029
7.2.2. Drivers & Restraints of the South America Water and Wastewater Treatment Equipment Market 2019-2029
7.2.3. South America Water and Wastewater Treatment Equipment Market by Process 2019-2029
7.2.4. South America Water and Wastewater Treatment Equipment Market by Application 2019-2029
7.2.5. South America Water and Wastewater Treatment Equipment Market by Technologies 2019-2029
7.2.6. South America Water and Wastewater Treatment Equipment Market by County 2019-2029
7.3. Europe Water and Wastewater Treatment Equipment Market 2019-2029
7.3.1. Overview of the Europe Water and Wastewater Treatment Equipment Market 2019-2029
7.3.2. Drivers & Restraints of the Europe Water and Wastewater Treatment Equipment Market 2019-2029
7.3.3. Europe Water and Wastewater Treatment Equipment Market by Process 2019-2029
7.3.4. Europe Water and Wastewater Treatment Equipment Market by Application 2019-2029
7.3.5. Europe Water and Wastewater Treatment Equipment Market by Technologies 2019-2029
7.3.6. Europe Water and Wastewater Treatment Equipment Market by County 2019-2029
7.4. Asia Pacific Water and Wastewater Treatment Equipment Market 2019-2029
7.4.1. Overview of the Asia Pacific Water and Wastewater Treatment Equipment Market 2019-2029
7.4.2. Drivers & Restraints of the Asia Pacific Water and Wastewater Treatment Equipment Market 2019-2029
7.4.3. Asia Pacific Water and Wastewater Treatment Equipment Market by Process 2019-2029
7.4.4. Asia Pacific Water and Wastewater Treatment Equipment Market by Application 2019-2029
7.4.5. Asia Pacific Water and Wastewater Treatment Equipment Market by Technologies 2019-2029
7.4.6. Asia Pacific Water and Wastewater Treatment Equipment Market by County 2019-2029
7.5. Middle East & Africa Water and Wastewater Treatment Equipment Market 2019-2029
7.5.1. Overview of the Middle East & Africa Water and Wastewater Treatment Equipment Market 2019-2029
7.5.2. Drivers & Restraints of the Middle East & Africa Water and Wastewater Treatment Equipment Market 2019-2029
7.5.3. Middle East & Africa Water and Wastewater Treatment Equipment Market by Process 2019-2029
7.5.4. Middle East & Africa Water and Wastewater Treatment Equipment Market by Application 2019-2029
7.5.5. Middle East & Africa Water and Wastewater Treatment Equipment Market by Technologies 2019-2029
7.5.6. Middle East & Africa Water and Wastewater Treatment Equipment Market by County 2019-2029
8. Five Forces Analysis of the Water and Wastewater Treatment Equipment Market 2019-2029
9. SWOT Analysis of the Water and Wastewater Treatment Equipment Market 2019-2029
10. Leading Water and Wastewater Treatment Equipment Companies
10.1. 3M
10.1.1. Overview
10.1.2. Financial Analysis
10.1.3. Water and Wastewater Treatment Equipment Portfolio
10.1.4. Latest Developments (M&A, JVs, Process Launches, etc.) – Water and Wastewater Treatment Equipment
10.1.5. Future Outlook
10.2. Aquatech International
10.2.1. Overview
10.2.2. Financial Analysis
10.2.3. Water and Wastewater Treatment Equipment Portfolio
10.2.4. Latest Developments (M&A, JVs, Process Launches, etc.) – Water and Wastewater Treatment Equipment
10.2.5. Future Outlook
10.3. Calgon Carbon Corporation
10.3.1. Overview
10.3.2. Financial Analysis
10.3.3. Water and Wastewater Treatment Equipment Portfolio
10.3.4. Latest Developments (M&A, JVs, Process Launches, etc.) – Water and Wastewater Treatment Equipment
10.3.5. Future Outlook
10.4. DowDuPont Inc.
10.4.1. Overview
10.4.2. Financial Analysis
10.4.3. Water and Wastewater Treatment Equipment Portfolio
10.4.4. Latest Developments (M&A, JVs, Process Launches, etc.) – Water and Wastewater Treatment Equipment
10.4.5. Future Outlook
10.5. Ecolab Inc.
10.5.1. Overview
10.5.2. Financial Analysis
10.5.3. Water and Wastewater Treatment Equipment Portfolio
10.5.4. Latest Developments (M&A, JVs, Process Launches, etc.) – Water and Wastewater Treatment Equipment
10.5.5. Future Outlook
10.6. Evoqua Water Technologies
10.6.1. Overview
10.6.2. Financial Analysis
10.6.3. Water and Wastewater Treatment Equipment Portfolio
10.6.4. Latest Developments (M&A, JVs, Process Launches, etc.) – Water and Wastewater Treatment Equipment
10.6.5. Future Outlook
10.7. Pentair Plc.
10.7.1. Overview
10.7.2. Financial Analysis
10.7.3. Water and Wastewater Treatment Equipment Portfolio
10.7.4. Latest Developments (M&A, JVs, Process Launches, etc.) – Water and Wastewater Treatment Equipment
10.7.5. Future Outlook
10.8. Suez Environnement S.A
10.8.1. Overview
10.8.2. Financial Analysis
10.8.3. Water and Wastewater Treatment Equipment Portfolio
10.8.4. Latest Developments (M&A, JVs, Process Launches, etc.) – Water and Wastewater Treatment Equipment
10.8.5. Future Outlook
10.9. Veolia Environment SA
10.9.1. Overview
10.9.2. Financial Analysis
10.9.3. Water and Wastewater Treatment Equipment Portfolio
10.9.4. Latest Developments (M&A, JVs, Process Launches, etc.) – Water and Wastewater Treatment Equipment
10.9.5. Future Outlook
10.10. Xylem Inc.
10.10.1. Overview
10.10.2. Financial Analysis
10.10.3. Water and Wastewater Treatment Equipment Portfolio
10.10.4. Latest Developments (M&A, JVs, Process Launches, etc.) – Water and Wastewater Treatment Equipment
10.10.5. Future Outlook
11. Conclusions and Recommendations
11.1. Global Water and Wastewater Treatment Equipment Market Forecast 2019-2029
11.2. Regional & Leading National Water and Wastewater Treatment Equipment Market Forecast 2019-2029
11.3. Key Market Highlights
12. Glossary
Associated visiongain Reports
Visiongain Report Sales Order Form
Appendix A
About visiongain
Appendix B
Visiongain Report Evaluation Form
List of Tables
Table 3.1 Global Water and Wastewater Treatment Equipment Market Forecast 2019-2029 ($M, AGR %, CAGR %, Cumulative)
Table 3.2 Global Water and Wastewater Treatment Equipment Market Drivers & Restraints 2019
Table 4.1 Global Water and Wastewater Treatment Equipment Market, By Process, 2019-2029 ($M, AGR %)
Table 5.1 Global Water and Wastewater Treatment Equipment Market, By Application, 2019-2029 ($M, AGR %)
Table 6.1 Global Water and Wastewater Treatment Equipment Market, By Technologies, 2019-2029 ($M, AGR %)
Table 7.1 Regional & National Water and Wastewater Treatment Equipment Market Forecast 2019-2029 ($M, AGR %, CAGR %)
Table 7.2 North America Water and Wastewater Treatment Equipment Market Forecast, 2019-2029 ($M, CAGR %)
Table 7.3 Drivers & Restraints of the North America Water and Wastewater Treatment Equipment Market 2019-2029
Table 7.4 North America Water and Wastewater Treatment Equipment Market, By Process, 2019-2029 ($M, AGR %)
Table 7.5 North America Water and Wastewater Treatment Equipment Market, By Application, 2019-2029 ($M, AGR %)
Table 7.6 North America Water and Wastewater Treatment Equipment Market, By Technologies, 2019-2029 ($M, AGR %)
Table 7.7 North America Water and Wastewater Treatment Equipment Market, By Country, 2019-2029 ($M, AGR %)
Table 7.8 Europe Water and Wastewater Treatment Equipment Market Forecast, 2019-2029 ($M, CAGR %)
Table 7.9 Drivers & Restraints of the Europe Water and Wastewater Treatment Equipment Market 2019-2029
Table 7.10 Europe Water and Wastewater Treatment Equipment Market, By Process, 2019-2029 ($M, AGR %)
Table 7.11 Europe Water and Wastewater Treatment Equipment Market, By Application, 2019-2029 ($M, AGR %)
Table 7.12 Europe Water and Wastewater Treatment Equipment Market, By Technologies, 2019-2029 ($M, AGR %)
Table 7.13 Europe Water and Wastewater Treatment Equipment Market, By Country, 2019-2029 ($M, AGR %)
Table 7.14 South America Water and Wastewater Treatment Equipment Market Forecast, 2019-2029 ($M, CAGR %)
Table 7.15 Drivers & Restraints of the South America Water and Wastewater Treatment Equipment Market 2019-2029
Table 7.16 South America Water and Wastewater Treatment Equipment Market, By Process, 2019-2029 ($M, AGR %)
Table 7.17 South America Water and Wastewater Treatment Equipment Market, By Application, 2019-2029 ($M, AGR %)
Table 7.18 South America Water and Wastewater Treatment Equipment Market, By Technologies, 2019-2029 ($M, AGR %)
Table 7.19 South America Water and Wastewater Treatment Equipment Market, By Country, 2019-2029 ($M, AGR %)
Table 7.20 Asia Pacific Water and Wastewater Treatment Equipment Market Forecast, 2019-2029 ($M, CAGR %)
Table 7.21 Drivers & Restraints of the Asia Pacific Water and Wastewater Treatment Equipment Market 2019-2029
Table 7.22 Asia Pacific Water and Wastewater Treatment Equipment Market, By Process, 2019-2029 ($M, AGR %)
Table 7.23 Asia Pacific Water and Wastewater Treatment Equipment Market, By Application, 2019-2029 ($M, AGR %)
Table 7.24 Asia Pacific Water and Wastewater Treatment Equipment Market, By Technologies, 2019-2029 ($M, AGR %)
Table 7.25 Asia Pacific Water and Wastewater Treatment Equipment Market, By Country, 2019-2029 ($M, AGR %)
Table 7.26 Middle East & Africa Water and Wastewater Treatment Equipment Market Forecast, 2019-2029 ($M, CAGR %)
Table 7.27 Drivers & Restraints of the Middle East & Africa Water and Wastewater Treatment Equipment Market 2019-2029
Table 7.28 Middle East & Africa Water and Wastewater Treatment Equipment Market, By Process, 2019-2029 ($M, AGR %)
Table 7.29 Middle East & Africa Water and Wastewater Treatment Equipment Market, By Application, 2019-2029 ($M, AGR %)
Table 7.30 Middle East & Africa Water and Wastewater Treatment Equipment Market, By Technologies, 2019-2029 ($M, AGR %)
Table 7.31 Middle East & Africa Water and Wastewater Treatment Equipment Market, By Country, 2019-2029 ($M, AGR %)
Table 10.1 3M Overview (Company Revenue, Water and Wastewater Treatment Equipment, Water and Wastewater Treatment Equipment Portfolio, HQ, Ticker, Employees, Website)
Table 10.2 3M Financials 2013-2018
Table 10.3 3M Process Offerings and Features
Table 10.4 Aquatech International Overview (Company Revenue, Water and Wastewater Treatment Equipment, Water and Wastewater Treatment Equipment Portfolio, HQ, Ticker, Employees, Website)
Table 10.5 Aquatech International Financials 2013-2018
Table 10.6 Aquatech International Process Offerings and Features
Table 10.7 Calgon Carbon Corporation Overview (Company Revenue, Water and Wastewater Treatment Equipment, Water and Wastewater Treatment Equipment Portfolio, HQ, Ticker, Employees, Website)
Table 10.8 Calgon Carbon Corporation Financials 2013-2018
Table 10.9 Calgon Carbon Corporation Process Offerings and Features
Table 10.10 DowDuPont Inc. Overview (Company Revenue, Water and Wastewater Treatment Equipment, Water and Wastewater Treatment Equipment Portfolio, HQ, Ticker, Employees, Website)
Table 10.10 DowDuPont Inc. Financials 2013-2018
Table 10.12 DowDuPont Inc. Process Offerings and Features
Table 10.13 Ecolab Inc. Overview (Company Revenue, Water and Wastewater Treatment Equipment, Water and Wastewater Treatment Equipment Portfolio, HQ, Ticker, Employees, Website)
Table 10.14 Ecolab Inc. Financials 2013-2018
Table 10.15 Ecolab Inc. Process Offerings and Features
Table 10.16 Evoqua Water Technologies Overview (Company Revenue, Water and Wastewater Treatment Equipment, Water and Wastewater Treatment Equipment Portfolio, HQ, Ticker, Employees, Website)
Table 10.17 Evoqua Water Technologies Financials 2013-2018
Table 10.18 Evoqua Water Technologies Process Offerings and Features
Table 10.19 Pentair Plc. Overview (Company Revenue, Water and Wastewater Treatment Equipment, Water and Wastewater Treatment Equipment Portfolio, HQ, Ticker, Employees, Website)
Table 10.20 Pentair Plc. Financials 2013-2018
Table 10.21 Pentair Plc. Process Offerings and Features
Table 10.22 Suez Environnement S.A Overview (Company Revenue, Water and Wastewater Treatment Equipment, Water and Wastewater Treatment Equipment Portfolio, HQ, Ticker, Employees, Website)
Table 10.23 Suez Environnement S.A Financials 2013-2018
Table 10.24 Suez Environnement S.A Process Offerings and Features
Table 10.25 Veolia Environment SA Overview (Company Revenue, Water and Wastewater Treatment Equipment, Water and Wastewater Treatment Equipment Portfolio, HQ, Ticker, Employees, Website)
Table 10.26 Veolia Environment SA Financials 2013-2018
Table 10.27 Veolia Environment SA Process Offerings and Features
Table 10.28 Xylem Inc. Overview (Company Revenue, Water and Wastewater Treatment Equipment, Water and Wastewater Treatment Equipment Portfolio, HQ, Ticker, Employees, Website)
Table 10.29 Xylem Inc. Financials 2013-2018
Table 10.30 Xylem Inc. Process Offerings and Features
List of Figures
Figure 2.1 Global Water and Wastewater Treatment Equipment Market Segmentation Overview
Figure 3.1 Global Water and Wastewater Treatment Equipment Market Forecast 2019-2029 ($M, AGR %)
Figure 3.2 Global Water and Wastewater Treatment Equipment Market Drivers & Restraints 2019
Figure 4.1 Global Water and Wastewater Treatment Equipment Market by Process Value AGR Forecast 2019-2029 (AGR %)
Figure 4.2 Global Water and Wastewater Treatment Equipment Market by Process Forecast 2019-2029 ($M, Global AGR %)
Figure 4.3 Global Water and Wastewater Treatment Equipment Market by Process Value Share Forecast 2018 (%)
Figure 4.4 Global Water and Wastewater Treatment Equipment Market by Process Value Share Forecast 2024 (%)
Figure 4.5 Global Water and Wastewater Treatment Equipment Market by Process Value Share Forecast 2029 (%)
Figure 5.1 Global Water and Wastewater Treatment Equipment Market by Application Value AGR Forecast 2019-2029 (AGR %)
Figure 5.2 Global Water and Wastewater Treatment Equipment Market by Application Forecast 2019-2029 ($M, Global AGR %)
Figure 5.3 Global Water and Wastewater Treatment Equipment Market by Application Value Share Forecast 2018 (%)
Figure 5.4 Global Water and Wastewater Treatment Equipment Market by Application Value Share Forecast 2025 (%)
Figure 5.5 Global Water and Wastewater Treatment Equipment Market by Application Value Share Forecast 2029 (%)
Figure 6.1 Global Water and Wastewater Treatment Equipment Market by Technologies Value AGR Forecast 2019-2029 (AGR %)
Figure 6.2 Global Water and Wastewater Treatment Equipment Market by Technologies Forecast 2019-2029 ($M, Global AGR %)
Figure 6.3 Global Water and Wastewater Treatment Equipment Market by Technologies Value Share Forecast 2018 (%)
Figure 6.4 Global Water and Wastewater Treatment Equipment Market by Technologies Value Share Forecast 2026 (%)
Figure 6.5 Global Water and Wastewater Treatment Equipment Market by Technologies Value Share Forecast 2029 (%)
Figure 7.1 Global Water and Wastewater Treatment Equipment Market by Region Market Share Forecast 2018 (% Share)
Figure 7.2 Global Water and Wastewater Treatment Equipment Market by Region Market Share Forecast 2024 (% Share)
Figure 7.3 Global Water and Wastewater Treatment Equipment Market by Region Market Share Forecast 2029 (% Share)
Figure 7.4 North America Water and Wastewater Treatment Equipment Market by Process Value AGR Forecast 2019-2029 (AGR %)
Figure 7.5 North America Water and Wastewater Treatment Equipment Market by Process Forecast 2019-2029 ($M, Global AGR %)
Figure 7.6 North America Water and Wastewater Treatment Equipment Market by Process Value Share Forecast 2018 (%)
Figure 7.7 North America Water and Wastewater Treatment Equipment Market by Process Value Share Forecast 2024 (%)
Figure 7.8 North America Water and Wastewater Treatment Equipment Market by Process Value Share Forecast 2029 (%)
Figure 7.9 North America Water and Wastewater Treatment Equipment Market by Application Value AGR Forecast 2019-2029 (AGR %)
Figure 7.10 North America Water and Wastewater Treatment Equipment Market by Application Forecast 2019-2029 ($M, Global AGR %)
Figure 7.11 North America Water and Wastewater Treatment Equipment Market by Application Value Share Forecast 2018 (%)
Figure 7.12 North America Water and Wastewater Treatment Equipment Market by Application Value Share Forecast 2024 (%)
Figure 7.13 North America Water and Wastewater Treatment Equipment Market by Application Value Share Forecast 2029 (%)
Figure 7.14 North America Water and Wastewater Treatment Equipment Market by Technologies Value AGR Forecast 2019-2029 (AGR %)
Figure 7.15 North America Water and Wastewater Treatment Equipment Market by Technologies Forecast 2019-2029 ($M, Global AGR %)
Figure 7.16 North America Water and Wastewater Treatment Equipment Market by Technologies Value Share Forecast 2018 (%)
Figure 7.17 North America Water and Wastewater Treatment Equipment Market by Technologies Value Share Forecast 2024 (%)
Figure 7.18 North America Water and Wastewater Treatment Equipment Market by Technologies Value Share Forecast 2029 (%)
Figure 7.19 North America Water and Wastewater Treatment Equipment Market by Country Value AGR Forecast 2019-2029 (AGR %)
Figure 7.20 North America Water and Wastewater Treatment Equipment Market by Country Forecast 2019-2029 ($M, Global AGR %)
Figure 7.21 North America Water and Wastewater Treatment Equipment Market by Country Value Share Forecast 2018 (%)
Figure 7.22 North America Water and Wastewater Treatment Equipment Market by Country Value Share Forecast 2024 (%)
Figure 7.23 North America Water and Wastewater Treatment Equipment Market by Country Value Share Forecast 2029 (%)
Figure 7.24 Europe Water and Wastewater Treatment Equipment Market by Process Value AGR Forecast 2019-2029 (AGR %)
Figure 7.25 Europe Water and Wastewater Treatment Equipment Market by Process Forecast 2019-2029 ($M, Global AGR %)
Figure 7.26 Europe Water and Wastewater Treatment Equipment Market by Process Value Share Forecast 2018 (%)
Figure 7.27 Europe Water and Wastewater Treatment Equipment Market by Process Value Share Forecast 2024 (%)
Figure 7.28 Europe Water and Wastewater Treatment Equipment Market by Process Value Share Forecast 2029 (%)
Figure 7.29 Europe Water and Wastewater Treatment Equipment Market by Application Value AGR Forecast 2019-2029 (AGR %)
Figure 7.30 Europe Water and Wastewater Treatment Equipment Market by Application Forecast 2019-2029 ($M, Global AGR %)
Figure 7.31 Europe Water and Wastewater Treatment Equipment Market by Application Value Share Forecast 2018 (%)
Figure 7.32 Europe Water and Wastewater Treatment Equipment Market by Application Value Share Forecast 2024 (%)
Figure 7.33 Europe Water and Wastewater Treatment Equipment Market by Application Value Share Forecast 2029 (%)
Figure 7.34 Europe Water and Wastewater Treatment Equipment Market by Technologies Value AGR Forecast 2019-2029 (AGR %)
Figure 7.35 Europe Water and Wastewater Treatment Equipment Market by Technologies Forecast 2019-2029 ($M, Global AGR %)
Figure 7.36 Europe Water and Wastewater Treatment Equipment Market by Technologies Value Share Forecast 2018 (%)
Figure 7.37 Europe Water and Wastewater Treatment Equipment Market by Technologies Value Share Forecast 2024 (%)
Figure 7.38 Europe Water and Wastewater Treatment Equipment Market by Technologies Value Share Forecast 2029 (%)
Figure 7.39 Europe Water and Wastewater Treatment Equipment Market by Country Value AGR Forecast 2019-2029 (AGR %)
Figure 7.40 Europe Water and Wastewater Treatment Equipment Market by Country Forecast 2019-2029 ($M, Global AGR %)
Figure 7.41 Europe Water and Wastewater Treatment Equipment Market by Country Value Share Forecast 2018 (%)
Figure 7.42 Europe Water and Wastewater Treatment Equipment Market by Country Value Share Forecast 2024 (%)
Figure 7.43 Europe Water and Wastewater Treatment Equipment Market by Country Value Share Forecast 2029 (%)
Figure 7.44 South America Water and Wastewater Treatment Equipment Market by Process Value AGR Forecast 2019-2029 (AGR %)
Figure 7.45 South America Water and Wastewater Treatment Equipment Market by Process Forecast 2019-2029 ($M, Global AGR %)
Figure 7.46 South America Water and Wastewater Treatment Equipment Market by Process Value Share Forecast 2018 (%)
Figure 7.47 South America Water and Wastewater Treatment Equipment Market by Process Value Share Forecast 2024 (%)
Figure 7.48 South America Water and Wastewater Treatment Equipment Market by Process Value Share Forecast 2029 (%)
Figure 7.49 South America Water and Wastewater Treatment Equipment Market by Application Value AGR Forecast 2019-2029 (AGR %)
Figure 7.50 South America Water and Wastewater Treatment Equipment Market by Application Forecast 2019-2029 ($M, Global AGR %)
Figure 7.51 South America Water and Wastewater Treatment Equipment Market by Application Value Share Forecast 2018 (%)
Figure 7.52 South America Water and Wastewater Treatment Equipment Market by Application Value Share Forecast 2024 (%)
Figure 7.53 South America Water and Wastewater Treatment Equipment Market by Application Value Share Forecast 2029 (%)
Figure 7.54 South America Water and Wastewater Treatment Equipment Market by Technologies Value AGR Forecast 2019-2029 (AGR %)
Figure 7.55 South America Water and Wastewater Treatment Equipment Market by Technologies Forecast 2019-2029 ($M, Global AGR %)
Figure 7.56 South America Water and Wastewater Treatment Equipment Market by Technologies Value Share Forecast 2018 (%)
Figure 7.57 South America Water and Wastewater Treatment Equipment Market by Technologies Value Share Forecast 2024 (%)
Figure 7.58 South America Water and Wastewater Treatment Equipment Market by Technologies Value Share Forecast 2029 (%)
Figure 7.59 South America Water and Wastewater Treatment Equipment Market by Country Value AGR Forecast 2019-2029 (AGR %)
Figure 7.60 South America Water and Wastewater Treatment Equipment Market by Country Forecast 2019-2029 ($M, Global AGR %)
Figure 7.61 South America Water and Wastewater Treatment Equipment Market by Country Value Share Forecast 2018 (%)
Figure 7.62 South America Water and Wastewater Treatment Equipment Market by Country Value Share Forecast 2024 (%)
Figure 7.63 South America Water and Wastewater Treatment Equipment Market by Country Value Share Forecast 2029 (%)
Figure 7.64 Asia Pacific Water and Wastewater Treatment Equipment Market by Process Value AGR Forecast 2019-2029 (AGR %)
Figure 7.65 Asia Pacific Water and Wastewater Treatment Equipment Market by Process Forecast 2019-2029 ($M, Global AGR %)
Figure 7.66 Asia Pacific Water and Wastewater Treatment Equipment Market by Process Value Share Forecast 2018 (%)
Figure 7.67 Asia Pacific Water and Wastewater Treatment Equipment Market by Process Value Share Forecast 2024 (%)
Figure 7.68 Asia Pacific Water and Wastewater Treatment Equipment Market by Process Value Share Forecast 2029 (%)
Figure 7.69 Asia Pacific Water and Wastewater Treatment Equipment Market by Application Value AGR Forecast 2019-2029 (AGR %)
Figure 7.70 Asia Pacific Water and Wastewater Treatment Equipment Market by Application Forecast 2019-2029 ($M, Global AGR %)
Figure 7.71 Asia Pacific Water and Wastewater Treatment Equipment Market by Application Value Share Forecast 2018 (%)
Figure 7.72 Asia Pacific Water and Wastewater Treatment Equipment Market by Application Value Share Forecast 2024 (%)
Figure 7.73 Asia Pacific Water and Wastewater Treatment Equipment Market by Application Value Share Forecast 2029 (%)
Figure 7.74 Asia Pacific Water and Wastewater Treatment Equipment Market by Technologies Value AGR Forecast 2019-2029 (AGR %)
Figure 7.75 Asia Pacific Water and Wastewater Treatment Equipment Market by Technologies Forecast 2019-2029 ($M, Global AGR %)
Figure 7.75 Asia Pacific Water and Wastewater Treatment Equipment Market by Technologies Value Share Forecast 2018 (%)
Figure 7.76 Asia Pacific Water and Wastewater Treatment Equipment Market by Technologies Value Share Forecast 2024 (%)
Figure 7.77 Asia Pacific Water and Wastewater Treatment Equipment Market by Technologies Value Share Forecast 2029 (%)
Figure 7.78 Asia Pacific Water and Wastewater Treatment Equipment Market by Country Value AGR Forecast 2019-2029 (AGR %)
Figure 7.79 Asia Pacific Water and Wastewater Treatment Equipment Market by Country Forecast 2019-2029 ($M, Global AGR %)
Figure 7.80 Asia Pacific Water and Wastewater Treatment Equipment Market by Country Value Share Forecast 2018 (%)
Figure 7.81 Asia Pacific Water and Wastewater Treatment Equipment Market by Country Value Share Forecast 2024 (%)
Figure 7.82 Asia Pacific Water and Wastewater Treatment Equipment Market by Country Value Share Forecast 2029 (%)
Figure 7.83 Middle East & Africa Water and Wastewater Treatment Equipment Market by Process Value AGR Forecast 2019-2029 (AGR %)
Figure 7.84 Middle East & Africa Water and Wastewater Treatment Equipment Market by Process Forecast 2019-2029 ($M, Global AGR %)
Figure 7.85 Middle East & Africa Water and Wastewater Treatment Equipment Market by Process Value Share Forecast 2018 (%)
Figure 7.86 Middle East & Africa Water and Wastewater Treatment Equipment Market by Process Value Share Forecast 2024 (%)
Figure 7.87 Middle East & Africa Water and Wastewater Treatment Equipment Market by Process Value Share Forecast 2029 (%)
Figure 7.88 Middle East & Africa Water and Wastewater Treatment Equipment Market by Application Value AGR Forecast 2019-2029 (AGR %)
Figure 7.89 Middle East & Africa Water and Wastewater Treatment Equipment Market by Application Forecast 2019-2029 ($M, Global AGR %)
Figure 7.90 Middle East & Africa Water and Wastewater Treatment Equipment Market by Application Value Share Forecast 2018 (%)
Figure 7.91 Middle East & Africa Water and Wastewater Treatment Equipment Market by Application Value Share Forecast 2024 (%)
Figure 7.92 Middle East & Africa Water and Wastewater Treatment Equipment Market by Application Value Share Forecast 2029 (%)
Figure 7.93 Middle East & Africa Water and Wastewater Treatment Equipment Market by Technologies Value AGR Forecast 2019-2029 (AGR %)
Figure 7.94 Middle East & Africa Water and Wastewater Treatment Equipment Market by Technologies Forecast 2019-2029 ($M, Global AGR %)
Figure 7.95 Middle East & Africa Water and Wastewater Treatment Equipment Market by Technologies Value Share Forecast 2018 (%)
Figure 7.96 Middle East & Africa Water and Wastewater Treatment Equipment Market by Technologies Value Share Forecast 2024 (%)
Figure 7.97 Middle East & Africa Water and Wastewater Treatment Equipment Market by Technologies Value Share Forecast 2029 (%)
Figure 7.98 Middle East & Africa Water and Wastewater Treatment Equipment Market by Country Value AGR Forecast 2019-2029 (AGR %)
Figure 7.99 Middle East & Africa Water and Wastewater Treatment Equipment Market by Country Forecast 2019-2029 ($M, Global AGR %)
Figure 7.100 Middle East & Africa Water and Wastewater Treatment Equipment Market by Country Value Share Forecast 2018 (%)
Figure 7.101 Middle East & Africa Water and Wastewater Treatment Equipment Market by Country Value Share Forecast 2024 (%)
Figure 7.102 Middle East & Africa Water and Wastewater Treatment Equipment Market by Country Value Share Forecast 2029 (%)
Figure 8.1 Five Forces Analysis of Global Water and Wastewater Treatment Equipment Market 2019-2029
Figure 10.1 3M 2018 Revenue, by Geography and by Sector (%)
Figure 10.2 Aquatech International 2018 Revenue, by Geography and by Sector (%)
Figure 10.3 Calgon Carbon Corporation 2018 Revenue, by Geography and by Sector (%)
Figure 10.4 DowDuPont Inc. 2018 Revenue, by Geography and by Sector (%)
Figure 10.5 Ecolab Inc. 2018 Revenue, by Geography and by Sector (%)
Figure 10.6 Evoqua Water Technologies 2018 Revenue, by Geography and by Sector (%)
Figure 10.7 Pentair Plc. 2018 Revenue, by Geography and by Sector (%)
Figure 10.8 Suez Environnement S.A 2018 Revenue, by Geography and by Sector (%)
Figure 10.9 Veolia Environment SA 2018 Revenue, by Geography and by Sector (%)
Figure 10.10 Xylem Inc. 2018 Revenue, by Geography and by Sector (%)
3M
Accepta
Aquatech International
Ashland Water Technologies
BWT
Calgon Carbon Corporation
Chembond Chemicals Limited
Culligan International Company
Danaher Corporation
Degremont SAS
DowDuPont Inc.
Ecolab Inc.
Evoqua Water Technologies
GDF Suez S.A.
GE Water & Process Technologies
Hitachi
Kemira OYJ
Kurita Water Industries
Pentair Plc.
Siemens
Suez Environnement S.A
Thermax Limited
Thermo Fisher Scientific
Toray Industries
Veolia Environment SA
Xylem Inc.
Download sample pages
Complete the form below to download your free sample pages for Water and Wastewater Treatment Equipment Market Report 2019-2029
Related reports
-
Global Wastewater Treatment to Energy (WWTtE) Market Report 2017-2027
Visiongain has calculated that the global WWTtE market will see a total expenditure of $531m in 2017, including both capital...
Full DetailsPublished: 20 September 2017 -
Top 20 Companies in The Waste to Energy (WtE) Market 2018
The leading players comprise a diverse range of companies, including international utilities, national agencies and devolved bodies, and smaller engineering,...
Full DetailsPublished: 08 October 2018 -
Waste to Energy (WtE) Yearbook 2018
Visiongain assesses that CAPEX on Waste-to-Energy will reach $15.4bn in 2018.
...Full DetailsPublished: 28 September 2018 -
Waste to Energy (WtE) Market Forecast 2019-2029
Visiongain assesses that the global waste-to-energy market will experience Capex of $16,420m in 2019. Read on to discover the potential...
Full DetailsPublished: 18 April 2019 -

Polymer Market for Waste Management Industry Report 2019-2029
The global polymer market for waste management was valued at $3.9 billion in 2018. Polymer is extensively being found in...
Full DetailsPublished: 01 January 1970 -
Global Waste Heat Boiler Market Report 2019-2029
It has been anticipated that a considerable number of product launches, product developments, mergers, and acquisitions will occur in the...
Full DetailsPublished: 01 January 1970 -
Waste to Energy (WtE) Market Report 2021-2031
The unpredictability and fluctuations of crude oil price in past two years and turmoil in energy markets has led countries...Full DetailsPublished: 28 April 2021 -
E-waste Management Market Report 2020-2030
Globally, the use of electronic gadgets and electronic equipment has doubled, due to which e-waste or electronic waste has mounted...
Full DetailsPublished: 01 January 1970 -
Nuclear Waste Management Market Report 2022-2032
Some of the factors driving the market growth are growing global demand for energy leading to greater use of nuclear...Full DetailsPublished: 23 March 2022 -
Liquid Waste Management Market Report 2019-2029
Liquid Waste Management market worth $91.57 billion in 2019 says Visiongain report.
...Full DetailsPublished: 01 January 1970
Download sample pages
Complete the form below to download your free sample pages for Water and Wastewater Treatment Equipment Market Report 2019-2029
Do you have any custom requirements we can help you with?
Any specific country, geo region, market segment or specific company information?
Email us today, we can discuss your needs and see how we can help: jamie.roberts@visiongain.com
Would you like a free report overview of the report of your choice?
If so, please drop an email to Jamie Roberts stating your chosen report title to jamie.roberts@visiongain.com
Visiongain chemicals reports are compiled using a broad and rich mixture of both primary and secondary information to produce an overall industry outlook. In order to provide our clients with the best product possible product, we do not rely on any one single source of information. Visiongain analysts reach out to market-leading vendors and automotive industry experts but also review a wealth of financial data and product information from a vast range of sources. To find out more about our reports methodology please email jamie.roberts@visiongain.com
Would you like to get the latest Visiongain chemicals reports catalogue?
What are the dynamic growth sectors? where are the regional business opportunities?
Which technologies will prevail and who are the leading companies succeeding in these sectors and why?
If you want definitive answers to business critical questions, discover Visiongain’s full range of business intelligence reports.
If so, please email Jamie Roberts on jamie.roberts@visiongain.com or call her today on +44 207 336 6100
Don’t Miss Out
Subscribe to receive the latest Industry news, trending insight and analysis straight to your inbox.Choose your preferences:
Latest Chemicals news
Agrochemicals Market
The global Agrochemicals market is projected to grow at a CAGR of 3.7% by 2034
15 July 2024
Visiongain Publishes Industrial Coatings Market Report 2023-2033
The global Industrial Coatings market was valued at US$93 billion in 2022 and is projected to grow at a CAGR of 5.2% during the forecast period 2023-2033.
14 August 2023
Visiongain Publishes Water Treatment Chemicals Market Report 2023-2033
The global Water Treatment Chemicals market is projected to grow at a CAGR of 3.9% by 2033
21 July 2023
Visiongain Publishes Propylene Glycol Market Report 2023-2033
The global Propylene Glycol market was valued at US$4,931.7 million in 2022 and is projected to grow at a CAGR of 4.1% during the forecast period 2023-2033.
14 June 2023
