Industries > Energy > Waste to Energy (WtE) Market Report 2021-2031
 Market Report 2021-2031")
Waste to Energy (WtE) Market Report 2021-2031
Forecasts by Plant Status (Operational WtE Plants, Under Construction WtE Plants), by Technology (Direct Combustion Mass Burn and RDF, Plasma Arc Gasification, Conventional Gasification, Pyrolysis WtE, Chemical Treatment, Biological Treatment), by End-use (Electricity Generation, Steam Exports, Combined Heat and Power (CHP), Syngas, Refuse-derived Fuel (RDF)) AND Regional and Leading National Market Analysis PLUS Analysis of Leading WtE Companies AND COVID-19 Recovery Scenarios
As a key player in waste to energy market, it is important for you to remain up to date with news surrounding COVID-19 and the solar industry
Thankfully, you don’t have to look any further. Visiongain has collated important waste to energy industry updates from across the country. With the scale of the COVID-19 pandemic, no sector has been left unaffected. This is true for the waste to energy industry. The last few months have seen a shift in rules and regulation surrounding commercial market. It is important to stay abreast to the market activities to get an edge over competitors in the global waste to energy market.
Waste to Energy Market–our new study reveals trends, R&D progress, and predicted revenues
The unpredictability and fluctuations of crude oil price in past two years and turmoil in energy markets has led countries to look for alternate energies such as recovering energy from solar, the wind, fossil fuels, biomass, and waste. Waste to Energy (WTE) is the process of recovering energy from waste usually in the form of electricity and steam, with/without the presence of oxygen converting. There are two main technologies for converting energy using thermal and biological.
If you read only 1 waste to energy report this year – this is the report you need to read. Take a look at our report on waste to energy. It’ll give you an idea of what activities are in the global market and how you can leverage your products and services to generate revenue.
Key questions answered in this exclusive report are:
• What are the implication of waste to energy projects taking place now and over the next 10 years?
• Is there a greater need for product commercialisation to further scale the waste to energy market?
• Where is the waste to energy market heading? And how can you ensure you are at the forefront of the market?
You need to discover how this will impact the waste to energy market today, and over the next 10 years:
• Our 678-page report provides 519 tables and 511 charts/graphs exclusively to you.
• The report highlights key lucrative areas in the industry so you can target them – NOW.
• Contains in-depth analyse of global and national sales and growth
• Highlights for you the key successful trends, changes and revenue projections made by your competitors
This report tells you TODAY how the waste to energy market will develop in the next 10 years, and in-line with the variations in COVID-19 economic recession and bounce. This market is more critical now than at any point over the last 10 years.
This report includes data analysis and invaluable insight into how COVID-19 will affect your industry. Access this report today.
To access the data contained in this document please email contactus@visiongain.com
Forecasts to 2031 and other analyses reveal the commercial prospects
• In addition to revenue forecasting to 2031, our new study provides you with recent results, growth rates, and market shares.
• You find original analyses, with business outlooks and developments.
• Discover qualitative analyses (including market dynamics, drivers, opportunities, restraints and challenges), cost structure, impact of rising energy generation prices and recent developments.
This report includes data analysis and invaluable insight into how COVID-19 will affect your industry. Four COVID-19 recovery patterns and their impact, namely, V, L, W and U are discussed in this report.
Global Waste to Energy Market Size Estimation (COVID-19 Impact Recovery Analysis)
• Waste to Energy Cumulative CAPEX ($Mn)
• Waste to Energy Cumulative Capacity (MTPA)
• Waste to Energy Cumulative Total WtE Plants (Units)
• Waste to Energy Cumulative Total Energy Generation (MWe)
Global Waste to Energy Market Segmentation by Plant Status (COVID-19 Impact Recovery Analysis)
• Operational WtE Plants
• Under Construction WtE Plants
Global Waste to Energy Market Segmentation by Technology (COVID-19 Impact Recovery Analysis)
• Direct Combustion (Mass Burn and RDF)
• Plasma Arc Gasification
• Conventional Gasification
• Pyrolysis WtE
• Chemical Treatment
• Biological Treatment
Global Waste to Energy Market Segmentation by End-Use (COVID-19 Impact Recovery Analysis)
• Electricity Generation
• Steam Exports
• Combined Heat and Power (CHP)
• Syngas
• Refuse-Derived fuel (RDF)

In addition to the revenue predictions for the overall world market and segments, you will also find revenue forecasts for 10 leading national markets:
US Waste to Energy Market Size Estimation (COVID-19 Impact Recovery Analysis)
• Waste to Energy Cumulative Total WtE Plants (Total WtE Units)
• Waste to Energy Cumulative CAPEX ($Mn)
• Waste to Energy Cumulative Capacity (MTPA)
• Waste to Energy Cumulative Total Energy Generation (MWe)
• Waste to Energy Market By Technology
• Waste to Energy Market by End-Use
UK Waste to Energy Market Size Estimation (COVID-19 Impact Recovery Analysis)
• Waste to Energy Cumulative Total WtE Plants (Total WtE Units)
• Waste to Energy Cumulative CAPEX ($Mn)
• Waste to Energy Cumulative Capacity (MTPA)
• Waste to Energy Cumulative Total Energy Generation (MWe)
• Waste to Energy Market By Technology
• Waste to Energy Market by End-Use
Germany Waste to Energy Market Size Estimation (COVID-19 Impact Recovery Analysis)
• Waste to Energy Cumulative Total WtE Plants (Total WtE Units)
• Waste to Energy Cumulative CAPEX ($Mn)
• Waste to Energy Cumulative Capacity (MTPA)
• Waste to Energy Cumulative Total Energy Generation (MWe)
• Waste to Energy Market By Technology
• Waste to Energy Market by End-Use
France Waste to Energy Market Size Estimation (COVID-19 Impact Recovery Analysis)
• Waste to Energy Cumulative Total WtE Plants (Total WtE Units)
• Waste to Energy Cumulative CAPEX ($Mn)
• Waste to Energy Cumulative Capacity (MTPA)
• Waste to Energy Cumulative Total Energy Generation (MWe)
• Waste to Energy Market By Technology
• Waste to Energy Market by End-Use
Switzerland Waste to Energy Market Size Estimation (COVID-19 Impact Recovery Analysis)
• Waste to Energy Cumulative Total WtE Plants (Total WtE Units)
• Waste to Energy Cumulative CAPEX ($Mn)
• Waste to Energy Cumulative Capacity (MTPA)
• Waste to Energy Cumulative Total Energy Generation (MWe)
• Waste to Energy Market By Technology
• Waste to Energy Market by End-Use
China Waste to Energy Market Size Estimation (COVID-19 Impact Recovery Analysis)
• Waste to Energy Cumulative Total WtE Plants (Total WtE Units)
• Waste to Energy Cumulative CAPEX ($Mn)
• Waste to Energy Cumulative Capacity (MTPA)
• Waste to Energy Cumulative Total Energy Generation (MWe)
• Waste to Energy Market By Technology
• Waste to Energy Market by End-Use
Japan Waste to Energy Market Size Estimation (COVID-19 Impact Recovery Analysis)
• Waste to Energy Cumulative Total WtE Plants (Total WtE Units)
• Waste to Energy Cumulative CAPEX ($Mn)
• Waste to Energy Cumulative Capacity (MTPA)
• Waste to Energy Cumulative Total Energy Generation (MWe)
• Waste to Energy Market By Technology
• Waste to Energy Market by End-Use
India Waste to Energy Market Size Estimation (COVID-19 Impact Recovery Analysis)
• Waste to Energy Cumulative Total WtE Plants (Total WtE Units)
• Waste to Energy Cumulative CAPEX ($Mn)
• Waste to Energy Cumulative Capacity (MTPA)
• Waste to Energy Cumulative Total Energy Generation (MWe)
• Waste to Energy Market By Technology
• Waste to Energy Market by End-Use
Singapore Waste to Energy Market Size Estimation (COVID-19 Impact Recovery Analysis)
• Waste to Energy Cumulative Total WtE Plants (Total WtE Units)
• Waste to Energy Cumulative CAPEX ($Mn)
• Waste to Energy Cumulative Capacity (MTPA)
• Waste to Energy Cumulative Total Energy Generation (MWe)
• Waste to Energy Market By Technology
• Waste to Energy Market by End-Use
South Korea Waste to Energy Market Size Estimation (COVID-19 Impact Recovery Analysis)
• Waste to Energy Cumulative Total WtE Plants (Total WtE Units)
• Waste to Energy Cumulative CAPEX ($Mn)
• Waste to Energy Cumulative Capacity (MTPA)
• Waste to Energy Cumulative Total Energy Generation (MWe)
• Waste to Energy Market By Technology
• Waste to Energy Market by End-Use
Rest of the World Waste to Energy Market Size Estimation (COVID-19 Impact Recovery Analysis)
• Waste to Energy Cumulative Total WtE Plants (Total WtE Units)
• Waste to Energy Cumulative CAPEX ($Mn)
• Waste to Energy Cumulative Capacity (MTPA)
• Waste to Energy Cumulative Total Energy Generation (MWe)
• Waste to Energy Market By Technology
• Waste to Energy Market by End-Use
Need industry data? Please contact us today.
The report also includes profiles and for some of the leading companies in the Waste to Energy Market, 2021 to 2031, with a focus on this segment of these companies’ operations.
Leading companies and the potential for market growth
• ATCO Power
• Biffa plc
• Babcock & Wilcox Enterprises
• Covanta Holding Corporation
• Fomento de Construcciones y Contratas SA (FCC)
• Origin Energy Limited
• Hera SpA
• Hitachi Zosen Corp
• Mostostal Warszawa SA
• Renova Energia SA
• Suez SA
• Veolia Environnement SA
• EBARA Corporation
• China Everbright Environment Group Ltd
Overall world revenue for Waste to Energy Market, 2021 to 2031 Market will surpass xx MWe in terms of energy generation in 2021, our work calculates. We predict strong revenue growth through to 2031. Our work identifies which organizations hold the greatest potential. Discover their capabilities, progress, and commercial prospects, helping you stay ahead.
How the Waste to Energy Market, 2021 to 2031 Market report helps you
In summary, our 670+ page report provides you with the following knowledge: Energy Generation, CAPEX ($Mn), Capacity (MTPA), Total WtE Plants
• Revenue forecasts to 2031 for Waste to Energy Market, 2021 to 2031 Market, with forecasts for each forecasted at a global and regional level– discover the industry’s prospects, finding the most lucrative places for investments and revenues
• Revenue forecasts to 2031 for 5 regional and 20 key national markets – See forecasts for the Waste to Energy Market, 2021 to 2031 market in the US, Canada, Germany, France, UK, China, India, Japan, and Singapore among other prominent economies.
• Prospects for established firms and those seeking to enter the market– including company profiles for 15 of the major companies involved in the Waste to Energy Market, 2021 to 2031 Market.
Find quantitative and qualitative analyses with independent predictions. Receive information that only our report contains, staying informed with this invaluable business intelligence.
Information found nowhere else
With our newly report title, you are less likely to fall behind in knowledge or miss out on opportunities. See how our work could benefit your research, analyses, and decisions. Visiongain’s study is for everybody needing commercial analyses for the Waste to Energy Market, 2021 to 2031 Market and leading companies. You will find data, trends and predictions.
To access the data contained in this document please email contactus@visiongain.com
Buy our report today Waste to Energy (WtE) Market Report 2021-2031: Forecasts by Plant Status (Operational WtE Plants, Under Construction WtE Plants), by Technology (Direct Combustion Mass Burn and RDF, Plasma Arc Gasification, Conventional Gasification, Pyrolysis WtE, Chemical Treatment, Biological Treatment), by End-use (Electricity Generation, Steam Exports, Combined Heat and Power (CHP), Syngas, Refuse-derived Fuel (RDF)) AND Regional and Leading National Market Analysis PLUS Analysis of Leading WtE Companies AND COVID-19 Recovery Scenarios. Avoid missing out by staying informed – order our report now.
Visiongain is a trading partner with the US Federal Government
CCR Ref number: KD4R6
Do you have any custom requirements we can help you with? Any need for a specific country, geo region, market segment or specific company information? Contact us today, we can discuss your needs and see how we can help: sara.peerun@visiongain.com
1.1 Introduction to Global Waste to Energy Market
1.2 Global Waste to Energy Market Overview
1.3 What are the Objectives of this Report?
1.4 What is the Scope of the Report?
1.5 Global Waste to Energy Market Definition
1.6 Why You Should Read This Report
1.7 What This Report Delivers
1.8 Key Questions Answered by This Analytical Report Include:
1.9 Who is This Report for?
1.10 Research Methodology
1.10.1 Primary Research
1.10.2 Secondary Research
1.10.3 Market Evaluation & Forecasting Methodology
1.11 Frequently Asked Questions (FAQs)
1.12 Associated Visiongain Reports
1.13 About Visiongain
2 Executive Summary
2.1 Decreasing Land Filling Space Will Boost the WtE Market
2.2 Waste-to-Energy Technology Highlights
3 Global Waste to Energy Industry Structure
3.1 Overview
4 Global Market Dynamics
4.1 Current Trends in the Global Market
4.2 Market Driving Factors
4.3 Market Restraining Factors
4.4 Opportunities in the Global Market
4.5 Challenges in the Global Market
4.6 PEST Analysis of the Waste-to-Energy Market
4.7 SWOT Analysis
4.8 Porter’s 5 Forces Model
5 Global Global Waste to Energy Market Analysis
5.1 Global Market Outlook
5.2 Global Market Size Estimation and Forecast By Energy Generation
5.2.1 Pre-COVID-19 Market Scenario
5.2.2 Post-COVID-19 Market Scenarios (V, W, U, L-Shaped Recovery Analysis)
5.3 Global Market Size Estimation and Forecast by CAPEX
5.3.1 Pre-COVID-19 Market Scenario
5.3.2 Post-COVID-19 Market Scenarios (V, W, U, L-Shaped Recovery Analysis)
5.4 Global Market Size Estimation and Forecast by Capacity
5.4.1 Pre-COVID-19 Market Scenario
5.4.2 Post-COVID-19 Market Scenarios (V, W, U, L-Shaped Recovery Analysis)
5.5 Global Market Size Estimation and Forecast by WTE Plants
5.5.1 Pre-COVID-19 Market Scenario
5.5.2 Post-COVID-19 Market Scenarios (V, W, U, L-Shaped Recovery Analysis)
5.6 Global Market Size Estimation and Forecast by Plant Status
5.6.1 Pre-COVID-19 Market Scenario
5.6.2 Post-COVID-19 Market Scenarios (V, W, U, L-Shaped Recovery Analysis)
5.7 Global Market Size Estimation and Forecast by Technology
5.7.1 Pre-COVID-19 Market Scenario
5.7.2 Post-COVID-19 Market Scenarios (V, W, U, L-Shaped Recovery Analysis)
5.8 Global Market Size Estimation and Forecast by End - Use
5.8.1 Pre-COVID-19 Market Scenario
5.8.2 Post-COVID-19 Market Scenarios (V, W, U, L-Shaped Recovery Analysis)
5.9 Global Market Size Estimation and Forecast by Country
5.9.1 Pre-COVID-19 Market Scenario
5.9.2 Post-COVID-19 Market Scenarios (V, W, U, L-Shaped Recovery Analysis)
5.10 Global Market Size Estimation and Forecast by Country (CAPEX)
5.10.1 Pre-COVID-19 Market Scenario
5.10.2 Post-COVID-19 Market Scenarios (V, W, U, L-Shaped Recovery Analysis)
5.11 Global Market Size Estimation and Forecast by Country (Capacity)
5.11.1 Pre-COVID-19 Market Scenario
5.11.2 Post-COVID-19 Market Scenarios (V, W, U, L-Shaped Recovery Analysis)
5.12 Global Market Size Estimation and Forecast by Country (WTE Plants)
5.12.1 Pre-COVID-19 Market Scenario
5.12.2 Post-COVID-19 Market Scenarios (V, W, U, L-Shaped Recovery Analysis)
6 US Waste to Energy Market Analysis
6.1 US Market Outlook
6.2 US Market Size Estimation and Forecast by Energy Generation
6.2.1 Pre-COVID-19 Market Scenario
6.2.2 Post-COVID-19 Market Scenarios (V, W, U, L-Shaped Recovery Analysis)
6.3 US Market Size Estimation and Forecast by CAPEX
6.3.1 Pre-COVID-19 Market Scenario
6.3.2 Post-COVID-19 Market Scenarios (V, W, U, L-Shaped Recovery Analysis)
6.4 US Market Size Estimation and Forecast by Capacity
6.4.1 Pre-COVID-19 Market Scenario
6.4.2 Post-COVID-19 Market Scenarios (V, W, U, L-Shaped Recovery Analysis)
6.5 US Market Size Estimation and Forecast by WTE Plants
6.5.1 Pre-COVID-19 Market Scenario
6.5.2 Post-COVID-19 Market Scenarios (V, W, U, L-Shaped Recovery Analysis)
6.6 US Market Size Estimation and Forecast by Plant Status
6.6.1 Pre-COVID-19 Market Scenario
6.6.2 Post-COVID-19 Market Scenarios (V, W, U, L-Shaped Recovery Analysis)
6.7 US Market Size Estimation and Forecast by Technology
6.7.1 Pre-COVID-19 Market Scenario
6.7.2 Post-COVID-19 Market Scenarios (V, W, U, L-Shaped Recovery Analysis)
6.8 US Market Size Estimation and Forecast by End - Use
6.8.1 Pre-COVID-19 Market Scenario
6.8.2 Post-COVID-19 Market Scenarios (V, W, U, L-Shaped Recovery Analysis)
7 UK Waste to Energy Market Analysis
7.1 UK Market Outlook
7.2 UK Market Size Estimation and Forecast By Energy Generation
7.2.1 Pre-COVID-19 Market Scenario
7.2.2 Post-COVID-19 Market Scenarios (V, W, U, L-Shaped Recovery Analysis)
7.3 UK Market Size Estimation and Forecast by CAPEX
7.3.1 Pre-COVID-19 Market Scenario
7.3.2 Post-COVID-19 Market Scenarios (V, W, U, L-Shaped Recovery Analysis)
7.4 UK Market Size Estimation and Forecast by Capacity
7.4.1 Pre-COVID-19 Market Scenario
7.4.2 Post-COVID-19 Market Scenarios (V, W, U, L-Shaped Recovery Analysis)
7.5 UK Market Size Estimation and Forecast by WTE Plants
7.5.1 Pre-COVID-19 Market Scenario
7.5.2 Post-COVID-19 Market Scenarios (V, W, U, L-Shaped Recovery Analysis)
7.6 UK Market Size Estimation and Forecast by Plant Status
7.6.1 Pre-COVID-19 Market Scenario
7.6.2 Post-COVID-19 Market Scenarios (V, W, U, L-Shaped Recovery Analysis)
7.7 UK Market Size Estimation and Forecast by Technology
7.7.1 Pre-COVID-19 Market Scenario
7.7.2 Post-COVID-19 Market Scenarios (V, W, U, L-Shaped Recovery Analysis)
7.8 UK Market Size Estimation and Forecast by End - Use
7.8.1 Pre-COVID-19 Market Scenario
7.8.2 Post-COVID-19 Market Scenarios (V, W, U, L-Shaped Recovery Analysis)
8 Germany Waste to Energy Market Analysis
8.1 Germany Market Outlook
8.2 Germany Market Size Estimation and Forecast By Energy Generation
8.2.1 Pre-COVID-19 Market Scenario
8.2.2 Post-COVID-19 Market Scenarios (V, W, U, L-Shaped Recovery Analysis)
8.3 Germany Market Size Estimation and Forecast by CAPEX
8.3.1 Pre-COVID-19 Market Scenario
8.3.2 Post-COVID-19 Market Scenarios (V, W, U, L-Shaped Recovery Analysis)
8.4 Germany Market Size Estimation and Forecast by Capacity
8.4.1 Pre-COVID-19 Market Scenario
8.4.2 Post-COVID-19 Market Scenarios (V, W, U, L-Shaped Recovery Analysis)
8.5 Germany Market Size Estimation and Forecast by WTE Plants
8.5.1 Pre-COVID-19 Market Scenario
8.5.2 Post-COVID-19 Market Scenarios (V, W, U, L-Shaped Recovery Analysis)
8.6 Germany Market Size Estimation and Forecast by Plant Status
8.6.1 Pre-COVID-19 Market Scenario
8.6.2 Post-COVID-19 Market Scenarios (V, W, U, L-Shaped Recovery Analysis)
8.7 Germany Market Size Estimation and Forecast by Technology
8.7.1 Pre-COVID-19 Market Scenario
8.7.2 Post-COVID-19 Market Scenarios (V, W, U, L-Shaped Recovery Analysis)
8.8 Germany Market Size Estimation and Forecast by End - Use
8.8.1 Pre-COVID-19 Market Scenario
8.8.2 Post-COVID-19 Market Scenarios (V, W, U, L-Shaped Recovery Analysis)
9 France Waste to Energy Market Analysis
9.1 France Market Outlook
9.2 France Market Size Estimation and Forecast By Energy Generation
9.2.1 Pre-COVID-19 Market Scenario
9.3.1 Post-COVID-19 Market Scenarios (V, W, U, L-Shaped Recovery Analysis)
9.5 France Market Size Estimation and Forecast by CAPEX
9.5.1 Pre-COVID-19 Market Scenario
9.5.2 Post-COVID-19 Market Scenarios (V, W, U, L-Shaped Recovery Analysis)
9.6 France Market Size Estimation and Forecast by Capacity
9.6.1 Pre-COVID-19 Market Scenario
9.6.2 Post-COVID-19 Market Scenarios (V, W, U, L-Shaped Recovery Analysis)
9.7 France Market Size Estimation and Forecast by WTE Plants
9.7.1 Pre-COVID-19 Market Scenario
9.7.2 Post-COVID-19 Market Scenarios (V, W, U, L-Shaped Recovery Analysis)
9.8 France Market Size Estimation and Forecast by Plant Status
9.8.1 Pre-COVID-19 Market Scenario
9.8.2 Post-COVID-19 Market Scenarios (V, W, U, L-Shaped Recovery Analysis)
9.9 France Market Size Estimation and Forecast by Technology
9.9.1 Pre-COVID-19 Market Scenario
9.9.2 Post-COVID-19 Market Scenarios (V, W, U, L-Shaped Recovery Analysis)
9.10 France Market Size Estimation and Forecast by End - Use
9.10.1 Pre-COVID-19 Market Scenario
9.10.2 Post-COVID-19 Market Scenarios (V, W, U, L-Shaped Recovery Analysis)
10 Switzerland Waste to Energy Market Analysis
10.1 Switzerland Market Outlook
10.2 Switzerland Market Size Estimation and Forecast By Energy Generation
10.2.1 Pre-COVID-19 Market Scenario
10.2.2 Post-COVID-19 Market Scenarios (V, W, U, L-Shaped Recovery Analysis)
10.3 Switzerland Market Size Estimation and Forecast by CAPEX
10.3.1 Pre-COVID-19 Market Scenario
10.3.2 Post-COVID-19 Market Scenarios (V, W, U, L-Shaped Recovery Analysis)
10.4 Switzerland Market Size Estimation and Forecast by Capacity
10.4.1 Pre-COVID-19 Market Scenario
10.4.2 Post-COVID-19 Market Scenarios (V, W, U, L-Shaped Recovery Analysis)
10.5 Switzerland Market Size Estimation and Forecast by WTE Plants
10.5.1 Pre-COVID-19 Market Scenario
10.5.2 Post-COVID-19 Market Scenarios (V, W, U, L-Shaped Recovery Analysis)
10.6 Switzerland Market Size Estimation and Forecast by Plant Status
10.6.1 Pre-COVID-19 Market Scenario
10.6.2 Post-COVID-19 Market Scenarios (V, W, U, L-Shaped Recovery Analysis)
10.7 Switzerland Market Size Estimation and Forecast by Technology
10.7.1 Pre-COVID-19 Market Scenario
10.7.2 Post-COVID-19 Market Scenarios (V, W, U, L-Shaped Recovery Analysis)
10.8 Switzerland Market Size Estimation and Forecast by End - Use
10.8.1 Pre-COVID-19 Market Scenario
10.8.2 Post-COVID-19 Market Scenarios (V, W, U, L-Shaped Recovery Analysis)
11 China Waste to Energy Market Analysis
11.1 China Market Outlook
11.2 China Market Size Estimation and Forecast by Energy Generation
11.2.1 Pre-COVID-19 Market Scenario
11.2.2 Post-COVID-19 Market Scenarios (V, W, U, L-Shaped Recovery Analysis)
11.3 China Market Size Estimation and Forecast by CAPEX
11.3.1 Pre-COVID-19 Market Scenario
11.3.2 Post-COVID-19 Market Scenarios (V, W, U, L-Shaped Recovery Analysis)
11.4 China Market Size Estimation and Forecast by Capacity
11.4.1 Pre-COVID-19 Market Scenario
11.4.2 Post-COVID-19 Market Scenarios (V, W, U, L-Shaped Recovery Analysis)
11.5 China Market Size Estimation and Forecast by WTE Plants
11.5.1 Pre-COVID-19 Market Scenario
11.5.2 Post-COVID-19 Market Scenarios (V, W, U, L-Shaped Recovery Analysis)
11.6 China Market Size Estimation and Forecast by Plant Status
11.6.1 Pre-COVID-19 Market Scenario
11.6.2 Post-COVID-19 Market Scenarios (V, W, U, L-Shaped Recovery Analysis)
11.7 China Market Size Estimation and Forecast by Technology
11.7.1 Pre-COVID-19 Market Scenario
11.7.2 Post-COVID-19 Market Scenarios (V, W, U, L-Shaped Recovery Analysis)
11.8 China Market Size Estimation and Forecast by End - Use
11.8.1 Pre-COVID-19 Market Scenario
11.8.2 Post-COVID-19 Market Scenarios (V, W, U, L-Shaped Recovery Analysis)
12 Japan Waste to Energy Market Analysis
12.1 Japan Market Outlook
12.2 Japan Market Size Estimation and Forecast By Energy Generation
12.2.1 Pre-COVID-19 Market Scenario
12.2.2 Post-COVID-19 Market Scenarios (V, W, U, L-Shaped Recovery Analysis)
12.3 Japan Market Size Estimation and Forecast by CAPEX
12.3.1 Pre-COVID-19 Market Scenario
12.3.2 Post-COVID-19 Market Scenarios (V, W, U, L-Shaped Recovery Analysis)
12.4 Japan Market Size Estimation and Forecast by Capacity
12.4.1 Pre-COVID-19 Market Scenario
12.4.2 Post-COVID-19 Market Scenarios (V, W, U, L-Shaped Recovery Analysis)
12.5 Japan Market Size Estimation and Forecast by WTE Plants
12.5.1 Pre-COVID-19 Market Scenario
12.5.2 Post-COVID-19 Market Scenarios (V, W, U, L-Shaped Recovery Analysis)
12.6 Japan Market Size Estimation and Forecast by Plant Status
12.6.1 Pre-COVID-19 Market Scenario
12.6.2 Post-COVID-19 Market Scenarios (V, W, U, L-Shaped Recovery Analysis)
12.7 Japan Market Size Estimation and Forecast by Technology
12.7.1 Pre-COVID-19 Market Scenario
12.7.2 Post-COVID-19 Market Scenarios (V, W, U, L-Shaped Recovery Analysis)
12.8 Japan Market Size Estimation and Forecast by End - Use
12.8.1 Pre-COVID-19 Market Scenario
12.8.2 Post-COVID-19 Market Scenarios (V, W, U, L-Shaped Recovery Analysis)
13 India Waste to Energy Market Analysis
13.1 India Market Outlook
13.2 India Market Size Estimation and Forecast By Energy Generation
13.2.1 Pre-COVID-19 Market Scenario
13.2.2 Post-COVID-19 Market Scenarios (V, W, U, L-Shaped Recovery Analysis)
13.3 India Market Size Estimation and Forecast by CAPEX
13.3.1 Pre-COVID-19 Market Scenario
13.3.2 Post-COVID-19 Market Scenarios (V, W, U, L-Shaped Recovery Analysis)
13.4 India Market Size Estimation and Forecast by Capacity
13.4.1 Pre-COVID-19 Market Scenario
13.4.2 Post-COVID-19 Market Scenarios (V, W, U, L-Shaped Recovery Analysis)
13.5 India Market Size Estimation and Forecast by WTE Plants
13.5.1 Pre-COVID-19 Market Scenario
13.5.2 Post-COVID-19 Market Scenarios (V, W, U, L-Shaped Recovery Analysis)
13.6 India Market Size Estimation and Forecast by Plant Status
13.6.1 Pre-COVID-19 Market Scenario
13.6.2 Post-COVID-19 Market Scenarios (V, W, U, L-Shaped Recovery Analysis)
13.7 India Market Size Estimation and Forecast by Technology
13.7.1 Pre-COVID-19 Market Scenario
13.7.2 Post-COVID-19 Market Scenarios (V, W, U, L-Shaped Recovery Analysis)
13.8 India Market Size Estimation and Forecast by End - Use
13.8.1 Pre-COVID-19 Market Scenario
13.8.2 Post-COVID-19 Market Scenarios (V, W, U, L-Shaped Recovery Analysis)
14 Singapore Waste to Energy Market Analysis
14.1 Singapore Market Outlook
14.2 Singapore Market Size Estimation and Forecast By Energy Generation
14.2.1 Pre-COVID-19 Market Scenario
14.3.1 Post-COVID-19 Market Scenarios (V, W, U, L-Shaped Recovery Analysis)
14.4 Singapore Market Size Estimation and Forecast by CAPEX
14.4.1 Pre-COVID-19 Market Scenario
14.4.2 Post-COVID-19 Market Scenarios (V, W, U, L-Shaped Recovery Analysis)
14.5 Singapore Market Size Estimation and Forecast by Capacity
14.5.1 Pre-COVID-19 Market Scenario
14.5.2 Post-COVID-19 Market Scenarios (V, W, U, L-Shaped Recovery Analysis)
14.6 Singapore Market Size Estimation and Forecast by WTE Plants
14.6.1 Pre-COVID-19 Market Scenario
14.6.2 Post-COVID-19 Market Scenarios (V, W, U, L-Shaped Recovery Analysis)
14.7 Singapore Market Size Estimation and Forecast by Plant Status
14.7.1 Pre-COVID-19 Market Scenario
14.7.2 Post-COVID-19 Market Scenarios (V, W, U, L-Shaped Recovery Analysis)
14.8 Singapore Market Size Estimation and Forecast by Technology
14.8.1 Pre-COVID-19 Market Scenario
14.8.2 Post-COVID-19 Market Scenarios (V, W, U, L-Shaped Recovery Analysis)
14.9 Singapore Market Size Estimation and Forecast by End - Use
14.9.1 Pre-COVID-19 Market Scenario
14.9.2 Post-COVID-19 Market Scenarios (V, W, U, L-Shaped Recovery Analysis)
15 South Korea Waste to Energy Market Analysis
15.1 South Korea Market Outlook
15.2 South Korea Market Size Estimation and Forecast By Energy Generation
15.2.1 Pre-COVID-19 Market Scenario
15.2.2 Post-COVID-19 Market Scenarios (V, W, U, L-Shaped Recovery Analysis)
15.3 South Korea Market Size Estimation and Forecast by CAPEX
15.3.1 Pre-COVID-19 Market Scenario
15.3.2 Post-COVID-19 Market Scenarios (V, W, U, L-Shaped Recovery Analysis)
15.4 South Korea Market Size Estimation and Forecast by Capacity
15.4.1 Pre-COVID-19 Market Scenario
15.4.2 Post-COVID-19 Market Scenarios (V, W, U, L-Shaped Recovery Analysis)
15.5 South Korea Market Size Estimation and Forecast by WTE Plants
15.5.1 Pre-COVID-19 Market Scenario
15.5.2 Post-COVID-19 Market Scenarios (V, W, U, L-Shaped Recovery Analysis)
15.6 Korea Market Size Estimation and Forecast by Plant Status
15.6.1 Pre-COVID-19 Market Scenario
15.6.2 Post-COVID-19 Market Scenarios (V, W, U, L-Shaped Recovery Analysis)
15.7 South Korea Market Size Estimation and Forecast by Technology
15.7.1 Pre-COVID-19 Market Scenario
15.7.2 Post-COVID-19 Market Scenarios (V, W, U, L-Shaped Recovery Analysis)
15.8 South Korea Market Size Estimation and Forecast by End - Use
15.8.1 Pre-COVID-19 Market Scenario
15.8.2 Post-COVID-19 Market Scenarios (V, W, U, L-Shaped Recovery Analysis)
16 Rest of World Waste to Energy Market Analysis
16.1 Rest of World Market Outlook
16.2 Rest of World Market Size Estimation and Forecast By Energy Generation
16.2.1 Pre-COVID-19 Market Scenario
16.2.2 Post-COVID-19 Market Scenarios (V, W, U, L-Shaped Recovery Analysis)
16.2.3 P.re-COVID-19 Market Scenario
16.2.4 Post-COVID-19 Market Scenarios (V, W, U, L-Shaped Recovery Analysis)
16.3 Rest of World Market Size Estimation and Forecast by Capacity
16.3.1 Pre-COVID-19 Market Scenario
16.3.2 Post-COVID-19 Market Scenarios (V, W, U, L-Shaped Recovery Analysis)
16.4 Rest of World Market Size Estimation and Forecast by WTE Plants
16.4.1 Pre-COVID-19 Market Scenario
16.4.2 Post-COVID-19 Market Scenarios (V, W, U, L-Shaped Recovery Analysis)
16.5 Rest of World Market Size Estimation and Forecast by Plant Status
16.5.1 Pre-COVID-19 Market Scenario
16.5.2 Post-COVID-19 Market Scenarios (V, W, U, L-Shaped Recovery Analysis)
16.6 Rest of World Market Size Estimation and Forecast by Technology
16.6.1 Pre-COVID-19 Market Scenario
16.6.2 Post-COVID-19 Market Scenarios (V, W, U, L-Shaped Recovery Analysis)
16.7 Rest of World Market Size Estimation and Forecast by End - Use
16.7.1 Pre-COVID-19 Market Scenario
16.7.2 Post-COVID-19 Market Scenarios (V, W, U, L-Shaped Recovery Analysis)
17 Leading Company Analysis and Profile
17.1 ATCO Power
17.1.1 Company Snapshot
17.1.2 Company Overview
17.1.3 Company Financial Profile
17.1.4 Company Product Benchmarking
17.1.5 Company Recent Developments
17.2 Biffa plc
17.2.1 Company Snapshot
17.2.2 Company Overview
17.2.3 Company Financial Profile
17.2.4 Company Product Benchmarking
17.2.5 Company Recent Developments
17.3 Babcock & Wilcox Enterprises Inc
17.3.1 Company Snapshot
17.3.2 Company Overview
17.3.3 Company Financial Profile
17.3.4 Company Product Benchmarking
17.3.5 Company Recent Developments
17.4 Covanta Holding Corp
17.4.1 Company Snapshot
17.4.2 Company Overview
17.4.3 Company Financial Profile
17.4.4 Company Product Benchmarking
17.4.5 Company Recent Developments
17.5 FCC Environment
17.5.1 Company Snapshot
17.5.2 Company Overview
17.5.3 Company Financial Profile
17.5.4 Company Product Benchmarking
17.5.5 Company Recent Developments
17.6 Origin renewable energy
17.6.1 Company Snapshot
17.6.2 Company Overview
17.6.3 Company Financial Profile
17.6.4 Company Product Benchmarking
17.6.5 Company Recent Developments
17.7 Hera SpA
17.7.1 Company Snapshot
17.7.2 Company Overview
17.7.3 Company Financial Profile
17.7.4 Company Product Benchmarking
17.7.5 Company Recent Developments
17.8 Hitachi Zosen Corporation
17.8.1 Company Snapshot
17.8.2 Company Overview
17.8.3 Company Financial Profile
17.8.4 Company Product Benchmarking
17.8.5 Company Recent Developments
17.9 Mostostal Warszawa SA
17.9.1 Company Snapshot
17.9.2 Company Overview
17.9.3 Company Financial Profile
17.9.4 Company Product Benchmarking
17.9.5 Company Recent Developments
17.10 Renova Energia SA
17.10.1 Company Snapshot
17.10.2 Company Overview
17.10.3 Company Financial Profile
17.10.4 Company Product Benchmarking
17.10.5 Company Recent Developments
17.11 Suez SA
17.11.1 Company Snapshot
17.11.2 Company Overview
17.11.3 Company Financial Profile
17.11.4 Company Product Benchmarking
17.11.5 Company Recent Developments
17.12 Veolia Environnement SA
17.12.1 Company Snapshot
17.12.2 Company Overview
17.12.3 Company Financial Profile
17.12.4 Company Product Benchmarking
17.12.5 Company Recent Developments
17.13 EBARA CORPORATION
17.13.1 Company Snapshot
17.13.2 Company Overview
17.13.3 Company Financial Profile
17.13.4 Company Product Benchmarking
17.13.5 Company Recent Developments
17.14 Everbright Environment
17.14.1 Company Snapshot
17.14.2 Company Overview
17.14.3 Company Financial Profile
17.14.4 Company Product Benchmarking
17.14.5 Company Recent Developments
18 Conclusion and Recommendations
18.1 Recommendations
19 Glossary Terms
List of Tables
Table 1. Global Waste-to-Energy (WtE) Market Forecast by Energy Generation, 2021-2031 (MWe, AGR (%), CAGR(%), Cumulative)
Table 2. Global Waste To Energy Market Snapshot, 2021 & 2031 (US$million, CAGR %)
Table 3. PEST Analysis
Table 4. SWOT Analysis
Table 5. Global Waste-to-Energy (WtE) Market Forecast by Energy Generation, 2021-2031 (MWe, AGR (%), CAGR(%), Cumulative)
Table 6. Global Waste-to-Energy (WtE) Market Forecast by Energy Generation, 2021-2031 (MWe, AGR (%), CAGR(%), Cumulative) (V-Shaped Recovery)
Table 7. Global Waste-to-Energy (WtE) Market Forecast by Energy Generation, 2021-2031 (MWe, AGR (%), CAGR(%), Cumulative) (W-Shaped Recovery) (W-Shaped Recovery)
Table 8. Global Waste-to-Energy (WtE) Market Forecast by Energy Generation, 2021-2031 (MWe, AGR (%), CAGR(%), Cumulative) (U-Shaped Recovery)
Table 9. Global Waste-to-Energy (WtE) Market Forecast by Energy Generation, 2021-2031 (MWe, AGR (%), CAGR(%), Cumulative) (L-Shaped Recovery)
Table 10. Global Waste-to-Energy (WtE) Market Forecast by CAPEX, 2021-2031 (USD Mn, AGR (%), Cumulative)
Table 11. Global Waste-to-Energy (WtE) Market Forecast by CAPEX, 2021-2031 (USD Mn, AGR (%), CAGR(%), Cumulative) (V-Shaped Recovery)
Table 12. Global Waste-to-Energy (WtE) Market Forecast by CAPEX, 2021-2031 (USD Mn, AGR (%), CAGR(%), Cumulative) (W-Shaped Recovery) (W-Shaped Recovery)
Table 13. Global Waste-to-Energy (WtE) Market Forecast by CAPEX, 2021-2031 (USD Mn, AGR (%), CAGR(%), Cumulative) (U-Shaped Recovery)
Table 14. Global Waste-to-Energy (WtE) Market Forecast by CAPEX, 2021-2031 (USD Mn, AGR (%), CAGR(%), Cumulative) (L-Shaped Recovery)
Table 15. Global Waste-to-Energy (WtE) Market Forecast by Capacity, 2021-2031 (MTPA, AGR (%), CAGR(%), Cumulative)
Table 16. Global Waste-to-Energy (WtE) Market Forecast by Capacity, 2021-2031 (MTPA, AGR (%), CAGR(%), Cumulative) (V-Shaped Recovery)
Table 17. Global Waste-to-Energy (WtE) Market Forecast by Capacity, 2021-2031 (MTPA, AGR (%), CAGR(%), Cumulative) (W-Shaped Recovery) (W-Shaped Recovery)
Table 18. Global Waste-to-Energy (WtE) Market Forecast by Capacity, 2021-2031 (MTPA, AGR (%), CAGR(%), Cumulative) (U-Shaped Recovery)
Table 19. Global Waste-to-Energy (WtE) Market Forecast by Capacity, 2021-2031 (MTPA, AGR (%), CAGR(%), Cumulative) (L-Shaped Recovery)
Table 20. Global Waste-to-Energy (WtE) Market Forecast, 2021-2031 (No. of Units, AGR (%), CAGR(%), Cumulative)
Table 21. Global Waste-to-Energy (WtE) Market Forecast, 2021-2031 (No. of Units, AGR (%), CAGR(%), Cumulative) (V-Shaped Recovery)
Table 22. Global Waste-to-Energy (WtE) Market Forecast, 2021-2031 (No. of Units, AGR (%), CAGR(%), Cumulative) (W-Shaped Recovery) (W-Shaped Recovery)
Table 23. Global Waste-to-Energy (WtE) Market Forecast, 2021-2031 (No. of Units, AGR (%), CAGR(%), Cumulative) (U-Shaped Recovery)
Table 24. Global Waste-to-Energy (WtE) Market Forecast, 2021-2031 (No. of Units, AGR (%), CAGR(%), Cumulative) (L-Shaped Recovery)
Table 25. Global Waste-to-Energy (WtE) Market Forecast by Plant Status, 2021-2031 (Plant Units, AGR (%), CAGR(%), Cumulative)
Table 26. Global Waste-to-Energy (WtE) Market Forecast by Plant Status, 2021-2031 (Plant Units, AGR (%), CAGR(%), Cumulative) (V-Shaped Recovery)
Table 27. Global Waste-to-Energy (WtE) Market Forecast by Plant Status, 2021-2031 (Plant Units, AGR (%), CAGR(%), Cumulative) (W-Shaped Recovery) (W-Shaped Recovery)
Table 28. Global Waste-to-Energy (WtE) Market Forecast by Plant Status, 2021-2031 (Plant Units, AGR (%), CAGR(%), Cumulative) (U-Shaped Recovery)
Table 29. Global Waste-to-Energy (WtE) Market Forecast by Plant Status, 2021-2031 (Plant Units, AGR (%), CAGR(%), Cumulative) (L-Shaped Recovery)
Table 30. Global Waste-to-Energy (WtE) Market by Technology, 2021-2031 (MTPA, AGR (%), CAGR(%), Cumulative)
Table 31. Global Waste-to-Energy (WtE) Market by Technology, 2021-2031 (MTPA, AGR (%), CAGR(%), Cumulative) (V-Shaped Recovery)
Table 32. Global Waste-to-Energy (WtE) Market by Technology, 2021-2031 (MTPA, AGR (%), CAGR(%), Cumulative) (W-Shaped Recovery) (W-Shaped Recovery)
Table 33. Global Waste-to-Energy (WtE) Market by Technology, 2021-2031 (MTPA, AGR (%), CAGR(%), Cumulative) (U-Shaped Recovery)
Table 34. Global Waste-to-Energy (WtE) Market by Technology, 2021-2031 (MTPA, AGR (%), CAGR(%), Cumulative) (L-Shaped Recovery)
Table 35. Global Waste-to-Energy (WtE) Energy Generation Market by End-Use, 2021-2031 (MWe, AGR (%), CAGR(%), Cumulative)
Table 36. Global Waste-to-Energy (WtE) Energy Generation Market by End-Use, 2021-2031 (MWe, AGR (%), CAGR(%), Cumulative) (V-Shaped Recovery)
Table 37. Global Waste-to-Energy (WtE) Energy Generation Market by End-Use, 2021-2031 (MWe, AGR (%), CAGR(%), Cumulative) (W-Shaped Recovery) (W-Shaped Recovery)
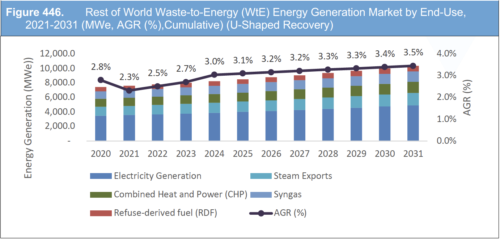
Table 38. Global Waste-to-Energy (WtE) Energy Generation Market by End-Use, 2021-2031 (MWe, AGR (%), CAGR(%), Cumulative) (U-Shaped Recovery)
Table 39. Global Waste-to-Energy (WtE) Energy Generation Market by End-Use, 2021-2031 (MWe, AGR (%), CAGR(%), Cumulative) (L-Shaped Recovery)
Table 40. Global Waste-to-Energy (WtE) Energy Generation Market by Country, 2021-2031 (MWe, AGR (%), CAGR(%), Cumulative)
Table 41. Global Waste-to-Energy (WtE) Energy Generation Market by Country, 2021-2031 (MWe, AGR (%), CAGR(%), Cumulative) (V-Shaped Recovery)
Table 42. Global Waste-to-Energy (WtE) Energy Generation Market by Country, 2021-2031 (MWe, AGR (%), CAGR(%), Cumulative) (W-Shaped Recovery) (W-Shaped Recovery)
Table 43. Global Waste-to-Energy (WtE) Energy Generation Market by Country, 2021-2031 (MWe, AGR (%), CAGR(%), Cumulative) (U-Shaped Recovery)
Table 44. Global Waste-to-Energy (WtE) Energy Generation Market by Country, 2021-2031 (MWe, AGR (%), CAGR(%), Cumulative) (L-Shaped Recovery)
Table 45. Global Waste-to-Energy (WtE) CAPEX Market by Country, 2021-2031 (USD Mn, AGR (%), CAGR(%), Cumulative)
Table 46. Global Waste-to-Energy (WtE) CAPEX Market by Country, 2021-2031 (USD Mn, AGR (%), CAGR(%), Cumulative) (V-Shaped Recovery)
Table 47. Global Waste-to-Energy (WtE) CAPEX Market by Country, 2021-2031 (USD Mn, AGR (%), CAGR(%), Cumulative) (W-Shaped Recovery) (W-Shaped Recovery)
Table 48. Global Waste-to-Energy (WtE) CAPEX Market by Country, 2021-2031 (USD Mn, AGR (%), CAGR(%), Cumulative) (U-Shaped Recovery)
Table 49. Global Waste-to-Energy (WtE) CAPEX Market by Country, 2021-2031 (USD Mn, AGR (%), CAGR(%), Cumulative) (L-Shaped Recovery)
Table 50. Global Waste-to-Energy (WtE) Capacity Market by Country, 2021-2031 (MTPA, AGR (%), CAGR(%), Cumulative)
Table 51. Global Waste-to-Energy (WtE) Capacity Market by Country, 2021-2031 (MTPA, AGR (%), CAGR(%), Cumulative) (V-Shaped Recovery)
Table 52. Global Waste-to-Energy (WtE) Capacity Market by Country, 2021-2031 (MTPA, AGR (%), CAGR(%), Cumulative) (W-Shaped Recovery) (W-Shaped Recovery)
Table 53. Global Waste-to-Energy (WtE) Capacity Market by Country, 2021-2031 (MTPA, AGR (%), CAGR(%), Cumulative) (U-Shaped Recovery)
Table 54. Global Waste-to-Energy (WtE) Capacity Market by Country, 2021-2031 (MTPA, AGR (%), CAGR(%), Cumulative) (L-Shaped Recovery)
Table 55. Global Waste-to-Energy (WtE) Plants Market by Country, 2021-2031 (Units, AGR (%), CAGR(%), Cumulative)
Table 56. Global Waste-to-Energy (WtE) Plants Market by Country, 2021-2031 (Units, AGR (%), CAGR(%), Cumulative) (V-Shaped Recovery)
Table 57. Global Waste-to-Energy (WtE) Plants Market by Country, 2021-2031 (Units, AGR (%), CAGR(%), Cumulative) (W-Shaped Recovery) (W-Shaped Recovery)
Table 58. Global Waste-to-Energy (WtE) Plants Market by Country, 2021-2031 (Units, AGR (%), CAGR(%), Cumulative) (U-Shaped Recovery)
Table 59. Global Waste-to-Energy (WtE) Plants Market by Country, 2021-2031 (Units, AGR (%), CAGR(%), Cumulative) (L-Shaped Recovery)
Table 60. US Waste-to-Energy (WtE) Market Forecast by Energy Generation, 2021-2031 (MWe, AGR (%), CAGR(%), Cumulative)
Table 61. US Waste-to-Energy (WtE) Market Forecast by Energy Generation, 2021-2031 (MWe, AGR (%), CAGR(%), Cumulative) (V-Shaped Recovery)
Table 62. US Waste-to-Energy (WtE) Market Forecast by Energy Generation, 2021-2031 (MWe, AGR (%), CAGR(%), Cumulative) (W-Shaped Recovery) (W-Shaped Recovery)
Table 63. US Waste-to-Energy (WtE) Market Forecast by Energy Generation, 2021-2031 (MWe, AGR (%), CAGR(%), Cumulative) (U-Shaped Recovery)
Table 64. US Waste-to-Energy (WtE) Market Forecast by Energy Generation, 2021-2031 (MWe, AGR (%), CAGR(%), Cumulative) (L-Shaped Recovery)
Table 65. US Waste-to-Energy (WtE) Market Forecast by CAPEX, 2021-2031 (USD Mn, AGR (%), CAGR(%), Cumulative)
Table 66. US Waste-to-Energy (WtE) Market Forecast by CAPEX, 2021-2031 (USD Mn, AGR (%), CAGR(%), Cumulative) (V-Shaped Recovery)
Table 67. US Waste-to-Energy (WtE) Market Forecast by CAPEX, 2021-2031 (USD Mn, AGR (%), CAGR(%), Cumulative) (W-Shaped Recovery) (W-Shaped Recovery)
Table 68. US Waste-to-Energy (WtE) Market Forecast by CAPEX, 2021-2031 (USD Mn, AGR (%), CAGR(%), Cumulative) (U-Shaped Recovery)
Table 69. US Waste-to-Energy (WtE) Market Forecast by CAPEX, 2021-2031 (USD Mn, AGR (%), CAGR(%), Cumulative) (L-Shaped Recovery)
Table 70. US Waste-to-Energy (WtE) Market Forecast by Capacity, 2021-2031 (MTPA, AGR (%), CAGR(%), Cumulative)
Table 71. US Waste-to-Energy (WtE) Market Forecast by Capacity, 2021-2031 (MTPA, AGR (%), CAGR(%), Cumulative) (V-Shaped Recovery)
Table 72. US Waste-to-Energy (WtE) Market Forecast by Capacity, 2021-2031 (MTPA, AGR (%), CAGR(%), Cumulative) (W-Shaped Recovery) (W-Shaped Recovery)
Table 73. US Waste-to-Energy (WtE) Market Forecast by Capacity, 2021-2031 (MTPA, AGR (%), CAGR(%), Cumulative) (U-Shaped Recovery)
Table 74. US Waste-to-Energy (WtE) Market Forecast by Capacity, 2021-2031 (MTPA, AGR (%), CAGR(%), Cumulative) (L-Shaped Recovery)
Table 75. US Waste-to-Energy (WtE) Market Forecast, 2021-2031 (No. of Units, AGR (%), CAGR(%), Cumulative)
Table 76. US Waste-to-Energy (WtE) Market Forecast, 2021-2031 (No. of Units, AGR (%), CAGR(%), Cumulative) (V-Shaped Recovery)
Table 77. US Waste-to-Energy (WtE) Market Forecast, 2021-2031 (No. of Units, AGR (%), CAGR(%), Cumulative) (W-Shaped Recovery) (W-Shaped Recovery)
Table 78. US Waste-to-Energy (WtE) Market Forecast, 2021-2031 (No. of Units, AGR (%), CAGR(%), Cumulative) (U-Shaped Recovery)
Table 79. US Waste-to-Energy (WtE) Market Forecast, 2021-2031 (No. of Units, AGR (%), CAGR(%), Cumulative) (L-Shaped Recovery)
Table 80. US Waste-to-Energy (WtE) Market Forecast by Plant Status, 2021-2031 (Plant Units, AGR (%), CAGR(%), Cumulative)
Table 81. US Waste-to-Energy (WtE) Market Forecast by Plant Status, 2021-2031 (Plant Units, AGR (%), CAGR(%), Cumulative) (V-Shaped Recovery)
Table 82. US Waste-to-Energy (WtE) Market Forecast by Plant Status, 2021-2031 (Plant Units, AGR (%), CAGR(%), Cumulative) (W-Shaped Recovery) (W-Shaped Recovery)
Table 83. US Waste-to-Energy (WtE) Market Forecast by Plant Status, 2021-2031 (Plant Units, AGR (%), CAGR(%), Cumulative) (U-Shaped Recovery)
Table 84. US Waste-to-Energy (WtE) Market Forecast by Plant Status, 2021-2031 (Plant Units, AGR (%), CAGR(%), Cumulative) (L-Shaped Recovery)
Table 85. US Waste-to-Energy (WtE) Market by Technology, 2021-2031 (MTPA, AGR (%), CAGR(%), Cumulative)
Table 86. US Waste-to-Energy (WtE) Market by Technology, 2021-2031 (MTPA, AGR (%), CAGR(%), Cumulative) (V-Shaped Recovery)
Table 87. US Waste-to-Energy (WtE) Market by Technology, 2021-2031 (MTPA, AGR (%), CAGR(%), Cumulative) (W-Shaped Recovery) (W-Shaped Recovery)
Table 88. US Waste-to-Energy (WtE) Market by Technology, 2021-2031 (MTPA, AGR (%), CAGR(%), Cumulative) (U-Shaped Recovery)
Table 89. US Waste-to-Energy (WtE) Market by Technology, 2021-2031 (MTPA, AGR (%), CAGR(%), Cumulative) (L-Shaped Recovery)
Table 90. US Waste-to-Energy (WtE) Energy Generation Market by End-Use, 2021-2031 (MWe, AGR (%), CAGR(%), Cumulative)
Table 91. US Waste-to-Energy (WtE) Energy Generation Market by End-Use, 2021-2031 (MWe, AGR (%), CAGR(%), Cumulative) (V-Shaped Recovery)
Table 92. US Waste-to-Energy (WtE) Energy Generation Market by End-Use, 2021-2031 (MWe, AGR (%), CAGR(%), Cumulative) (W-Shaped Recovery) (W-Shaped Recovery)
Table 93. US Waste-to-Energy (WtE) Energy Generation Market by End-Use, 2021-2031 (MWe, AGR (%), CAGR(%), Cumulative) (U-Shaped Recovery)
Table 94. US Waste-to-Energy (WtE) Energy Generation Market by End-Use, 2021-2031 (MWe, AGR (%), CAGR(%), Cumulative) (L-Shaped Recovery)
Table 95. UK Waste-to-Energy (WtE) Market Forecast by Energy Generation, 2021-2031 (MWe, AGR (%), CAGR(%), Cumulative)
Table 96. UK Waste-to-Energy (WtE) Market Forecast by Energy Generation, 2021-2031 (MWe, AGR (%), CAGR(%), Cumulative) (V-Shaped Recovery)
Table 97. UK Waste-to-Energy (WtE) Market Forecast by Energy Generation, 2021-2031 (MWe, AGR (%), CAGR(%), Cumulative) (W-Shaped Recovery)
Table 98. UK Waste-to-Energy (WtE) Market Forecast by Energy Generation, 2021-2031 (MWe, AGR (%), CAGR(%), Cumulative) (U-Shaped Recovery)
Table 99. UK Waste-to-Energy (WtE) Market Forecast by Energy Generation, 2021-2031 (MWe, AGR (%), CAGR(%), Cumulative) (L-Shaped Recovery)
Table 100. UK Waste-to-Energy (WtE) Market Forecast by CAPEX, 2021-2031 (UKD Mn, AGR (%), CAGR(%), Cumulative)
Table 101. UK Waste-to-Energy (WtE) Market Forecast by CAPEX, 2021-2031 (UKD Mn, AGR (%), CAGR(%), Cumulative) (V-Shaped Recovery)
Table 102. UK Waste-to-Energy (WtE) Market Forecast by CAPEX, 2021-2031 (UKD Mn, AGR (%), CAGR(%), Cumulative) (W-Shaped Recovery)
Table 103. UK Waste-to-Energy (WtE) Market Forecast by CAPEX, 2021-2031 (UKD Mn, AGR (%), CAGR(%), Cumulative) (U-Shaped Recovery)
Table 104. UK Waste-to-Energy (WtE) Market Forecast by CAPEX, 2021-2031 (UKD Mn, AGR (%), CAGR(%), Cumulative) (L-Shaped Recovery)
Table 105. UK Waste-to-Energy (WtE) Market Forecast by Capacity, 2021-2031 (MTPA, AGR (%), CAGR(%), Cumulative)
Table 106. UK Waste-to-Energy (WtE) Market Forecast by Capacity, 2021-2031 (MTPA, AGR (%), CAGR(%), Cumulative) (V-Shaped Recovery)
Table 107. UK Waste-to-Energy (WtE) Market Forecast by Capacity, 2021-2031 (MTPA, AGR (%), CAGR(%), Cumulative) (W-Shaped Recovery)
Table 108. UK Waste-to-Energy (WtE) Market Forecast by Capacity, 2021-2031 (MTPA, AGR (%), CAGR(%), Cumulative) (U-Shaped Recovery)
Table 109. UK Waste-to-Energy (WtE) Market Forecast by Capacity, 2021-2031 (MTPA, AGR (%), CAGR(%), Cumulative) (L-Shaped Recovery)
Table 110. UK Waste-to-Energy (WtE) Market Forecast, 2021-2031 (No. of Units, AGR (%), CAGR(%), Cumulative)
Table 111. UK Waste-to-Energy (WtE) Market Forecast, 2021-2031 (No. of Units, AGR (%), CAGR(%), Cumulative) (V-Shaped Recovery)
Table 112. UK Waste-to-Energy (WtE) Market Forecast, 2021-2031 (No. of Units, AGR (%), CAGR(%), Cumulative) (W-Shaped Recovery)
Table 113. UK Waste-to-Energy (WtE) Market Forecast, 2021-2031 (No. of Units, AGR (%), CAGR(%), Cumulative) (U-Shaped Recovery)
Table 114. UK Waste-to-Energy (WtE) Market Forecast, 2021-2031 (No. of Units, AGR (%), CAGR(%), Cumulative) (L-Shaped Recovery)
Table 115. UK Waste-to-Energy (WtE) Market Forecast by Plant Status, 2021-2031 (Plant Units, AGR (%), CAGR(%), Cumulative)
Table 116. UK Waste-to-Energy (WtE) Market Forecast by Plant Status, 2021-2031 (Plant Units, AGR (%), CAGR(%), Cumulative) (V-Shaped Recovery)
Table 117. UK Waste-to-Energy (WtE) Market Forecast by Plant Status, 2021-2031 (Plant Units, AGR (%), CAGR(%), Cumulative) (W-Shaped Recovery)
Table 118. UK Waste-to-Energy (WtE) Market Forecast by Plant Status, 2021-2031 (Plant Units, AGR (%), CAGR(%), Cumulative) (U-Shaped Recovery)
Table 119. UK Waste-to-Energy (WtE) Market Forecast by Plant Status, 2021-2031 (Plant Units, AGR (%), CAGR(%), Cumulative) (L-Shaped Recovery)
Table 120. UK Waste-to-Energy (WtE) Market by Technology, 2021-2031 (MTPA, AGR (%), CAGR(%), Cumulative)
Table 121. UK Waste-to-Energy (WtE) Market by Technology, 2021-2031 (MTPA, AGR (%), CAGR(%), Cumulative) (V-Shaped Recovery)
Table 122. UK Waste-to-Energy (WtE) Market by Technology, 2021-2031 (MTPA, AGR (%), CAGR(%), Cumulative) (W-Shaped Recovery)
Table 123. UK Waste-to-Energy (WtE) Market by Technology, 2021-2031 (MTPA, AGR (%), CAGR(%), Cumulative) (U-Shaped Recovery)
Table 124. UK Waste-to-Energy (WtE) Market by Technology, 2021-2031 (MTPA, AGR (%), CAGR(%), Cumulative) (L-Shaped Recovery)
Table 125. UK Waste-to-Energy (WtE) Energy Generation Market by End-Use, 2021-2031 (MWe, AGR (%), CAGR(%), Cumulative)
Table 126. UK Waste-to-Energy (WtE) Energy Generation Market by End-Use, 2021-2031 (MWe, AGR (%), CAGR(%), Cumulative) (V-Shaped Recovery)
Table 127. UK Waste-to-Energy (WtE) Energy Generation Market by End-Use, 2021-2031 (MWe, AGR (%), CAGR(%), Cumulative) (W-Shaped Recovery)
Table 128. UK Waste-to-Energy (WtE) Energy Generation Market by End-Use, 2021-2031 (MWe, AGR (%), CAGR(%), Cumulative) (U-Shaped Recovery)
Table 129. UK Waste-to-Energy (WtE) Energy Generation Market by End-Use, 2021-2031 (MWe, AGR (%), CAGR(%), Cumulative) (L-Shaped Recovery)
Table 130. Germany Waste-to-Energy (WtE) Market Forecast by Energy Generation, 2021-2031 (MWe, AGR (%), CAGR(%), Cumulative)
Table 131. Germany Waste-to-Energy (WtE) Market Forecast by Energy Generation, 2021-2031 (MWe, AGR (%), CAGR(%), Cumulative) (V-Shaped Recovery)
Table 132. Germany Waste-to-Energy (WtE) Market Forecast by Energy Generation, 2021-2031 (MWe, AGR (%), CAGR(%), Cumulative) (W-Shaped Recovery)
Table 133. Germany Waste-to-Energy (WtE) Market Forecast by Energy Generation, 2021-2031 (MWe, AGR (%), CAGR(%), Cumulative) (U-Shaped Recovery)
Table 134. Germany Waste-to-Energy (WtE) Market Forecast by Energy Generation, 2021-2031 (MWe, AGR (%), CAGR(%), Cumulative) (L-Shaped Recovery)
Table 135. Germany Waste-to-Energy (WtE) Market Forecast by CAPEX, 2021-2031 (GermanyD Mn, AGR (%), CAGR(%), Cumulative)
Table 136. Germany Waste-to-Energy (WtE) Market Forecast by CAPEX, 2021-2031 (GermanyD Mn, AGR (%), CAGR(%), Cumulative) (V-Shaped Recovery)
Table 137. Germany Waste-to-Energy (WtE) Market Forecast by CAPEX, 2021-2031 (GermanyD Mn, AGR (%), CAGR(%), Cumulative) (W-Shaped Recovery)
Table 138. Germany Waste-to-Energy (WtE) Market Forecast by CAPEX, 2021-2031 (GermanyD Mn, AGR (%), CAGR(%), Cumulative) (U-Shaped Recovery)
Table 139. Germany Waste-to-Energy (WtE) Market Forecast by CAPEX, 2021-2031 (GermanyD Mn, AGR (%), CAGR(%), Cumulative) (L-Shaped Recovery)
Table 140. Germany Waste-to-Energy (WtE) Market Forecast by Capacity, 2021-2031 (MTPA, AGR (%), CAGR(%), Cumulative)
Table 141. Germany Waste-to-Energy (WtE) Market Forecast by Capacity, 2021-2031 (MTPA, AGR (%), CAGR(%), Cumulative) (V-Shaped Recovery)
Table 142. Germany Waste-to-Energy (WtE) Market Forecast by Capacity, 2021-2031 (MTPA, AGR (%), CAGR(%), Cumulative) (W-Shaped Recovery)
Table 143. Germany Waste-to-Energy (WtE) Market Forecast by Capacity, 2021-2031 (MTPA, AGR (%), CAGR(%), Cumulative) (U-Shaped Recovery)
Table 144. Germany Waste-to-Energy (WtE) Market Forecast by Capacity, 2021-2031 (MTPA, AGR (%), CAGR(%), Cumulative) (L-Shaped Recovery)
Table 145. Germany Waste-to-Energy (WtE) Market Forecast, 2021-2031 (No. of Units, AGR (%), CAGR(%), Cumulative)
Table 146. Germany Waste-to-Energy (WtE) Market Forecast, 2021-2031 (No. of Units, AGR (%), CAGR(%), Cumulative) (V-Shaped Recovery)
Table 147. Germany Waste-to-Energy (WtE) Market Forecast, 2021-2031 (No. of Units, AGR (%), CAGR(%), Cumulative) (W-Shaped Recovery)
Table 148. Germany Waste-to-Energy (WtE) Market Forecast, 2021-2031 (No. of Units, AGR (%), CAGR(%), Cumulative) (U-Shaped Recovery)
Table 149. Germany Waste-to-Energy (WtE) Market Forecast, 2021-2031 (No. of Units, AGR (%), CAGR(%), Cumulative) (L-Shaped Recovery)
Table 150. Germany Waste-to-Energy (WtE) Market Forecast by Plant Status, 2021-2031 (Plant Units, AGR (%), CAGR(%), Cumulative)
Table 151. Germany Waste-to-Energy (WtE) Market Forecast by Plant Status, 2021-2031 (Plant Units, AGR (%), CAGR(%), Cumulative) (V-Shaped Recovery)
Table 152. Germany Waste-to-Energy (WtE) Market Forecast by Plant Status, 2021-2031 (Plant Units, AGR (%), CAGR(%), Cumulative) (W-Shaped Recovery)
Table 153. Germany Waste-to-Energy (WtE) Market Forecast by Plant Status, 2021-2031 (Plant Units, AGR (%), CAGR(%), Cumulative) (U-Shaped Recovery)
Table 154. Germany Waste-to-Energy (WtE) Market Forecast by Plant Status, 2021-2031 (Plant Units, AGR (%), CAGR(%), Cumulative) (L-Shaped Recovery)
Table 155. Germany Waste-to-Energy (WtE) Market by Technology, 2021-2031 (MTPA, AGR (%), CAGR(%), Cumulative)
Table 156. Germany Waste-to-Energy (WtE) Market by Technology, 2021-2031 (MTPA, AGR (%), CAGR(%), Cumulative) (V-Shaped Recovery)
Table 157. Germany Waste-to-Energy (WtE) Market by Technology, 2021-2031 (MTPA, AGR (%), CAGR(%), Cumulative) (W-Shaped Recovery)
Table 158. Germany Waste-to-Energy (WtE) Market by Technology, 2021-2031 (MTPA, AGR (%), CAGR(%), Cumulative) (U-Shaped Recovery)
Table 159. Germany Waste-to-Energy (WtE) Market by Technology, 2021-2031 (MTPA, AGR (%), CAGR(%), Cumulative) (L-Shaped Recovery)
Table 160. Germany Waste-to-Energy (WtE) Energy Generation Market by End-Use, 2021-2031 (MWe, AGR (%), CAGR(%), Cumulative)
Table 161. Germany Waste-to-Energy (WtE) Energy Generation Market by End-Use, 2021-2031 (MWe, AGR (%), CAGR(%), Cumulative) (V-Shaped Recovery)
Table 162. Germany Waste-to-Energy (WtE) Energy Generation Market by End-Use, 2021-2031 (MWe, AGR (%), CAGR(%), Cumulative) (W-Shaped Recovery)
Table 163. Germany Waste-to-Energy (WtE) Energy Generation Market by End-Use, 2021-2031 (MWe, AGR (%), CAGR(%), Cumulative) (U-Shaped Recovery)
Table 164. Germany Waste-to-Energy (WtE) Energy Generation Market by End-Use, 2021-2031 (MWe, AGR (%), CAGR(%), Cumulative) (L-Shaped Recovery)
Table 165. France Waste-to-Energy (WtE) Market Forecast by Energy Generation, 2021-2031 (MWe, AGR (%), CAGR(%), Cumulative)
Table 166. France Waste-to-Energy (WtE) Market Forecast by Energy Generation, 2021-2031 (MWe, AGR (%), CAGR(%), Cumulative) (V-Shaped Recovery)
Table 167. France Waste-to-Energy (WtE) Market Forecast by Energy Generation, 2021-2031 (MWe, AGR (%), CAGR(%), Cumulative) (W-Shaped Recovery)
Table 168. France Waste-to-Energy (WtE) Market Forecast by Energy Generation, 2021-2031 (MWe, AGR (%), CAGR(%), Cumulative) (U-Shaped Recovery)
Table 169. France Waste-to-Energy (WtE) Market Forecast by Energy Generation, 2021-2031 (MWe, AGR (%), CAGR(%), Cumulative) (L-Shaped Recovery)
Table 170. France Waste-to-Energy (WtE) Market Forecast by CAPEX, 2021-2031 (FranceD Mn, AGR (%), CAGR(%), Cumulative)
Table 171. France Waste-to-Energy (WtE) Market Forecast by CAPEX, 2021-2031 (FranceD Mn, AGR (%), CAGR(%), Cumulative) (V-Shaped Recovery)
Table 172. France Waste-to-Energy (WtE) Market Forecast by CAPEX, 2021-2031 (FranceD Mn, AGR (%), CAGR(%), Cumulative) (W-Shaped Recovery)
Table 173. France Waste-to-Energy (WtE) Market Forecast by CAPEX, 2021-2031 (FranceD Mn, AGR (%), CAGR(%), Cumulative) (U-Shaped Recovery)
Table 174. France Waste-to-Energy (WtE) Market Forecast by CAPEX, 2021-2031 (FranceD Mn, AGR (%), CAGR(%), Cumulative) (L-Shaped Recovery)
Table 175. France Waste-to-Energy (WtE) Market Forecast by Capacity, 2021-2031 (MTPA, AGR (%), CAGR(%), Cumulative)
Table 176. France Waste-to-Energy (WtE) Market Forecast by Capacity, 2021-2031 (MTPA, AGR (%), CAGR(%), Cumulative) (V-Shaped Recovery)
Table 177. France Waste-to-Energy (WtE) Market Forecast by Capacity, 2021-2031 (MTPA, AGR (%), CAGR(%), Cumulative) (W-Shaped Recovery)
Table 178. France Waste-to-Energy (WtE) Market Forecast by Capacity, 2021-2031 (MTPA, AGR (%), CAGR(%), Cumulative) (U-Shaped Recovery)
Table 179. France Waste-to-Energy (WtE) Market Forecast by Capacity, 2021-2031 (MTPA, AGR (%), CAGR(%), Cumulative) (L-Shaped Recovery)
Table 180. France Waste-to-Energy (WtE) Market Forecast, 2021-2031 (No. of Units, AGR (%), CAGR(%), Cumulative)
Table 181. France Waste-to-Energy (WtE) Market Forecast, 2021-2031 (No. of Units, AGR (%), CAGR(%), Cumulative) (V-Shaped Recovery)
Table 182. France Waste-to-Energy (WtE) Market Forecast, 2021-2031 (No. of Units, AGR (%), CAGR(%), Cumulative) (W-Shaped Recovery)
Table 183. France Waste-to-Energy (WtE) Market Forecast, 2021-2031 (No. of Units, AGR (%), CAGR(%), Cumulative) (U-Shaped Recovery)
Table 184. France Waste-to-Energy (WtE) Market Forecast, 2021-2031 (No. of Units, AGR (%), CAGR(%), Cumulative) (L-Shaped Recovery)
Table 185. France Waste-to-Energy (WtE) Market Forecast by Plant Status, 2021-2031 (Plant Units, AGR (%), CAGR(%), Cumulative)
Table 186. France Waste-to-Energy (WtE) Market Forecast by Plant Status, 2021-2031 (Plant Units, AGR (%), CAGR(%), Cumulative) (V-Shaped Recovery)
Table 187. France Waste-to-Energy (WtE) Market Forecast by Plant Status, 2021-2031 (Plant Units, AGR (%), CAGR(%), Cumulative) (W-Shaped Recovery)
Table 188. France Waste-to-Energy (WtE) Market Forecast by Plant Status, 2021-2031 (Plant Units, AGR (%), CAGR(%), Cumulative) (U-Shaped Recovery)
Table 189. France Waste-to-Energy (WtE) Market Forecast by Plant Status, 2021-2031 (Plant Units, AGR (%), CAGR(%), Cumulative) (L-Shaped Recovery)
Table 190. France Waste-to-Energy (WtE) Market by Technology, 2021-2031 (MTPA, AGR (%), CAGR(%), Cumulative)
Table 191. France Waste-to-Energy (WtE) Market by Technology, 2021-2031 (MTPA, AGR (%), CAGR(%), Cumulative) (V-Shaped Recovery)
Table 192. France Waste-to-Energy (WtE) Market by Technology, 2021-2031 (MTPA, AGR (%), CAGR(%), Cumulative) (W-Shaped Recovery)
Table 193. France Waste-to-Energy (WtE) Market by Technology, 2021-2031 (MTPA, AGR (%), CAGR(%), Cumulative) (U-Shaped Recovery)
Table 194. France Waste-to-Energy (WtE) Market by Technology, 2021-2031 (MTPA, AGR (%), CAGR(%), Cumulative) (L-Shaped Recovery)
Table 195. France Waste-to-Energy (WtE) Energy Generation Market by End-Use, 2021-2031 (MWe, AGR (%), CAGR(%), Cumulative)
Table 196. France Waste-to-Energy (WtE) Energy Generation Market by End-Use, 2021-2031 (MWe, AGR (%), CAGR(%), Cumulative) (V-Shaped Recovery)
Table 197. France Waste-to-Energy (WtE) Energy Generation Market by End-Use, 2021-2031 (MWe, AGR (%), CAGR(%), Cumulative) (W-Shaped Recovery)
Table 199. France Waste-to-Energy (WtE) Energy Generation Market by End-Use, 2021-2031 (MWe, AGR (%), CAGR(%), Cumulative) (U-Shaped Recovery)
Table 200. France Waste-to-Energy (WtE) Energy Generation Market by End-Use, 2021-2031 (MWe, AGR (%), CAGR(%), Cumulative) (L-Shaped Recovery)
Table 201. Switzerland Waste-to-Energy (WtE) Market Forecast by Energy Generation, 2021-2031 (MWe, AGR (%), CAGR(%), Cumulative)
Table 202. Switzerland Waste-to-Energy (WtE) Market Forecast by Energy Generation, 2021-2031 (MWe, AGR (%), CAGR(%), Cumulative) (V-Shaped Recovery)
Table 203. Switzerland Waste-to-Energy (WtE) Market Forecast by Energy Generation, 2021-2031 (MWe, AGR (%), CAGR(%), Cumulative) (W-Shaped Recovery)
Table 204. Switzerland Waste-to-Energy (WtE) Market Forecast by Energy Generation, 2021-2031 (MWe, AGR (%), CAGR(%), Cumulative) (U-Shaped Recovery)
Table 205. Switzerland Waste-to-Energy (WtE) Market Forecast by Energy Generation, 2021-2031 (MWe, AGR (%), CAGR(%), Cumulative) (L-Shaped Recovery)
Table 206. Switzerland Waste-to-Energy (WtE) Market Forecast by CAPEX, 2021-2031 (SwitzerlandD Mn, AGR (%), CAGR(%), Cumulative)
Table 207. Switzerland Waste-to-Energy (WtE) Market Forecast by CAPEX, 2021-2031 (SwitzerlandD Mn, AGR (%), CAGR(%), Cumulative) (V-Shaped Recovery)
Table 208. Switzerland Waste-to-Energy (WtE) Market Forecast by CAPEX, 2021-2031 (SwitzerlandD Mn, AGR (%), CAGR(%), Cumulative) (W-Shaped Recovery)
Table 209. Switzerland Waste-to-Energy (WtE) Market Forecast by CAPEX, 2021-2031 (SwitzerlandD Mn, AGR (%), CAGR(%), Cumulative) (U-Shaped Recovery)
Table 210. Switzerland Waste-to-Energy (WtE) Market Forecast by CAPEX, 2021-2031 (SwitzerlandD Mn, AGR (%), CAGR(%), Cumulative) (L-Shaped Recovery)
Table 211. Switzerland Waste-to-Energy (WtE) Market Forecast by Capacity, 2021-2031 (MTPA, AGR (%), CAGR(%), Cumulative)
Table 212. Switzerland Waste-to-Energy (WtE) Market Forecast by Capacity, 2021-2031 (MTPA, AGR (%), CAGR(%), Cumulative) (V-Shaped Recovery)
Table 213. Switzerland Waste-to-Energy (WtE) Market Forecast by Capacity, 2021-2031 (MTPA, AGR (%), CAGR(%), Cumulative) (W-Shaped Recovery)
Table 214. Switzerland Waste-to-Energy (WtE) Market Forecast by Capacity, 2021-2031 (MTPA, AGR (%), CAGR(%), Cumulative) (U-Shaped Recovery)
Table 215. Switzerland Waste-to-Energy (WtE) Market Forecast by Capacity, 2021-2031 (MTPA, AGR (%), CAGR(%), Cumulative) (L-Shaped Recovery)
Table 216. Switzerland Waste-to-Energy (WtE) Market Forecast, 2021-2031 (No. of Units, AGR (%), CAGR(%), Cumulative)
Table 217. Switzerland Waste-to-Energy (WtE) Market Forecast, 2021-2031 (No. of Units, AGR (%), CAGR(%), Cumulative) (W-Shaped Recovery)
Table 218. Switzerland Waste-to-Energy (WtE) Market Forecast, 2021-2031 (No. of Units, AGR (%), CAGR(%), Cumulative) (U-Shaped Recovery)
Table 219. Switzerland Waste-to-Energy (WtE) Market Forecast, 2021-2031 (No. of Units, AGR (%), CAGR(%), Cumulative) (L-Shaped Recovery)
Table 220. Switzerland Waste-to-Energy (WtE) Market Forecast by Plant Status, 2021-2031 (Plant Units, AGR (%), CAGR(%), Cumulative)
Table 221. Switzerland Waste-to-Energy (WtE) Market Forecast by Plant Status, 2021-2031 (Plant Units, AGR (%), CAGR(%), Cumulative) (V-Shaped Recovery)
Table 222. Switzerland Waste-to-Energy (WtE) Market Forecast by Plant Status, 2021-2031 (Plant Units, AGR (%), CAGR(%), Cumulative) (W-Shaped Recovery)
Table 223. Switzerland Waste-to-Energy (WtE) Market Forecast by Plant Status, 2021-2031 (Plant Units, AGR (%), CAGR(%), Cumulative) (U-Shaped Recovery)
Table 224. Switzerland Waste-to-Energy (WtE) Market Forecast by Plant Status, 2021-2031 (Plant Units, AGR (%), CAGR(%), Cumulative) (L-Shaped Recovery)
Table 225. Switzerland Waste-to-Energy (WtE) Market by Technology, 2021-2031 (MTPA, AGR (%), CAGR(%), Cumulative)
Table 226. Switzerland Waste-to-Energy (WtE) Market by Technology, 2021-2031 (MTPA, AGR (%), CAGR(%), Cumulative) (V-Shaped Recovery)
Table 227. Switzerland Waste-to-Energy (WtE) Market by Technology, 2021-2031 (MTPA, AGR (%), CAGR(%), Cumulative) (W-Shaped Recovery)
Table 228. Switzerland Waste-to-Energy (WtE) Market by Technology, 2021-2031 (MTPA, AGR (%), CAGR(%), Cumulative) (U-Shaped Recovery)
Table 229. Switzerland Waste-to-Energy (WtE) Market by Technology, 2021-2031 (MTPA, AGR (%), CAGR(%), Cumulative) (L-Shaped Recovery)
Table 230. Switzerland Waste-to-Energy (WtE) Energy Generation Market by End-Use, 2021-2031 (MWe, AGR (%), CAGR(%), Cumulative)
Table 231. Switzerland Waste-to-Energy (WtE) Energy Generation Market by End-Use, 2021-2031 (MWe, AGR (%), CAGR(%), Cumulative) (V-Shaped Recovery)
Table 232. Switzerland Waste-to-Energy (WtE) Energy Generation Market by End-Use, 2021-2031 (MWe, AGR (%), CAGR(%), Cumulative) (W-Shaped Recovery)
Table 233. Switzerland Waste-to-Energy (WtE) Energy Generation Market by End-Use, 2021-2031 (MWe, AGR (%), CAGR(%), Cumulative) (U-Shaped Recovery)
Table 234. Switzerland Waste-to-Energy (WtE) Energy Generation Market by End-Use, 2021-2031 (MWe, AGR (%), CAGR(%), Cumulative) (L-Shaped Recovery)
Table 235. China Waste-to-Energy (WtE) Market Forecast by Energy Generation, 2021-2031 (MWe, AGR (%), CAGR(%), Cumulative)
Table 236. China Waste-to-Energy (WtE) Market Forecast by Energy Generation, 2021-2031 (MWe, AGR (%), CAGR(%), Cumulative) (V-Shaped Recovery)
Table 237. China Waste-to-Energy (WtE) Market Forecast by Energy Generation, 2021-2031 (MWe, AGR (%), CAGR(%), Cumulative) (W-Shaped Recovery)
Table 238. China Waste-to-Energy (WtE) Market Forecast by Energy Generation, 2021-2031 (MWe, AGR (%), CAGR(%), Cumulative) (U-Shaped Recovery)
Table 239. China Waste-to-Energy (WtE) Market Forecast by Energy Generation, 2021-2031 (MWe, AGR (%), CAGR(%), Cumulative) (L-Shaped Recovery)
Table 240. China Waste-to-Energy (WtE) Market Forecast by CAPEX, 2021-2031 (ChinaD Mn, AGR (%), CAGR(%), Cumulative)
Table 241. China Waste-to-Energy (WtE) Market Forecast by CAPEX, 2021-2031 (ChinaD Mn, AGR (%), CAGR(%), Cumulative) (V-Shaped Recovery)
Table 242. China Waste-to-Energy (WtE) Market Forecast by CAPEX, 2021-2031 (ChinaD Mn, AGR (%), CAGR(%), Cumulative) (W-Shaped Recovery)
Table 243. China Waste-to-Energy (WtE) Market Forecast by CAPEX, 2021-2031 (ChinaD Mn, AGR (%), CAGR(%), Cumulative) (U-Shaped Recovery)
Table 244. China Waste-to-Energy (WtE) Market Forecast by CAPEX, 2021-2031 (ChinaD Mn, AGR (%), CAGR(%), Cumulative) (L-Shaped Recovery)
Table 245. China Waste-to-Energy (WtE) Market Forecast by Capacity, 2021-2031 (MTPA, AGR (%), CAGR(%), Cumulative)
Table 246. China Waste-to-Energy (WtE) Market Forecast by Capacity, 2021-2031 (MTPA, AGR (%), CAGR(%), Cumulative) (V-Shaped Recovery)
Table 247. China Waste-to-Energy (WtE) Market Forecast by Capacity, 2021-2031 (MTPA, AGR (%), CAGR(%), Cumulative) (W-Shaped Recovery)
Table 248. China Waste-to-Energy (WtE) Market Forecast by Capacity, 2021-2031 (MTPA, AGR (%), CAGR(%), Cumulative) (U-Shaped Recovery)
Table 249. China Waste-to-Energy (WtE) Market Forecast by Capacity, 2021-2031 (MTPA, AGR (%), CAGR(%), Cumulative) (L-Shaped Recovery)
Table 250. China Waste-to-Energy (WtE) Market Forecast, 2021-2031 (No. of Units, AGR (%), CAGR(%), Cumulative)
Table 251. China Waste-to-Energy (WtE) Market Forecast, 2021-2031 (No. of Units, AGR (%), CAGR(%), Cumulative) (V-Shaped Recovery)
Table 252. China Waste-to-Energy (WtE) Market Forecast, 2021-2031 (No. of Units, AGR (%), CAGR(%), Cumulative) (W-Shaped Recovery)
Table 253. China Waste-to-Energy (WtE) Market Forecast, 2021-2031 (No. of Units, AGR (%), CAGR(%), Cumulative) (U-Shaped Recovery)
Table 254. China Waste-to-Energy (WtE) Market Forecast, 2021-2031 (No. of Units, AGR (%), CAGR(%), Cumulative) (L-Shaped Recovery)
Table 255. China Waste-to-Energy (WtE) Market Forecast by Plant Status, 2021-2031 (Plant Units, AGR (%), CAGR(%), Cumulative)
Table 256. China Waste-to-Energy (WtE) Market Forecast by Plant Status, 2021-2031 (Plant Units, AGR (%), CAGR(%), Cumulative) (V-Shaped Recovery)
Table 257. China Waste-to-Energy (WtE) Market Forecast by Plant Status, 2021-2031 (Plant Units, AGR (%), CAGR(%), Cumulative) (W-Shaped Recovery)
Table 258. China Waste-to-Energy (WtE) Market Forecast by Plant Status, 2021-2031 (Plant Units, AGR (%), CAGR(%), Cumulative) (U-Shaped Recovery)
Table 259. China Waste-to-Energy (WtE) Market Forecast by Plant Status, 2021-2031 (Plant Units, AGR (%), CAGR(%), Cumulative) (L-Shaped Recovery)
Table 260. China Waste-to-Energy (WtE) Market by Technology, 2021-2031 (MTPA, AGR (%), CAGR(%), Cumulative)
Table 261. China Waste-to-Energy (WtE) Market by Technology, 2021-2031 (MTPA, AGR (%), CAGR(%), Cumulative) (V-Shaped Recovery)
Table 262. China Waste-to-Energy (WtE) Market by Technology, 2021-2031 (MTPA, AGR (%), CAGR(%), Cumulative) (W-Shaped Recovery)
Table 263. China Waste-to-Energy (WtE) Market by Technology, 2021-2031 (MTPA, AGR (%), CAGR(%), Cumulative) (U-Shaped Recovery)
Table 264. China Waste-to-Energy (WtE) Market by Technology, 2021-2031 (MTPA, AGR (%), CAGR(%), Cumulative) (L-Shaped Recovery)
Table 265. China Waste-to-Energy (WtE) Energy Generation Market by End-Use, 2021-2031 (MWe, AGR (%), CAGR(%), Cumulative)
Table 266. China Waste-to-Energy (WtE) Energy Generation Market by End-Use, 2021-2031 (MWe, AGR (%), CAGR(%), Cumulative) (V-Shaped Recovery)
Table 267. China Waste-to-Energy (WtE) Energy Generation Market by End-Use, 2021-2031 (MWe, AGR (%), CAGR(%), Cumulative) (W-Shaped Recovery)
Table 268. China Waste-to-Energy (WtE) Energy Generation Market by End-Use, 2021-2031 (MWe, AGR (%), CAGR(%), Cumulative) (U-Shaped Recovery)
Table 269. China Waste-to-Energy (WtE) Energy Generation Market by End-Use, 2021-2031 (MWe, AGR (%), CAGR(%), Cumulative) (L-Shaped Recovery)
Table 270. Japan Waste-to-Energy (WtE) Market Forecast by Energy Generation, 2021-2031 (MWe, AGR (%), CAGR(%), Cumulative)
Table 271. Japan Waste-to-Energy (WtE) Market Forecast by Energy Generation, 2021-2031 (MWe, AGR (%), CAGR(%), Cumulative) (V-Shaped Recovery)
Table 272. Japan Waste-to-Energy (WtE) Market Forecast by Energy Generation, 2021-2031 (MWe, AGR (%), CAGR(%), Cumulative) (W-Shaped Recovery)
Table 273. Japan Waste-to-Energy (WtE) Market Forecast by Energy Generation, 2021-2031 (MWe, AGR (%), CAGR(%), Cumulative) (U-Shaped Recovery)
Table 274. Japan Waste-to-Energy (WtE) Market Forecast by Energy Generation, 2021-2031 (MWe, AGR (%), CAGR(%), Cumulative) (L-Shaped Recovery)
Table 275. Japan Waste-to-Energy (WtE) Market Forecast by CAPEX, 2021-2031 (JapanD Mn, AGR (%), CAGR(%), Cumulative)
Table 276. Japan Waste-to-Energy (WtE) Market Forecast by CAPEX, 2021-2031 (JapanD Mn, AGR (%), CAGR(%), Cumulative) (V-Shaped Recovery)
Table 277. Japan Waste-to-Energy (WtE) Market Forecast by CAPEX, 2021-2031 (JapanD Mn, AGR (%), CAGR(%), Cumulative) (W-Shaped Recovery)
Table 278. Japan Waste-to-Energy (WtE) Market Forecast by CAPEX, 2021-2031 (JapanD Mn, AGR (%), CAGR(%), Cumulative) (U-Shaped Recovery)
Table 279. Japan Waste-to-Energy (WtE) Market Forecast by CAPEX, 2021-2031 (JapanD Mn, AGR (%), CAGR(%), Cumulative) (L-Shaped Recovery)
Table 280. Japan Waste-to-Energy (WtE) Market Forecast by Capacity, 2021-2031 (MTPA, AGR (%), CAGR(%), Cumulative)
Table 281. Japan Waste-to-Energy (WtE) Market Forecast by Capacity, 2021-2031 (MTPA, AGR (%), CAGR(%), Cumulative) (V-Shaped Recovery)
Table 282. Japan Waste-to-Energy (WtE) Market Forecast by Capacity, 2021-2031 (MTPA, AGR (%), CAGR(%), Cumulative) (W-Shaped Recovery)
Table 283. Japan Waste-to-Energy (WtE) Market Forecast by Capacity, 2021-2031 (MTPA, AGR (%), CAGR(%), Cumulative) (U-Shaped Recovery)
Table 284. Japan Waste-to-Energy (WtE) Market Forecast by Capacity, 2021-2031 (MTPA, AGR (%), CAGR(%), Cumulative) (L-Shaped Recovery)
Table 285. Japan Waste-to-Energy (WtE) Market Forecast, 2021-2031 (No. of Units, AGR (%), CAGR(%), Cumulative)
Table 286. Japan Waste-to-Energy (WtE) Market Forecast, 2021-2031 (No. of Units, AGR (%), CAGR(%), Cumulative) (V-Shaped Recovery)
Table 287. Japan Waste-to-Energy (WtE) Market Forecast, 2021-2031 (No. of Units, AGR (%), CAGR(%), Cumulative) (W-Shaped Recovery)
Table 288. Japan Waste-to-Energy (WtE) Market Forecast, 2021-2031 (No. of Units, AGR (%), CAGR(%), Cumulative) (U-Shaped Recovery)
Table 289. Japan Waste-to-Energy (WtE) Market Forecast, 2021-2031 (No. of Units, AGR (%), CAGR(%), Cumulative) (L-Shaped Recovery)
Table 290. Japan Waste-to-Energy (WtE) Market Forecast by Plant Status, 2021-2031 (Plant Units, AGR (%), CAGR(%), Cumulative)
Table 291. Japan Waste-to-Energy (WtE) Market Forecast by Plant Status, 2021-2031 (Plant Units, AGR (%), CAGR(%), Cumulative) (V-Shaped Recovery)
Table 292. Japan Waste-to-Energy (WtE) Market Forecast by Plant Status, 2021-2031 (Plant Units, AGR (%),Cumulative) (V-Shaped Recovery)
Table 293. Japan Waste-to-Energy (WtE) Market Forecast by Plant Status, 2021-2031 (Plant Units, AGR (%), CAGR(%), Cumulative) (W-Shaped Recovery)
Table 294. Japan Waste-to-Energy (WtE) Market Forecast by Plant Status, 2021-2031 (Plant Units, AGR (%), CAGR(%), Cumulative) (U-Shaped Recovery)
Table 295. Japan Waste-to-Energy (WtE) Market Forecast by Plant Status, 2021-2031 (Plant Units, AGR (%), CAGR(%), Cumulative) (L-Shaped Recovery)
Table 296. Japan Waste-to-Energy (WtE) Market by Technology, 2021-2031 (MTPA, AGR (%), CAGR(%), Cumulative)
Table 297. Japan Waste-to-Energy (WtE) Market by Technology, 2021-2031 (MTPA, AGR (%), CAGR(%), Cumulative) (V-Shaped Recovery)
Table 298. Japan Waste-to-Energy (WtE) Market by Technology, 2021-2031 (MTPA, AGR (%), CAGR(%), Cumulative) (W-Shaped Recovery)
Table 299. Japan Waste-to-Energy (WtE) Market by Technology, 2021-2031 (MTPA, AGR (%), CAGR(%), Cumulative) (U-Shaped Recovery)
Table 300. Japan Waste-to-Energy (WtE) Market by Technology, 2021-2031 (MTPA, AGR (%), CAGR(%), Cumulative) (L-Shaped Recovery)
Table 301. Japan Waste-to-Energy (WtE) Energy Generation Market by End-Use, 2021-2031 (MWe, AGR (%), CAGR(%), Cumulative)
Table 302. Japan Waste-to-Energy (WtE) Energy Generation Market by End-Use, 2021-2031 (MWe, AGR (%), CAGR(%), Cumulative) (V-Shaped Recovery)
Table 303. Japan Waste-to-Energy (WtE) Energy Generation Market by End-Use, 2021-2031 (MWe, AGR (%), CAGR(%), Cumulative) (W-Shaped Recovery)
Table 304. Japan Waste-to-Energy (WtE) Energy Generation Market by End-Use, 2021-2031 (MWe, AGR (%), CAGR(%), Cumulative) (U-Shaped Recovery)
Table 305. Japan Waste-to-Energy (WtE) Energy Generation Market by End-Use, 2021-2031 (MWe, AGR (%), CAGR(%), Cumulative) (L-Shaped Recovery)
Table 306. India Waste-to-Energy (WtE) Market Forecast by Energy Generation, 2021-2031 (MWe, AGR (%), CAGR(%), Cumulative)
Table 307. India Waste-to-Energy (WtE) Market Forecast by Energy Generation, 2021-2031 (MWe, AGR (%), CAGR(%), Cumulative) (V-Shaped Recovery)
Table 308. India Waste-to-Energy (WtE) Market Forecast by Energy Generation, 2021-2031 (MWe, AGR (%), CAGR(%), Cumulative) (W-Shaped Recovery)
Table 309. India Waste-to-Energy (WtE) Market Forecast by Energy Generation, 2021-2031 (MWe, AGR (%), CAGR(%), Cumulative) (U-Shaped Recovery)
Table 310. India Waste-to-Energy (WtE) Market Forecast by Energy Generation, 2021-2031 (MWe, AGR (%), CAGR(%), Cumulative) (L-Shaped Recovery)
Table 311. India Waste-to-Energy (WtE) Market Forecast by CAPEX, 2021-2031 (IndiaD Mn, AGR (%), CAGR(%), Cumulative)
Table 312. India Waste-to-Energy (WtE) Market Forecast by CAPEX, 2021-2031 (IndiaD Mn, AGR (%), CAGR(%), Cumulative) (V-Shaped Recovery)
Table 313. India Waste-to-Energy (WtE) Market Forecast by CAPEX, 2021-2031 (IndiaD Mn, AGR (%), CAGR(%), Cumulative) (W-Shaped Recovery)
Table 314. India Waste-to-Energy (WtE) Market Forecast by CAPEX, 2021-2031 (IndiaD Mn, AGR (%), CAGR(%), Cumulative) (U-Shaped Recovery)
Table 315. India Waste-to-Energy (WtE) Market Forecast by CAPEX, 2021-2031 (IndiaD Mn, AGR (%), CAGR(%), Cumulative) (L-Shaped Recovery)
Table 316. India Waste-to-Energy (WtE) Market Forecast by Capacity, 2021-2031 (MTPA, AGR (%), CAGR(%), Cumulative)
Table 317. India Waste-to-Energy (WtE) Market Forecast by Capacity, 2021-2031 (MTPA, AGR (%), CAGR(%), Cumulative) (V-Shaped Recovery)
Table 318. India Waste-to-Energy (WtE) Market Forecast by Capacity, 2021-2031 (MTPA, AGR (%), CAGR(%), Cumulative) (W-Shaped Recovery)
Table 319. India Waste-to-Energy (WtE) Market Forecast by Capacity, 2021-2031 (MTPA, AGR (%), CAGR(%), Cumulative) (U-Shaped Recovery)
Table 320. India Waste-to-Energy (WtE) Market Forecast by Capacity, 2021-2031 (MTPA, AGR (%), CAGR(%), Cumulative) (L-Shaped Recovery)
Table 321. India Waste-to-Energy (WtE) Market Forecast, 2021-2031 (No. of Units, AGR (%), CAGR(%), Cumulative)
Table 322. India Waste-to-Energy (WtE) Market Forecast, 2021-2031 (No. of Units, AGR (%), CAGR(%), Cumulative) (V-Shaped Recovery)
Table 323. India Waste-to-Energy (WtE) Market Forecast, 2021-2031 (No. of Units, AGR (%), CAGR(%), Cumulative) (W-Shaped Recovery)
Table 324. India Waste-to-Energy (WtE) Market Forecast, 2021-2031 (No. of Units, AGR (%), CAGR(%), Cumulative) (U-Shaped Recovery)
Table 325. India Waste-to-Energy (WtE) Market Forecast, 2021-2031 (No. of Units, AGR (%), CAGR(%), Cumulative) (L-Shaped Recovery)
Table 326. India Waste-to-Energy (WtE) Market Forecast by Plant Status, 2021-2031 (Plant Units, AGR (%), CAGR(%), Cumulative)
Table 327. India Waste-to-Energy (WtE) Market Forecast by Plant Status, 2021-2031 (Plant Units, AGR (%), CAGR(%), Cumulative) (V-Shaped Recovery)
Table 328. India Waste-to-Energy (WtE) Market Forecast by Plant Status, 2021-2031 (Plant Units, AGR (%), CAGR(%), Cumulative) (W-Shaped Recovery)
Table 329. India Waste-to-Energy (WtE) Market Forecast by Plant Status, 2021-2031 (Plant Units, AGR (%), CAGR(%), Cumulative) (U-Shaped Recovery)
Table 330. India Waste-to-Energy (WtE) Market Forecast by Plant Status, 2021-2031 (Plant Units, AGR (%), CAGR(%), Cumulative) (L-Shaped Recovery)
Table 331. India Waste-to-Energy (WtE) Market by Technology, 2021-2031 (MTPA, AGR (%), CAGR(%), Cumulative)
Table 332. India Waste-to-Energy (WtE) Market by Technology, 2021-2031 (MTPA, AGR (%), CAGR(%), Cumulative) (V-Shaped Recovery)
Table 333. India Waste-to-Energy (WtE) Market by Technology, 2021-2031 (MTPA, AGR (%), CAGR(%), Cumulative) (W-Shaped Recovery)
Table 334. India Waste-to-Energy (WtE) Market by Technology, 2021-2031 (MTPA, AGR (%), CAGR(%), Cumulative) (U-Shaped Recovery)
Table 335. India Waste-to-Energy (WtE) Market by Technology, 2021-2031 (MTPA, AGR (%), CAGR(%), Cumulative) (L-Shaped Recovery)
Table 336. India Waste-to-Energy (WtE) Energy Generation Market by End-Use, 2021-2031 (MWe, AGR (%), CAGR(%), Cumulative)
Table 337. India Waste-to-Energy (WtE) Energy Generation Market by End-Use, 2021-2031 (MWe, AGR (%), CAGR(%), Cumulative) (V-Shaped Recovery)
Table 338. India Waste-to-Energy (WtE) Energy Generation Market by End-Use, 2021-2031 (MWe, AGR (%), CAGR(%), Cumulative) (W-Shaped Recovery)
Table 339. India Waste-to-Energy (WtE) Energy Generation Market by End-Use, 2021-2031 (MWe, AGR (%), CAGR(%), Cumulative) (U-Shaped Recovery)
Table 340. India Waste-to-Energy (WtE) Energy Generation Market by End-Use, 2021-2031 (MWe, AGR (%), CAGR(%), Cumulative) (L-Shaped Recovery)
Table 341. Singapore Waste-to-Energy (WtE) Market Forecast by Energy Generation, 2021-2031 (MWe, AGR (%), CAGR(%), Cumulative)
Table 342. Singapore Waste-to-Energy (WtE) Market Forecast by Energy Generation, 2021-2031 (MWe, AGR (%), CAGR(%), Cumulative) (V-Shaped Recovery)
Table 343. Singapore Waste-to-Energy (WtE) Market Forecast by Energy Generation, 2021-2031 (MWe, AGR (%), CAGR(%), Cumulative) (W-Shaped Recovery)
Table 344. Singapore Waste-to-Energy (WtE) Market Forecast by Energy Generation, 2021-2031 (MWe, AGR (%), CAGR(%), Cumulative) (U-Shaped Recovery)
Table 345. Singapore Waste-to-Energy (WtE) Market Forecast by Energy Generation, 2021-2031 (MWe, AGR (%), CAGR(%), Cumulative) (L-Shaped Recovery)
Table 346. Singapore Waste-to-Energy (WtE) Market Forecast by CAPEX, 2021-2031 (SingaporeD Mn, AGR (%), CAGR(%), Cumulative)
Table 347. Singapore Waste-to-Energy (WtE) Market Forecast by CAPEX, 2021-2031 (SingaporeD Mn, AGR (%), CAGR(%), Cumulative) (V-Shaped Recovery)
Table 348. Singapore Waste-to-Energy (WtE) Market Forecast by CAPEX, 2021-2031 (SingaporeD Mn, AGR (%), CAGR(%), Cumulative) (W-Shaped Recovery)
Table 349. Singapore Waste-to-Energy (WtE) Market Forecast by CAPEX, 2021-2031 (SingaporeD Mn, AGR (%), CAGR(%), Cumulative) (U-Shaped Recovery)
Table 350. Singapore Waste-to-Energy (WtE) Market Forecast by CAPEX, 2021-2031 (SingaporeD Mn, AGR (%), CAGR(%), Cumulative) (L-Shaped Recovery)
Table 351. Singapore Waste-to-Energy (WtE) Market Forecast by Capacity, 2021-2031 (MTPA, AGR (%), CAGR(%), Cumulative)
Table 352. Singapore Waste-to-Energy (WtE) Market Forecast by Capacity, 2021-2031 (MTPA, AGR (%), CAGR(%), Cumulative) (V-Shaped Recovery)
Table 353. Singapore Waste-to-Energy (WtE) Market Forecast by Capacity, 2021-2031 (MTPA, AGR (%), CAGR(%), Cumulative) (W-Shaped Recovery)
Table 354. Singapore Waste-to-Energy (WtE) Market Forecast by Capacity, 2021-2031 (MTPA, AGR (%), CAGR(%), Cumulative) (U-Shaped Recovery)
Table 355. Singapore Waste-to-Energy (WtE) Market Forecast by Capacity, 2021-2031 (MTPA, AGR (%), CAGR(%), Cumulative) (L-Shaped Recovery)
Table 356. Singapore Waste-to-Energy (WtE) Market Forecast, 2021-2031 (No. of Units, AGR (%), CAGR(%), Cumulative)
Table 357. Singapore Waste-to-Energy (WtE) Market Forecast, 2021-2031 (No. of Units, AGR (%), CAGR(%), Cumulative) (V-Shaped Recovery)
Table 358. Singapore Waste-to-Energy (WtE) Market Forecast, 2021-2031 (No. of Units, AGR (%), CAGR(%), Cumulative) (W-Shaped Recovery)
Table 359. Singapore Waste-to-Energy (WtE) Market Forecast, 2021-2031 (No. of Units, AGR (%), CAGR(%), Cumulative) (U-Shaped Recovery)
Table 360. Singapore Waste-to-Energy (WtE) Market Forecast, 2021-2031 (No. of Units, AGR (%), CAGR(%), Cumulative) (L-Shaped Recovery)
Table 361. Singapore Waste-to-Energy (WtE) Market Forecast by Plant Status, 2021-2031 (Plant Units, AGR (%), CAGR(%), Cumulative)
Table 362. Singapore Waste-to-Energy (WtE) Market Forecast by Plant Status, 2021-2031 (Plant Units, AGR (%), CAGR(%), Cumulative) (V-Shaped Recovery)
Table 363. Singapore Waste-to-Energy (WtE) Market Forecast by Plant Status, 2021-2031 (Plant Units, AGR (%), CAGR(%), Cumulative) (W-Shaped Recovery)
Table 364. Singapore Waste-to-Energy (WtE) Market Forecast by Plant Status, 2021-2031 (Plant Units, AGR (%), CAGR(%), Cumulative) (U-Shaped Recovery)
Table 365. Singapore Waste-to-Energy (WtE) Market Forecast by Plant Status, 2021-2031 (Plant Units, AGR (%), CAGR(%), Cumulative) (L-Shaped Recovery)
Table 366. Singapore Waste-to-Energy (WtE) Market by Technology, 2021-2031 (MTPA, AGR (%), CAGR(%), Cumulative)
Table 367. Singapore Waste-to-Energy (WtE) Market by Technology, 2021-2031 (MTPA, AGR (%), CAGR(%), Cumulative) (V-Shaped Recovery)
Table 368. Singapore Waste-to-Energy (WtE) Market by Technology, 2021-2031 (MTPA, AGR (%), CAGR(%), Cumulative) (W-Shaped Recovery)
Table 369. Singapore Waste-to-Energy (WtE) Market by Technology, 2021-2031 (MTPA, AGR (%), CAGR(%), Cumulative) (U-Shaped Recovery)
Table 370. Singapore Waste-to-Energy (WtE) Market by Technology, 2021-2031 (MTPA, AGR (%), CAGR(%), Cumulative) (L-Shaped Recovery)
Table 371. Singapore Waste-to-Energy (WtE) Energy Generation Market by End-Use, 2021-2031 (MWe, AGR (%), CAGR(%), Cumulative)
Table 372. Singapore Waste-to-Energy (WtE) Energy Generation Market by End-Use, 2021-2031 (MWe, AGR (%), CAGR(%), Cumulative) (V-Shaped Recovery)
Table 373. Singapore Waste-to-Energy (WtE) Energy Generation Market by End-Use, 2021-2031 (MWe, AGR (%), CAGR(%), Cumulative) (W-Shaped Recovery)
Table 374. Singapore Waste-to-Energy (WtE) Energy Generation Market by End-Use, 2021-2031 (MWe, AGR (%), CAGR(%), Cumulative) (U-Shaped Recovery)
Table 375. Singapore Waste-to-Energy (WtE) Energy Generation Market by End-Use, 2021-2031 (MWe, AGR (%), CAGR(%), Cumulative) (L-Shaped Recovery)
Table 376. South Korea Waste-to-Energy (WtE) Market Forecast by Energy Generation, 2021-2031 (MWe, AGR (%), CAGR(%), Cumulative)
Table 377. South Korea Waste-to-Energy (WtE) Market Forecast by Energy Generation, 2021-2031 (MWe, AGR (%), CAGR(%), Cumulative) (V-Shaped Recovery)
Table 378. South Korea Waste-to-Energy (WtE) Market Forecast by Energy Generation, 2021-2031 (MWe, AGR (%), CAGR(%), Cumulative) (W-Shaped Recovery)
Table 379. South Korea Waste-to-Energy (WtE) Market Forecast by Energy Generation, 2021-2031 (MWe, AGR (%), CAGR(%), Cumulative) (U-Shaped Recovery)
Table 380. South Korea Waste-to-Energy (WtE) Market Forecast by Energy Generation, 2021-2031 (MWe, AGR (%), CAGR(%), Cumulative) (L-Shaped Recovery)
Table 381. South Korea Waste-to-Energy (WtE) Market Forecast by CAPEX, 2021-2031 (South KoreaD Mn, AGR (%), CAGR(%), Cumulative)
Table 382. South Korea Waste-to-Energy (WtE) Market Forecast by CAPEX, 2021-2031 (South KoreaD Mn, AGR (%), CAGR(%), Cumulative) (V-Shaped Recovery)
Table 383. South Korea Waste-to-Energy (WtE) Market Forecast by CAPEX, 2021-2031 (South KoreaD Mn, AGR (%), CAGR(%), Cumulative) (W-Shaped Recovery)
Table 384. South Korea Waste-to-Energy (WtE) Market Forecast by CAPEX, 2021-2031 (South KoreaD Mn, AGR (%), CAGR(%), Cumulative) (U-Shaped Recovery)
Table 385. South Korea Waste-to-Energy (WtE) Market Forecast by CAPEX, 2021-2031 (South KoreaD Mn, AGR (%), CAGR(%), Cumulative) (L-Shaped Recovery)
Table 386. South Korea Waste-to-Energy (WtE) Market Forecast by Capacity, 2021-2031 (MTPA, AGR (%), CAGR(%), Cumulative)
Table 387. South Korea Waste-to-Energy (WtE) Market Forecast by Capacity, 2021-2031 (MTPA, AGR (%), CAGR(%), Cumulative) (V-Shaped Recovery)
Table 388. South Korea Waste-to-Energy (WtE) Market Forecast by Capacity, 2021-2031 (MTPA, AGR (%), CAGR(%), Cumulative) (W-Shaped Recovery)
Table 389. South Korea Waste-to-Energy (WtE) Market Forecast by Capacity, 2021-2031 (MTPA, AGR (%), CAGR(%), Cumulative) (U-Shaped Recovery)
Table 390. South Korea Waste-to-Energy (WtE) Market Forecast by Capacity, 2021-2031 (MTPA, AGR (%), CAGR(%), Cumulative) (L-Shaped Recovery)
Table 391. South Korea Waste-to-Energy (WtE) Market Forecast, 2021-2031 (No. of Units, AGR (%), CAGR(%), Cumulative)
Table 392. South Korea Waste-to-Energy (WtE) Market Forecast, 2021-2031 (No. of Units, AGR (%), CAGR(%), Cumulative) (V-Shaped Recovery)
Table 393. South Korea Waste-to-Energy (WtE) Market Forecast, 2021-2031 (No. of Units, AGR (%), CAGR(%), Cumulative) (W-Shaped Recovery)
Table 394. South Korea Waste-to-Energy (WtE) Market Forecast, 2021-2031 (No. of Units, AGR (%), CAGR(%), Cumulative) (U-Shaped Recovery)
Table 395. South Korea Waste-to-Energy (WtE) Market Forecast, 2021-2031 (No. of Units, AGR (%), CAGR(%), Cumulative) (L-Shaped Recovery)
Table 396. South Korea Waste-to-Energy (WtE) Market Forecast by Plant Status, 2021-2031 (Plant Units, AGR (%), CAGR(%), Cumulative)
Table 397. South Korea Waste-to-Energy (WtE) Market Forecast by Plant Status, 2021-2031 (Plant Units, AGR (%), CAGR(%), Cumulative) (V-Shaped Recovery)
Table 398. South Korea Waste-to-Energy (WtE) Market Forecast by Plant Status, 2021-2031 (Plant Units, AGR (%), CAGR(%), Cumulative) (W-Shaped Recovery)
Table 399. South Korea Waste-to-Energy (WtE) Market Forecast by Plant Status, 2021-2031 (Plant Units, AGR (%), CAGR(%), Cumulative) (U-Shaped Recovery)
Table 400. South Korea Waste-to-Energy (WtE) Market Forecast by Plant Status, 2021-2031 (Plant Units, AGR (%), CAGR(%), Cumulative) (L-Shaped Recovery)
Table 401. South Korea Waste-to-Energy (WtE) Market by Technology, 2021-2031 (MTPA, AGR (%), CAGR(%), Cumulative)
Table 402. South Korea Waste-to-Energy (WtE) Market by Technology, 2021-2031 (MTPA, AGR (%), CAGR(%), Cumulative) (V-Shaped Recovery)
Table 403. South Korea Waste-to-Energy (WtE) Market by Technology, 2021-2031 (MTPA, AGR (%), CAGR(%), Cumulative) (W-Shaped Recovery)
Table 404. South Korea Waste-to-Energy (WtE) Market by Technology, 2021-2031 (MTPA, AGR (%), CAGR(%), Cumulative) (U-Shaped Recovery)
Table 405. South Korea Waste-to-Energy (WtE) Market by Technology, 2021-2031 (MTPA, AGR (%), CAGR(%), Cumulative) (L-Shaped Recovery)
Table 406. South Korea Waste-to-Energy (WtE) Energy Generation Market by End-Use, 2021-2031 (MWe, AGR (%), CAGR(%), Cumulative)
Table 407. South Korea Waste-to-Energy (WtE) Energy Generation Market by End-Use, 2021-2031 (MWe, AGR (%), CAGR(%), Cumulative) (V-Shaped Recovery)
Table 408. South Korea Waste-to-Energy (WtE) Energy Generation Market by End-Use, 2021-2031 (MWe, AGR (%), CAGR(%), Cumulative) (W-Shaped Recovery)
Table 409. South Korea Waste-to-Energy (WtE) Energy Generation Market by End-Use, 2021-2031 (MWe, AGR (%), CAGR(%), Cumulative) (U-Shaped Recovery)
Table 410. South Korea Waste-to-Energy (WtE) Energy Generation Market by End-Use, 2021-2031 (MWe, AGR (%), CAGR(%), Cumulative) (L-Shaped Recovery)
Table 411. Rest of World Waste-to-Energy (WtE) Market Forecast by Energy Generation, 2021-2031 (MWe, AGR (%), CAGR(%), Cumulative)
Table 412. Rest of World Waste-to-Energy (WtE) Market Forecast by Energy Generation, 2021-2031 (MWe, AGR (%), CAGR(%), Cumulative) (V-Shaped Recovery)
Table 413. Rest of World Waste-to-Energy (WtE) Market Forecast by Energy Generation, 2021-2031 (MWe, AGR (%), CAGR(%), Cumulative) (W-Shaped Recovery)
Table 414. Rest of World Waste-to-Energy (WtE) Market Forecast by Energy Generation, 2021-2031 (MWe, AGR (%), CAGR(%), Cumulative) (U-Shaped Recovery)
Table 415. Rest of World Waste-to-Energy (WtE) Market Forecast by Energy Generation, 2021-2031 (MWe, AGR (%), CAGR(%), Cumulative) (L-Shaped Recovery)
Table 416. Rest of World Waste-to-Energy (WtE) Market Forecast by CAPEX, 2021-2031 (Rest of WorldD Mn, AGR (%), CAGR(%), Cumulative)
Table 417. Rest of World Waste-to-Energy (WtE) Market Forecast by CAPEX, 2021-2031 (Rest of WorldD Mn, AGR (%), CAGR(%), Cumulative) (V-Shaped Recovery)
Table 418. Rest of World Waste-to-Energy (WtE) Market Forecast by CAPEX, 2021-2031 (Rest of WorldD Mn, AGR (%), CAGR(%), Cumulative) (W-Shaped Recovery)
Table 419. Rest of World Waste-to-Energy (WtE) Market Forecast by CAPEX, 2021-2031 (Rest of WorldD Mn, AGR (%), CAGR(%), Cumulative) (U-Shaped Recovery)
Table 420. Rest of World Waste-to-Energy (WtE) Market Forecast by CAPEX, 2021-2031 (Rest of WorldD Mn, AGR (%), CAGR(%), Cumulative) (L-Shaped Recovery)
Table 421. Rest of World Waste-to-Energy (WtE) Market Forecast by Capacity, 2021-2031 (MTPA, AGR (%), CAGR(%), Cumulative)
Table 422. Rest of World Waste-to-Energy (WtE) Market Forecast by Capacity, 2021-2031 (MTPA, AGR (%), CAGR(%), Cumulative) (V-Shaped Recovery)
Table 423. Rest of World Waste-to-Energy (WtE) Market Forecast by Capacity, 2021-2031 (MTPA, AGR (%), CAGR(%), Cumulative) (W-Shaped Recovery)
Table 424. Rest of World Waste-to-Energy (WtE) Market Forecast by Capacity, 2021-2031 (MTPA, AGR (%), CAGR(%), Cumulative) (U-Shaped Recovery)
Table 425. Rest of World Waste-to-Energy (WtE) Market Forecast by Capacity, 2021-2031 (MTPA, AGR (%), CAGR(%), Cumulative) (L-Shaped Recovery)
Table 426. Rest of World Waste-to-Energy (WtE) Market Forecast, 2021-2031 (No. of Units, AGR (%), CAGR(%), Cumulative)
Table 427. Rest of World Waste-to-Energy (WtE) Market Forecast, 2021-2031 (No. of Units, AGR (%), CAGR(%), Cumulative) (V-Shaped Recovery)
Table 428. Rest of World Waste-to-Energy (WtE) Market Forecast, 2021-2031 (No. of Units, AGR (%), CAGR(%), Cumulative) (W-Shaped Recovery)
Table 429. Rest of World Waste-to-Energy (WtE) Market Forecast, 2021-2031 (No. of Units, AGR (%), CAGR(%), Cumulative) (U-Shaped Recovery)
Table 430. Rest of World Waste-to-Energy (WtE) Market Forecast, 2021-2031 (No. of Units, AGR (%), CAGR(%), Cumulative) (L-Shaped Recovery)
Table 431. Rest of World Waste-to-Energy (WtE) Market Forecast by Plant Status, 2021-2031 (Plant Units, AGR (%), CAGR(%), Cumulative)
Table 432. Rest of World Waste-to-Energy (WtE) Market Forecast by Plant Status, 2021-2031 (Plant Units, AGR (%), CAGR(%), Cumulative) (V-Shaped Recovery)
Table 433. Rest of World Waste-to-Energy (WtE) Market Forecast by Plant Status, 2021-2031 (Plant Units, AGR (%), CAGR(%), Cumulative) (W-Shaped Recovery)
Table 434. Rest of World Waste-to-Energy (WtE) Market Forecast by Plant Status, 2021-2031 (Plant Units, AGR (%), CAGR(%), Cumulative) (U-Shaped Recovery)
Table 435. Rest of World Waste-to-Energy (WtE) Market Forecast by Plant Status, 2021-2031 (Plant Units, AGR (%), CAGR(%), Cumulative) (L-Shaped Recovery)
Table 436. Rest of World Waste-to-Energy (WtE) Market by Technology, 2021-2031 (MTPA, AGR (%), CAGR(%), Cumulative)
Table 437. Rest of World Waste-to-Energy (WtE) Market by Technology, 2021-2031 (MTPA, AGR (%), CAGR(%), Cumulative) (V-Shaped Recovery)
Table 438. Rest of World Waste-to-Energy (WtE) Market by Technology, 2021-2031 (MTPA, AGR (%), CAGR(%), Cumulative) (W-Shaped Recovery)
Table 439. Rest of World Waste-to-Energy (WtE) Market by Technology, 2021-2031 (MTPA, AGR (%), CAGR(%), Cumulative) (U-Shaped Recovery)
Table 440. Rest of World Waste-to-Energy (WtE) Market by Technology, 2021-2031 (MTPA, AGR (%), CAGR(%), Cumulative) (L-Shaped Recovery)
Table 441. Rest of World Waste-to-Energy (WtE) Energy Generation Market by End-Use, 2021-2031 (MWe, AGR (%), CAGR(%), Cumulative)
Table 442. Rest of World Waste-to-Energy (WtE) Energy Generation Market by End-Use, 2021-2031 (MWe, AGR (%), CAGR(%), Cumulative) (V-Shaped Recovery)
Table 443. Rest of World Waste-to-Energy (WtE) Energy Generation Market by End-Use, 2021-2031 (MWe, AGR (%), CAGR(%), Cumulative) (W-Shaped Recovery)
Table 444. Rest of World Waste-to-Energy (WtE) Energy Generation Market by End-Use, 2021-2031 (MWe, AGR (%), CAGR(%), Cumulative) (U-Shaped Recovery)
Table 445. Rest of World Waste-to-Energy (WtE) Energy Generation Market by End-Use, 2021-2031 (MWe, AGR (%), CAGR(%), Cumulative) (L-Shaped Recovery)
Table 445. ATCO Power: Company Information
Table 446. ATCO Power: Company Revenue 2016-2020 (US$Mn, AGR %)
Table 447. ATCO Power: Company Product and Service Benchmarking
Table 448. ATCO Power: Company Recent Developments till Feb,2020
Table 449. Biffa plc : Company Information
Table 450. Biffa plc : Company Revenue 2016-2020 (US$Mn, AGR %)
Table 451. Biffa plc : Company Product and Service Benchmarking
Table 452. Biffa plc : Company Recent Developments till Feb,2020
Table 453. Babcock & Wilcox Enterprises Inc: Company Information
Table 454. Babcock & Wilcox Enterprises Inc: Company Revenue 2015-2019 (US$Mn, AGR %)
Table 455. Babcock & Wilcox Enterprises Inc: Company Product and Service Benchmarking
Table 456. Babcock & Wilcox Enterprises Inc: Company Recent Developments till Feb,2020
Table 457. Covanta Holding Corp: Company Information
Table 458. Covanta Holding Corp: Company Revenue 2016-2020(US$Mn, AGR %)
Table 459. Covanta Holding Corp: Company Product and Service Benchmarking
Table 460. Covanta Holding Corp: Company Recent Developments till Feb,2020
Table 461. FCC Environment: Company Information
Table 462. FCC Environment: Company Revenue 2016-2020(US$Mn, AGR %)
Table 463. FCC Environment: Company Product and Service Benchmarking
Table 464. FCC Environment: Company Recent Developments till Feb,2020
Table 465. Origin renewable energy: Company Information
Table 466. Origin renewable energy: Company Revenue 2016-2020 (US$Mn, AGR %)
Table 467. Origin renewable energy: Company Product and Service Benchmarking
Table 468. Origin renewable energy: Company Recent Developments till Feb,2020
Table 469. Hera SpA : Company Information
Table 470. Hera SpA : Company Revenue 2016-2020 (US$Mn, AGR %)
Table 471. Hera SpA : Company Product and Service Benchmarking
Table 472. Hera SpA : Company Recent Developments till Feb,2020
Table 473. Hitachi Zosen Corporation: Company Information
Table 474. Hitachi Zosen Corporation: Company Revenue 2016-2020 (US$Mn, AGR %)
Table 475. Hitachi Zosen Corporation: Company Product and Service Benchmarking
Table 476. Hitachi Zosen Corporation: Company Recent Developments till Feb,2020
Table 477. Mostostal Warszawa SA: Company Information
Table 478. Mostostal Warszawa SA: Company Revenue 2015-2019 (US$Mn, AGR %)
Table 479. Mostostal Warszawa SA: Company Product and Service Benchmarking
Table 480. Mostostal Warszawa SA: Company Recent Developments till Feb,2020
Table 481. Renova Energia SA: Company Information
Table 482. Renova Energia SA: Company Revenue 2015-2019 (US$Mn, AGR %)
Table 483. Renova Energia SA: Company Product and Service Benchmarking
Table 484. Renova Energia SA: Company Recent Developments till Feb,2020
Table 485. Suez SA: Company Information
Table 486. Suez SA: Company Revenue 2016-2020 (US$Mn, AGR %)
Table 487. Suez SA: Company Product and Service Benchmarking
Table 488. Suez SA: Company Recent Developments till Feb,2020
Table 489. Veolia Environnement SA: Company Information
Table 490. Veolia Environnement SA: Company Revenue 2016-2020 (US$Mn, AGR %)
Table 491. Veolia Environnement SA: Company Product and Service Benchmarking
Table 492. Veolia Environnement SA: Company Recent Developments till Feb,2020
Table 493. EBARA CORPORATION: Company Information
Table 494. EBARA CORPORATION: Company Revenue 2016-2020 (US$Mn, AGR %)
Table 495. EBARA CORPORATION: Company Product and Service Benchmarking
Table 496. EBARA CORPORATION: Company Recent Developments till Feb,2020
Table 497. Everbright Environment: Company Information
Table 499. Everbright Environment: Company Product and Service Benchmarking
Table 500. Everbright Environment: Company Recent Developments till Feb,2020
List of Figures
Figure 1. Muncipal Solid Waste Management
Figure 2. Global Waste-to-Energy (WtE) Market Forecast by Energy Generation, 2021-2031 (MWe, AGR (%), CAGR(%), Cumulative)
Figure 3. Global Waste To Energy Market Segmentation
Figure 4. Waste to Energy Cycle
Figure 5. Waste to Energy Hierarchy
Figure 6. Competing Renewable Technologies
Figure 7. Porters 5 Forces
Figure 8. Global Waste-to-Energy (WtE) Market Forecast by Energy Generation, 2021-2031 (MWe, AGR (%), CAGR(%), Cumulative)
Figure 9. Global Waste-to-Energy (WtE) Market Forecast by Energy Generation, 2021-2031 (MWe, AGR (%), CAGR(%), Cumulative) (V-Shaped Recovery)
Figure 10. Global Waste-to-Energy (WtE) Market Forecast by Energy Generation, 2021-2031 (MWe, AGR (%), CAGR(%), Cumulative) (W-Shaped Recovery) (W-Shaped Recovery)
Figure 11. Global Waste-to-Energy (WtE) Market Forecast by Energy Generation, 2021-2031 (MWe, AGR (%), CAGR(%), Cumulative) (U-Shaped Recovery)
Figure 12. Global Waste-to-Energy (WtE) Market Forecast by Energy Generation, 2021-2031 (MWe, AGR (%), CAGR(%), Cumulative) (L-Shaped Recovery)
Figure 13. Global Waste-to-Energy (WtE) Market Forecast by CAPEX, 2021-2031 (USD Mn, AGR (%),Cumulative)
Figure 14. Global Waste-to-Energy (WtE) Market Forecast by CAPEX, 2021-2031 (USD Mn, AGR (%),Cumulative) (V-Shaped Recovery)
Figure 15. Global Waste-to-Energy (WtE) Market Forecast by CAPEX, 2021-2031 (USD Mn, AGR (%),Cumulative) (W-Shaped Recovery) (W-Shaped Recovery)
Figure 16. Global Waste-to-Energy (WtE) Market Forecast by CAPEX, 2021-2031 (USD Mn, AGR (%),Cumulative) (U-Shaped Recovery)
Figure 17. Global Waste-to-Energy (WtE) Market Forecast by CAPEX, 2021-2031 (USD Mn, AGR (%), Cumulative) (L-Shaped Recovery)
Figure 18. Global Waste-to-Energy (WtE) Market Forecast by Capacity, 2021-2031 (MTPA, AGR (%),Cumulative)
Figure 19. Global Waste-to-Energy (WtE) Market Forecast by Capacity, 2021-2031 (MTPA, AGR (%),Cumulative) (V-Shaped Recovery)
Figure 20. Global Waste-to-Energy (WtE) Market Forecast by Capacity, 2021-2031 (MTPA, AGR (%),Cumulative) (W-Shaped Recovery) (W-Shaped Recovery)
Figure 21. Global Waste-to-Energy (WtE) Market Forecast by Capacity, 2021-2031 (MTPA, AGR (%),Cumulative) (U-Shaped Recovery)
Figure 22. Global Waste-to-Energy (WtE) Market Forecast by Capacity, 2021-2031 (MTPA, AGR (%), Cumulative) (L-Shaped Recovery)
Figure 23. Global Waste-to-Energy (WtE) Market Forecast, 2021-2031 (No. of Units, AGR (%),Cumulative)
Figure 24. Global Waste-to-Energy (WtE) Market Forecast, 2021-2031 (No. of Units, AGR (%),Cumulative) (V-Shaped Recovery)
Figure 25. Global Waste-to-Energy (WtE) Market Forecast, 2021-2031 (No. of Units, AGR (%),Cumulative) (W-Shaped Recovery) (W-Shaped Recovery)
Figure 26. Global Waste-to-Energy (WtE) Market Forecast, 2021-2031 (No. of Units, AGR (%),Cumulative) (U-Shaped Recovery)
Figure 27. Global Waste-to-Energy (WtE) Market Forecast, 2021-2031 (No. of Units, AGR (%), Cumulative) (L-Shaped Recovery)
Figure 28. Global Waste-to-Energy (WtE) Market Forecast by Plant Status, 2021-2031 (Plant Units, AGR (%),Cumulative)
Figure 29. Global Waste-to-Energy (WtE) Market Forecast by Plant Status, 2021-2031 (Plant Units, AGR (%),Cumulative) (V-Shaped Recovery)
Figure 30. Global Waste-to-Energy (WtE) Market Forecast by Plant Status, 2021-2031 (Plant Units, AGR (%),Cumulative) (W-Shaped Recovery) (W-Shaped Recovery)
Figure 31. Global Waste-to-Energy (WtE) Market Forecast by Plant Status, 2021-2031 (Plant Units, AGR (%),Cumulative) (U-Shaped Recovery)
Figure 32. Global Waste-to-Energy (WtE) Market Forecast by Plant Status, 2021-2031 (Plant Units, AGR (%), Cumulative) (L-Shaped Recovery)
Figure 33. Global Waste-to-Energy (WtE) Market by Technology, 2021-2031 (MTPA, AGR (%),Cumulative)
Figure 34. Global Waste-to-Energy (WtE) Market by Technology, 2021-2031 (MTPA, AGR (%),Cumulative) (V-Shaped Recovery)
Figure 35. Global Waste-to-Energy (WtE) Market by Technology, 2021-2031 (MTPA, AGR (%),Cumulative) (W-Shaped Recovery) (W-Shaped Recovery)
Figure 36. Global Waste-to-Energy (WtE) Market by Technology, 2021-2031 (MTPA, AGR (%),Cumulative) (U-Shaped Recovery)
Figure 37. Global Waste-to-Energy (WtE) Market by Technology, 2021-2031 (MTPA, AGR (%), Cumulative) (L-Shaped Recovery)
Figure 38. Global Waste-to-Energy (WtE) Energy Generation Market by End-Use, 2021-2031 (MWe, AGR (%),Cumulative)
Figure 39. Global Waste-to-Energy (WtE) Energy Generation Market by End-Use, 2021-2031 (MWe, AGR (%),Cumulative) (V-Shaped Recovery)
Figure 40. Global Waste-to-Energy (WtE) Energy Generation Market by End-Use, 2021-2031 (MWe, AGR (%),Cumulative) (W-Shaped Recovery) (W-Shaped Recovery)
Figure 41. Global Waste-to-Energy (WtE) Energy Generation Market by End-Use, 2021-2031 (MWe, AGR (%),Cumulative) (U-Shaped Recovery)
Figure 42. Global Waste-to-Energy (WtE) Energy Generation Market by End-Use, 2021-2031 (MWe, AGR (%), Cumulative) (L-Shaped Recovery)
Figure 43. Global Waste-to-Energy (WtE) Energy Generation Market by Country, 2021-2031 (MWe, AGR (%),Cumulative)
Figure 44. Global Waste-to-Energy (WtE) Energy Generation Market by Country, 2021-2031 (MWe, AGR (%),Cumulative) (V-Shaped Recovery)
Figure 45. Global Waste-to-Energy (WtE) Energy Generation Market by Country, 2021-2031 (MWe, AGR (%),Cumulative) (W-Shaped Recovery) (W-Shaped Recovery)
Figure 46. Global Waste-to-Energy (WtE) Energy Generation Market by Country, 2021-2031 (MWe, AGR (%),Cumulative) (U-Shaped Recovery)
Figure 47. Global Waste-to-Energy (WtE) Energy Generation Market by Country, 2021-2031 (MWe, AGR (%), Cumulative) (L-Shaped Recovery)
Figure 48. Global Waste-to-Energy (WtE) CAPEX Market by Country, 2021-2031 (USD Mn, AGR (%),Cumulative)
Figure 49. Global Waste-to-Energy (WtE) CAPEX Market by Country, 2021-2031 (USD Mn, AGR (%),Cumulative) (V-Shaped Recovery)
Figure 50. Global Waste-to-Energy (WtE) CAPEX Market by Country, 2021-2031 (USD Mn, AGR (%),Cumulative) (W-Shaped Recovery) (W-Shaped Recovery)
Figure 51. Global Waste-to-Energy (WtE) CAPEX Market by Country, 2021-2031 (USD Mn, AGR (%),Cumulative) (U-Shaped Recovery)
Figure 52. Global Waste-to-Energy (WtE) CAPEX Market by Country, 2021-2031 (USD Mn, AGR (%), Cumulative) (L-Shaped Recovery)
Figure 53. Global Waste-to-Energy (WtE) Capacity Market by Country, 2021-2031 (MTPA, AGR (%),Cumulative)
Figure 54. Global Waste-to-Energy (WtE) Capacity Market by Country, 2021-2031 (MTPA, AGR (%),Cumulative) (V-Shaped Recovery)
Figure 55. Global Waste-to-Energy (WtE) Capacity Market by Country, 2021-2031 (MTPA, AGR (%),Cumulative) (W-Shaped Recovery) (W-Shaped Recovery)
Figure 56. Global Waste-to-Energy (WtE) Capacity Market by Country, 2021-2031 (MTPA, AGR (%),Cumulative) (U-Shaped Recovery)
Figure 57. Global Waste-to-Energy (WtE) Capacity Market by Country, 2021-2031 (MTPA, AGR (%), Cumulative) (L-Shaped Recovery)
Figure 58. Global Waste-to-Energy (WtE) Plants Market by Country, 2021-2031 (Units, AGR (%),Cumulative)
Figure 59. Global Waste-to-Energy (WtE) Plants Market by Country, 2021-2031 (Units, AGR (%),Cumulative) (V-Shaped Recovery)
Figure 60. Global Waste-to-Energy (WtE) Plants Market by Country, 2021-2031 (Units, AGR (%),Cumulative) (W-Shaped Recovery) (W-Shaped Recovery)
Figure 61. Global Waste-to-Energy (WtE) Plants Market by Country, 2021-2031 (Units, AGR (%),Cumulative) (U-Shaped Recovery)
Figure 62. Global Waste-to-Energy (WtE) Plants Market by Country, 2021-2031 (Units, AGR (%), Cumulative) (L-Shaped Recovery)
Figure 63. US Waste-to-Energy (WtE) Market Forecast by Energy Generation, 2021-2031 (MWe, AGR (%),Cumulative)
Figure 64. US Waste-to-Energy (WtE) Market Forecast by Energy Generation, 2021-2031 (MWe, AGR (%),Cumulative) (V-Shaped Recovery)
Figure 65. US Waste-to-Energy (WtE) Market Forecast by Energy Generation, 2021-2031 (MWe, AGR (%),Cumulative) (W-Shaped Recovery) (W-Shaped Recovery)
Figure 66. US Waste-to-Energy (WtE) Market Forecast by Energy Generation, 2021-2031 (MWe, AGR (%),Cumulative) (U-Shaped Recovery)
Figure 67. US Waste-to-Energy (WtE) Market Forecast by Energy Generation, 2021-2031 (MWe, AGR (%), Cumulative) (L-Shaped Recovery)
Figure 68. US Waste-to-Energy (WtE) Market Forecast by CAPEX, 2021-2031 (USD Mn, AGR (%),Cumulative)
Figure 69. US Waste-to-Energy (WtE) Market Forecast by CAPEX, 2021-2031 (USD Mn, AGR (%),Cumulative) (V-Shaped Recovery)
Figure 70. US Waste-to-Energy (WtE) Market Forecast by CAPEX, 2021-2031 (USD Mn, AGR (%),Cumulative) (W-Shaped Recovery) (W-Shaped Recovery)
Figure 71. US Waste-to-Energy (WtE) Market Forecast by CAPEX, 2021-2031 (USD Mn, AGR (%),Cumulative) (U-Shaped Recovery)
Figure 72. US Waste-to-Energy (WtE) Market Forecast by CAPEX, 2021-2031 (USD Mn, AGR (%), Cumulative) (L-Shaped Recovery)
Figure 73. US Waste-to-Energy (WtE) Market Forecast by Capacity, 2021-2031 (MTPA, AGR (%),Cumulative)
Figure 74. US Waste-to-Energy (WtE) Market Forecast by Capacity, 2021-2031 (MTPA, AGR (%),Cumulative) (V-Shaped Recovery)
Figure 75. US Waste-to-Energy (WtE) Market Forecast by Capacity, 2021-2031 (MTPA, AGR (%),Cumulative) (W-Shaped Recovery) (W-Shaped Recovery)
Figure 76. US Waste-to-Energy (WtE) Market Forecast by Capacity, 2021-2031 (MTPA, AGR (%),Cumulative) (U-Shaped Recovery)
Figure 77. US Waste-to-Energy (WtE) Market Forecast by Capacity, 2021-2031 (MTPA, AGR (%), Cumulative) (L-Shaped Recovery)
Figure 78. US Waste-to-Energy (WtE) Market Forecast, 2021-2031 (No. of Units, AGR (%),Cumulative)
Figure 79. US Waste-to-Energy (WtE) Market Forecast, 2021-2031 (No. of Units, AGR (%),Cumulative) (V-Shaped Recovery)
Figure 80. US Waste-to-Energy (WtE) Market Forecast, 2021-2031 (No. of Units, AGR (%),Cumulative) (W-Shaped Recovery) (W-Shaped Recovery)
Figure 81. US Waste-to-Energy (WtE) Market Forecast, 2021-2031 (No. of Units, AGR (%),Cumulative) (U-Shaped Recovery)
Figure 82. US Waste-to-Energy (WtE) Market Forecast, 2021-2031 (No. of Units, AGR (%), Cumulative) (L-Shaped Recovery)
Figure 83. US Waste-to-Energy (WtE) Market Forecast by Plant Status, 2021-2031 (Plant Units, AGR (%),Cumulative)
Figure 84. US Waste-to-Energy (WtE) Market Forecast by Plant Status, 2021-2031 (Plant Units, AGR (%),Cumulative) (V-Shaped Recovery)
Figure 85. US Waste-to-Energy (WtE) Market Forecast by Plant Status, 2021-2031 (Plant Units, AGR (%),Cumulative) (W-Shaped Recovery) (W-Shaped Recovery)
Figure 86. US Waste-to-Energy (WtE) Market Forecast by Plant Status, 2021-2031 (Plant Units, AGR (%),Cumulative) (U-Shaped Recovery)
Figure 87. US Waste-to-Energy (WtE) Market Forecast by Plant Status, 2021-2031 (Plant Units, AGR (%), Cumulative) (L-Shaped Recovery)
Figure 88. US Waste-to-Energy (WtE) Market by Technology, 2021-2031 (MTPA, AGR (%),Cumulative)
Figure 89. US Waste-to-Energy (WtE) Market by Technology, 2021-2031 (MTPA, AGR (%),Cumulative) (V-Shaped Recovery)
Figure 90. US Waste-to-Energy (WtE) Market by Technology, 2021-2031 (MTPA, AGR (%),Cumulative) (W-Shaped Recovery) (W-Shaped Recovery)
Figure 91. US Waste-to-Energy (WtE) Market by Technology, 2021-2031 (MTPA, AGR (%),Cumulative) (U-Shaped Recovery)
Figure 92. US Waste-to-Energy (WtE) Market by Technology, 2021-2031 (MTPA, AGR (%), Cumulative) (L-Shaped Recovery)
Figure 93. US Waste-to-Energy (WtE) Energy Generation Market by End-Use, 2021-2031 (MWe, AGR (%),Cumulative)
Figure 94. US Waste-to-Energy (WtE) Energy Generation Market by End-Use, 2021-2031 (MWe, AGR (%),Cumulative) (V-Shaped Recovery)
Figure 95. US Waste-to-Energy (WtE) Energy Generation Market by End-Use, 2021-2031 (MWe, AGR (%),Cumulative) (W-Shaped Recovery) (W-Shaped Recovery)
Figure 96. US Waste-to-Energy (WtE) Energy Generation Market by End-Use, 2021-2031 (MWe, AGR (%),Cumulative) (U-Shaped Recovery)
Figure 97. US Waste-to-Energy (WtE) Energy Generation Market by End-Use, 2021-2031 (MWe, AGR (%), Cumulative) (L-Shaped Recovery)
Figure 98. UK Waste-to-Energy (WtE) Market Forecast by Energy Generation, 2021-2031 (MWe, AGR (%),Cumulative)
Figure 99. UK Waste-to-Energy (WtE) Market Forecast by Energy Generation, 2021-2031 (MWe, AGR (%),Cumulative) (V-Shaped Recovery)
Figure 100. UK Waste-to-Energy (WtE) Market Forecast by Energy Generation, 2021-2031 (MWe, AGR (%),Cumulative) (W-Shaped Recovery)
Figure 101. UK Waste-to-Energy (WtE) Market Forecast by Energy Generation, 2021-2031 (MWe, AGR (%),Cumulative) (U-Shaped Recovery)
Figure 102. UK Waste-to-Energy (WtE) Market Forecast by Energy Generation, 2021-2031 (MWe, AGR (%), Cumulative) (L-Shaped Recovery)
Figure 103. UK Waste-to-Energy (WtE) Market Forecast by CAPEX, 2021-2031 (UKD Mn, AGR (%),Cumulative)
Figure 104. UK Waste-to-Energy (WtE) Market Forecast by CAPEX, 2021-2031 (UKD Mn, AGR (%),Cumulative) (V-Shaped Recovery)
Figure 105. UK Waste-to-Energy (WtE) Market Forecast by CAPEX, 2021-2031 (UKD Mn, AGR (%),Cumulative) (W-Shaped Recovery)
Figure 106. UK Waste-to-Energy (WtE) Market Forecast by CAPEX, 2021-2031 (UKD Mn, AGR (%),Cumulative) (U-Shaped Recovery)
Figure 107. UK Waste-to-Energy (WtE) Market Forecast by CAPEX, 2021-2031 (UKD Mn, AGR (%), Cumulative) (L-Shaped Recovery)
Figure 108. UK Waste-to-Energy (WtE) Market Forecast by Capacity, 2021-2031 (MTPA, AGR (%),Cumulative)
Figure 109. UK Waste-to-Energy (WtE) Market Forecast by Capacity, 2021-2031 (MTPA, AGR (%),Cumulative) (V-Shaped Recovery)
Figure 110. UK Waste-to-Energy (WtE) Market Forecast by Capacity, 2021-2031 (MTPA, AGR (%),Cumulative) (W-Shaped Recovery)
Figure 111. UK Waste-to-Energy (WtE) Market Forecast by Capacity, 2021-2031 (MTPA, AGR (%),Cumulative) (U-Shaped Recovery)
Figure 112. UK Waste-to-Energy (WtE) Market Forecast by Capacity, 2021-2031 (MTPA, AGR (%), Cumulative) (L-Shaped Recovery)
Figure 113. UK Waste-to-Energy (WtE) Market Forecast, 2021-2031 (No. of Units, AGR (%),Cumulative)
Figure 114. UK Waste-to-Energy (WtE) Market Forecast, 2021-2031 (No. of Units, AGR (%),Cumulative) (V-Shaped Recovery)
Figure 115. UK Waste-to-Energy (WtE) Market Forecast, 2021-2031 (No. of Units, AGR (%),Cumulative) (W-Shaped Recovery)
Figure 116. UK Waste-to-Energy (WtE) Market Forecast, 2021-2031 (No. of Units, AGR (%),Cumulative) (U-Shaped Recovery)
Figure 117. UK Waste-to-Energy (WtE) Market Forecast, 2021-2031 (No. of Units, AGR (%), Cumulative) (L-Shaped Recovery)
Figure 118. UK Waste-to-Energy (WtE) Market Forecast by Plant Status, 2021-2031 (Plant Units, AGR (%),Cumulative)
Figure 119. UK Waste-to-Energy (WtE) Market Forecast by Plant Status, 2021-2031 (Plant Units, AGR (%),Cumulative) (V-Shaped Recovery)
Figure 120. UK Waste-to-Energy (WtE) Market Forecast by Plant Status, 2021-2031 (Plant Units, AGR (%),Cumulative) (W-Shaped Recovery)
Figure 121. UK Waste-to-Energy (WtE) Market Forecast by Plant Status, 2021-2031 (Plant Units, AGR (%),Cumulative) (U-Shaped Recovery)
Figure 122. UK Waste-to-Energy (WtE) Market Forecast by Plant Status, 2021-2031 (Plant Units, AGR (%), Cumulative) (L-Shaped Recovery)
Figure 123. UK Waste-to-Energy (WtE) Market by Technology, 2021-2031 (MTPA, AGR (%),Cumulative)
Figure 124. UK Waste-to-Energy (WtE) Market by Technology, 2021-2031 (MTPA, AGR (%),Cumulative) (V-Shaped Recovery)
Figure 125. UK Waste-to-Energy (WtE) Market by Technology, 2021-2031 (MTPA, AGR (%),Cumulative) (W-Shaped Recovery)
Figure 126. UK Waste-to-Energy (WtE) Market by Technology, 2021-2031 (MTPA, AGR (%),Cumulative) (U-Shaped Recovery)
Figure 127. UK Waste-to-Energy (WtE) Market by Technology, 2021-2031 (MTPA, AGR (%), Cumulative) (L-Shaped Recovery)
Figure 128. UK Waste-to-Energy (WtE) Energy Generation Market by End-Use, 2021-2031 (MWe, AGR (%),Cumulative)
Figure 129. UK Waste-to-Energy (WtE) Energy Generation Market by End-Use, 2021-2031 (MWe, AGR (%),Cumulative) (V-Shaped Recovery)
Figure 130. UK Waste-to-Energy (WtE) Energy Generation Market by End-Use, 2021-2031 (MWe, AGR (%),Cumulative) (W-Shaped Recovery)
Figure 131. UK Waste-to-Energy (WtE) Energy Generation Market by End-Use, 2021-2031 (MWe, AGR (%),Cumulative) (U-Shaped Recovery)
Figure 132. UK Waste-to-Energy (WtE) Energy Generation Market by End-Use, 2021-2031 (MWe, AGR (%), Cumulative) (L-Shaped Recovery)
Figure 133. Germany Waste-to-Energy (WtE) Market Forecast by Energy Generation, 2021-2031 (MWe, AGR (%),Cumulative)
Figure 134. Germany Waste-to-Energy (WtE) Market Forecast by Energy Generation, 2021-2031 (MWe, AGR (%),Cumulative) (V-Shaped Recovery)
Figure 135. Germany Waste-to-Energy (WtE) Market Forecast by Energy Generation, 2021-2031 (MWe, AGR (%),Cumulative) (W-Shaped Recovery)
Figure 136. Germany Waste-to-Energy (WtE) Market Forecast by Energy Generation, 2021-2031 (MWe, AGR (%),Cumulative) (U-Shaped Recovery)
Figure 137. Germany Waste-to-Energy (WtE) Market Forecast by Energy Generation, 2021-2031 (MWe, AGR (%), Cumulative) (L-Shaped Recovery)
Figure 138. Germany Waste-to-Energy (WtE) Market Forecast by CAPEX, 2021-2031 (GermanyD Mn, AGR (%),Cumulative)
Figure 139. Germany Waste-to-Energy (WtE) Market Forecast by CAPEX, 2021-2031 (GermanyD Mn, AGR (%),Cumulative) (V-Shaped Recovery)
Figure 140. Germany Waste-to-Energy (WtE) Market Forecast by CAPEX, 2021-2031 (GermanyD Mn, AGR (%),Cumulative) (W-Shaped Recovery)
Figure 141. Germany Waste-to-Energy (WtE) Market Forecast by CAPEX, 2021-2031 (GermanyD Mn, AGR (%),Cumulative) (U-Shaped Recovery)
Figure 142. Germany Waste-to-Energy (WtE) Market Forecast by CAPEX, 2021-2031 (GermanyD Mn, AGR (%), Cumulative) (L-Shaped Recovery)
Figure 143. Germany Waste-to-Energy (WtE) Market Forecast by Capacity, 2021-2031 (MTPA, AGR (%),Cumulative)
Figure 144. Germany Waste-to-Energy (WtE) Market Forecast by Capacity, 2021-2031 (MTPA, AGR (%),Cumulative) (V-Shaped Recovery)
Figure 145. Germany Waste-to-Energy (WtE) Market Forecast by Capacity, 2021-2031 (MTPA, AGR (%),Cumulative) (W-Shaped Recovery)
Figure 146. Germany Waste-to-Energy (WtE) Market Forecast by Capacity, 2021-2031 (MTPA, AGR (%),Cumulative) (U-Shaped Recovery)
Figure 147. Germany Waste-to-Energy (WtE) Market Forecast by Capacity, 2021-2031 (MTPA, AGR (%), Cumulative) (L-Shaped Recovery)
Figure 148. Germany Waste-to-Energy (WtE) Market Forecast, 2021-2031 (No. of Units, AGR (%),Cumulative)
Figure 149. Germany Waste-to-Energy (WtE) Market Forecast, 2021-2031 (No. of Units, AGR (%),Cumulative) (V-Shaped Recovery)
Figure 150. Germany Waste-to-Energy (WtE) Market Forecast, 2021-2031 (No. of Units, AGR (%),Cumulative) (W-Shaped Recovery)
Figure 151. Germany Waste-to-Energy (WtE) Market Forecast, 2021-2031 (No. of Units, AGR (%),Cumulative) (U-Shaped Recovery)
Figure 152. Germany Waste-to-Energy (WtE) Market Forecast, 2021-2031 (No. of Units, AGR (%), Cumulative) (L-Shaped Recovery)
Figure 153. Germany Waste-to-Energy (WtE) Market Forecast by Plant Status, 2021-2031 (Plant Units, AGR (%),Cumulative)
Figure 154. Germany Waste-to-Energy (WtE) Market Forecast by Plant Status, 2021-2031 (Plant Units, AGR (%),Cumulative) (V-Shaped Recovery)
Figure 155. Germany Waste-to-Energy (WtE) Market Forecast by Plant Status, 2021-2031 (Plant Units, AGR (%),Cumulative) (W-Shaped Recovery)
Figure 156. Germany Waste-to-Energy (WtE) Market Forecast by Plant Status, 2021-2031 (Plant Units, AGR (%),Cumulative) (U-Shaped Recovery)
Figure 157. Germany Waste-to-Energy (WtE) Market Forecast by Plant Status, 2021-2031 (Plant Units, AGR (%), Cumulative) (L-Shaped Recovery)
Figure 158. Germany Waste-to-Energy (WtE) Market by Technology, 2021-2031 (MTPA, AGR (%),Cumulative)
Figure 159. Germany Waste-to-Energy (WtE) Market by Technology, 2021-2031 (MTPA, AGR (%),Cumulative) (V-Shaped Recovery)
Figure 160. Germany Waste-to-Energy (WtE) Market by Technology, 2021-2031 (MTPA, AGR (%),Cumulative) (W-Shaped Recovery)
Figure 161. Germany Waste-to-Energy (WtE) Market by Technology, 2021-2031 (MTPA, AGR (%),Cumulative) (U-Shaped Recovery)
Figure 162. Germany Waste-to-Energy (WtE) Market by Technology, 2021-2031 (MTPA, AGR (%), Cumulative) (L-Shaped Recovery)
Figure 163. Germany Waste-to-Energy (WtE) Energy Generation Market by End-Use, 2021-2031 (MWe, AGR (%),Cumulative)
Figure 164. Germany Waste-to-Energy (WtE) Energy Generation Market by End-Use, 2021-2031 (MWe, AGR (%),Cumulative) (V-Shaped Recovery)
Figure 165. Germany Waste-to-Energy (WtE) Energy Generation Market by End-Use, 2021-2031 (MWe, AGR (%),Cumulative) (W-Shaped Recovery)
Figure 166. Germany Waste-to-Energy (WtE) Energy Generation Market by End-Use, 2021-2031 (MWe, AGR (%),Cumulative) (U-Shaped Recovery)
Figure 167. Germany Waste-to-Energy (WtE) Energy Generation Market by End-Use, 2021-2031 (MWe, AGR (%), Cumulative) (L-Shaped Recovery)
Figure 168. France Waste-to-Energy (WtE) Market Forecast by Energy Generation, 2021-2031 (MWe, AGR (%),Cumulative)
Figure 169. France Waste-to-Energy (WtE) Market Forecast by Energy Generation, 2021-2031 (MWe, AGR (%),Cumulative) (V-Shaped Recovery)
Figure 170. France Waste-to-Energy (WtE) Market Forecast by Energy Generation, 2021-2031 (MWe, AGR (%),Cumulative) (W-Shaped Recovery)
Figure 171. France Waste-to-Energy (WtE) Market Forecast by Energy Generation, 2021-2031 (MWe, AGR (%),Cumulative) (U-Shaped Recovery)
Figure 172. France Waste-to-Energy (WtE) Market Forecast by Energy Generation, 2021-2031 (MWe, AGR (%), Cumulative) (L-Shaped Recovery)
Figure 173. France Waste-to-Energy (WtE) Market Forecast by CAPEX, 2021-2031 (FranceD Mn, AGR (%),Cumulative)
Figure 174. France Waste-to-Energy (WtE) Market Forecast by CAPEX, 2021-2031 (FranceD Mn, AGR (%),Cumulative) (V-Shaped Recovery)
Figure 175. France Waste-to-Energy (WtE) Market Forecast by CAPEX, 2021-2031 (FranceD Mn, AGR (%),Cumulative) (W-Shaped Recovery)
Figure 176. France Waste-to-Energy (WtE) Market Forecast by CAPEX, 2021-2031 (FranceD Mn, AGR (%),Cumulative) (U-Shaped Recovery)
Figure 177. France Waste-to-Energy (WtE) Market Forecast by CAPEX, 2021-2031 (FranceD Mn, AGR (%), Cumulative) (L-Shaped Recovery)
Figure 178. France Waste-to-Energy (WtE) Market Forecast by Capacity, 2021-2031 (MTPA, AGR (%),Cumulative)
Figure 179. France Waste-to-Energy (WtE) Market Forecast by Capacity, 2021-2031 (MTPA, AGR (%),Cumulative) (V-Shaped Recovery)
Figure 180. France Waste-to-Energy (WtE) Market Forecast by Capacity, 2021-2031 (MTPA, AGR (%),Cumulative) (W-Shaped Recovery)
Figure 181. France Waste-to-Energy (WtE) Market Forecast by Capacity, 2021-2031 (MTPA, AGR (%),Cumulative) (U-Shaped Recovery)
Figure 182. France Waste-to-Energy (WtE) Market Forecast by Capacity, 2021-2031 (MTPA, AGR (%), Cumulative) (L-Shaped Recovery)
Figure 183. France Waste-to-Energy (WtE) Market Forecast, 2021-2031 (No. of Units, AGR (%),Cumulative)
Figure 184. France Waste-to-Energy (WtE) Market Forecast, 2021-2031 (No. of Units, AGR (%),Cumulative) (V-Shaped Recovery)
Figure 185. France Waste-to-Energy (WtE) Market Forecast, 2021-2031 (No. of Units, AGR (%),Cumulative) (W-Shaped Recovery)
Figure 186. France Waste-to-Energy (WtE) Market Forecast, 2021-2031 (No. of Units, AGR (%),Cumulative) (U-Shaped Recovery)
Figure 187. France Waste-to-Energy (WtE) Market Forecast, 2021-2031 (No. of Units, AGR (%), Cumulative) (L-Shaped Recovery)
Figure 188. France Waste-to-Energy (WtE) Market Forecast by Plant Status, 2021-2031 (Plant Units, AGR (%),Cumulative)
Figure 189. France Waste-to-Energy (WtE) Market Forecast by Plant Status, 2021-2031 (Plant Units, AGR (%),Cumulative) (V-Shaped Recovery)
Figure 190. France Waste-to-Energy (WtE) Market Forecast by Plant Status, 2021-2031 (Plant Units, AGR (%),Cumulative) (W-Shaped Recovery)
Figure 191. France Waste-to-Energy (WtE) Market Forecast by Plant Status, 2021-2031 (Plant Units, AGR (%),Cumulative) (U-Shaped Recovery)
Figure 192. France Waste-to-Energy (WtE) Market Forecast by Plant Status, 2021-2031 (Plant Units, AGR (%), Cumulative) (L-Shaped Recovery)
Figure 193. France Waste-to-Energy (WtE) Market by Technology, 2021-2031 (MTPA, AGR (%),Cumulative)
Figure 194. France Waste-to-Energy (WtE) Market by Technology, 2021-2031 (MTPA, AGR (%),Cumulative) (V-Shaped Recovery)
Figure 195. France Waste-to-Energy (WtE) Market by Technology, 2021-2031 (MTPA, AGR (%),Cumulative) (W-Shaped Recovery)
Figure 196. France Waste-to-Energy (WtE) Market by Technology, 2021-2031 (MTPA, AGR (%),Cumulative) (U-Shaped Recovery)
Figure 197. France Waste-to-Energy (WtE) Market by Technology, 2021-2031 (MTPA, AGR (%), Cumulative) (L-Shaped Recovery)
Figure 198. France Waste-to-Energy (WtE) Energy Generation Market by End-Use, 2021-2031 (MWe, AGR (%),Cumulative)
Figure 199. France Waste-to-Energy (WtE) Energy Generation Market by End-Use, 2021-2031 (MWe, AGR (%),Cumulative) (V-Shaped Recovery)
Figure 200. France Waste-to-Energy (WtE) Energy Generation Market by End-Use, 2021-2031 (MWe, AGR (%),Cumulative) (W-Shaped Recovery)
Figure 201. France Waste-to-Energy (WtE) Energy Generation Market by End-Use, 2021-2031 (MWe, AGR (%),Cumulative) (U-Shaped Recovery)
Figure 202. France Waste-to-Energy (WtE) Energy Generation Market by End-Use, 2021-2031 (MWe, AGR (%), Cumulative) (L-Shaped Recovery)
Figure 203. Switzerland Waste-to-Energy (WtE) Market Forecast by Energy Generation, 2021-2031 (MWe, AGR (%),Cumulative)
Figure 204. Switzerland Waste-to-Energy (WtE) Market Forecast by Energy Generation, 2021-2031 (MWe, AGR (%),Cumulative) (V-Shaped Recovery)
Figure 205. Switzerland Waste-to-Energy (WtE) Market Forecast by Energy Generation, 2021-2031 (MWe, AGR (%),Cumulative) (W-Shaped Recovery)
Figure 206. Switzerland Waste-to-Energy (WtE) Market Forecast by Energy Generation, 2021-2031 (MWe, AGR (%),Cumulative) (U-Shaped Recovery)
Figure 207. Switzerland Waste-to-Energy (WtE) Market Forecast by Energy Generation, 2021-2031 (MWe, AGR (%), Cumulative) (L-Shaped Recovery)
Figure 208. Switzerland Waste-to-Energy (WtE) Market Forecast by CAPEX, 2021-2031 (SwitzerlandD Mn, AGR (%),Cumulative)
Figure 209. Switzerland Waste-to-Energy (WtE) Market Forecast by CAPEX, 2021-2031 (SwitzerlandD Mn, AGR (%),Cumulative) (V-Shaped Recovery)
Figure 210. Switzerland Waste-to-Energy (WtE) Market Forecast by CAPEX, 2021-2031 (SwitzerlandD Mn, AGR (%),Cumulative) (W-Shaped Recovery)
Figure 211. Switzerland Waste-to-Energy (WtE) Market Forecast by CAPEX, 2021-2031 (SwitzerlandD Mn, AGR (%),Cumulative) (U-Shaped Recovery)
Figure 212. Switzerland Waste-to-Energy (WtE) Market Forecast by CAPEX, 2021-2031 (SwitzerlandD Mn, AGR (%), Cumulative) (L-Shaped Recovery)
Figure 213. Switzerland Waste-to-Energy (WtE) Market Forecast by Capacity, 2021-2031 (MTPA, AGR (%),Cumulative)
Figure 214. Switzerland Waste-to-Energy (WtE) Market Forecast by Capacity, 2021-2031 (MTPA, AGR (%),Cumulative) (V-Shaped Recovery)
Figure 215. Switzerland Waste-to-Energy (WtE) Market Forecast by Capacity, 2021-2031 (MTPA, AGR (%),Cumulative) (W-Shaped Recovery)
Figure 216. Switzerland Waste-to-Energy (WtE) Market Forecast by Capacity, 2021-2031 (MTPA, AGR (%),Cumulative) (U-Shaped Recovery)
Figure 217. Switzerland Waste-to-Energy (WtE) Market Forecast by Capacity, 2021-2031 (MTPA, AGR (%), Cumulative) (L-Shaped Recovery)
Figure 218. Switzerland Waste-to-Energy (WtE) Market Forecast, 2021-2031 (No. of Units, AGR (%),Cumulative)
Figure 219. Switzerland Waste-to-Energy (WtE) Market Forecast, 2021-2031 (No. of Units, AGR (%), CAGR(%), Cumulative) (V-Shaped Recovery)
Figure 220. Switzerland Waste-to-Energy (WtE) Market Forecast, 2021-2031 (No. of Units, AGR (%),Cumulative) (V-Shaped Recovery)
Figure 221. Switzerland Waste-to-Energy (WtE) Market Forecast, 2021-2031 (No. of Units, AGR (%),Cumulative) (W-Shaped Recovery)
Figure 222. Switzerland Waste-to-Energy (WtE) Market Forecast, 2021-2031 (No. of Units, AGR (%),Cumulative) (U-Shaped Recovery)
Figure 223. Switzerland Waste-to-Energy (WtE) Market Forecast, 2021-2031 (No. of Units, AGR (%), Cumulative) (L-Shaped Recovery)
Figure 224. Switzerland Waste-to-Energy (WtE) Market Forecast by Plant Status, 2021-2031 (Plant Units, AGR (%),Cumulative)
Figure 225. Switzerland Waste-to-Energy (WtE) Market Forecast by Plant Status, 2021-2031 (Plant Units, AGR (%),Cumulative) (V-Shaped Recovery)
Figure 226. Switzerland Waste-to-Energy (WtE) Market Forecast by Plant Status, 2021-2031 (Plant Units, AGR (%),Cumulative) (W-Shaped Recovery)
Figure 227. Switzerland Waste-to-Energy (WtE) Market Forecast by Plant Status, 2021-2031 (Plant Units, AGR (%),Cumulative) (U-Shaped Recovery)
Figure 228. Switzerland Waste-to-Energy (WtE) Market Forecast by Plant Status, 2021-2031 (Plant Units, AGR (%), Cumulative) (L-Shaped Recovery)
Figure 229. Switzerland Waste-to-Energy (WtE) Market by Technology, 2021-2031 (MTPA, AGR (%),Cumulative)
Figure 230. Switzerland Waste-to-Energy (WtE) Market by Technology, 2021-2031 (MTPA, AGR (%),Cumulative) (V-Shaped Recovery)
Figure 231. Switzerland Waste-to-Energy (WtE) Market by Technology, 2021-2031 (MTPA, AGR (%),Cumulative) (W-Shaped Recovery)
Figure 232. Switzerland Waste-to-Energy (WtE) Market by Technology, 2021-2031 (MTPA, AGR (%),Cumulative) (U-Shaped Recovery)
Figure 233. Switzerland Waste-to-Energy (WtE) Market by Technology, 2021-2031 (MTPA, AGR (%), Cumulative) (L-Shaped Recovery)
Figure 234. Switzerland Waste-to-Energy (WtE) Energy Generation Market by End-Use, 2021-2031 (MWe, AGR (%),Cumulative)
Figure 235. Switzerland Waste-to-Energy (WtE) Energy Generation Market by End-Use, 2021-2031 (MWe, AGR (%),Cumulative) (V-Shaped Recovery)
Figure 236. Switzerland Waste-to-Energy (WtE) Energy Generation Market by End-Use, 2021-2031 (MWe, AGR (%),Cumulative) (W-Shaped Recovery)
Figure 237. Switzerland Waste-to-Energy (WtE) Energy Generation Market by End-Use, 2021-2031 (MWe, AGR (%),Cumulative) (U-Shaped Recovery)
Figure 238. Switzerland Waste-to-Energy (WtE) Energy Generation Market by End-Use, 2021-2031 (MWe, AGR (%), Cumulative) (L-Shaped Recovery)
Figure 239. China Waste-to-Energy (WtE) Market Forecast by Energy Generation, 2021-2031 (MWe, AGR (%),Cumulative)
Figure 240. China Waste-to-Energy (WtE) Market Forecast by Energy Generation, 2021-2031 (MWe, AGR (%),Cumulative) (V-Shaped Recovery)
Figure 241. China Waste-to-Energy (WtE) Market Forecast by Energy Generation, 2021-2031 (MWe, AGR (%),Cumulative) (W-Shaped Recovery)
Figure 242. China Waste-to-Energy (WtE) Market Forecast by Energy Generation, 2021-2031 (MWe, AGR (%),Cumulative) (U-Shaped Recovery)
Figure 243. China Waste-to-Energy (WtE) Market Forecast by Energy Generation, 2021-2031 (MWe, AGR (%), Cumulative) (L-Shaped Recovery)
Figure 244. China Waste-to-Energy (WtE) Market Forecast by CAPEX, 2021-2031 (ChinaD Mn, AGR (%),Cumulative)
Figure 245. China Waste-to-Energy (WtE) Market Forecast by CAPEX, 2021-2031 (ChinaD Mn, AGR (%),Cumulative) (V-Shaped Recovery)
Figure 246. China Waste-to-Energy (WtE) Market Forecast by CAPEX, 2021-2031 (ChinaD Mn, AGR (%),Cumulative) (W-Shaped Recovery)
Figure 247. China Waste-to-Energy (WtE) Market Forecast by CAPEX, 2021-2031 (ChinaD Mn, AGR (%),Cumulative) (U-Shaped Recovery)
Figure 248. China Waste-to-Energy (WtE) Market Forecast by CAPEX, 2021-2031 (ChinaD Mn, AGR (%), Cumulative) (L-Shaped Recovery)
Figure 249. China Waste-to-Energy (WtE) Market Forecast by Capacity, 2021-2031 (MTPA, AGR (%),Cumulative)
Figure 250. China Waste-to-Energy (WtE) Market Forecast by Capacity, 2021-2031 (MTPA, AGR (%),Cumulative) (V-Shaped Recovery)
Figure 251. China Waste-to-Energy (WtE) Market Forecast by Capacity, 2021-2031 (MTPA, AGR (%),Cumulative) (W-Shaped Recovery)
Figure 252. China Waste-to-Energy (WtE) Market Forecast by Capacity, 2021-2031 (MTPA, AGR (%),Cumulative) (U-Shaped Recovery)
Figure 253. China Waste-to-Energy (WtE) Market Forecast by Capacity, 2021-2031 (MTPA, AGR (%), Cumulative) (L-Shaped Recovery)
Figure 254. China Waste-to-Energy (WtE) Market Forecast, 2021-2031 (No. of Units, AGR (%),Cumulative)
Figure 255. China Waste-to-Energy (WtE) Market Forecast, 2021-2031 (No. of Units, AGR (%),Cumulative) (V-Shaped Recovery)
Figure 256. China Waste-to-Energy (WtE) Market Forecast, 2021-2031 (No. of Units, AGR (%),Cumulative) (W-Shaped Recovery)
Figure 257. China Waste-to-Energy (WtE) Market Forecast, 2021-2031 (No. of Units, AGR (%),Cumulative) (U-Shaped Recovery)
Figure 258. China Waste-to-Energy (WtE) Market Forecast, 2021-2031 (No. of Units, AGR (%), Cumulative) (L-Shaped Recovery)
Figure 259. China Waste-to-Energy (WtE) Market Forecast by Plant Status, 2021-2031 (Plant Units, AGR (%),Cumulative)
Figure 260. China Waste-to-Energy (WtE) Market Forecast by Plant Status, 2021-2031 (Plant Units, AGR (%),Cumulative) (V-Shaped Recovery)
Figure 261. China Waste-to-Energy (WtE) Market Forecast by Plant Status, 2021-2031 (Plant Units, AGR (%),Cumulative) (W-Shaped Recovery)
Figure 262. China Waste-to-Energy (WtE) Market Forecast by Plant Status, 2021-2031 (Plant Units, AGR (%),Cumulative) (U-Shaped Recovery)
Figure 263. China Waste-to-Energy (WtE) Market Forecast by Plant Status, 2021-2031 (Plant Units, AGR (%), Cumulative) (L-Shaped Recovery)
Figure 264. China Waste-to-Energy (WtE) Market by Technology, 2021-2031 (MTPA, AGR (%),Cumulative)
Figure 265. China Waste-to-Energy (WtE) Market by Technology, 2021-2031 (MTPA, AGR (%),Cumulative) (V-Shaped Recovery)
Figure 266. China Waste-to-Energy (WtE) Market by Technology, 2021-2031 (MTPA, AGR (%),Cumulative) (W-Shaped Recovery)
Figure 267. China Waste-to-Energy (WtE) Market by Technology, 2021-2031 (MTPA, AGR (%),Cumulative) (U-Shaped Recovery)
Figure 268. China Waste-to-Energy (WtE) Market by Technology, 2021-2031 (MTPA, AGR (%), Cumulative) (L-Shaped Recovery)
Figure 269. China Waste-to-Energy (WtE) Energy Generation Market by End-Use, 2021-2031 (MWe, AGR (%),Cumulative)
Figure 270. China Waste-to-Energy (WtE) Energy Generation Market by End-Use, 2021-2031 (MWe, AGR (%),Cumulative) (V-Shaped Recovery)
Figure 271. China Waste-to-Energy (WtE) Energy Generation Market by End-Use, 2021-2031 (MWe, AGR (%),Cumulative) (W-Shaped Recovery)
Figure 272. China Waste-to-Energy (WtE) Energy Generation Market by End-Use, 2021-2031 (MWe, AGR (%),Cumulative) (U-Shaped Recovery)
Figure 273. China Waste-to-Energy (WtE) Energy Generation Market by End-Use, 2021-2031 (MWe, AGR (%), Cumulative) (L-Shaped Recovery)
Figure 274. Japan Waste-to-Energy (WtE) Market Forecast by Energy Generation, 2021-2031 (MWe, AGR (%), CAGR(%), Cumulative)
Figure 275. Japan Waste-to-Energy (WtE) Market Forecast by Energy Generation, 2021-2031 (MWe, AGR (%), CAGR(%), Cumulative) (V-Shaped Recovery)
Figure 276. Japan Waste-to-Energy (WtE) Market Forecast by Energy Generation, 2021-2031 (MWe, AGR (%), CAGR(%), Cumulative) (W-Shaped Recovery)
Figure 277. Japan Waste-to-Energy (WtE) Market Forecast by Energy Generation, 2021-2031 (MWe, AGR (%), CAGR(%), Cumulative) (U-Shaped Recovery)
Figure 278. Japan Waste-to-Energy (WtE) Market Forecast by Energy Generation, 2021-2031 (MWe, AGR (%), CAGR(%), Cumulative) (L-Shaped Recovery)
Figure 279. Japan Waste-to-Energy (WtE) Market Forecast by CAPEX, 2021-2031 (JapanD Mn, AGR (%),Cumulative)
Figure 280. Japan Waste-to-Energy (WtE) Market Forecast by CAPEX, 2021-2031 (JapanD Mn, AGR (%),Cumulative) (V-Shaped Recovery)
Figure 281. Japan Waste-to-Energy (WtE) Market Forecast by CAPEX, 2021-2031 (JapanD Mn, AGR (%),Cumulative) (W-Shaped Recovery)
Figure 282. Japan Waste-to-Energy (WtE) Market Forecast by CAPEX, 2021-2031 (JapanD Mn, AGR (%),Cumulative) (U-Shaped Recovery)
Figure 283. Japan Waste-to-Energy (WtE) Market Forecast by CAPEX, 2021-2031 (JapanD Mn, AGR (%), Cumulative) (L-Shaped Recovery)
Figure 284. Japan Waste-to-Energy (WtE) Market Forecast by Capacity, 2021-2031 (MTPA, AGR (%),Cumulative)
Figure 285. Japan Waste-to-Energy (WtE) Market Forecast by Capacity, 2021-2031 (MTPA, AGR (%),Cumulative) (V-Shaped Recovery)
Figure 286. Japan Waste-to-Energy (WtE) Market Forecast by Capacity, 2021-2031 (MTPA, AGR (%),Cumulative) (W-Shaped Recovery)
Figure 287. Japan Waste-to-Energy (WtE) Market Forecast by Capacity, 2021-2031 (MTPA, AGR (%),Cumulative) (U-Shaped Recovery)
Figure 288. Japan Waste-to-Energy (WtE) Market Forecast by Capacity, 2021-2031 (MTPA, AGR (%), Cumulative) (L-Shaped Recovery)
Figure 289. Japan Waste-to-Energy (WtE) Market Forecast, 2021-2031 (No. of Units, AGR (%),Cumulative)
Figure 290. Japan Waste-to-Energy (WtE) Market Forecast, 2021-2031 (No. of Units, AGR (%),Cumulative) (V-Shaped Recovery)
Figure 291. Japan Waste-to-Energy (WtE) Market Forecast, 2021-2031 (No. of Units, AGR (%),Cumulative) (W-Shaped Recovery)
Figure 292. Japan Waste-to-Energy (WtE) Market Forecast, 2021-2031 (No. of Units, AGR (%),Cumulative) (U-Shaped Recovery)
Figure 293. Japan Waste-to-Energy (WtE) Market Forecast, 2021-2031 (No. of Units, AGR (%), Cumulative) (L-Shaped Recovery)
Figure 294. Japan Waste-to-Energy (WtE) Market Forecast by Plant Status, 2021-2031 (Plant Units, AGR (%),Cumulative)
Figure 295. Japan Waste-to-Energy (WtE) Market Forecast by Plant Status, 2021-2031 (Plant Units, AGR (%),Cumulative) (W-Shaped Recovery)
Figure 296. Japan Waste-to-Energy (WtE) Market Forecast by Plant Status, 2021-2031 (Plant Units, AGR (%),Cumulative) (U-Shaped Recovery)
Figure 297. Japan Waste-to-Energy (WtE) Market Forecast by Plant Status, 2021-2031 (Plant Units, AGR (%), Cumulative) (L-Shaped Recovery)
Figure 298. Japan Waste-to-Energy (WtE) Market by Technology, 2021-2031 (MTPA, AGR (%),Cumulative)
Figure 299. Japan Waste-to-Energy (WtE) Market by Technology, 2021-2031 (MTPA, AGR (%),Cumulative) (V-Shaped Recovery)
Figure 300. Japan Waste-to-Energy (WtE) Market by Technology, 2021-2031 (MTPA, AGR (%),Cumulative) (W-Shaped Recovery)
Figure 301. Japan Waste-to-Energy (WtE) Market by Technology, 2021-2031 (MTPA, AGR (%),Cumulative) (U-Shaped Recovery)
Figure 302. Japan Waste-to-Energy (WtE) Market by Technology, 2021-2031 (MTPA, AGR (%), Cumulative) (L-Shaped Recovery)
Figure 303. Japan Waste-to-Energy (WtE) Energy Generation Market by End-Use, 2021-2031 (MWe, AGR (%),Cumulative)
Figure 304. Japan Waste-to-Energy (WtE) Energy Generation Market by End-Use, 2021-2031 (MWe, AGR (%),Cumulative) (V-Shaped Recovery)
Figure 305. Japan Waste-to-Energy (WtE) Energy Generation Market by End-Use, 2021-2031 (MWe, AGR (%),Cumulative) (W-Shaped Recovery)
Figure 306. Japan Waste-to-Energy (WtE) Energy Generation Market by End-Use, 2021-2031 (MWe, AGR (%),Cumulative) (U-Shaped Recovery)
Figure 307. Japan Waste-to-Energy (WtE) Energy Generation Market by End-Use, 2021-2031 (MWe, AGR (%), Cumulative) (L-Shaped Recovery)
Figure 308. India Waste-to-Energy (WtE) Market Forecast by Energy Generation, 2021-2031 (MWe, AGR (%),Cumulative)
Figure 309. India Waste-to-Energy (WtE) Market Forecast by Energy Generation, 2021-2031 (MWe, AGR (%),Cumulative) (V-Shaped Recovery)
Figure 310. India Waste-to-Energy (WtE) Market Forecast by Energy Generation, 2021-2031 (MWe, AGR (%),Cumulative) (W-Shaped Recovery)
Figure 311. India Waste-to-Energy (WtE) Market Forecast by Energy Generation, 2021-2031 (MWe, AGR (%),Cumulative) (U-Shaped Recovery)
Figure 312. India Waste-to-Energy (WtE) Market Forecast by Energy Generation, 2021-2031 (MWe, AGR (%), Cumulative) (L-Shaped Recovery)
Figure 313. India Waste-to-Energy (WtE) Market Forecast by CAPEX, 2021-2031 (IndiaD Mn, AGR (%),Cumulative)
Figure 314. India Waste-to-Energy (WtE) Market Forecast by CAPEX, 2021-2031 (IndiaD Mn, AGR (%),Cumulative) (V-Shaped Recovery)
Figure 315. India Waste-to-Energy (WtE) Market Forecast by CAPEX, 2021-2031 (IndiaD Mn, AGR (%),Cumulative) (W-Shaped Recovery)
Figure 316. India Waste-to-Energy (WtE) Market Forecast by CAPEX, 2021-2031 (IndiaD Mn, AGR (%),Cumulative) (U-Shaped Recovery)
Figure 317. India Waste-to-Energy (WtE) Market Forecast by CAPEX, 2021-2031 (IndiaD Mn, AGR (%), Cumulative) (L-Shaped Recovery)
Figure 318. India Waste-to-Energy (WtE) Market Forecast by Capacity, 2021-2031 (MTPA, AGR (%),Cumulative)
Figure 319. India Waste-to-Energy (WtE) Market Forecast by Capacity, 2021-2031 (MTPA, AGR (%),Cumulative) (V-Shaped Recovery)
Figure 320. India Waste-to-Energy (WtE) Market Forecast by Capacity, 2021-2031 (MTPA, AGR (%),Cumulative) (W-Shaped Recovery)
Figure 321. India Waste-to-Energy (WtE) Market Forecast by Capacity, 2021-2031 (MTPA, AGR (%),Cumulative) (U-Shaped Recovery)
Figure 322. India Waste-to-Energy (WtE) Market Forecast by Capacity, 2021-2031 (MTPA, AGR (%), Cumulative) (L-Shaped Recovery)
Figure 323. India Waste-to-Energy (WtE) Market Forecast, 2021-2031 (No. of Units, AGR (%),Cumulative)
Figure 324. India Waste-to-Energy (WtE) Market Forecast, 2021-2031 (No. of Units, AGR (%),Cumulative) (V-Shaped Recovery)
Figure 325. India Waste-to-Energy (WtE) Market Forecast, 2021-2031 (No. of Units, AGR (%),Cumulative) (W-Shaped Recovery)
Figure 326. India Waste-to-Energy (WtE) Market Forecast, 2021-2031 (No. of Units, AGR (%),Cumulative) (U-Shaped Recovery)
Figure 327. India Waste-to-Energy (WtE) Market Forecast, 2021-2031 (No. of Units, AGR (%), Cumulative) (L-Shaped Recovery)
Figure 328. India Waste-to-Energy (WtE) Market Forecast by Plant Status, 2021-2031 (Plant Units, AGR (%),Cumulative)
Figure 329. India Waste-to-Energy (WtE) Market Forecast by Plant Status, 2021-2031 (Plant Units, AGR (%),Cumulative) (V-Shaped Recovery)
Figure 330. India Waste-to-Energy (WtE) Market Forecast by Plant Status, 2021-2031 (Plant Units, AGR (%),Cumulative) (W-Shaped Recovery)
Figure 331. India Waste-to-Energy (WtE) Market Forecast by Plant Status, 2021-2031 (Plant Units, AGR (%),Cumulative) (U-Shaped Recovery)
Figure 332. India Waste-to-Energy (WtE) Market Forecast by Plant Status, 2021-2031 (Plant Units, AGR (%), Cumulative) (L-Shaped Recovery)
Figure 333. India Waste-to-Energy (WtE) Market by Technology, 2021-2031 (MTPA, AGR (%),Cumulative)
Figure 334. India Waste-to-Energy (WtE) Market by Technology, 2021-2031 (MTPA, AGR (%),Cumulative) (V-Shaped Recovery)
Figure 335. India Waste-to-Energy (WtE) Market by Technology, 2021-2031 (MTPA, AGR (%),Cumulative) (W-Shaped Recovery)
Figure 336. India Waste-to-Energy (WtE) Market by Technology, 2021-2031 (MTPA, AGR (%),Cumulative) (U-Shaped Recovery)
Figure 337. India Waste-to-Energy (WtE) Market by Technology, 2021-2031 (MTPA, AGR (%), Cumulative) (L-Shaped Recovery)
Figure 338. India Waste-to-Energy (WtE) Energy Generation Market by End-Use, 2021-2031 (MWe, AGR (%), CAGR(%), Cumulative)
Figure 339. India Waste-to-Energy (WtE) Energy Generation Market by End-Use, 2021-2031 (MWe, AGR (%), CAGR(%), Cumulative) (V-Shaped Recovery)
Figure 340. India Waste-to-Energy (WtE) Energy Generation Market by End-Use, 2021-2031 (MWe, AGR (%), CAGR(%), Cumulative) (W-Shaped Recovery)
Figure 341. India Waste-to-Energy (WtE) Energy Generation Market by End-Use, 2021-2031 (MWe, AGR (%), CAGR(%), Cumulative) (U-Shaped Recovery)
Figure 342. India Waste-to-Energy (WtE) Energy Generation Market by End-Use, 2021-2031 (MWe, AGR (%), CAGR(%), Cumulative) (L-Shaped Recovery)
Figure 343. Singapore Waste-to-Energy (WtE) Market Forecast by Energy Generation, 2021-2031 (MWe, AGR (%),Cumulative)
Figure 344. Singapore Waste-to-Energy (WtE) Market Forecast by Energy Generation, 2021-2031 (MWe, AGR (%),Cumulative) (V-Shaped Recovery)
Figure 345. Singapore Waste-to-Energy (WtE) Market Forecast by Energy Generation, 2021-2031 (MWe, AGR (%),Cumulative) (W-Shaped Recovery)
Figure 346. Singapore Waste-to-Energy (WtE) Market Forecast by Energy Generation, 2021-2031 (MWe, AGR (%),Cumulative) (U-Shaped Recovery)
Figure 347. Singapore Waste-to-Energy (WtE) Market Forecast by Energy Generation, 2021-2031 (MWe, AGR (%), Cumulative) (L-Shaped Recovery)
Figure 348. Singapore Waste-to-Energy (WtE) Market Forecast by CAPEX, 2021-2031 (SingaporeD Mn, AGR (%),Cumulative)
Figure 349. Singapore Waste-to-Energy (WtE) Market Forecast by CAPEX, 2021-2031 (SingaporeD Mn, AGR (%),Cumulative) (V-Shaped Recovery)
Figure 350. Singapore Waste-to-Energy (WtE) Market Forecast by CAPEX, 2021-2031 (SingaporeD Mn, AGR (%),Cumulative) (W-Shaped Recovery)
Figure 351. Singapore Waste-to-Energy (WtE) Market Forecast by CAPEX, 2021-2031 (SingaporeD Mn, AGR (%),Cumulative) (U-Shaped Recovery)
Figure 352. Singapore Waste-to-Energy (WtE) Market Forecast by CAPEX, 2021-2031 (SingaporeD Mn, AGR (%), Cumulative) (L-Shaped Recovery)
Figure 353. Singapore Waste-to-Energy (WtE) Market Forecast by Capacity, 2021-2031 (MTPA, AGR (%),Cumulative)
Figure 354. Singapore Waste-to-Energy (WtE) Market Forecast by Capacity, 2021-2031 (MTPA, AGR (%),Cumulative) (V-Shaped Recovery)
Figure 355. Singapore Waste-to-Energy (WtE) Market Forecast by Capacity, 2021-2031 (MTPA, AGR (%),Cumulative) (W-Shaped Recovery)
Figure 356. Singapore Waste-to-Energy (WtE) Market Forecast by Capacity, 2021-2031 (MTPA, AGR (%),Cumulative) (U-Shaped Recovery)
Figure 357. Singapore Waste-to-Energy (WtE) Market Forecast by Capacity, 2021-2031 (MTPA, AGR (%), Cumulative) (L-Shaped Recovery)
Figure 358. Singapore Waste-to-Energy (WtE) Market Forecast, 2021-2031 (No. of Units, AGR (%),Cumulative)
Figure 359. Singapore Waste-to-Energy (WtE) Market Forecast, 2021-2031 (No. of Units, AGR (%),Cumulative) (V-Shaped Recovery)
Figure 360. Singapore Waste-to-Energy (WtE) Market Forecast, 2021-2031 (No. of Units, AGR (%),Cumulative) (W-Shaped Recovery)
Figure 361. Singapore Waste-to-Energy (WtE) Market Forecast, 2021-2031 (No. of Units, AGR (%),Cumulative) (U-Shaped Recovery)
Figure 362. Singapore Waste-to-Energy (WtE) Market Forecast, 2021-2031 (No. of Units, AGR (%), Cumulative) (L-Shaped Recovery)
Figure 363. Singapore Waste-to-Energy (WtE) Market Forecast by Plant Status, 2021-2031 (Plant Units, AGR (%),Cumulative)
Figure 364. Singapore Waste-to-Energy (WtE) Market Forecast by Plant Status, 2021-2031 (Plant Units, AGR (%),Cumulative) (V-Shaped Recovery)
Figure 365. Singapore Waste-to-Energy (WtE) Market Forecast by Plant Status, 2021-2031 (Plant Units, AGR (%),Cumulative) (W-Shaped Recovery)
Figure 366. Singapore Waste-to-Energy (WtE) Market Forecast by Plant Status, 2021-2031 (Plant Units, AGR (%),Cumulative) (U-Shaped Recovery)
Figure 367. Singapore Waste-to-Energy (WtE) Market Forecast by Plant Status, 2021-2031 (Plant Units, AGR (%), Cumulative) (L-Shaped Recovery)
Figure 368. Singapore Waste-to-Energy (WtE) Market by Technology, 2021-2031 (MTPA, AGR (%),Cumulative)
Figure 369. Singapore Waste-to-Energy (WtE) Market by Technology, 2021-2031 (MTPA, AGR (%),Cumulative) (V-Shaped Recovery)
Figure 370. Singapore Waste-to-Energy (WtE) Market by Technology, 2021-2031 (MTPA, AGR (%),Cumulative) (W-Shaped Recovery)
Figure 371. Singapore Waste-to-Energy (WtE) Market by Technology, 2021-2031 (MTPA, AGR (%),Cumulative) (U-Shaped Recovery)
Figure 372. Singapore Waste-to-Energy (WtE) Market by Technology, 2021-2031 (MTPA, AGR (%), Cumulative) (L-Shaped Recovery)
Figure 373. Singapore Waste-to-Energy (WtE) Energy Generation Market by End-Use, 2021-2031 (MWe, AGR (%),Cumulative)
Figure 374. Singapore Waste-to-Energy (WtE) Energy Generation Market by End-Use, 2021-2031 (MWe, AGR (%),Cumulative) (V-Shaped Recovery)
Figure 375. Singapore Waste-to-Energy (WtE) Energy Generation Market by End-Use, 2021-2031 (MWe, AGR (%),Cumulative) (W-Shaped Recovery)
Figure 376. Singapore Waste-to-Energy (WtE) Energy Generation Market by End-Use, 2021-2031 (MWe, AGR (%),Cumulative) (U-Shaped Recovery)
Figure 377. Singapore Waste-to-Energy (WtE) Energy Generation Market by End-Use, 2021-2031 (MWe, AGR (%), Cumulative) (L-Shaped Recovery)
Figure 378. South Korea Waste-to-Energy (WtE) Market Forecast by Energy Generation, 2021-2031 (MWe, AGR (%),Cumulative)
Figure 379. South Korea Waste-to-Energy (WtE) Market Forecast by Energy Generation, 2021-2031 (MWe, AGR (%),Cumulative) (V-Shaped Recovery)
Figure 380. South Korea Waste-to-Energy (WtE) Market Forecast by Energy Generation, 2021-2031 (MWe, AGR (%),Cumulative) (W-Shaped Recovery)
Figure 381. South Korea Waste-to-Energy (WtE) Market Forecast by Energy Generation, 2021-2031 (MWe, AGR (%),Cumulative) (U-Shaped Recovery)
Figure 382. South Korea Waste-to-Energy (WtE) Market Forecast by Energy Generation, 2021-2031 (MWe, AGR (%), Cumulative) (L-Shaped Recovery)
Figure 383. South Korea Waste-to-Energy (WtE) Market Forecast by CAPEX, 2021-2031 (South KoreaD Mn, AGR (%),Cumulative)
Figure 384. South Korea Waste-to-Energy (WtE) Market Forecast by CAPEX, 2021-2031 (South KoreaD Mn, AGR (%),Cumulative) (V-Shaped Recovery)
Figure 385. South Korea Waste-to-Energy (WtE) Market Forecast by CAPEX, 2021-2031 (South KoreaD Mn, AGR (%),Cumulative) (W-Shaped Recovery)
Figure 386. South Korea Waste-to-Energy (WtE) Market Forecast by CAPEX, 2021-2031 (South KoreaD Mn, AGR (%),Cumulative) (U-Shaped Recovery)
Figure 387. South Korea Waste-to-Energy (WtE) Market Forecast by CAPEX, 2021-2031 (South KoreaD Mn, AGR (%), Cumulative) (L-Shaped Recovery)
Figure 388. South Korea Waste-to-Energy (WtE) Market Forecast by Capacity, 2021-2031 (MTPA, AGR (%),Cumulative)
Figure 389. South Korea Waste-to-Energy (WtE) Market Forecast by Capacity, 2021-2031 (MTPA, AGR (%),Cumulative) (V-Shaped Recovery)
Figure 390. South Korea Waste-to-Energy (WtE) Market Forecast by Capacity, 2021-2031 (MTPA, AGR (%),Cumulative) (W-Shaped Recovery)
Figure 391. South Korea Waste-to-Energy (WtE) Market Forecast by Capacity, 2021-2031 (MTPA, AGR (%),Cumulative) (U-Shaped Recovery)
Figure 392. South Korea Waste-to-Energy (WtE) Market Forecast by Capacity, 2021-2031 (MTPA, AGR (%), Cumulative) (L-Shaped Recovery)
Figure 393. South Korea Waste-to-Energy (WtE) Market Forecast, 2021-2031 (No. of Units, AGR (%),Cumulative)
Figure 394. South Korea Waste-to-Energy (WtE) Market Forecast, 2021-2031 (No. of Units, AGR (%),Cumulative) (V-Shaped Recovery)
Figure 395. South Korea Waste-to-Energy (WtE) Market Forecast, 2021-2031 (No. of Units, AGR (%),Cumulative) (W-Shaped Recovery)
Figure 396. South Korea Waste-to-Energy (WtE) Market Forecast, 2021-2031 (No. of Units, AGR (%),Cumulative) (U-Shaped Recovery)
Figure 397. South Korea Waste-to-Energy (WtE) Market Forecast, 2021-2031 (No. of Units, AGR (%), Cumulative) (L-Shaped Recovery)
Figure 398. South Korea Waste-to-Energy (WtE) Market Forecast by Plant Status, 2021-2031 (Plant Units, AGR (%),Cumulative)
Figure 399. South Korea Waste-to-Energy (WtE) Market Forecast by Plant Status, 2021-2031 (Plant Units, AGR (%),Cumulative) (V-Shaped Recovery)
Figure 400. South Korea Waste-to-Energy (WtE) Market Forecast by Plant Status, 2021-2031 (Plant Units, AGR (%),Cumulative) (W-Shaped Recovery)
Figure 401. South Korea Waste-to-Energy (WtE) Market Forecast by Plant Status, 2021-2031 (Plant Units, AGR (%),Cumulative) (U-Shaped Recovery)
Figure 402. South Korea Waste-to-Energy (WtE) Market Forecast by Plant Status, 2021-2031 (Plant Units, AGR (%), Cumulative) (L-Shaped Recovery)
Figure 403. South Korea Waste-to-Energy (WtE) Market by Technology, 2021-2031 (MTPA, AGR (%),Cumulative)
Figure 404. South Korea Waste-to-Energy (WtE) Market by Technology, 2021-2031 (MTPA, AGR (%),Cumulative) (V-Shaped Recovery)
Figure 405. South Korea Waste-to-Energy (WtE) Market by Technology, 2021-2031 (MTPA, AGR (%),Cumulative) (W-Shaped Recovery)
Figure 406. South Korea Waste-to-Energy (WtE) Market by Technology, 2021-2031 (MTPA, AGR (%),Cumulative) (U-Shaped Recovery)
Figure 407. South Korea Waste-to-Energy (WtE) Market by Technology, 2021-2031 (MTPA, AGR (%), Cumulative) (L-Shaped Recovery)
Figure 408. South Korea Waste-to-Energy (WtE) Energy Generation Market by End-Use, 2021-2031 (MWe, AGR (%), CAGR(%), Cumulative)
Figure 409. South Korea Waste-to-Energy (WtE) Energy Generation Market by End-Use, 2021-2031 (MWe, AGR (%), CAGR(%), Cumulative) (V-Shaped Recovery)
Figure 410. South Korea Waste-to-Energy (WtE) Energy Generation Market by End-Use, 2021-2031 (MWe, AGR (%), CAGR(%), Cumulative) (W-Shaped Recovery)
Figure 411. South Korea Waste-to-Energy (WtE) Energy Generation Market by End-Use, 2021-2031 (MWe, AGR (%), CAGR(%), Cumulative) (U-Shaped Recovery)
Figure 412. South Korea Waste-to-Energy (WtE) Energy Generation Market by End-Use, 2021-2031 (MWe, AGR (%), CAGR(%), Cumulative) (L-Shaped Recovery)
Figure 413. Rest of World Waste-to-Energy (WtE) Market Forecast by Energy Generation, 2021-2031 (MWe, AGR (%),Cumulative)
Figure 414. Rest of World Waste-to-Energy (WtE) Market Forecast by Energy Generation, 2021-2031 (MWe, AGR (%),Cumulative) (V-Shaped Recovery)
Figure 415. Rest of World Waste-to-Energy (WtE) Market Forecast by Energy Generation, 2021-2031 (MWe, AGR (%),Cumulative) (W-Shaped Recovery)
Figure 416. Rest of World Waste-to-Energy (WtE) Market Forecast by Energy Generation, 2021-2031 (MWe, AGR (%),Cumulative) (U-Shaped Recovery)
Figure 417. Rest of World Waste-to-Energy (WtE) Market Forecast by Energy Generation, 2021-2031 (MWe, AGR (%), Cumulative) (L-Shaped Recovery)
Figure 418. Rest of World Waste-to-Energy (WtE) Market Forecast by CAPEX, 2021-2031 (Rest of WorldD Mn, AGR (%),Cumulative)
Figure 419. Rest of World Waste-to-Energy (WtE) Market Forecast by CAPEX, 2021-2031 (Rest of WorldD Mn, AGR (%),Cumulative) (V-Shaped Recovery)
Figure 420. Rest of World Waste-to-Energy (WtE) Market Forecast by CAPEX, 2021-2031 (Rest of WorldD Mn, AGR (%),Cumulative) (W-Shaped Recovery)
Figure 421. Rest of World Waste-to-Energy (WtE) Market Forecast by CAPEX, 2021-2031 (Rest of WorldD Mn, AGR (%),Cumulative) (U-Shaped Recovery)
Figure 422. Rest of World Waste-to-Energy (WtE) Market Forecast by CAPEX, 2021-2031 (Rest of WorldD Mn, AGR (%), Cumulative) (L-Shaped Recovery)
Figure 423. Rest of World Waste-to-Energy (WtE) Market Forecast by Capacity, 2021-2031 (MTPA, AGR (%),Cumulative)
Figure 424. Rest of World Waste-to-Energy (WtE) Market Forecast by Capacity, 2021-2031 (MTPA, AGR (%),Cumulative) (V-Shaped Recovery)
Figure 425. Rest of World Waste-to-Energy (WtE) Market Forecast by Capacity, 2021-2031 (MTPA, AGR (%),Cumulative) (W-Shaped Recovery)
Figure 426. Rest of World Waste-to-Energy (WtE) Market Forecast by Capacity, 2021-2031 (MTPA, AGR (%),Cumulative) (U-Shaped Recovery)
Figure 427. Rest of World Waste-to-Energy (WtE) Market Forecast by Capacity, 2021-2031 (MTPA, AGR (%), Cumulative) (L-Shaped Recovery)
Figure 428. Rest of World Waste-to-Energy (WtE) Market Forecast, 2021-2031 (No. of Units, AGR (%),Cumulative)
Figure 429. Rest of World Waste-to-Energy (WtE) Market Forecast, 2021-2031 (No. of Units, AGR (%),Cumulative) (V-Shaped Recovery)
Figure 430. Rest of World Waste-to-Energy (WtE) Market Forecast, 2021-2031 (No. of Units, AGR (%),Cumulative) (W-Shaped Recovery)
Figure 431. Rest of World Waste-to-Energy (WtE) Market Forecast, 2021-2031 (No. of Units, AGR (%),Cumulative) (U-Shaped Recovery)
Figure 432. Rest of World Waste-to-Energy (WtE) Market Forecast, 2021-2031 (No. of Units, AGR (%), Cumulative) (L-Shaped Recovery)
Figure 433. Rest of World Waste-to-Energy (WtE) Market Forecast by Plant Status, 2021-2031 (Plant Units, AGR (%),Cumulative)
Figure 434. Rest of World Waste-to-Energy (WtE) Market Forecast by Plant Status, 2021-2031 (Plant Units, AGR (%),Cumulative) (V-Shaped Recovery)
Figure 435. Rest of World Waste-to-Energy (WtE) Market Forecast by Plant Status, 2021-2031 (Plant Units, AGR (%),Cumulative) (W-Shaped Recovery)
Figure 436. Rest of World Waste-to-Energy (WtE) Market Forecast by Plant Status, 2021-2031 (Plant Units, AGR (%),Cumulative) (U-Shaped Recovery)
Figure 437. Rest of World Waste-to-Energy (WtE) Market Forecast by Plant Status, 2021-2031 (Plant Units, AGR (%), Cumulative) (L-Shaped Recovery)
Figure 438. Rest of World Waste-to-Energy (WtE) Market by Technology, 2021-2031 (MTPA, AGR (%),Cumulative)
Figure 439. Rest of World Waste-to-Energy (WtE) Market by Technology, 2021-2031 (MTPA, AGR (%),Cumulative) (V-Shaped Recovery)
Figure 440. Rest of World Waste-to-Energy (WtE) Market by Technology, 2021-2031 (MTPA, AGR (%),Cumulative) (W-Shaped Recovery)
Figure 441. Rest of World Waste-to-Energy (WtE) Market by Technology, 2021-2031 (MTPA, AGR (%),Cumulative) (U-Shaped Recovery)
Figure 442. Rest of World Waste-to-Energy (WtE) Market by Technology, 2021-2031 (MTPA, AGR (%), Cumulative) (L-Shaped Recovery)
Figure 443. Rest of World Waste-to-Energy (WtE) Energy Generation Market by End-Use, 2021-2031 (MWe, AGR (%),Cumulative)
Figure 444. Rest of World Waste-to-Energy (WtE) Energy Generation Market by End-Use, 2021-2031 (MWe, AGR (%),Cumulative) (V-Shaped Recovery)
Figure 445. Rest of World Waste-to-Energy (WtE) Energy Generation Market by End-Use, 2021-2031 (MWe, AGR (%),Cumulative) (W-Shaped Recovery)
Figure 446. Rest of World Waste-to-Energy (WtE) Energy Generation Market by End-Use, 2021-2031 (MWe, AGR (%),Cumulative) (U-Shaped Recovery)
Figure 447. Rest of World Waste-to-Energy (WtE) Energy Generation Market by End-Use, 2021-2031 (MWe, AGR (%), Cumulative) (L-Shaped Recovery)
Figure 448. ATCO Power: Company Revenue 2016-2020 (US$Mn, AGR %)
Figure 449. ATCO Power: Company Operating Income 2016-2020 (US$Mn, AGR %)
Figure 450. ATCO Power: Company Net Income 2016-2020 (US$Mn, AGR %)
Figure 451. ATCO Power: Company EBITDA 2016-2020 (US$Mn, AGR %)
Figure 452. Biffa plc : Company Revenue 2016-2020 (US$Mn, AGR %)
Figure 453. Biffa plc : Company Operating Income 2016-2020 (US$Mn, AGR %)
Figure 454. Biffa plc : Company Net Income 2016-2020 (US$Mn, AGR %)
Figure 455. Biffa plc : Company EBITDA 2016-2020 (US$Mn, AGR %)
Figure 456. Babcock & Wilcox Enterprises Inc: Company Revenue 2015-2019 (US$Mn, AGR %)
Figure 457. Babcock & Wilcox Enterprises Inc: Company Operating Income 2015-2019 (US$Mn, AGR %)
Figure 458. Babcock & Wilcox Enterprises Inc: Company Net Income 2015-2019 (US$Mn, AGR %)
Figure 459. Babcock & Wilcox Enterprises Inc: Company EBITDA 2015-2019 (US$Mn, AGR %)
Figure 460. Covanta Holding Corp: Company Revenue 2016-2020(US$Mn, AGR %)
Figure 461. Covanta Holding Corp: Company Operating Income 2016-2020 (US$Mn, AGR %)
Figure 462. Covanta Holding Corp: Company Net Income 2016-2020(US$Mn, AGR %)
Figure 463. Covanta Holding Corp: Company EBITDA 2016-2020(US$Mn, AGR %)
Figure 464. FCC Environment: Company Revenue 2016-2020(US$Mn, AGR %)
Figure 465. FCC Environment: Company Operating Income 2016-2020(US$Mn, AGR %)
Figure 466. FCC Environment: Company Net Income 2016-2020(US$Mn, AGR %)
Figure 467. FCC Environment: Company EBITDA 2016-2020(US$Mn, AGR %)
Figure 468. Origin renewable energy: Company Revenue 2016-2020 (US$Mn, AGR %)
Figure 469. Origin renewable energy: Company Operating Income 2016-2020 (US$Mn, AGR %)
Figure 470. Origin renewable energy: Company Net Income 2016-2020 (US$Mn, AGR %)
Figure 471. Origin renewable energy: Company EBITDA 2016-2020 (US$Mn, AGR %)
Figure 472. Hera SpA : Company Revenue 2016-2020 (US$Mn, AGR %)
Figure 473. Hera SpA : Company Operating Income 2016-2020 (US$Mn, AGR %)
Figure 474. Hera SpA : Company Net Income 2016-2020 (US$Mn, AGR %)
Figure 475. Hera SpA : Company EBITDA 2016-2020 (US$Mn, AGR %)
Figure 476. Hitachi Zosen Corporation: Company Revenue 2016-2020 (US$Mn, AGR %)
Figure 477. Hitachi Zosen Corporation: Company Operating Income 2016-2020 (US$Mn, AGR %)
Figure 478. Hitachi Zosen Corporation: Company Net Income 2016-2020 (US$Mn, AGR %)
Figure 479. Hitachi Zosen Corporation: Company EBITDA 2016-2020 (US$Mn, AGR %)
Figure 480. Mostostal Warszawa SA: Company Revenue 2015-2019 (US$Mn, AGR %)
Figure 481. Mostostal Warszawa SA: Company Operating Income 2015-2019 (US$Mn, AGR %)
Figure 482. Mostostal Warszawa SA: Company Net Income 2015-2019 (US$Mn, AGR %)
Figure 483. Mostostal Warszawa SA: Company EBITDA 2015-2019 (US$Mn, AGR %)
Figure 484. Renova Energia SA: Company Revenue 2015-2019 (US$Mn, AGR %)
Figure 485. Renova Energia SA: Company Operating Income 2015-2019 (US$Mn, AGR %)
Figure 486. Renova Energia SA: Company Net Income 2015-2019 (US$Mn, AGR %)
Figure 487. Renova Energia SA: Company EBITDA 2015-2019 (US$Mn, AGR %)
Figure 488. Suez SA: Company Revenue 2016-2020 (US$Mn, AGR %)
Figure 489. Suez SA: Company Operating Income 2016-2020 (US$Mn, AGR %)
Figure 490. Suez SA: Company Net Income 2016-2020 (US$Mn, AGR %)
Figure 491. Suez SA: Company EBITDA 2016-2020 (US$Mn, AGR %)
Figure 492. Veolia Environnement SA: Company Revenue 2016-2020 (US$Mn, AGR %)
Figure 493. Veolia Environnement SA: Company Operating Income 2016-2020 (US$Mn, AGR %)
Figure 494. Veolia Environnement SA: Company Net Income 2016-2020 (US$Mn, AGR %)
Figure 495. Veolia Environnement SA: Company EBITDA 2016-2020 (US$Mn, AGR %)
Figure 496. EBARA CORPORATION: Company Revenue 2016-2020 (US$Mn, AGR %)
Figure 497. EBARA CORPORATION: Company Operating Income 2016-2020 (US$Mn, AGR %)
Figure 498. EBARA CORPORATION: Company Net Income 2016-2020 (US$Mn, AGR %)
Figure 499. EBARA CORPORATION: Company EBITDA 2016-2020 (US$Mn, AGR %)
Figure 500. Everbright Environment: Company Revenue 2016-2020 (US$Mn, AGR %)
Figure 501. Everbright Environment: Company Operating Income 2016-2020 (US$Mn, AGR %)
Figure 502. Everbright Environment: Company Net Income 2016-2020 (US$Mn, AGR %)
Figure 503. Everbright Environment: Company EBITDA 2016-2020 (US$Mn, AGR %)
ATCO Power
Babcock & Wilcox Enterprises
Biffa plc
China Everbright Environment Group Ltd.
Covanta Holding Corporation
EBARA Corporation
Fomento de Construcciones y Contratas SA (FCC)
Hera SpA
Hitachi Zosen Corp
Mostostal Warszawa SA
Origin Energy Limited
Renova Energia SA
Suez SA
Veolia Environnement SA
List of Other Companies Mentioned in the report
Acea Group
ACWA Power
Aem Cremona
Air Products
AISA IMPIANTI
AmeyCespa
An Hui Wenergy
Aurium Capital
Azienda Autonoma Municipale Pubblici Servizi
B&W Vølund A/S
Bee’ah
Beijing Municipal Government
Biffa
Bioenergy Infrastructure Group (BIG)
Bioessence
Bodens Energi
Bollnäs Energi AB
Borås Energi Miljo
Borlänge Energi
Borui Green Energy
Bouygues Energies & Services
Brianza Energia Ambiente
Broadcrown
Cadence Enviropower
CAGT Engineering
CECEP
Cemex
Changshu Pufa Thermoelectricity
Chant Group
Chengdu Xingrong Renewable Energy
China Boqi
China Everbright
China Power New Energy
Chinook Urban Mining
CISC
Cixi Zhongke Zhongmao
Clean Association of Tokyo 23
CoGen
Consorzio Recuperi Energetici
Cory Environmental
Covanta
Coventry & Solihull Waste Dsiposal Company
Dalian TEDA Environmental Protection
Datong Fuqiao Waste Incineration Electricity
Devon Waste Management
Doosan
Drenl
Dundee Energy Recycling
Ebara
Eco Center
EDF
Ekokem
Ekokem Group (Sakab)
Eksjö Energi
Enviroparks Operations
EON
Equitix
Ethiopian Electric Power Corporation
Euro Energy Group
Falascaia
FCC Environment
Ferrero
Fiberight
Finspang
Fortum Carlisle Ltd
Fortum Keilaniemi
GCL-Poly
Gent Fairhead
Grandblue Environment
Grontmij
Grundon
Hangzhou Jinjiang Group
Helios Energy Investments
Hem
Herambiente
Hfab
Hitachi Zosen Inova
Hunan Junxin Environmental Protection
Indaver
International Electric Power
Iren
Jersey Transport and Technical Services
Jingjiang
Jönköping Energi
K3CHP
Kara/NOVEREN
Karlskoga Energi
Karlstad Energi
KIC Odpapdy
Kils Energi
Kingmoor Park Properties Ltd
Kotka Energia
Lahti Energy
Landskrona Energi AB
LECH
Lidköping
Ljungby Energi
Lomellina e Energia
Marcegaglia Energy
Martin GmbH
MCC
MES Environmental
MHIEC
Minamikawachi Environmental Partnership Secretariat
Mizuda Group
Mostostal Warszawa
Multifuel Energy
MVV Environment
Network Rail
New Earth Energy
Ningbo Beilun II
NLWA
North Beck Energy Ltd
Nybro Energi
Öresundskraft AB
Origin Renewable Energy
Osaka City Hall
Oulun Energia
Peel Environmental
PGNiG Termika
PHG Energy
Posco E&C
Pražské služby
Premier Aggregates
ProNatura
Quadrifoglio
Rabbit Group
Ramboll
Rank Progress
REA Dalmine
Reform Energy
Renova
Resource Recovery Solutions
Sako
Savini
Scarborough Power
Scarlino Energia
Se. Ver. A. SPA
Shenzhen Energy
Shore Energy
Shougang Corporation
SITA Sembcorp
Skövde Värmeverk AB
Socotec
Söder Energi
Sound Environmental Resources
State Communal Enterprise Koktem
Steinmuller Babcock Environment
Suez Environmental
Sundsvall Energi
Sysav
Tai'an Zhongke Environment
Tammervoima Oy
Taqa
Tata
Tekniska Verken
Termizo
TIRU
Turku Energia
Uddevalla Energi
Umeå Energi
VafabMiljö
Vantaan Energia
Västervik
Vattenfall
Veolia
Viridor
Waste Gas Technology UK
Weiming
Wheelabrator
Zakland Utylizacyjny
Zevo
ZhongDe
Organistaions Mentioned
Akita City
An Bord Pleanala (Irish Planning Board)
Atlantic County Utilities Authority (ACUA)
Dan Municipal Sanitation Association/Nesher
Dubai Municipality
Hisashi Kennan Environment Union
Inagawa Upstream Garbage Treatment Facilities Union
Kasugai City
Kawasaki City Hall
Kitakata Union
Kodaira Murayama Yamato Sanitation Union
Middlesbrough Council
NHS Trust
North London Waste Authority
Sennan Cleaning Office Union
Shida Office Union
Southern Yue Cleaning Union
Stockholm Town
Teeside University
Warsaw City
West Akikawa Sanitation Union
Download sample pages
Complete the form below to download your free sample pages for Waste to Energy (WtE) Market Report 2021-2031Related reports
-
Bio-LPG Market Report 2021-2031
Our new study lets you assess forecasted sales at the overall world market and regional level. See financial results, trends,...Full DetailsPublished: 06 August 2021 -

Water and Wastewater Treatment Equipment Market Report 2019-2029
The Water and Wastewater Treatment Equipment Market was valued at $31.15 billion in 2018 and is expected to grow at...
Full DetailsPublished: 01 January 1970 -
The Plastic-to-Fuel Technologies Market Forecast 2020-2030
Plastics-to-fuel technologies complement plastics recycling by converting non-recycled plastics into valuable products. Plastics-to-fuel technologies offer the opportunity to reduce greenhouse...
Full DetailsPublished: 23 January 2020 -

Polymer Market for Waste Management Industry Report 2019-2029
The global polymer market for waste management was valued at $3.9 billion in 2018. Polymer is extensively being found in...
Full DetailsPublished: 01 January 1970 -
Tire Derived Fuel (TDF) Market Report 2022-2032
Tire-derived fuels are in demand from end-use sectors such as cement, paper & pulp, and a variety of others due...Full DetailsPublished: 22 April 2022 -

Global Waste Heat Boiler Market Report 2019-2029
It has been anticipated that a considerable number of product launches, product developments, mergers, and acquisitions will occur in the...
Full DetailsPublished: 01 January 1970 -
Energy Harvesting Systems Market Report 2021-2031
Vibration, displacement, and mechanical sources (including biomechanical and electrostatic) comprise the most diverse and the most potent of all energy...Full DetailsPublished: 13 April 2021 -
Compressed Air Energy Storage (CAES) Market Report 2021-2031
CAES provides a wide range of advantages for energy storage in a wide range of applications. Energy savings, increased air...Full DetailsPublished: 06 September 2021 -

Top 20 Nuclear Waste Management Companies 2019
The study reveals where and how leading companies are investing in the nuclear waste management market.
...Full DetailsPublished: 19 March 2019 -

Hydrogen Energy Storage Market Report 2022-2032
The global hydrogen energy storage market was valued at US$14,587 million in 2021 and is projected to grow at a...Full DetailsPublished: 30 August 2022
Download sample pages
Complete the form below to download your free sample pages for Waste to Energy (WtE) Market Report 2021-2031Do you have any custom requirements we can help you with?
Any specific country, geo region, market segment or specific company information?
Email us today, we can discuss your needs and see how we can help: jamie.roberts@visiongain.com
Would you like a free report overview of the report of your choice?
If so, please drop an email to Jamie Roberts stating your chosen report title to jamie.roberts@visiongain.com
Visiongain energy reports are compiled using a broad and rich mixture of both primary and secondary information to produce an overall industry outlook. In order to provide our clients with the best product possible product, we do not rely on any one single source of information. Visiongain analysts reach out to market-leading vendors and industry experts where possible but also review a wealth of financial data and product information from a vast range of sources. To find out more about our reports methodology, please email jamie.roberts@visiongain.com
Would you like to get the latest Visiongain energy reports catalogue?
What are the dynamic growth sectors? where are the regional business opportunities?
Which technologies will prevail and who are the leading companies succeeding in these sectors and why?
If you want definitive answers to business critical questions, discover Visiongain’s full range of business intelligence reports.
If so, please email Jamie Roberts on jamie.roberts@visiongain.com or call her today on +44 207 336 6100
“The Visiongain report was extremely insightful and helped us construct our basic go-to market strategy for our solution.”
H.
“F.B has used Visiongain to prepare two separate market studies on the ceramic proppants market over the last 12 months. These reports have been professionally researched and written and have assisted FBX greatly in developing its business strategy and investment plans.”
F.B
“We just received your very interesting report on the Energy Storage Technologies (EST) Market and this is a very impressive and useful document on that subject.”
I.E.N
“Visiongain does an outstanding job on putting the reports together and provides valuable insight at the right informative level for our needs. The EOR Visiongain report provided confirmation and market outlook data for EOR in MENA with the leading countries being Oman, Kuwait and eventually Saudi Arabia.”
E.S
“Visiongain produced a comprehensive, well-structured GTL Market report striking a good balance between scope and detail, global and local perspective, large and small industry segments. It is an informative forecast, useful for practitioners as a trusted and upto-date reference.”
Y.N Ltd
Association of Dutch Suppliers in the Oil & Gas Industry
Society of Naval Architects & Marine Engineers
Association of Diving Contractors
Association of Diving Contractors International
Associazione Imprese Subacquee Italiane
Australian Petroleum Production & Exploration Association
Brazilian Association of Offshore Support Companies
Brazilian Petroleum Institute
Canadian Energy Pipeline
Diving Medical Advisory Committee
European Diving Technology Committee
French Oil and Gas Industry Council
IMarEST – Institute of Marine Engineering, Science & Technology
International Association of Drilling Contractors
International Association of Geophysical Contractors
International Association of Oil & Gas Producers
International Chamber of Shipping
International Shipping Federation
International Marine Contractors Association
International Tanker Owners Pollution Federation
Leading Oil & Gas Industry Competitiveness
Maritime Energy Association
National Ocean Industries Association
Netherlands Oil and Gas Exploration and Production Association
NOF Energy
Norsk olje og gass Norwegian Oil and Gas Association
Offshore Contractors’ Association
Offshore Mechanical Handling Equipment Committee
Oil & Gas UK
Oil Companies International Marine Forum
Ontario Petroleum Institute
Organisation of the Petroleum Exporting Countries
Regional Association of Oil and Natural Gas Companies in Latin America and the Caribbean
Society for Underwater Technology
Society of Maritime Industries
Society of Petroleum Engineers
Society of Petroleum Enginners – Calgary
Step Change in Safety
Subsea UK
The East of England Energy Group
UK Petroleum Industry Association
All the events postponed due to COVID-19.
Latest Energy news
Visiongain Publishes Carbon Capture Utilisation and Storage (CCUS) Market Report 2024-2034
The global carbon capture utilisation and storage (CCUS) market was valued at US$3.75 billion in 2023 and is projected to grow at a CAGR of 20.6% during the forecast period 2024-2034.
19 April 2024
Visiongain Publishes Liquid Biofuels Market Report 2024-2034
The global Liquid Biofuels market was valued at US$90.7 billion in 2023 and is projected to grow at a CAGR of 6.7% during the forecast period 2024-2034.
03 April 2024
Visiongain Publishes Hydrogen Generation Market Report 2024-2034
The global Hydrogen Generation market was valued at US$162.3 billion in 2023 and is projected to grow at a CAGR of 3.7% during the forecast period 2024-2034.
28 March 2024
Visiongain Publishes Biofuel Industry Market Report 2024-2034
The global Biofuel Industry market was valued at US$123.2 billion in 2023 and is projected to grow at a CAGR of 7.6% during the forecast period 2024-2034.
27 March 2024


