Visiongain has calculated that the global Wastewater treatment to energy (WWTtE) market will see a total expenditure of $531m in 2017, including both capital and operational expenditures. Read on to discover the potential business opportunities available.
Wastewater treatment to energy (WWTtE) facilities will continue to receive high levels of investment and increasing operational costs over the next ten years. This is reflective of the untapped energy resource found in wastewater and the cost-effective way to run a wastewater treatment plant (WWTP).
Anaerobic digestion (AD) is a proven technology for the treatment of sewage sludge and produces a biogas which is considered a renewable energy. Biogas is primarily made up of methane and carbon dioxide and trace amounts of nitrogen and ammonia. Biogas from wastewater treatment is considered as a carbon-neutral fuel source. There is global pressure on governments to take action on climate change is a key driver of renewable energy policies. If fossil fuels are displaced using biogas, then there is a net reduction in carbon emissions.
There is also a range of financial incentives that can be used to encourage the development of WWTtE facilities. These include tax credits, FITs, purchase agreements and capital subsidies. However, the recent fall in global natural gas prices has complicated the economics of many WWTtE projects. The high levels of energy required to treat wastewater means the fall in gas price will have a limited impact on power and heat projects.
Visiongain’s global wastewater treatment to energy market report can keep you informed and up to date with the developments in the market, across four different regions: North America, Europe, Asia Pacific and the Rest of the World. Visiongain has also included in-Depth market analysis for the ten leading national markets: Canada, USA, Australia, South Korea, Denmark, France, Germany, Switzerland, Sweden and the UK.
With reference to this report, it details the key investments trend in the global market, subdivided by regions, capital and operational expenditure and project type. Through extensive secondary research and interviews with industry experts, visiongain has identified a series of market trends that will impact the WWTtE market over the forecast timeframe.
The report will answer questions such as:
– Which regions are likely to experience the most rapid growth over the coming decade?
– What are the technological trends that are changing the market?
– How is wastewater biogas use changing and what are the main drivers and restraints for this change?
– What impact does governmental regulation have on the growth of national WWTtE markets?
– What are the typical capital expenditures necessary for bringing a WWTtE facility online, including differentiation between electricity and heat generating and biomethane export project types?
– What are the typical operation and maintenance costs associated with a WWTtE facility, including differentiation between electricity and heat generating and biomethane export project types?
Five Reasons Why You Must Order and Read This Report Today:
1) The report provides CAPEX and OPEX forecasts, as well as analysis, for the global market and for 3 wastewater treatment to energy submarkets by end use from 2017-2027
– Heat Forecast 2017-2027
– Power Forecast 2017-2027
– Biomethane Forecast 2017-2027
2) The report includes CAPEX, OPEX and end use (Heat, Power and Biomethane) forecasts and detailed analysis of developments in ten national markets and 4 regional Markets from 2017 to 2027
– North America WWTtE Market Forecast 2017-2027
– Asia-Pacific WWTtE Market Forecast 2017-2027
– European WWTtE Market Forecast 2017-2027
– Rest of the World WWTtE Market Forecast 2017-2027
– Canadian WWTtE Market Forecast 2017-2027
– US WWTtE Market Forecast 2017-2027
– Australian WWTtE Market Forecast 2017-2027
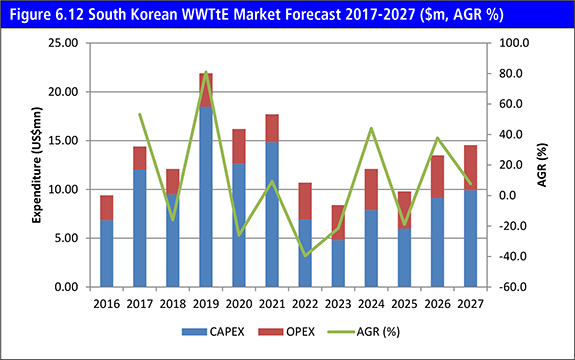
– South Korean WWTtE Market Forecast 2017-2027
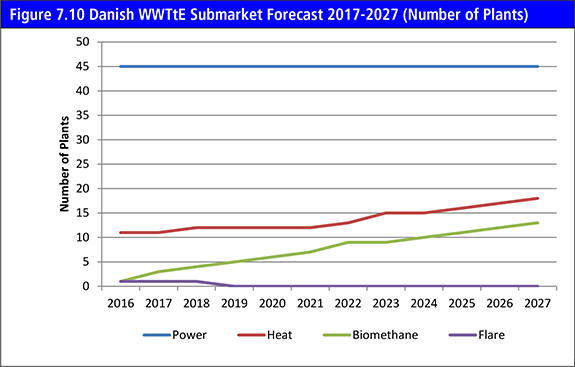
– Danish WWTtE Market Forecast 2017-2027
– French WWTtE Market Forecast 2017-2027
– German WWTtE Market Forecast 2017-2027
– Swiss WWTtE Market Forecast 2017-2027
– Swedish WWTtE Market Forecast 2017-2027
– UK WWTtE Market Forecast 2017-2027
3) The report includes forecasts for the number of heat, power and biomethane plants in ten leading national markets from 2017-2027
– Canadian WWTtE Number of Installations Forecast 2017-2027
– US WWTtE Number of Installations Forecast 2017-2027
– Australian WWTtE Number of Installations Forecast 2017-2027
– South Korean WWTtE Number of Installations Forecast 2017-2027
– Danish WWTtE Number of Installations Forecast 2017-2027
– French WWTtE Number of Installations Forecast 2017-2027
– German WWTtE Number of Installations Forecast 2017-2027
– Swiss WWTtE Number of Installations Forecast 2017-2027
– Swedish WWTtE Number of Installations Forecast 2017-2027
– UK WWTtE Number of Installations Forecast 2017-2027
4) The analysis is underpinned by our exclusive interviews with leading experts:
– Alex Marshall from Clarke Energy
– Harro Brons from WELTEC Biopower
– Kurt Goddard from FuelCell Energy
– Noel Kullavanijaya from Equilibrium Capital
– Professor Jörgen Ejlertsson
– Dr Virginie Cartier and Graig Rosenberger from Veolia Water Technology
– Wilbert Menkvel from Nijhuis Water Technology
5) The report provides market share and detailed profiles of the leading companies operating within the WWTtE market:
– RWL Water Group
– Kemira Oyj
– Malmberg Water AB
– Xylem Inc.
– APROVIS Energy Systems
– Veolia Group
– AAT Biogas Technology
– Hitachi Zosen INOVA
– PlanET Biogas
– GE Water
This independent 255-page report guarantees you will remain better informed than your competitors. With 213 tables and figures examining the wastewater treatment to energy market space, the report gives you a direct, detailed breakdown of the market. PLUS, capital expenditure AND operational expenditure AND forecasts for the number of installations ALL broken down into the heat, power and biomethane submarkets, as well as in-Depth analysis, from 2017-2027 will keep your knowledge that one step ahead of your rivals.
This report is essential reading for you or anyone in the WWTtE sectors. Purchasing this report today will help you to recognise those important market opportunities and understand the possibilities there. I look forward to receiving your order.
Visiongain is a trading partner with the US Federal Government
CCR Ref number: KD4R6
1. Report Overview
1.1 Global Wastewater Treatment to Energy Market Overview
1.2 Wastewater to Energy Market Segmentation
1.3 Why You Should Read This Report
1.3 How This Report Delivers
1.4 Key Questions Answered by This Analytical Report Include:
1.5 Who is This Report For?
1.5 Market Definition
1.6 Methodology
1.7 Frequently Asked Questions (FAQ)
1.8 Associated visiongain Reports
1.9 About visiongain
2. Introduction to the Wastewater Treatment to Energy Market
2.1 Feedstock and Co-digestion
2.2 Pre-treatment Technologies
2.3 Anaerobic Digestion
2.4 Flaring
2.5 Biogas Utilisation
2.5.1 Biogas Upgrading
2.5.1.1 Water Scrubbing
2.5.1.2 Pressure Swing Absorption (PSA)
2.5.1.3 Membrane Scrubbing
2.5.1.4 Cryogenic Technology
2.5.1.5 Chemical Scrubbing
2.5.1.6 Organic Physical Scrubbing
2.5.2 Biomethane
2.5.3 Electricity
2.5.4 Heating
2.6 Regulatory Environment
2.6.1 Wastewater Treatment Regulations
2.7 Support Mechanisms
2.7.1 Feed In Tariffs
2.7.2 Tax Relief
2.7.3 Mandates, Standards and Targets
2.8 Digestate
2.9 Environmental Concerns
2.10 Cost Assumptions
3. Global Wastewater to Energy Market Forecast 2017-2027
3.1 The Global Wastewater to Energy Market CAPEX Forecast 2017-2027
3.2 The Global Wastewater to Energy Market OPEX Forecast 2017-2027
3.3 Which WWTtE Markets are Most Accessible to New Entrants
4. Global Wastewater Treatment to Energy by Submarket Forecast 2017-2027
4.1 Power WWTtE Submarket Forecast 2017-2027
4.1.1 Drivers and Restraints of the Power Submarket
4.2 Heat WWTtE Submarket Forecast 2017-2027
4.2.1 Drivers and Restraints of the Heat Submarket
4.3 Biomethane WWTtE Submarket Forecast 2017-2027
4.3.1 Drivers and Restraints of the Biomethane Submarket
5. The North American Wastewater Treatment to Energy Market Forecast 2017-2027
5.1 The Canadian Wastewater to Energy Market Forecast 2017-2027
5.1.1 Learn About the Submarket Breakdown in the Canadian WWTtE Market
5.1.2 The History of WWTtE in Canada
5.1.3 A New Direction for Canadian Wastewater Treatment
5.2 The US Wastewater to Energy Market Forecast 2017-2027
5.2.1 Learn About the Submarket Breakdown in the US WWTtE Market
5.2.2 The History of WWTtE in the USA
5.2.3 Promoting Biogas as a Strategy to Reduce Greenhouse Gas Emissions
6. The Asia Pacific Wastewater Treatment to Energy Market Forecast 2017-2027
6.1 The Australian Wastewater to Energy Market Forecast 2017-2027
6.1.1 Learn About the Submarket Breakdown in the Australian WWTtE Market
6.1.2 The History of WWTtE in the Australia
6.1.3 A Lack of Coherence Between Australian States
6.2 The South Korea Wastewater to Energy Market Forecast 2017-2027
6.2.1 Learn About the Submarket Breakdown in the South Korean WWTtE Market
6.2.2 The History of WWTtE in the South Korea
6.2.3 Foreign Investment in South Korean Wastewater Treatment
6.3 The Rest of Asia Pacific Wastewater to Energy Market Forecast 2017-2027
6.3.1 The Chinese Wastewater Treatment to Energy Market
6.3.2 The Indian Wastewater Treatment to Energy Market
6.3.3 The Japanese Wastewater Treatment to Energy Market
7. The Europe Wastewater Treatment to Energy Market Forecast 2017-2027
7.1 The Danish Wastewater to Energy Market Forecast 2017-2027
7.1.1 Learn About the Submarket Breakdown in the Danish WWTtE Market
7.1.2 The Future of the Danish Water System
7.2 The French Wastewater to Energy Market Forecast 2017-2027
7.2.1 Learn About the Submarket Breakdown in the French WWTtE Market
7.2.2 French National Policy and the WWTtE
7.3 The German Wastewater to Energy Market Forecast 2017-2027
7.3.1 Learn About the Submarket Breakdown in the French WWTtE Market
7.3.2 Will the EEG Continue to Drive the German Biogas Industry?
7.4 The Swiss Wastewater to Energy Market Forecast 2017-2027
7.4.1 Learn About the Submarket Breakdown in the Swiss WWTtE Market
7.4.2 Swiss Investment in Wastewater Treatment
7.5 The Swedish Wastewater to Energy Market Forecast 2017-2027
7.5.1 Learn About the Submarket Breakdown in the Swedish WWTtE Market
7.5.2 Sweden Leads the World in Using Biogas as a Fuel
7.6 The UK Wastewater to Energy Market Forecast 2017-2027
7.6.1 Learn About the Submarket Breakdown in the UK WWTtE Market
7.7 Rest of Europe Wastewater to Energy Market Forecast 2017-2027
7.7.1 The Spanish Wastewater Treatment to Energy Market
7.7.2 The Italian Wastewater Treatment to Energy Market
8. Rest of the World Wastewater to Energy Market Forecast 2017-2027
8.1 The Brazilian Wastewater Treatment to Energy Market
8.2 The Mexican Wastewater Treatment to Energy Market
9. PEST Analysis of the Wastewater to Energy Market 2017-2027
9.1 Political
9.2 Economic
9.3 Social
9.4 Technological
10. Expert Opinion
10.1 Clarke Energy
10.1.1 Clarke Energy Operations
10.1.2 Key Regulatory Drivers and Restraints
10.1.3 Power Capacity
10.1.4 Main Operational Costs
10.1.5 Average Installation Time
10.1.6 Technological Developments on the Horizon
10.1.7 Importance of Public Understanding
10.1.8 Co-Digestion
10.1.9 Cost Reductions
10.2 WELTEC Biopower
10.2.1 WELTEC’s Operations
10.2.2 Key Drivers and Restraints
10.2.3 Main Operational Costs
10.2.4 The Uses of Biogas
10.2.5 Average EPC Period
10.2.6 Future Plans
10.3 FuelCell Energy
10.3.1 FuelCell Operations
10.3.2 Regulatory Drivers and Restraints
10.3.3 Grid Connection
10.3.4 Operations South Korea
10.3.5 Main Operational Costs and the EPC Period
10.3.6 Lack of AD a Cap on Growth
10.3.7 Future Plans
10.3.8 Importance of Public Understanding
10.4 Equilibrum Capital
10.4.1 Equilibrium Capital Operations
10.4.2 Key Drivers and Restraints
10.4.3 Impact of the Clean Power Plan
10.4.4 Effect of Natural Gas Price Fall
10.5 Scandinavian Biogas
10.5.1 Scandinavian Biogas Operations
10.5.2 Key Regulatory Drivers and Restraints
10.5.3 High Gas Prices in South Korea
10.5.4 Main Operational Costs
10.5.5 End Uses of the Biogas
10.5.6 Future Plans
10.6 Veolia Water Technology “Biothane” (Subsidiary of Veolia)
10.6.1 Biothane’s Operations
10.6.2 Key Regulatory Drivers and Restraints
10.6.3 Typical Project Length
10.6.4 Technological Developments on the Horizon
10.6.5 Cost Reduction
10.7 Nijhuis Water Technology
10.7.1 Nijhuis Water Technology Operations
10.7.2 Key Regulatory Drivers and Restraints
10.7.3 Primary End Uses of the Biogas
10.7.4 Technological Developments on the Horizon
10.7.5 Cost Reduction
10.7.6 Future of the Market
11. The Leading Companies in the Wastewater Treatment to Energy Market
11.1 RWL Water Group
11.2 Kemira Oyj
11.2.1 Kemira Oyj Total Company Sales 2011-2016
11.2.2 Kemira Oyj Sales in the Wastewater Treatment to Energy Market 2011-2016
11.3 Malmberg Water AB
11.4 Xylem Inc.
11.4.1 Xylem Inc. Total Company Sales 2011-2016
11.4.2 Xylem Inc. Sales in the Wastewater Treatment to Energy Market 2011-2016
11.5 APROVIS Energy Systems
11.6 Veolia Group
11.6.1 Veolia Group Total Company Sales 2012-2016
11.7 AAT Biogas Technology
11.8 Hitachi Zosen INOVA
11.8.1 Hitachi Zosen INOVA Total Company Sales 2012-2016
11.1.9 PlanET Biogas
11.10 GE Water
11.10.1 GE Water Total Company Sales 2012-2016
11.10.2 GE Water Sales in the Wastewater Treatment to Energy Market 2012-2016
12. Conclusions and Recommendations
12.1 Global Wastewater Treatment to Energy Outlook
12.2 Key Findings in the Global Wastewater Treatment to Energy Market
12.3 Recommendations for the Global Wastewater Treatment to Energy Market
13. Glossary
Appendix
Associated Visiongain Reports
Visiongain Report Sales Order Form
Appendix A
Appendix B
Visiongain Report Evaluation Form
Tables
Table 1.1 Sample WWTtE Market Forecast 2017-2027
Table 2.1 Composition of Biogas Produced from Wastewater
Table 2.2 Gas Composition Requirements for Injection into the Grid
Table 2.3 Cost Assumptions
Table 3.1 Global WWTtE Market Forecast, 2017-2027 Total Expenditure ($m, AGR, CAGR)
Table 3.2 Leading Regional and National WWTtE Markets Forecast, 2017-2027 Total Expenditure ($m, AGR)
Table 3.3 Global WWTtE Market CAPEX Forecast, 2017-2027 ($m, AGR)
Table 3.4 Leading Regional and National WWTtE Markets CAPEX Forecast, 2017-2027 ($m, AGR)
Table 3.5 Global WWTtE Market OPEX Forecast, 2017-2027 ($m, AGR)
Table 3.6 Leading Regional and National WWTtE Markets OPEX Forecast, 2017-2027 ($m, AGR)
Table 4.1 Power, Heat and Biomethane WWTtE Submarket Forecasts, 2017-2027 ($m, AGR % Total Expenditure)
Table 4.2 Global Power Submarket Forecasts, 2017-2027 ($m, AGR %, CAGR %)
Table 4.3 Power Submarket Drivers and Restraints
Table 4.4 Global Heat Submarket Forecasts, 2017-2027 ($m, AGR %, CAGR %)
Table 4.5 Heat Submarket Drivers and Restraints
Table 4.6 Global Biomethane Submarket Forecasts, 2017-2027 ($m, AGR %, CAGR %)
Table 4.7 Biomethane Submarket Drivers and Restraints
Table 5.1 North American WWTtE Market Forecast, 2017-2027 ($m, AGR %)
Table 5.2 Canadian WWTtE Market Forecast 2017-2027 ($m, AGR %)
Table 5.3 Canadian WWTtE Submarket Forecast 2017-2027 ($m OPEX and CAPEX)
Table 5.4 Canadian WWTtE Submarket Forecast 2017-2027 (Number of Plants)
Table 5.5 Canadian Policy Instruments that Relate to the WWTtE Market
Table 5.6 Canadian WWTtE Market Drivers and Restraints
Table 5.7 US WWTtE Market Forecast 2017-2027 ($m, AGR %)
Table 5.8 US WWTtE Submarket Forecast 2017-2027 ($m OPEX and CAPEX)
Table 5.9 US WWTtE Submarket Forecast 2017-2027 (Number of Plants)
Table 5.10 US WWTtE Submarket Forecast 2017-2027 (Number of Plants)
Table 5.11 US Policy Instruments that Relate to the WWTtE Market
Table 5.12 US WWTtE Market Drivers and Restraints
Table 6.1 Asia Pacific WWTtE Market Forecast, 2017-2027 ($m, AGR %)
Table 6.2 Australian WWTtE Market Forecast 2017-2027 ($m, AGR %)
Table 6.3 Australian WWTtE Submarket Forecast 2017-2027 ($m OPEX and CAPEX)
Table 6.4 Australian WWTtE Submarket Forecast 2017-2027 (Number of Plants)
Table 6.5 Australian Policy Instruments that Relate to the WWTtE Market
Table 6.6 Australian WWTtE Market Drivers and Restraints
Table 6.7 South Korean WWTtE Market Forecast 2017-2027 ($m, AGR %)
Table 6.8 South Korean WWTtE Submarket Forecast 2017-2027 ($m OPEX and CAPEX)
Table 6.9 South Korean WWTtE Submarket Forecast 2017-2027 (Number of Plants)
Table 6.10 South Korean Policy Instruments that Relate to the WWTtE Market
Table 6.11 South Korean WWTtE Market Drivers and Restraints
Table 6.12 Rest of Asia-Pacific Wastewater Treatment to Energy Market Forecast 2017-2027 (Total Expenditure $m, AGR %)
Table 7.1 European WWTtE Market Forecast, 2017-2027 ($m, AGR %)
Table 7.2 Danish WWTtE Market Forecast 2017-2027 ($m, AGR %)
Table 7.3 Danish WWTtE Submarket Forecast 2017-2027 ($m OPEX and CAPEX)
Table 7.4 Danish WWTtE Submarket Forecast 2017-2027 (Number of Plants)
Table 7.5 Danish Policy Instruments that Relate to the WWTtE Market
Table 7.6 Danish WWTtE Market Drivers and Restraints
Table 7.7 French WWTtE Market Forecast 2017-2027 ($m, AGR %)
Table 7.8 French WWTtE Submarket Forecast 2017-2027 ($m OPEX and CAPEX)
Table 7.9 French WWTtE Submarket Forecast 2017-2027 (Number of Plants)
Table 7.10 French Policy Instruments that Relate to the WWTtE Market
Table 7.11 French WWTtE Market Drivers and Restraints
Table 7.12 German WWTtE Market Forecast 2017-2027 ($m, AGR %)
Table 7.13 German WWTtE Submarket Forecast 2017-2027 ($m OPEX and CAPEX)
Table 7.14 German WWTtE Submarket Forecast 2017-2027 (Number of Plants)
Table 7.15 German Policy Instruments that Relate to the WWTtE Market
Table 7.16 French WWTtE Market Drivers and Restraints
Table 7.17 Swiss WWTtE Market Forecast 2017-2027 ($m, AGR %)
Table 7.18 Swiss WWTtE Submarket Forecast 2017-2027 ($m OPEX and CAPEX)
Table 7.19 Swiss WWTtE Submarket Forecast 2017-2027 (Number of Plants)
Table 7.20 Swiss WWTP Capacity Classes
Table 7.21 Swiss Policy Instruments that Relate to the WWTtE Market
Table 7.22 Swiss WWTtE Market Drivers and Restraints
Table 7.23 Swedish WWTtE Market Forecast 2017-2027 ($m, AGR %)
Table 7.24 Swedish WWTtE Submarket Forecast 2017-2027 ($m OPEX and CAPEX)
Table 7.25 Swedish WWTtE Submarket Forecast 2017-2027 (Number of Plants)
Table 7.26 Swedish Policy Instruments that Relate to the WWTtE Market
Table 7.27 Swedish WWTtE Market Drivers and Restraints
Table 7.28 UK WWTtE Market Forecast 2017-2027 ($m, AGR %)
Table 7.29 UK WWTtE Submarket Forecast 2017-2027 ($m OPEX and CAPEX)
Table 7.30 UK WWTtE Submarket Forecast 2017-2027 (Number of Plants)
Table 7.31 UK Policy Instruments that Relate to the WWTtE Market
Table 7.32 UK WWTtE Market Drivers and Restraints
Table 7.33 Rest of Europe WWTtE Market Forecast 2017-2027 ($m, AGR %)
Table 8.1 Rest of World WWTtE Market Forecast 2017-2027 ($m, AGR %)
Table 11.1 RWL Water Group Profile 2016 (CEO, HQ, Founded, Website)
Table 11.2 Kemira Oyj Profile 2016 (CEO, Total Company Sales US$m, Sales From Company Division That Includes WWTtE (US$m), Share of Total Company Sales From Company Division That Includes WWTtE (%), Net Income / Loss US$m, Net Capital Expenditure US$m, Strongest Business Region, Business Segment in the Market, HQ, Founded, No. of Employees, IR Contact, Ticker, Website)
Table 11.3 Kemira Oyj Total Company Sales 2010-2016 (US$m, AGR %)
Table 11.4 Kemira Oyj Sales in the Wastewater Treatment to Energy Market 2010-2016 (US$m, AGR %)
Table 11.5 Malmberg Water AB 2015 (CEO, Total Company Sales US$m, Business Segment in the Market, HQ, Founded, No. of Employees, Website)
Table 11.6 Xylem Inc. 2016 (CEO, Total Company Sales US$m, Sales From Company Division That Includes WWTtE (US$m), Share of Total Company Sales From Company Division That Includes WWTtE (%), Net Income / Loss US$m, Net Capital Expenditure US$m, Strongest Business Region, Business Segment in the Market, HQ, Founded, No. of Employees, IR Contact, Ticker, Website)
Table 11.7 Xylem Inc. Total Company Sales 2010-2016 (US$m, AGR %)
Table 11.8 Xylem Inc. Sales in the Wastewater Treatment to Energy Market 2010-2016 (US$m, AGR %)
Table 11.9 APROVIS Energy Systems 2016 (HQ, Founded, No. of Employees, Website)
Table 11.10 Veolia Group 2016 (CEO, Total Company Sales US$m, Sales From Company Division That Includes WWTtE (US$m), Share of Total Company Sales From Company Division That Includes WWTtE (%), Net Income / Loss US$m, Net Capital Expenditure US$m, Strongest Business Region, Business Segment in the Market, HQ, Founded, No. of Employees, IR Contact, Ticker, Website)
Table 11.11 Veolia Group Total Company Sales 2011-2016 (US$m, AGR %)
Table 11.12 AAT Biogas Technology 2016 (HQ, Founded, Website)
Table 11.13 Hitachi Zosen INOVA Profile 2016 (CEO, Total Company Sales US$m, Net Income / Loss US$m, Strongest Business Region, Business Segment in the Market, HQ, Founded, No. of Employees, IR Contact, Website)
Table 11.14 Hitachi Zosen INOVA Total Company Sales 2010-2016 (US$m, AGR %)
Table 11.15 PlanET Biogas Profile 2016 (CEO, HQ, Founded, No. of Employees, IR Contact, Website)
Table 11.16 GE Water Profile 2016 ((CEO, Total Company Sales US$m, Sales From Company Division That Includes WWTtE (US$m), Share of Total Company Sales From Company Division That Includes WWTtE (%), Net Income / Loss US$m, Net Capital Expenditure US$m, Strongest Business Region, Business Segment in the Market, Submarket Involvement, HQ, Founded, No. of Employees, IR Contact, Ticker, Website)
Table 11.17 GE Water Total Company Sales 2011-2016 (US$m, AGR %)
Table 11.18 GE Water Sales in the Wastewater Treatment to Energy Market 2011-2016 (US$m, AGR %)
Figures
Figure 1.1 Global WWTtE Market Regional Breakdown
Figure 1.2 Global WWTtE Market Regional Breakdown
Figure 2.1 Inputs, Outputs and Processes of a Wastewater Treatment Plant
Figure 2.2 Stages of Wastewater Treatment
Figure 2.3 Temperatures and the Solubility of CO2 and CH4
Figure 2.4 Global Methane Emissions Forecasts by Region 1990-2030 (MtCO2e)
Figure 2.5 Global Methane Emissions Forecasts by Region 1990-2030, Percentage Change (%)
Figure 2.6 Global Methane (CH4) Emissions Forecasts by Region in 2017, 2022 and 2027 (% Share)
Figure 2.7 Global Methane (CH4) Emissions Forecasts by Sector in 2017, 2022 and 2027 (% Share)
Figure 2.8 Global Methane Emissions Forecast by Waste Source 1990-2030 (MtCO2e)
Figure 3.1 Global WWTtE Market Forecast, 2017-2027 Total Expenditure ($m, AGR)
Figure 3.2 Global WWTtE Market CAPEX Forecast, 2017-2027 ($m, AGR)
Figure 3.3 Leading Regional and National WWTtE Markets CAPEX Forecast, 2017-2027 ($m)
Figure 3.4 Leading Regional and National WWTtE Markets Cumulative CAPEX Forecast, 2017-2027 (% Share)
Figure 3.5 Leading Regional WWTtE Markets CAPEX Forecast, 2017-2027 ($m)
Figure 3.6 Global WWTtE Market OPEX Forecast, 2017-2027 ($m, AGR)
Figure 3.7 Leading Regional and National WWTtE Markets OPEX Forecast, 2017-2027 ($m)
Figure 3.8 Leading Regional and National WWTtE Markets Cumulative OPEX Forecast, 2017-2027 (% Share)
Figure 3.9 Leading Regional WWTtE Markets OPEX Forecast, 2017-2027 ($m)
Figure 4.1 Power, Heat and Biomethane WWTtE Submarket Forecasts, 2017-2027 ($m, AGR % Total Expenditure)
Figure 4.2 Power, Heat and Biomethane WWTtE Submarket, 2017-2027 ($m Total Expenditure)
Figure 4.3 Power, Heat and Biomethane WWTtE Submarket, 2017-2027 (CAGR %)
Figure 4.4 Global Power Submarket Forecasts, 2017-2027 ($m, AGR %)
Figure 4.5 Global Power Submarket Share Forecasts, 2017, 2022 and 2027 (% Total Expenditure Share)
Figure 4.6 Leading Nations Power Submarket Forecasts ($m Total Expenditure)
Figure 4.7 Global Heat Submarket Forecasts, 2017-2027 ($m, AGR %)
Figure 4.8 Global Heat Submarket Share Forecasts, 2017, 2022 and 2027 (% Total Expenditure Share)
Figure 4.9 Leading Nations Heat Submarket Forecasts, ($m Total Expenditure)
Figure 4.10 Global Biomethane Submarket Forecasts, 2017-2027 ($m, AGR %)
Figure 4.11 Global Biomethane Submarket Share Forecasts, 2017, 2022 and 2027 (% Total Expenditure Share)
Figure 4.12 Leading National Biomethane Submarket Forecasts, ($m Total Expenditure)
Figure 5.1 North American WWTtE Market Forecast, 2017-2027 ($m, AGR %)
Figure 5.2 North American WWTtE Market Share Forecast, 2017, 2022 and 2027 (% Total Expenditure Share)
Figure 5.3 North American WWTtE Market Share Forecast, 2017, 2022 and 2027 (% CAPEX Share)
Figure 5.4 North American WWTtE Market Share Forecast, 2017, 2022 and 2027 (% OPEX Share)
Figure 5.5 Regional Market Forecast, 2017-2027 ($m Total Expenditure)
Figure 5.6 Canadian WWTtE Market Forecast 2017-2027 ($m, AGR %)
Figure 5.7 Canadian Market Share Forecast, 2017, 2022 and 2027 (% Total Expenditure Share)
Figure 5.8 Canadian WWTtE Submarket Forecast 2017-2027 ($m CAPEX)
Figure 5.9 Canadian WWTtE Submarket Forecast 2017-2027 ($m OPEX)
Figure 5.10 Canadian WWTtE Submarket Forecast 2017-2027 (Number of Plants)
Figure 5.11 Proportion of Provincial Canadian Population Served by Secondary Treatment
Figure 5.12 US WWTtE Market Forecast 2017-2027 ($m, AGR %)
Figure 5.13 US Market Share Forecast, 2017, 2022 and 2027 (% Total Expenditure Share)
Figure 5.14 US WWTtE Submarket Forecast 2017-2027 ($m CAPEX)
Figure 5.15 US WWTtE Submarket Forecast 2017-2027 ($m OPEX)
Figure 5.16 US WWTtE Submarket Forecast 2017-2027 (Number of Plants)
Figure 6.1 Asia Pacific WWTtE Market Forecast, 2017-2027 ($m, AGR %)
Figure 6.2 Asia Pacific WWTtE Market Share Forecast, 2017, 2022 and 2027 (% Total Expenditure Share)
Figure 6.3 Asia Pacific WWTtE Market Share Forecast, 2017, 2022 and 2027 (% CAPEX Share)
Figure 6.4 Asia Pacific WWTtE Market Share Forecast, 2017, 2022 and 2027 (% OPEX Share)
Figure 6.5 Regional Market Forecast, 2017-2027 ($m Total Expenditure)
Figure 6.6 Australian WWTtE Market Forecast 2017-2027 ($m, AGR %)
Figure 6.7 Australian Market Share Forecast, 2017, 2022 and 2027 (% Total Expenditure Share)
Figure 6.8 Australian WWTtE Submarket Forecast 2017-2027 ($m CAPEX)
Figure 6.9 Australian WWTtE Submarket Forecast 2017-2027 ($m OPEX)
Figure 6.10 Australian WWTtE Submarket Forecast 2017-2027 (Number of Plants)
Figure 6.11 WWTPs in Australia with AD Systems Installed 1984-2015
Figure 6.12 South Korean WWTtE Market Forecast 2017-2027 ($m, AGR %)
Figure 6.13 South Korean WWTtE Market Share Forecast, 2017, 2022 and 2027 (% Total Expenditure Share)
Figure 6.14 South Korean WWTtE Submarket Forecast 2017-2027 ($m CAPEX)
Figure 6.15 South Korean WWTtE Submarket Forecast 2017-2027 ($m OPEX)
Figure 6.16 South Korean WWTtE Submarket Forecast 2017-2027 (Number of Plants)
Figure 6.17 WWTPs in Korea with AD Systems Installed 1987-2015
Figure 6.18 Rest of Asia-Pacific Wastewater Treatment to Energy Market Forecast 2017-2027 (Total Expenditure $m, AGR %)
Figure 6.19 Rest of Asia-Pacific WWTtE Market Share Forecast, 2017, 2022 and 2027 (% Total Expenditure Share)
Figure 7.1 European WWTtE Market Forecast, 2017-2027 ($m, AGR %)
Figure 7.2 European WWTtE Market Share Forecast, 2017, 2022 and 2027 (% Total Expenditure Share)
Figure 7.3 European WWTtE Market Share Forecast, 2017, 2022 and 2027 (% CAPEX Share
Figure 7.4 European WWTtE Market Share Forecast, 2017, 2022 and 2027 (% OPEX Share)
Figure 7.5 Regional WWTtE Market Forecast, 2017-2027 ($m Total Expenditure)
Figure 7.6 Danish WWTtE Market Forecast 2017-2027 ($m, AGR %)
Figure 7.7 Danish WWTtE Market Share Forecast, 2017, 2022 and 2027 (% Total Expenditure Share)
Figure 7.8 Danish WWTtE Submarket Forecast 2017-2027 ($m OPEX)
Figure 7.9 Danish WWTtE Submarket Forecast 2017-2027 ($m CAPEX)
Figure 7.10 Danish WWTtE Submarket Forecast 2017-2027 (Number of Plants)
Figure 7.11 WWTPs in Denmark with AD Systems Installed 1988-2015 (Number of Plants)
Figure 7.12 French WWTtE Market Forecast 2017-2027 ($m, AGR %)
Figure 7.13 French WWTtE Market Share Forecast, 2017, 2022 and 2027 (% Total Expenditure Share)
Figure 7.14 French WWTtE Submarket Forecast 2017-2027 ($m OPEX)
Figure 7.15 French WWTtE Submarket Forecast 2017-2027 ($m CAPEX)
Figure 7.16 French WWTtE Submarket Forecast 2017-2027 (Number of Plants)
Figure 7.17 German WWTtE Market Forecast 2017-2027 ($m, AGR %)
Figure 7.18 German WWTtE Market Share Forecast, 2017, 2022 and 2027 (% Total Expenditure Share)
Figure 7.19 German WWTtE Submarket Forecast 2017-2027 ($m CAPEX)
Figure 7.20 German WWTtE Submarket Forecast 2017-2027 ($m OPEX)
Figure 7.21 German WWTtE Submarket Forecast 2017-2027 (Number of Plants)
Figure 7.22 WWTPs in Germany with AD Systems Installed 1993-2015 (Number of Plants)
Figure 7.23 Swiss WWTtE Market Forecast 2017-2027 ($m, AGR %)
Figure 7.24 Swiss WWTtE Market Share Forecast, 2017, 2022 and 2027 (% Total Expenditure Share)
Figure 7.25 Swiss WWTtE Submarket Forecast 2017-2027 ($m OPEX)
Figure 7.26 Swiss WWTtE Submarket Forecast 2017-2027 ($m CAPEX)
Figure 7.27 Swiss WWTtE Submarket Forecast 2017-2027 (Number of Plants)
Figure 7.28 WWTPs in Switzerland with AD Systems Installed 1972-2015 (Number of Plants)
Figure 7.29 Swedish WWTtE Market Forecast 2017-2027 ($m, AGR %)
Figure 7.30 Swedish WWTtE Market Share Forecast, 2017, 2022 and 2027 (% Total Expenditure Share)
Figure 7.31 Swedish WWTtE Submarket Forecast 2017-2027 ($m OPEX)
Figure 7.32 Swedish WWTtE Submarket Forecast 2017-2027 ($m CAPEX)
Figure 7.33 Swedish WWTtE Submarket Forecast 2017-2027 (Number of Plants)
Figure 7.34 WWTPs in Sweden with AD Systems Installed 1972-2015 (Number of Plants)
Figure 7.35 UK WWTtE Market Forecast 2017-2027 ($m, AGR %)
Figure 7.36 UK WWTtE Market Share Forecast, 2017, 2022 and 2027 (% Total Expenditure Share)
Figure 7.37 UK WWTtE Submarket Forecast 2017-2027 ($m OPEX)
Figure 7.38 UK WWTtE Submarket Forecast 2017-2027 ($m CAPEX)
Figure 7.39 UK WWTtE Submarket Forecast 2017-2027 (Number of Plants)
Figure 7.40 WWTPs in the UK with AD Systems Installed 1972-2015
Figure 7.41 Use of Digestate from AD in UK WWTPS
Figure 7.42 Rest of Europe WWTtE Market Forecast 2017-2027 ($m, AGR %)
Figure 7.43 Rest of Europe WWTtE Market Share Forecast, 2017, 2022 and 2027 (% Total Expenditure Share)
Figure 8.1 Rest of World WWTtE Market Forecast 2017-2027 ($m, AGR %)
Figure 8.2 Rest of World WWTtE Market Share Forecast, 2017, 2022 and 2027 (% Total Expenditure Share)
Figure 10.1 Diagram of Tri-generation from WWTtE
Figure 11.1 Kemira Oyj Total Company Sales 2011-2016 (US$m, AGR %)
Figure 11.2 Kemira Oyj Sales in the Wastewater Treatment to Energy Market 2011-2016 (US$m, AGR %)
Figure 11.3 Xylem Inc. Total Company Sales 2011-2016 (US$m, AGR %)
Figure 11.4 Xylem Inc. Sales in the Wastewater Treatment to Energy Market 2011-2016 (US$m, AGR %)
Figure 11.5 Veolia Group Total Company Sales 2012-2016 (US$m, AGR %)
Figure 11.6 Hitachi Zosen INOVA Total Company Sales 2012-2016 (US$m, AGR %)
Figure 11.7 GE Water Company Sales 2012-2016 (US$m, AGR %)
Figure 11.8 GE Water Sales in the Wastewater Treatment to Energy Market 2012-2016 (US$m, AGR %)


