Visiongain assesses that The global waste-to-energy market was valued at $16.4 billion in 2019, and it is expected to reach $22.6 billion by 2030, growing at a compound annual growth rate (CAGR) of 3.3% from 2020 to 2030. Read on to discover the potential business opportunities available.
The emergence of Asia-Pacific as a major hub for WTE development is expected to provide growth opportunities to market participants over the forecast period. The emerging economies of China and India have been developing their renewable resources to reduce carbon footprints to meet the carbon footprints seen in developed economies and have been involved in extensive R&D to develop low-cost WTE technologies. These efforts are expected to create immense opportunities for market participants.
Thermal technologies have emerged as the leading technology used for generating energy from waste. The segment accounted for 87% of total market revenue in 2019. Thermal technologies are further segregated into conventional thermal technologies and alternative thermal technologies. Thermal is the oldest and the most trusted technology used for generating energy from waste. However, the high cost associated with its installation, and its emission of harmful gases during incineration, are expected to hinder the market growth over the forecast period.
Biological treatment is expected to be the fastest growing technology at an estimated CAGR of 5.4% from 2020 to 2025. Biological treatments include the treatment of waste with microorganisms to generate energy. These methods are considered more environmental friendly than thermal technologies and are expected to increase their market penetration over the forecast period.
WTE is gaining status as an important component of integrated waste management strategies in which it plays the role of an alternative strategy to relieve the pressure on landfills. The added benefit of WTE over other waste management strategies is the potential for the extraction of energy. A major portion of this energy is used by the plant itself for its internal energy requirements; the remainder is supplied to the community.
Despite the potential that the sector offers both in terms of waste management and in terms of providing a cheap alternate energy source, many of the WTE technologies have been met with public opposition. For instance, thermal WTE projects have received bad publicity with concerns from environmental groups and local communities regarding several factors, including their impact on the environment and human health. Even though it is claimed that modern WTE combustion plants are safe and odor-free, public concern remains a barrier and continues to slow the implementation of new projects. However, several emerging technologies are much more efficient and promising and face less opposition. With growing waste volumes, the adoption of efficient and environmentally friendly waste management methods is becoming a priority for countries around the globe.
With reference to this report, waste-to-energy (WtE) facilities are considered as plants using municipal solid waste (MSW) as a primary fuel source for energy production. This includes direct combustion and advanced thermal, but not biological processes. The report covers the CAPEX spending of new and upgraded WtE plants globally. The report also forecasts MSW-processing capacity for global, regional and national markets from 2020-2030.
The report will answer questions such as:
• What are the prospects for the overall waste-to-energy industry?
• Where are the major investments occurring?
• Who are the key players in the waste-to-energy industry?
• What are the market dynamics underpinning the sector?
• How consolidated is the sector amongst the large industry players?
Reasons Why You Must Order and Read This Report Today:
1) The report provides detailed profiles and analysis of 20 leading companies operating within the waste-to-energy market:
– Covanta
– China Everbright
– Sembcorp Industries
– Suez Environment
– Keppel Seghers Belgium
– Veolia Environmental
– Wheelabrator
– Clean Association of Tokyo 23
– MVV Energie AG
– China Metallurgical Group (MCC)
– Hunan Junxin Environmental Protection
– GCL-Poly
– EDF
– Amec Foster Wheeler (formerly Foster Wheeler)
– Andritz Energy & Environment
– Arrow Ecology
– Babcock & Wilcox Volund A/S
– Biogas Nord AG
– Biogen Greenfinch
– BTA International Gmbh
2) The study reveals where companies are investing in waste-to-energy and how much waste-processing capacity from WtE is expected. Analysis of three regional markets, national markets plus analysis of many more countries:
– UK
– Poland
– Ireland
– Denmark
– Finland
– Italy
– Sweden
– Czech Republic
– Rest of Europe
– India
– China
– Japan
– Rest of AsiaPac
– USA
– Canada
– LATAM
For electricity generation, the CAPEX is estimated to be $14,681 mn in 2020, increasing to $17,996 mn by 2025 at a CAGR of 5.2%. The market further grows but at a lower rate, reaching CAPEX of $18,941 mn by 2030, at a CAGR of 1.1% from 2025 to 2030. Overall the submarket would grow with a CAGR of 3.1% over the forecasted period.
Producing electricity is only one reason to burn MSW. Burning waste also reduces the amount of material that would probably be buried in landfills. Burning MSW reduces the volume of waste by about 87%. Generation of electricity through waste remains the major application of the global WtE market and is expected to grow more over the forecast period.
3) Discover details of hundreds of waste-to-energy projects revealing the following information in most cases:
– Company
– Project title
– TPA capacity
– MW capacity
– $m investment
– Completion year
– Status
4) Learn about the following business-critical issues:
– Legislation and landfill targets
– Costs
– Energy security
– Pollution and public opposition
– New technologies such as mass burn and advanced conversion
This independent 325-page report guarantees you will remain better informed than your competition. With 253 tables and figures examining the waste-to-energy market space, the report gives you a visual, one-stop breakdown of your market including capital expenditure forecasts from 2020-2030, as well as analysis PLUS municipal waste processing capacity forecasts from 2020-2030, keeping your knowledge that one step ahead helping you to succeed.
This report is essential reading for you or anyone in the energy or waste sectors with interest in waste-to-energy. Purchasing this report today will help you to recognise those important market opportunities and understand the possibilities there. I look forward to receiving your order.
Buy our report today Global Waste-to-Energy (WtE) Market Forecast: Capacity (tpa) & CAPEX ($m) Forecasts for Incineration of Municipal Solid Waste (MSW) & Refuse-Derived Fuel (RDF) in Electricity Generation, District Heating & Combined Heat and Power (CHP), Energy from Waste (EfW) Plants; Featuring Technologies: Mass Burn, Gasification, Pyrolysis, Fluidised Bed, Advanced Thermal Treatment (ATT), & Advanced Conversion Technology (ACT). Avoid missing out by staying informed – order our report now.
Visiongain is a trading partner with the US Federal Government
CCR Ref number: KD4R6
Do you have any custom requirements we can help you with? Any need for specific country, geo region, market segment or specific company information? Contact us today, we can discuss your needs and see how we can help: sara.peerun@visiongain.com
1. Report Overview
1.1 Waste-to-Energy Market Overview
1.2 Market Structure Overview and Market Definition
1.3 Why You Should Read This Report
1.4 How This Report Delivers
1.5 Key Questions Answered by This Analytical Report Include:
1.6 Who is This Report For?
1.7 Methodology
1.7.1 Primary Research
1.7.2 Secondary Research
1.7.3 Market Evaluation & Forecasting Methodology
1.8 Frequently Asked Questions (FAQ)
1.9 Associated Visiongain Reports
1.10 About Visiongain
2. Introduction to the Waste-to-Energy Market
2.1 Waste-To-Energy: The Concept
2.2 Global Waste-to-Energy Market Structure
2.3 Market Definition
2.4 Waste to Energy-Value Chain Analysis
2.5 Market Dynamics
2.5.1 Market Driver
2.5.2 Challenges Of Waste-To-Energy
2.5.3 Opportunities
3. Global Overview of Waste to Energy Market
3.1 Regional Overview of Waste to Energy Market 2020–2030
3.2 Global Waste to Energy Market Drivers and Restraints
4. Global Waste to Energy Submarkets Forecast 2020–2030
4.1 Global Waste to Energy Submarkets Forecasts, by Type 2020–2030
4.1.1 Global Thermal Waste to Energy Forecasts 2020–2030
4.1.1.1 Global Thermal Waste to Energy Driver & Restraints
4.1.2 Global Biological Waste to Energy Forecasts 2020–2030
4.1.2.1 Global Biological WtE Driver & Restraints
4.1.3 Global Waste to Energy Market- Comparison Matrix (Type VS Region)
4.2 Global Waste to Energy Submarkets Forecasts, by Application 2020–2030
4.2.1 Global Electricity Generation Waste to Energy Forecasts 2020–2030
4.2.1.1 Global Electricity Generation Waste to Energy Driver & Restraints
4.2.2 Global Steam Exports Waste to Energy Forecasts 2020–2030
4.2.2.1 Global Steam Exports WtE Driver & Restraints
4.2.3 Global CHP Waste to Energy Forecasts 2020–2030
4.2.3.1 Global CHP WtE Driver & Restraints
4.2.4 Global Waste to Energy Market- Comparison Matrix (Application VS Region)
5. Leading Nations in Waste to Energy Market 2020–2030
5.1 The U.K. Waste-to-Energy Market Forecast 2020–2030
5.1.1 Current Status of Waste-to-Energy in the U.K.
5.1.2 U.K. Waste-to-Energy Market Analysis
5.1.3 Major UK Waste-to-Energy Projects
5.1.4 Drivers and Restraints in the U.K. Waste-to-Energy Market
5.2 The Polish Waste-to-Energy Market Forecast 2020–2030
5.2.1 Current Status of Waste-to-Energy in Poland
5.2.2 Polish Waste-to-Energy Market Analysis
5.2.3 Major Polish Waste-to-Energy Projects
5.2.4 Drivers and Restraints in the Polish Waste-to-Energy Market
5.3 The Irish Waste-to-Energy Market Forecast 2020–2030
5.3.1 Current Status of Waste-to-Energy in Ireland
5.3.2 Irish Waste-to-Energy Market Analysis
5.3.3 Major Irish Waste-to-Energy Projects
5.4 The Danish Waste-to-Energy Market Forecast 2020–2030
5.4.1 Current Status of Waste-to-Energy in Denmark
5.4.2 Danish Waste-to-Energy Market Analysis
5.4.3 Major Danish Waste-to-Energy Projects
5.4.4 Drivers and Restraints in the Danish Waste-to-Energy Market
5.5 The Finnish Waste-to-Energy Market Forecast 2020–2030
5.5.1 Current Status of Waste-to-Energy in Finland
5.5.2 Finnish Waste-to-Energy Market Analysis
5.5.3 Major Finnish Waste-to-Energy Projects
5.5.4 Drivers and Restraints in the Finnish Waste-to-Energy Market
5.6 The Italian Waste-to-Energy Market Forecast 2020–2030
5.6.1 Current Status of Waste-to-Energy in Italy
5.6.2 Italian Waste-to-Energy Market Analysis
5.6.3 Major Italian Waste-to-Energy Projects
5.6.4 Drivers and Restraints in the Italian Waste-to-Energy Market
5.7 The Swedish Waste-to-Energy Market Forecast 2020–2030
5.7.1 Current Status of Waste-to-Energy in Sweden
5.7.2 Swedish Waste-to-Energy Market Analysis
5.7.3 Major Swedish Waste-to-Energy Projects
5.7.4 Drivers and Restraints in the Swedish Waste-to-Energy Market
5.8 The Czech Republic Waste-to-Energy Market Forecast 2020–2030
5.8.1 Current Status of Waste-to-Energy in Czech Republic Market
5.8.2 Czech Republic Waste-to-Energy Market Analysis
5.8.3 Major Czech Waste-to-Energy Projects
5.9 Rest of Europe Waste-to-Energy Market Forecast 2020–2030
5.9.1 The Rest of Europe Waste-to-Energy Projects
5.9.2 The Emerging Markets of Eastern Europe
5.9.3 The Developed Markets of Northern and Western Europe
5.10 The Chinese Waste-to-Energy Market Forecast 2020–2030
5.10.1 Current Status of the Chinese Waste-to-Energy Market
5.10.2 Chinese Waste-to-Energy Market Analysis
5.10.3 Major Chinese Waste-to-Energy Projects
5.10.4 Drivers and Restraints in the Chinese Waste-to-Energy Market
5.11 The Japanese Waste-to-Energy Market Forecast 2020–2030
5.11.1 Current Status of Waste-to-Energy in Japan
5.11.2 Japanese Waste-to-Energy Market Analysis
5.11.3 Major Japanese Waste-to-Energy Projects
5.11.4 Drivers and Restraints in the Japanese Waste-to-Energy Market
5.12 The Indian Waste-to-Energy Market Forecast 2020–2030
5.12.1 Current Status of Waste-to-Energy in India
5.12.2 Indian Waste-to-Energy Market Analysis
5.12.3 Major Indian Waste-to-Energy Projects
5.12.4 Drivers and Restraints in the Indian Waste-to-Energy Market
5.13 Rest of Asia Pacific Waste-to-Energy Market Forecast 2020–2030
5.13.1 Rest of Asia-Pacific Waste-to-Energy Facilities and Upcoming Projects
5.13.2 Rest of Asia-Pacific Waste-to-Energy Market Analysis
5.13.3 Analysis of the Current Australian Waste-to-Energy Market
5.13.4 Indonesian Market Outlook
5.13.5 The Waste-to-Energy Potential in Malaysia
5.13.6 Waste-to-Energy Growth Potential in the Philippines
5.13.7 The Waste-to-Energy Market in Singapore
5.13.8 South Korean potential in the Waste-to-Energy market
5.13.9 Will the Taiwanese Market Grow?
5.13.10 Can Thailand’s Waste-to-Energy Market Grow?
5.13.11 Vietnam’s Waste-to-Energy Market
5.14 The US Waste-to-Energy Market Forecast 2020–2030
5.14.1 Current Status of Waste-to-Energy in the US Market
5.14.2 US Waste-to-Energy Market Analysis
5.14.3 Major US Waste-to-Energy Projects
5.14.4 Drivers and Restraints in the US Waste-to-Energy Market
5.15 The Canadian Waste-to-Energy Market Forecast 2020–2030
5.15.1 Current Status of Waste-to-Energy in Canada
5.15.2 Canada Waste-to-Energy Market Analysis
5.15.3 Major Canadian Waste-to-Energy Projects
5.15.4 Drivers and Restraints in the Canadian Waste-to-Energy Market
5.16 Latin America Waste-to-Energy Market 2020–2030
5.16.1 Waste-to-Energy Projects in Latin America
5.16.2 Latin America Waste-to-Energy Market Analysis
5.17 The Middle East & Africa Waste-to-Energy Market 2020–2030
5.17.1 Waste-to-Energy Projects in the Middle East & Africa
5.17.2 The Middle East & Africa Waste-to-Energy Market Analysis
6. PEST Analysis of the Waste-to-Energy Market
6.1 Political Impact
6.2 Economic Impact
6.3 Social Impact
6.4 Technological Impact
7. Leading Companies in Waste-to-Energy Market
7.1 Covanta Energy Corporation
7.1.1 Covanta Company Analysis
7.1.2 Covanta Future Outlook & Business Strategy
7.2 China Everbright International Limited
7.2.1 China Everbright Company Analysis
7.2.2 China Everbright Future Outlook & Business Strategy
7.3 Sembcorp Industries
7.3.1 Sembcorp Industries Company Analysis
7.3.2 Sembcorp Industries Company Outlook
7.4 Suez Environment (SITA)
7.4.1 Suez Environment Company Analysis
7.4.2 Suez Environment Company Outlook
7.5 Keppel Seghers Belgium N.V.
7.5.1 Keppel Seghers Company Analysis
7.5.2 Keppel Seghers Future Outlook & Business Strategy
7.6 Veolia Environmental Services
7.6.1 Veolia Business Overview
7.6.2 Veolia Recent Developments
7.6.3 Veolia Business Strategy
7.7 Wheelabrator
7.7.1 Wheelabrator Business Overview
7.7.2 Wheelabrator Recent Developments
7.7.3 Wheelabrator Business Strategy
7.8 Clean Association of Tokyo 23
7.8.1 Clean Association of Tokyo 23 Business Overview
7.8.2 Clean Association of Tokyo 23 Business Strategy
7.9 MVV Energie AG
7.9.1 MVV Energie AG Business Overview
7.9.2 MVV Energie AG Business Strategy
7.10 China Metallurgical Group (MCC)
7.10.1 China Metallurgical Group (MCC) Business Overview
7.10.2 China Metallurgical Group (MCC) Business Strategy
7.11 Hunan Junxin Environmental Protection
7.11.1 Hunan Junxin Environmental Protection Business Overview
7.11.2 Hunan Junxin Environmental Protection Business Strategy
7.12 GCL-Poly
7.12.1 GCL-Poly Business Overview
7.13 EDF
7.13.1 EDF Business Overview
7.13.2 EDF Business Strategy
7.14 AMEC Foster Wheeler AG (Formerly FOSTER WHEELER AG)
7.14.1 Business Overview
7.14.2 AMEC Forest Wheeler's Product Portfolio
7.15 ANDRITZ AG
7.15.1 Business Overview
7.15.2 ANDRITZ' Product Portfolio
7.16 Arrow Ecology
7.16.1 Business Overview
7.16.2 Arrow Ecology's Product Portfolio
7.17 Babcock & Wilcox Volund A/S
7.17.1 Business Overview
7.17.2 Babcock & Wilson Vølund's Product Portfolio
7.18 Biogas Nord AG
7.18.1 Business Overview
7.18.2 Biogas Nord's Product Portfolio
7.19 Biogen Greenfinch
7.19.1 Biogen's Product Portfolio
7.20 BTA International Gmbh
7.20.1 Business Overview
7.20.2 BTA'S Product Portfolio
8. Waste-to-Energy Patent Analysis
8.1 List of Patents
9. Conclusion & Recommendations
9.1 Recommendations
9.2 Policy Recommendations
10. Glossary
Associated Visiongain Reports
Visiongain Report Sales Order Form
Appendix A
About Visiongain
Appendix B
Visiongain report evaluation form
List of Tables
Table 2.1 Competing Renewable Technologies
Table 3.1 Global Waste to Energy Market Forecast 2020-2030 (MTPA, $ mn, AGR %, CAGR %, Cumulative)
Table 3.2 Global Waste to Energy Market by Regional Forecast 2020-2030 (MTPA, AGR %, CAGR %, Cumulative)
Table 3.3 Global Waste to Energy Market by Regional Forecast 2020-2030 ($mn, AGR %, CAGR %, Cumulative)
Table 3.4 Global Waste to Energy Market Drivers and Restraints
Table 4.1 Global Waste to Energy Market By Type Forecast 2020-2030 ($mn, MTPA, AGR %, Cumulative)
Table 4.2 Key Conventional WtE Suppliers By Type Of Technology
Table 4.3 Key Alternative Thermal WtE Technology Providers With Number Of Plants, Throughput And Technology Configuration
Table 4.4 Comparison Of Conventional Technologies With Alternative Wte Technologies
Table 4.5 Global Thermal Waste to Energy Market by Forecast 2020-2030 ($mn, MTPA, AGR %, CAGR %, Cumulative)
Table 4.6 Global Thermal Waste to Energy Market Drivers and Restraints
Table 4.7 Typical Components Of Biogas And Their Impacts On Biogas Quality
Table 4.8 Potential Of MSW
Table 4.9 Comparison Of Anaerobic And Aerobic Degradation Processes
Table 4.10 Global Biological Waste to Energy Market by Forecast 2020-2030 ($mn, MTPA, AGR %, CAGR %, Cumulative)
Table 4.11 Global Biological WtE Drivers and Restraints
Table 4.12 Global Waste to Energy Market Forecast 2020-2030, by Application ($mn, MTPA, AGR %, Cumulative)
Table 4.13 Global Electricity Generation Waste to Energy Market by Forecast 2020-2030 ($mn, MTPA, AGR %, CAGR %, Cumulative)
Table 4.14 Global Electricity Generation Waste to Energy Market Drivers and Restraints
Table 4.15 Global Steam Exports Waste to Energy Market by Forecast 2020-2030 ($mn, MTPA, AGR %, CAGR %, Cumulative)
Table 4.16 Global Steam Exports WtE Drivers and Restraints
Table 4.17 Global CHP Waste to Energy Market by Forecast 2020-2030 ($mn, MTPA, AGR %, CAGR %, Cumulative)
Table 4.18 Global CHP WtE Drivers and Restraints
Table 5.1 Global Waste-to-Energy Market, by Nation Forecast 2020-2030 ($Mn, AGR %, CAGR %, Cumulative)
Table 5.2 Global Waste-to-Energy Market, by Nation Forecast 2020-2030 (MTPA, AGR %, CAGR %, Cumulative)
Table 5.3 U.K. Waste-to-Energy Market Forecast 2020-2030 ($ mn, Mtpa, AGR %, CAGR %, Cumulative)
Table 5.4 Key U.K. WtE Statistics (Population, Annual MSW Production, Annual MSW Production per Capita, Incineration Rate, Landfill Rate, Recycling/Compost Rate, WtE Facilities, WtE Capacity, New Plants Under Planning / Construction, 2019)
Table 5.5 Projects Awarded Contracts for Difference under Allocation Round One (Project Name, Developer, Technology, MW, £ / $ Strike Price, Delivery Year)
Table 5.6 Key UK WtE Projects (Company, Project Title, TPA Capacity, MW Capacity, $m Investment, Completion Year, Status)
Table 5.7 Driver and Restraints in the U.K. Waste-to-Energy Market
Table 5.8 Polish Waste-to-Energy Market Forecast 2020-2030 ($ mn, Mtpa, AGR %, CAGR %, Cumulative)
Table 5.9 Key Polish WtE Statistics (Population, Annual MSW Production, Annual MSW Production per Capita, Incineration Rate, Landfill Rate, Recycling/Compost Rate, WtE Facilities, WtE Capacity, New Plants Under Planning / Construction)-2019
Table 5.10 Major Polish WtE Projects (Company, Project Title, TPA Capacity, MW Capacity, $m Investment, Completion Year, Status)
Table 5.11 Drivers and Restraints in the Polish Waste-to-Energy Market
Table 5.12 Irish Waste-to-Energy Market Forecast 2020-2030 ($ mn, Mtpa, AGR %, CAGR %, Cumulative)
Table 5.13 Key Irish WtE Statistics (Population, Annual MSW Production, Incineration Rate, Landfill Rate, Recycling/Compost Rate, WtE Facilities, WtE Capacity, New Plants Under Planning / Construction)
Table 5.14 Major Irish WtE Projects (Company, Project Title, TPA Capacity, MW Capacity, $m Investment, Completion Year, Status)
Table 5.15 Danish Waste-to-Energy Market Forecast 2020-2030 ($ mn, Mtpa, AGR %, CAGR %, Cumulative)
Table 5.16 Key Danish WtE Statistics (Population, Annual MSW Production, Incineration Rate, Landfill Rate, Recycling/Compost Rate, WtE Facilities, WtE Capacity, New Plants Under Planning / Construction)
Table 5.17 Major Danish WtE Projects (Company, Project Title, TPA Capacity, MW Capacity, $m Investment, Completion Year, Status)
Table 5.18 Drivers and Restraints in the Danish Waste-to-Energy Market
Table 5.19 Finnish Waste-to-Energy Market Forecast 2020-2030 ($ mn, Mtpa, AGR %, CAGR %, Cumulative)
Table 5.20 Key Finnish WtE Statistics (Population, Annual MSW Production, Incineration Rate, Landfill Rate, Recycling/Compost Rate, WtE Facilities, WtE Capacity, New Plants Under Planning / Construction)
Table 5.21 Major Finnish WtE Projects (Company, Project Title, TPA Capacity, MW Capacity, $m Investment, Completion Year, Status)
Table 5.22 Drivers and Restraints in the Finnish Waste-to-Energy Market
Table 5.23 Italian Waste-to-Energy Market Forecast 2020-2030 ($ mn, Mtpa, AGR %, CAGR %, Cumulative)
Table 5.24 Key Italian WtE Statistics (Population, Annual MSW Production, Incineration Rate, Landfill Rate, Recycling/Compost Rate, WtE Facilities, WtE Capacity, New Plants Under Planning / Construction)
Table 5.25 Major Italian WtE Projects (Company, Project Title, TPA Capacity, MW Capacity, $m Investment, Completion Year, Status)
Table 5.26 Drivers and Restraints in the Italian Waste-to-Energy Market
Table 5.27 Swedish Waste-to-Energy Market Forecast 2020-2030 ($ mn, Mtpa, AGR %, CAGR %, Cumulative)
Table 5.28 Key Swedish WtE Statistics (Population, Annual MSW Production, Incineration Rate, Landfill Rate, Recycling/Compost Rate, WtE Facilities, WtE Capacity, New Plants Under Planning / Construction)
Table 5.29 Major Swedish WtE Projects (Company, Project Title, TPA Capacity, MW Capacity, $m Investment, Completion Year, Status)
Table 5.30 Drivers and Restraints in the Swedish Waste-to-Energy Market
Table 5.31 Czech Republic Waste-to-Energy Market Forecast 2020-2030 ($ mn, Mtpa, AGR %, CAGR %, Cumulative)
Table 5.32 Key Czech WtE Statistics (Population, Annual MSW Production, Incineration Rate, Landfill Rate, Recycling/Compost Rate, WtE Facilities, WtE Capacity, New Plants Under Planning / Construction)
Table 5.33 Major Czech WtE Projects (Company, Project Title, TPA Capacity, MW Capacity, $m Investment, Completion Year, Status)
Table 5.34 Rest of Europe Waste-to-Energy Market Forecast 2020-2030 ($ mn, Mtpa, AGR %, CAGR %, Cumulative)
Table 5.35 Rest of Europe Waste-to-Energy Projects by Country
Table 5.36 German WtE Capacity Changes (Company, Project Title, TPA Capacity, MW Capacity, Work Expected)
Table 5.37 Chinese Waste-to-Energy Market Forecast 2020-2030 ($ mn, Mtpa, AGR %, CAGR %, Cumulative)
Table 5.38 Key Chinese WtE Statistics (Population, Annual MSW Production, Incineration Rate, Landfill Rate, Recycling/Compost Rate, WtE Facilities, WtE Capacity, New Plants Under Planning / Construction)
Table 5.39 Major Chinese WtE Projects (Company, Project Title, TPA Capacity, MW Capacity, $m Investment, Completion Year)
Table 5.40 Drivers and Restraints in the Chinese Waste-to-Energy Market
Table 5.41 Japanese Waste-to-Energy Market Forecast 2020-2030 ($ mn, Mtpa, AGR %, CAGR %, Cumulative)
Table 5.42 Key Japanese WtE Statistics (Population, Annual MSW Production, Annual MSW Production per Capita, Incineration Rate, Landfill Rate, Recycling/Compost Rate, WtE Facilities, WtE Capacity, New Plants Under Planning / Construction)
Table 5.43 Major Japanese WtE Projects (Company, Project Title, TPA Capacity, $m Investment, Completion Year)
Table 5.44 Drivers and Restraints in the Japanese Waste-to-Energy Market
Table 5.45 Indian Waste-to-Energy Market Forecast 2020-2030 ($ mn, Mtpa, AGR %, CAGR %, Cumulative)
Table 5.46 Key Indian WtE Statistics (Population, Annual MSW Production, Annual MSW Production per Capita, Incineration Rate, Landfill Rate, Recycling/Compost Rate, WtE Facilities, WtE Capacity, New Plants Under Planning / Construction)
Table 5.47 Major Indian WtE Projects (Project Title, TPA Capacity, MW Capacity, $m Investment, Completion Year, Status)
Table 5.48 Drivers and Restraints in the Indian Waste-to-Energy Market
Table 5.49 Rest of Asia Pacific Waste-to-Energy Market Forecast 2020-2030 ($ mn, Mtpa, AGR %, CAGR %, Cumulative)
Table 5.50 Rest of Asia-Pacific WtE Projects by Country
Table 5.51 Key Australian WtE Statistics (Population, Annual MSW Production, Incineration Rate, Landfill Rate, Recycling/Compost Rate, WtE Facilities, WtE Capacity, ning / Construction)
Table 5.52 Major Australian WtE Projects (Company, Project Title, TPA Capacity, MW Capacity, $m Investment, Completion Year, Status)
Table 5.53 US Waste-to-Energy Market Forecast 2020-2030 ($ mn, Mtpa, AGR %, CAGR %, Cumulative)
Table 5.54 Key US WtE Statistics (Population, Annual MSW Production, Incineration Rate, Landfill Rate, Recycling/Compost Rate, WtE Facilities, WtE Capacity, Energy Output, New Plants Under Planning / Construction)
Table 5.55 Major US WtE Projects (Company, Project Title, TPA Capacity, $m Investment, Completion Year)
Table 5.56 Drivers and Restraints in the US Waste-to-Energy Market
Table 5.57 Canadian Waste-to-Energy Market Forecast 2020-2030 ($ mn, Mtpa, AGR %, CAGR %, Cumulative)
Table 5.58 Key Canadian WtE Statistics (Population, Annual MSW Production, Incineration Rate, Landfill Rate, Recycling/Compost Rate, WtE Facilities, WtE Capacity, New Plants Under Planning / Construction)
Table 5.59 Major Canadian Waste-to-Energy Projects (Company, Project Title, TPA Capacity, $m Investment, Completion Year)
Table 5.60 Drivers and Restraints in the Canadian Waste-to-Energy Market
Table 5.61 Latin America Waste-to-Energy Market Forecast 2020-2030 ($ mn, Mtpa, AGR %, CAGR %, Cumulative)
Table 5.62 Major WtE Projects in Latin America (Company, Project Title, Country, TPA Capacity, Completion Year, Status)
Table 5.63 The Middle East & Africa Waste-to-Energy Market Forecast 2020-2030 ($ mn, Mtpa, AGR %, CAGR %, Cumulative)
Table 5.64 Major WtE Projects in the Middle East & Africa (Company, Project Title, Country, TPA Capacity, Completion Year, Status)
Table 6.1 PEST Analysis, Waste-to-Energy Market
Table 7.1 Covanta Energy Corporation Profile 2019 (Market Entry, Public/Private, Headquarters, No. of Employees, Total Company Revenue $bn, Change in Revenue, Geography, Key Market, Listed on, Products/Services)
Table 7.2 Covanta Energy Corporation Total Company Revenue 2014-2018 ($bn, AGR %)
Table 7.3 Covanta Energy Waste to Energy Facilities
Table 7.4 China Everbright International Limited Profile 2019 (Market Entry, Public/Private, Headquarters, No. of Employees, Total Company Revenue $bn, Change in Revenue, Geography, Key Market, Listed on, Products/Services)
Table 7.5 China Everbright's Product Portfolio
Table 7.6 China Everbright International Limited Total Company Revenue 2014-2018 ($bn, AGR %)
Table 7.7 China Everbright Waste-to-Energy Projects (Project Name, TPA Capacity, Location, Status, Investment)
Table 7.8 China Everbright Waste-to-Energy Projects (Project Name, TPA Capacity, Location, Status, Investment)
Table 7.9 Sembcorp Industries 2017 (Market Entry, Public/Private, Headquarters, No. of Employees, Total Company Revenue $bn, Change in Revenue, Geography, Key Market, Listed on, Products/Services)
Table 7.10 Suez Environment (SITA) 2019 (Market Entry, Public/Private, Headquarters, No. of Employees, Total Company Revenue $bn, Change in Revenue, Geography, Key Market, Listed on, Products/Services)
Table 7.11 Suez Environment Total Company Revenue 2014-2018 ($bn, AGR %)
Table 7.12 Suez Environment (SITA) Suez Environnement Waste-to-Energy Projects (Project, Country, TPA Capacity, Completion Year)
Table 7.13 Keppel Seghers Belgium N.V. Profile 2019 (Market Entry, Public/Private, Headquarters, Total Company Revenue $bn, Geography, Key Market, Products/Services)
Table 7.14 Keppel Seghers Belgium N.V. Waste-to-Energy Projects (Project Name, Country, TPA Capacity, Completion Year)
Table 7.15 Keppel Seghers Belgium N.V. Company Divisions & Capabilities
Table 7.16 Veolia Environmental Services Profile 2019 (Market Entry, Public/Private, Headquarters, Total Company Revenue $ bn, Change in Revenue, Geography, Key Markets, Listed on, Products/Services)
Table 7.17 Veolia Environmental Services Total Company Revenue 2014-2018 ($bn, AGR %)
Table 7.18 Wheelabrator Profile 2019 (Inception, Public/Private, Headquarters, Geography, Key Markets)
Table 7.19 Wheelabrator WtE Operations: Name, MSW Capacity (tpa)
Table 7.20 Clean Association of Tokyo 23 Profile 2019 (Inception, Public/Private, Headquarters, No. of Employees, Geography, Key Markets)
Table 7.21 MVV Energie AG Profile 2019 (Inception, Public/Private, Headquarters, No. of Employees, Revenue ($bn), Geography, Key Markets)
Table 7.22 China Metallurgical Group (MCC) Profile 2019 (Inception, Public/Private, Headquarters, No. of Employees, Geography, Key Markets)
Table 7.23 Hunan Junxin Environmental Protection Profile 2019 (Inception, Public/Private, Headquarters, Geography, Key Markets)
Table 7.24 GCL-Poly Profile 2019 (Inception, Public/Private, Headquarters, Total Company Sales $ bn, No. of Employees, Geography, Key Markets)
Table 7.25 EDF Profile 2019 (Inception, Public/Private, Headquarters, No. of Employees, Total Company Sales $ bn, Geography, Key Markets)
Table 7.26 AMEC Forest Wheeler’s Product Portfolio
Table 7.27 ANDRITZ' Product Portfolio
Table 7.28 Arrow Ecology's Product Portfolio
Table 7.29 Babcock & Wilson Vølund's Product Portfolio
Table 7.30 Biogas Nord's Product Portfolio
Table 7.31 Biogen's Product Portfolio
Table 7.32 BTA'S Product Portfolio
Table 8.1 U.S. Waste-to-Energy Patent Analysis, 2012-2019
Table 8.2 Europe Waste-to-Energy Patents Analysis, 2012-2019
Table 8.3 Japan Waste-to-Energy Patents Analysis, 2012-2019
List of Figures
Figure 1.1 Waste-To-Energy Cycle
Figure 2.1 Basic Waste-To-Energy Pathways
Figure 2.2 Global Waste to Energy (WtE) Market Segmentation Overview
Figure 3.1 Global Waste to Energy Market Forecast 2020-2030 (MTPA, AGR%)
Figure 3.2 Global Waste to Energy Market Forecast 2020-2030 ($ Mn, AGR %)
Figure 3.3 Regional Waste to Energy Market Forecast 2020-2030 ($Mn)
Figure 3.4 Regional Waste to Energy Market Forecast 2020-2030(MTPA)
Figure 3.5 Global Waste to Energy Market by Regional % Share Forecast 2020, 2025, 2030 (Revenue)
Figure 4.1 Global Waste to Energy Submarket by Type Forecast 2020-2030 ($mn)
Figure 4.2 Global Waste to Energy Market by Type (CAPEX) Share Forecast 2020, 2025, 2030 (% Share)
Figure 4.3 Waste to Energy Market, By Thermal Forecast 2020-2030 ($mn, AGR%)
Figure 4.4 Waste to Energy Market, By Thermal Forecast 2020-2030 (MTPA, AGR%)
Figure 4.5 Thermal Waste to Energy Market, By Type Forecast 2020-2030 ($ mn, AGR%)
Figure 4.6 Thermal Waste to Energy Market, By Type Forecast 2020-2030 (MTPA, AGR%)
Figure 4.7 Thermal Waste to Energy Market, % CAPEX Share by Type (2020)
Figure 4.8 Waste to Energy Market, By Biological Forecast 2020-2030 ($mn, AGR%)
Figure 4.9 Waste to Energy Market, By Biological Forecast 2020-2030 (MTPA, AGR%)
Figure 4.10 Global Waste to Energy Market, Comparison Matrix, by Type VS Region (Comparison Matric)
Figure 4.11 Global Waste to Energy Submarket Forecast 2020-2030, by Application ($mn)
Figure 4.12 Global Waste to Energy Market by Application (CAPEX) Share Forecast 2020, 2025, 2030 (% Share)
Figure 4.13 Waste to Energy Market, By Electricity Generation Forecast 2020-2030 ($mn, AGR%)
Figure 4.14 Waste to Energy Market, By Electricity Generation Forecast 2020-2030 (MTPA, AGR%)
Figure 4.15 Waste to Energy Market, By Steam Exports Forecast 2020-2030 ($mn, AGR%)
Figure 4.16 Waste to Energy Market, By Steam Exports Forecast 2020-2030 (MTPA, AGR%)
Figure 4.17 Waste to Energy Market, By CHP Forecast 2020-2030 ($mn, AGR%)
Figure 4.18 Waste to Energy Market, By CHP Forecast 2020-2030 (MTPA, AGR%)
Figure 4.19 Global Waste to Energy Market, Comparison Matrix, by Application VS Region (Comparison Matrix)
Figure 5.1 Global Waste to Energy Market Forecast by Leading Nations, 2020-2030, CAPEX ($Mn)
Figure 5.2 Global Waste to Energy Market Forecast by Leading Nations, 2020-2030, Capacity (MTPA)
Figure 5.3 Leading Country/Regional Waste to Energy Market Share Forecast 2020 (% Share)
Figure 5.4 Leading Country/Regional Waste to Energy Market Share Forecast 2025 (% Share)
Figure 5.5 Leading Country/Regional Waste to Energy Market Share Forecast 2030 (% Share)
Figure 5.6 U.K. Waste-to-Energy Market, by CAPEX Forecast 2020-2030 ($ Mn, AGR %)
Figure 5.7 U.K. Waste-to-Energy Market, by Capacity Forecast 2020-2030 (Mtpa)
Figure 5.8 U.K. Municipal Waste To Landfill 2010-2017 (Thousand Tonnes)
Figure 5.9 U.K. Waste-to-Energy Market Share Forecast 2020, 2025, 2030 (% Share)
Figure 5.10 UK Waste to Energy Market, by Type, 2020
Figure 5.11 U.K. Waste Hierarchy
Figure 5.12 Polish Waste-to-Energy Market, by CAPEX Forecast 2020-2030 ($ Mn, AGR %)
Figure 5.13 Polish Waste-to-Energy Market, by Capacity Forecast 2020-2030 (Mtpa)
Figure 5.14 Polish Waste-to-Energy Market Share Forecast 2020, 2025, 2030 (% Share)
Figure 5.15 Polish Waste to Energy Market, by Type, 2019
Figure 5.16 Irish Waste-to-Energy Market, by CAPEX Forecast 2020-2030 ($ Mn, AGR %)
Figure 5.17 Irish Waste-to-Energy Market, by Capacity Forecast 2020-2030 (Mtpa)
Figure 5.18 Irish Waste-to-Energy Market Share Forecast 2020, 2025, 2030 (% Share)
Figure 5.19 Irish Waste to Energy Market, by Type, 2019
Figure 5.20 Danish Waste-to-Energy Market, by CAPEX Forecast 2020-2030 ($ Mn, AGR %)
Figure 5.21 Danish Waste-to-Energy Market, by Capacity Forecast 2020-2030 (Mtpa)
Figure 5.22 Danish Waste-to-Energy Market Share Forecast 2020, 2025, 2030 (% Share)
Figure 5.23 Danish Waste to Energy Market, by Type, 2019
Figure 5.24 Finnish Waste-to-Energy Market, by CAPEX Forecast 2020-2030 ($ Mn, AGR %)
Figure 5.25 Finnish Waste-to-Energy Market, by Capacity Forecast 2020-2030 (Mtpa)
Figure 5.26 Finnish Waste-to-Energy Market Share Forecast 2020, 2025, 2030 (% Share)
Figure 5.27 Finnish Waste to Energy Market, by Type, 2019
Figure 5.28 Italian Waste-to-Energy Market, by CAPEX Forecast 2020-2030 ($ Mn, AGR %)
Figure 5.29 Italian Waste-to-Energy Market, by Capacity Forecast 2020-2030 (Mtpa)
Figure 5.30 Italian Waste-to-Energy Market Share Forecast 2020, 2025, 2030 (% Share)
Figure 5.31 Italy Waste to Energy Market, by Type, 2019
Figure 5.32 Swedish Waste-to-Energy Market, by CAPEX Forecast 2020-2030 ($ Mn, AGR %)
Figure 5.33 Swedish Waste-to-Energy Market, by Capacity Forecast 2020-2030 (Mtpa)
Figure 5.34 Swedish Waste-to-Energy Market Share Forecast 2020, 2025, 2030 (% Share)
Figure 5.35 Sweden Waste to Energy Market, by Type, 2019
Figure 5.36 Czech Republic Waste-to-Energy Market, by CAPEX Forecast 2020-2030 ($ Mn, AGR %)
Figure 5.37 Czech Republic Waste-to-Energy Market, by Capacity Forecast 2020-2030 (Mtpa)
Figure 5.38 Czech Republic Waste-to-Energy Market Share Forecast 2020, 2025, 2030 (% Share)
Figure 5.39 Czech Republic Waste to Energy Market, by Type, 2019
Figure 5.40 Rest of Europe Waste-to-Energy Market, by CAPEX Forecast 2020-2030 ($ Mn, AGR %)
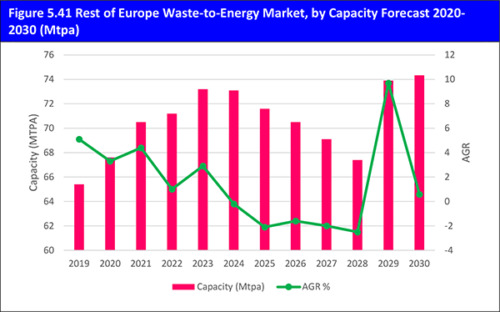
Figure 5.41 Rest of Europe Waste-to-Energy Market, by Capacity Forecast 2020-2030 (Mtpa)
Figure 5.42 Rest of Europe Waste-to-Energy Market Share Forecast 2020, 2025, 2030 (% Share)
Figure 5.43 Chinese Waste-to-Energy Market, by CAPEX Forecast 2020-2030 ($ Mn, AGR %)
Figure 5.44 Chinese Waste-to-Energy Market, by Capacity Forecast 2020-2030 (Mtpa)
Figure 5.45 Chinese Waste-to-Energy Market Share Forecast 2020, 2025, 2030 (% Share)
Figure 5.46 Chinese Waste to Energy Market, by Type, 2019
Figure 5.47 Japanese Waste-to-Energy Market, by CAPEX Forecast 2020-2030 ($ Mn, AGR %)
Figure 5.48 Japanese Waste-to-Energy Market, by Capacity Forecast 2020-2030 (Mtpa)
Figure 5.49 Japanese Waste-to-Energy Market Share Forecast 2020, 2025, 2030 (% Share)
Figure 5.50 Japan Waste to Energy Market, by Type, 2019
Figure 5.51 Indian Waste-to-Energy Market, by CAPEX Forecast 2020-2030 ($ Mn, AGR %)
Figure 5.52 Indian Waste-to-Energy Market, by Capacity Forecast 2020-2030 (Mtpa)
Figure 5.53 Indian Waste-to-Energy Market Share Forecast 2020, 2025, 2030 (% Share)
Figure 5.54 Indian Waste to Energy Market, by Type, 2019
Figure 5.55 Rest of Asia Pacific Waste-to-Energy Market, by CAPEX Forecast 2020-2030 ($ Mn, AGR %)
Figure 5.56 Rest of Asia Pacific Waste-to-Energy Market, by Capacity Forecast 2020-2030 (Mtpa)
Figure 5.57 Rest of Asia Pacific Waste-to-Energy Market Share Forecast 2020, 2025, 2030 (% Share)
Figure 5.58 Rest of Asia Pacific Waste to Energy Market, by Type, 2019
Figure 5.59 US Waste-to-Energy Market, by CAPEX Forecast 2020-2030 ($ Mn, AGR %)
Figure 5.60 US Waste-to-Energy Market, by Capacity Forecast 2020-2030 (Mtpa)
Figure 5.61 US Waste-to-Energy Market Share Forecast 2020, 2025, 2030 (% Share)
Figure 5.62 U.S. Waste to Energy Market, by Type, 2019
Figure 5.63 Canadian Waste-to-Energy Market, by CAPEX Forecast 2020-2030 ($ Mn, AGR%)
Figure 5.64 Canadian Waste-to-Energy Market, by Capacity Forecast 2020-2030 (Mtpa)
Figure 5.65 Canadian Waste-to-Energy Market Share Forecast 2020, 2025, 2030 (% Share)
Figure 5.66 Canada Waste to Energy Market, by Type, 2019
Figure 5.67 Latin America Waste-to-Energy Market, by CAPEX Forecast 2020-2030 ($ Mn, AGR %)
Figure 5.68 Latin America Waste-to-Energy Market, by Capacity Forecast 2020-2030 (Mtpa)
Figure 5.69 Latin America Waste-to-Energy Market Share Forecast 2020, 2025, 2030 (% Share)
Figure 5.70 Latin America Waste to Energy Market, by Type, 2019
Figure 5.71 The Middle East & Africa Waste-to-Energy Market, by CAPEX Forecast 2020-2030 ($ Mn, AGR %)
Figure 5.72 The Middle East & Africa Waste-to-Energy Market, by Capacity Forecast 2020-2030 (Mtpa)
Figure 5.73 The Middle East & Africa Waste-to-Energy Market Share Forecast 2020, 2025, 2030 (% Share)
Figure 5.74 The Middle East & Africa Waste to Energy Market, by Type, 2019
Figure 7.1 Covanta Energy Corporation Revenue % Share, by Operating Segment, 2018
Figure 7.2 Covanta Energy Corporation Revenue % Share, by Waste & Services Revenue Breakup, 2018
Figure 7.3 Covanta Energy Corporation Total Company Revenue, ($bn & AGR %), 2014-2018
Figure 7.4 China Everbright International Limited Revenue % Share, by Business Segment, 2018
Figure 7.5 China Everbright International Limited Total Company Revenue ($bn & AGR %) 2014-2018
Figure 7.6 Sembcorp Industries Revenue % Share, by Business Segment, 2018
Figure 7.7 Sembcorp Industries Revenue % Share, by Geography Segment, 2018
Figure 7.8 Sembcorp Industries Revenue % Share, Capacity (MW), by Power Plant Type, 2018
Figure 7.9 Suez Environment (SITA) Revenue % Share, by Geographical Segment, 2018
Figure 7.10 Suez Environment (SITA) Total Company Revenue ($bn & AGR %), 2014-2018
Figure 7.11 Veolia Environmental Services Total Company Revenue ($bn & AGR %), 2014-2018
Figure 7.12 Veolia Environmental Services Revenue % Share, by Geographical Segment, 2018
Figure 7.13 MVV Energie AG, Electricity Generation Source 2018
Figure 7.14 MVV Energie AG, Installed Capacity (MW), by Source 2018
Figure 7.15 MVV Energie AG, Sales, by Regional Segment, 2018
Figure 7.16 MVV Energie AG, Sales, by Business Segment, 2018
Figure 7.17 GCL-Poly, by Sales, 2018 (% Share)
Figure 9.1 Global Waste-to-Energy Market Forecast 2020-2030 ($ mn, AGR %)
Figure 9.2 Global Waste-to-Energy Market Forecast 2020-2030 (MTPA, AGR %)

