The Bioenergy Market Report 2023-2033: This report will prove invaluable to leading firms striving for new revenue pockets if they wish to better understand the industry and its underlying dynamics. It will be useful for companies that would like to expand into different industries or to expand their existing operations in a new region.
Developments in Waste-to-Energy Technologies Driving Market Growth
Emerging waste-to-energy technologies have the potential to significantly impact the bioenergy market by increasing demand and making bioenergy more cost-effective. These innovative technologies focus on converting various types of waste into energy, thereby addressing both waste management challenges and renewable energy generation. New technologies such as anaerobic digestion, gasification, and pyrolysis are being developed and optimized to enhance energy conversion efficiency, increase process reliability, and reduce emissions. Some of the examples of waste-to-energy technologies include anaerobic digestion, incineration, gasification, pyrolysis, plasma gasification, waste-to-liquid (WTL) technologies, solid recovered fuel (SRF) production.
WTL technologies, such as the production of biofuels from waste or biomass, have seen advancements in terms of process efficiency, feedstock flexibility, and fuel quality. Research and commercial projects are exploring the use of various feedstocks and refining techniques to produce sustainable liquid fuels. DuPont in collaboration with National Renewable Energy Laboratory (NREL) are working with to design equipment for running tests and engineered a bacteria strain that efficiently converts sugars from plants into cellulosic ethanol. Such developments are expected to augment market demand.
Extensive Usage of Conventional Fuels in Heating and Transportation
Solar, wind, hydropower, geothermal, and tidal energy are some of the alternatives to bioenergy. These alternatives to bioenergy offer diverse options for generating clean and sustainable energy, and their suitability depends on factors such as geographic location, resource availability, and specific energy requirements. It is often a combination of these renewable energy sources that helps meet the energy demands of different regions and contribute to a more sustainable energy future. Global renewable energy capacity rose 10% in 2022. Wind and solar power accounted for 90% of the net additions, and almost half of the new capacity was added in Asia. The increasing demand for these renewable sources of energy is expected to hamper the bioenergy market, which is still in the development stage.
What Questions Should You Ask before Buying a Market Research Report?
• How is the bioenergy market evolving?
• What is driving and restraining the bioenergy market?
• How will each bioenergy submarket segment grow over the forecast period and how much revenue will these submarkets account for in 2033?
• How will the market shares for each bioenergy submarket develop from 2023 to 2033?
• What will be the main driver for the overall market from 2023 to 2033?
• Will leading bioenergy markets broadly follow the macroeconomic dynamics, or will individual national markets outperform others?
• How will the market shares of the national markets change by 2033 and which geographical region will lead the market in 2033?
• Who are the leading players and what are their prospects over the forecast period?
• What are the bioenergy projects for these leading companies?
• How will the industry evolve during the period between 2023 and 2033? What are the implications of bioenergy projects taking place now and over the next 10 years?
• Is there a greater need for product commercialisation to further scale the bioenergy market?
• Where is the bioenergy market heading and how can you ensure you are at the forefront of the market?
• What are the best investment options for new product and service lines?
• What are the key prospects for moving companies into a new growth path and C-suite?
You need to discover how this will impact the bioenergy market today, and over the next 10 years:
• Our 290-page report provides 142 tables and 152 charts/graphs exclusively to you.
• The report highlights key lucrative areas in the industry so you can target them – NOW.
• It contains in-depth analysis of global, regional and national sales and growth.
• It highlights for you the key successful trends, changes and revenue projections made by your competitors.
This report tells you TODAY how the bioenergy market will develop in the next 10 years, and in line with the variations in COVID-19 economic recession and bounce. This market is more critical now than at any point over the last 10 years.
Forecasts to 2033 and other analyses reveal commercial prospects
• In addition to revenue forecasting to 2033, our new study provides you with recent results, growth rates, and market shares.
• You will find original analyses, with business outlooks and developments.
• Discover qualitative analyses (including market dynamics, drivers, opportunities, restraints and challenges), cost structure, impact of rising bioenergy prices and recent developments.
This report includes data analysis and invaluable insight into how COVID-19 will affect the industry and your company. Four COVID-19 recovery patterns and their impact, namely, “V”, “L”, “W” and “U” are discussed in this report.
Segments Covered in the Report
Product Type Outlook
• Solid Biomass
• Liquid Biofuel
• Biogas
Feedstock
• Agricultural Waste
• Wood Waste
• Municipal Waste
• Others
Application
• Heat & Power
• Transportation

In addition to the revenue predictions for the overall world market and segments, you will also find revenue forecasts for five regional and 20 leading national markets:
North America
• U.S.
• Canada
Europe
• Germany
• UK
• Sweden
• France
• Italy
• Finland
• Denmark
• Rest of Europe
Asia Pacific
• China
• Japan
• India
• Japan
• Thailand
• Indonesia
• South Korea
• Rest of Asia Pacific
Latin America
• Brazil
• Mexico
• Argentina
• Rest of Latin America
MEA
• GCC
• Africa
• Rest of MEA
Need industry data? Please contact us today.
The report also includes profiles and for some of the leading companies in the Bioenergy Market, 2023 to 2033, with a focus on this segment of these companies’ operations.
Leading companies and the potential for market growth
• Ameresco, Inc.
• Archer-Daniels-Midland Co
• Bioenergy Devco
• Biomass Secure Power Inc
• BP p.l.c.
• Cargill, Incorporated
• Chevron Corporation
• Cosan S.A.
• Drax Group PLC
• Enerkem Inc.
• EnviTec Biogas AG
• Enviva Inc.
• Neste Oyj
• Novozymes A/S
• Oersted A/S
Overall world revenue for Bioenergy Market, 2023 to 2033 in terms of value the market will surpass US$714.3 billion in 2023, our work calculates. We predict strong revenue growth through to 2033. Our work identifies which organizations hold the greatest potential. Discover their capabilities, progress, and commercial prospects, helping you stay ahead.
How will the Bioenergy Market, 2023 to 2033 report help you?
In summary, our 290-page report provides you with the following knowledge:
• Revenue forecasts to 2033 for Bioenergy Market, 2023 to 2033 Market, with forecasts for product type, feedstock, and application, each forecast at a global and regional level – discover the industry’s prospects, finding the most lucrative places for investments and revenues.
• Revenue forecasts to 2033 for five regional and 5 key national markets – See forecasts for the Bioenergy Market, 2023 to 2033 market in North America, Europe, Asia-Pacific, Latin America, and MEA. Also forecasted is the market in the US, Canada, Mexico, Brazil, Germany, France, UK, Italy, China, India, Japan, and Indonesia among other prominent economies.
• Prospects for established firms and those seeking to enter the market – including company profiles for 15 of the major companies involved in the Bioenergy Market, 2023 to 2033.
Find quantitative and qualitative analyses with independent predictions. Receive information that only our report contains, staying informed with invaluable business intelligence.
Information found nowhere else
With our new report, you are less likely to fall behind in knowledge or miss out on opportunities. See how our work could benefit your research, analyses, and decisions. Visiongain’s study is for everybody needing commercial analyses for the Bioenergy Market, 2023 to 2033, market-leading companies. You will find data, trends and predictions.
To access the data contained in this document please email contactus@visiongain.com
Buy our report today Bioenergy Market Report 2023-2033: Forecasts by Product Type (Solid Biomass, Liquid Biofuel, Biogas), by Feedstock (Agricultural Waste, Wood Waste, Municipal Waste, Others), by Application (Heat & Power, Transportation) AND Regional and Leading National Market Analysis PLUS Analysis of Leading Companies AND COVID-19 Impact and Recovery Pattern Analysis. Avoid missing out by staying informed – order our report now.
Visiongain is a trading partner with the US Federal Government
CCR Ref number: KD4R6
Do you have any custom requirements we can help you with? Any need for a specific country, geo region, market segment or specific company information? Contact us today, we can discuss your needs and see how we can help: contactus@visiongain.com
1 Report Overview
1.1 Objectives of the Study
1.2 Introduction to Bioenergy Market
1.3 What This Report Delivers
1.4 Why You Should Read This Report
1.5 Key Questions Answered by This Analytical Report
1.6 Who is This Report for?
1.7 Methodology
1.7.1 Market Definitions
1.7.2 Market Evaluation & Forecasting Methodology
1.7.3 Data Validation
1.7.3.1 Primary Research
1.7.3.2 Secondary Research
1.8 Frequently Asked Questions (FAQs)
1.9 Associated Visiongain Reports
1.10 About Visiongain
2 Executive Summary
3 Market Overview
3.1 Key Findings
3.2 Market Dynamics
3.2.1 Market Driving Factors
3.2.1.1 Rising Adoption & Utilization of Green Energy among Industries
3.2.1.2 Concerns on Waste Management and Need for Circular Economy
3.2.1.3 Favourable Government Policies Promoting Clean Energy
3.2.2 Market Restraining Factors
3.2.2.1 Growing demand for Alternate Renewable and Clean Energy
3.2.2.2 Volatile Supply and Availability of Feedstock
3.2.2.3 Lack of Appropriate Infrastructure to Support Growth of Bioenergy
3.2.3 Market Opportunities
3.2.3.1 Developments in Waste-to-Energy Technologies
3.2.3.2 Government Grants to Promote Advancements in the Bioenergy Field
3.2.3.3 Growing Adoption of Biodiesel in the Transportation sector
3.3 COVID-19 Impact Analysis
3.4 Porter’s Five Forces Analysis
3.4.1 Bargaining Power of Suppliers (Medium to High)
3.4.2 Bargaining Power of Buyers (Medium to High)
3.4.3 Competitive Rivalry (Medium to High)
3.4.4 Threat from Substitutes (High)
3.4.5 Threat of New Entrants (Low to Medium)
3.5 PEST Analysis
4 Bioenergy Market Analysis by Product Type
4.1 Key Findings
4.2 Product Type Segment: Market Attractiveness Index
4.3 Bioenergy Market Size Estimation and Forecast by Product Type
4.4 Solid Biomass
4.4.1 Market Size by Region, 2023-2033 (US$ Billion)
4.4.2 Market Share by Region, 2023 & 2033 (%)
4.5 Liquid Biofuel
4.5.1 Market Size by Region, 2023-2033 (US$ Billion)
4.5.2 Market Share by Region, 2023 & 2033 (%)
4.6 Biogas
4.6.1 Market Size by Region, 2023-2033 (US$ Billion)
4.6.2 Market Share by Region, 2023 & 2033 (%)
5 Bioenergy Market Analysis by Feedstock
5.1 Key Findings
5.2 Feedstock Segment: Market Attractiveness Index
5.3 Bioenergy Market Size Estimation and Forecast by Feedstock
5.4 Agricultural Waste
5.4.1 Market Size by Region, 2023-2033 (US$ Billion)
5.4.2 Market Share by Region, 2023 & 2033 (%)
5.5 Wood Waste
5.5.1 Market Size by Region, 2023-2033 (US$ Billion)
5.5.2 Market Share by Region, 2023 & 2033 (%)
5.6 Municipal Waste
5.6.1 Market Size by Region, 2023-2033 (US$ Billion)
5.6.2 Market Share by Region, 2023 & 2033 (%)
5.7 Others
5.7.1 Market Size by Region, 2023-2033 (US$ Billion)
5.7.2 Market Share by Region, 2023 & 2033 (%)
6 Bioenergy Market Analysis by Application
6.1 Key Findings
6.2 Application Segment: Market Attractiveness Index
6.3 Bioenergy Market Size Estimation and Forecast by Application
6.4 Heat & Power
6.4.1 Market Size by Region, 2023-2033 (US$ Billion)
6.4.2 Market Share by Region, 2023 & 2033 (%)
6.5 Transportation
6.5.1 Market Size by Region, 2023-2033 (US$ Billion)
6.5.2 Market Share by Region, 2023 & 2033 (%)
7 Bioenergy Market Analysis by Region
7.1 Key Findings
7.2 Regional Market Size Estimation and Forecast
8 North America Bioenergy Market Analysis
8.1 Key Findings
8.2 North America Bioenergy Market Attractiveness Index
8.3 North America Bioenergy Market by Country, 2023, 2028 & 2033 (US$ Billion)
8.4 North America Bioenergy Market Size Estimation and Forecast by Country
8.5 North America Bioenergy Market Size Estimation and Forecast by Product Type
8.6 North America Bioenergy Market Size Estimation and Forecast by Feedstock
8.7 North America Bioenergy Market Size Estimation and Forecast by Application
8.8 U.S. Bioenergy Market Analysis
8.9 Canada Bioenergy Market Analysis
9 Europe Bioenergy Market Analysis
9.1 Key Findings
9.2 Europe Bioenergy Market Attractiveness Index
9.3 Europe Bioenergy Market by Country, 2023, 2028 & 2033 (US$ Billion)
9.4 Europe Bioenergy Market Size Estimation and Forecast by Country
9.5 Europe Bioenergy Market Size Estimation and Forecast by Product Type
9.6 Europe Bioenergy Market Size Estimation and Forecast by Feedstock
9.7 Europe Bioenergy Market Size Estimation and Forecast by Application
9.8 Germany Bioenergy Market Analysis
9.9 UK Bioenergy Market Analysis
9.10 Sweden Bioenergy Market Analysis
9.11 Italy Bioenergy Market Analysis
9.12 Finland Bioenergy Market Analysis
9.13 Denmark Bioenergy Market Analysis
9.14 France Bioenergy Market Analysis
9.15 Rest of Europe Bioenergy Market Analysis
10 Asia Pacific Bioenergy Market Analysis
10.1 Key Findings
10.2 Asia Pacific Bioenergy Market Attractiveness Index
10.3 Asia Pacific Bioenergy Market by Country, 2023, 2028 & 2033 (US$ Billion)
10.4 Asia Pacific Bioenergy Market Size Estimation and Forecast by Country
10.5 Asia Pacific Bioenergy Market Size Estimation and Forecast by Product Type
10.6 Asia Pacific Bioenergy Market Size Estimation and Forecast by Feedstock
10.7 Asia Pacific Bioenergy Market Size Estimation and Forecast by Application
10.8 China Bioenergy Market Analysis
10.9 India Bioenergy Market Analysis
10.10 Japan Bioenergy Market Analysis
10.11 Thailand Bioenergy Market Analysis
10.12 Indonesia Bioenergy Market Analysis
10.13 South Korea Bioenergy Market Analysis
10.14 Rest of Asia Pacific Bioenergy Market Analysis
11 Latin America Bioenergy Market Analysis
11.1 Key Findings
11.2 Latin America Bioenergy Market Attractiveness Index
11.3 Latin America Bioenergy Market by Country, 2023, 2028 & 2033 (US$ Billion)
11.4 Latin America Bioenergy Market Size Estimation and Forecast by Country
11.5 Latin America Bioenergy Market Size Estimation and Forecast by Product Type
11.6 Latin America Bioenergy Market Size Estimation and Forecast by Feedstock
11.7 Latin America Bioenergy Market Size Estimation and Forecast by Application
11.8 Brazil Bioenergy Market Analysis
11.9 Mexico Bioenergy Market Analysis
11.10 Argentina Bioenergy Market Analysis
11.11 Rest of Latin America Bioenergy Market Analysis
12 Middle East & Africa Bioenergy Market Analysis
12.1 Key Findings
12.2 Middle East & Africa Bioenergy Market Attractiveness Index
12.3 Middle East & Africa Bioenergy Market by Country, 2023, 2028 & 2033 (US$ Billion)
12.4 Middle East & Africa Bioenergy Market Size Estimation and Forecast by Country
12.5 Middle East & Africa Bioenergy Market Size Estimation and Forecast by Product Type
12.6 Middle East & Africa Bioenergy Market Size Estimation and Forecast by Feedstock
12.7 Middle East & Africa Bioenergy Market Size Estimation and Forecast by Application
12.8 GCC Bioenergy Market Analysis
12.9 Africa Bioenergy Market Analysis
12.10 Rest of Middle East & Africa Bioenergy Market Analysis
13 Company Profiles
13.1 Competitive Landscape, 2022
13.2 Strategic Outlook
13.3 Ameresco, Inc.
13.3.1 Company Snapshot
13.3.2 Company Overview
13.3.3 Financial Analysis
13.3.3.1 Net Revenue, 2017-2022
13.3.3.2 Regional Market Shares, 2022
13.3.4 Product Benchmarking
13.3.5 Strategic Outlook
13.4 Archer-Daniels-Midland Co
13.4.1 Company Snapshot
13.4.2 Company Overview
13.4.3 Financial Analysis
13.4.3.1 Net Revenue, 2017-2022
13.4.3.2 R&D, 2017-2022
13.4.3.3 Regional Market Shares, 2022
13.4.4 Product Benchmarking
13.4.5 Strategic Outlook
13.5 Biomass Secure Power Inc
13.5.1 Company Snapshot
13.5.2 Company Overview
13.5.3 Product Benchmarking
13.5.4 Strategic Outlook
13.6 Bioenergy Devco
13.6.1 Company Snapshot
13.6.2 Company Overview
13.6.3 Product Benchmarking
13.6.4 Strategic Outlook
13.7 BP p.l.c.
13.7.1 Company Snapshot
13.7.2 Company Overview
13.7.3 Financial Analysis
13.7.3.1 Net Revenue, 2017-2022
13.7.3.2 R&D, 2017-2022
13.7.3.3 Regional Market Shares, 2022
13.7.4 Product Benchmarking
13.7.5 Strategic Outlook
13.8 Cargill, Incorporated
13.8.1 Company Snapshot
13.8.2 Company Overview
13.8.3 Product Benchmarking
13.8.4 Strategic Outlook
13.9 Chevron Corporation
13.9.1 Company Snapshot
13.9.2 Company Overview
13.9.3 Financial Analysis
13.9.3.1 Net Revenue, 2017-2022
13.9.3.2 R&D, 2017-2022
13.9.3.3 Regional Market Shares, 2022
13.9.4 Product Benchmarking
13.9.5 Strategic Outlook
13.10 Cosan S.A.
13.10.1 Company Snapshot
13.10.2 Company Overview
13.10.3 Financial Analysis
13.10.3.1 Net Revenue, 2017-2022
13.10.4 Product Benchmarking
13.10.5 Strategic Outlook
13.11 Drax Group PLC
13.11.1 Company Snapshot
13.11.2 Company Overview
13.11.3 Financial Analysis
13.11.3.1 Net Revenue, 2017-2022
13.11.3.2 R&D, 2017-2022
13.11.3.3 Regional Market Shares, 2022
13.11.4 Product Benchmarking
13.11.5 Strategic Outlook
13.12 Enviva Inc.
13.12.1 Company Snapshot
13.12.2 Company Overview
13.12.3 Financial Analysis
13.12.3.1 Net Revenue, 2017-2022
13.12.4 Product Benchmarking
13.12.5 Strategic Outlook
13.13 EnviTec Biogas AG
13.13.1 Company Snapshot
13.13.2 Company Overview
13.13.3 Financial Analysis
13.13.3.1 Net Revenue, 2017-2022
13.13.3.2 R&D, 2017-2022
13.13.3.3 Regional Market Shares, 2022
13.13.4 Product Benchmarking
13.13.5 Strategic Outlook
13.14 Enerkem Inc.
13.14.1 Company Snapshot
13.14.2 Company Overview
13.14.3 Product Benchmarking
13.14.4 Strategic Outlook
13.15 Neste Oyj
13.15.1 Company Snapshot
13.15.2 Company Overview
13.15.3 Financial Analysis
13.15.3.1 Net Revenue, 2017-2022
13.15.3.2 R&D, 2017-2022
13.15.3.3 Regional Market Shares, 2022
13.15.4 Product Benchmarking
13.15.5 Strategic Outlook
13.16 Novozymes A/S
13.16.1 Company Snapshot
13.16.2 Company Overview
13.16.3 Financial Analysis
13.16.3.1 Net Revenue, 2017-2022
13.16.3.2 R&D, 2017-2022
13.16.3.3 Regional Market Shares, 2022
13.16.4 Product Benchmarking
13.16.5 Strategic Outlook
13.17 Oersted A/S
13.17.1 Company Snapshot
13.17.2 Company Overview
13.17.3 Financial Analysis
13.17.3.1 Net Revenue, 2017-2022
13.17.3.2 R&D, 2017-2022
13.17.3.3 Regional Market Shares, 2022
13.17.4 Product Benchmarking
13.17.5 Strategic Outlook
14 Conclusion and Recommendations
14.1 Concluding Remarks from Visiongain
14.2 Recommendations for Market Players
List of Tables
Table 1 Bioenergy Market Snapshot, 2023 & 2033 (US$ Billion, CAGR %)
Table 2 Bioenergy Market Snapshot, 2023 & 2033 (Electricity Capacity: MW, CAGR %)
Table 3 Bioenergy Market Forecast by Region, 2023-2033 (US$ Billion, AGR%, CAGR%): “V” Shaped Recovery
Table 4 Bioenergy Market Forecast by Region, 2023-2033 (US$ Billion, AGR%, CAGR%): “U” Shaped Recovery
Table 5 Bioenergy Market Forecast by Region, 2023-2033 (US$ Billion, AGR%, CAGR%): “W” Shaped Recovery
Table 6 Bioenergy Market Forecast by Region, 2023-2033 (US$ Billion, AGR%, CAGR%): “L” Shaped Recovery
Table 7 Bioenergy Market Forecast by Product Type, 2023-2033 (US$ Billion, AGR%, CAGR%)
Table 8 Solid Biomass Segment Market Forecast by Region, 2023-2033 (US$ Billion, AGR%, CAGR%)
Table 9 Liquid Biofuel Segment Market Forecast by Region, 2023-2033 (US$ Billion, AGR%, CAGR%)
Table 10 Biogas Segment Market Forecast by Region, 2023-2033 (US$ Billion, AGR%, CAGR%)
Table 11 Bioenergy Market Forecast by Feedstock, 2023-2033 (US$ Billion, AGR%, CAGR%)
Table 12 Agricultural Waste Segment Market Forecast by Region, 2023-2033 (US$ Billion, AGR%, CAGR%)
Table 13 Wood Waste Segment Market Forecast by Region, 2023-2033 (US$ Billion, AGR%, CAGR%)
Table 14 Municipal Waste Segment Market Forecast by Region, 2023-2033 (US$ Billion, AGR%, CAGR%)
Table 15 Others Segment Market Forecast by Region, 2023-2033 (US$ Billion, AGR%, CAGR%)
Table 16 Bioenergy Market Forecast by Application, 2023-2033 (US$ Billion, AGR%, CAGR%)
Table 17 Heat & Power Segment Market Forecast by Region, 2023-2033 (US$ Billion, AGR%, CAGR%)
Table 18 Transportation Segment Market Forecast by Region, 2023-2033 (US$ Billion, AGR%, CAGR%)
Table 19 Bioenergy Market Forecast by Region, 2023-2033 (US$ Billion, AGR%, CAGR%)
Table 20 Bioenergy Market Forecast by Region, 2023-2033 (Electricity Capacity: MW, AGR%, CAGR%)
Table 21 North America Bioenergy Market Forecast by Country, 2023-2033 (Electricity Capacity: MW, AGR%, CAGR%)
Table 22 North America Bioenergy Market Forecast by Country, 2023-2033 (US$ Billion, AGR%, CAGR%)
Table 23 North America Bioenergy Market Forecast by Product Type, 2023-2033 (US$ Billion, AGR%, CAGR%)
Table 24 North America Bioenergy Market Forecast by Feedstock, 2023-2033 (US$ Billion, AGR%, CAGR%)
Table 25 North America Bioenergy Market Forecast by Application, 2023-2033 (US$ Billion, AGR%, CAGR%)
Table 26 U.S. Bioenergy Market Forecast, 2023-2033 (Electricity Capacity: MW, AGR%, CAGR%)
Table 27 U.S. Bioenergy Market Forecast, 2023-2033 (US$ Billion, AGR%, CAGR%)
Table 28 Canada Bioenergy Market Forecast, 2023-2033 (Electricity Capacity: MW, AGR%, CAGR%)
Table 29 Canada Bioenergy Market Forecast, 2023-2033 (US$ Billion, AGR%, CAGR%)
Table 30 Europe Bioenergy Market Forecast by Country, 2023-2033 (Electricity Capacity: MW, AGR%, CAGR%)
Table 31 Europe Bioenergy Market Forecast by Country, 2023-2033 (US$ Billion, AGR%, CAGR%)
Table 32 Europe Bioenergy Market Forecast by Product Type, 2023-2033 (US$ Billion, AGR%, CAGR%)
Table 33 Europe Bioenergy Market Forecast by Feedstock, 2023-2033 (US$ Billion, AGR%, CAGR%)
Table 34 Europe Bioenergy Market Forecast by Application, 2023-2033 (US$ Billion, AGR%, CAGR%)
Table 35 Germany Bioenergy Market Forecast, 2023-2033 (Electricity Capacity: MW, AGR%, CAGR%)
Table 36 Germany Bioenergy Market Forecast, 2023-2033 (US$ Billion, AGR%, CAGR%)
Table 37 UK Bioenergy Market Forecast, 2023-2033 (Electricity Capacity: MW, AGR%, CAGR%)
Table 38 UK Bioenergy Market Forecast, 2023-2033 (US$ Billion, AGR%, CAGR%)
Table 39 Sweden Bioenergy Market Forecast, 2023-2033 (Electricity Capacity: MW, AGR%, CAGR%)
Table 40 Sweden Bioenergy Market Forecast, 2023-2033 (US$ Billion, AGR%, CAGR%)
Table 41 Italy Bioenergy Market Forecast, 2023-2033 (Electricity Capacity: MW, AGR%, CAGR%)
Table 42 Italy Bioenergy Market Forecast, 2023-2033 (US$ Billion, AGR%, CAGR%)
Table 43 Finland Bioenergy Market Forecast, 2023-2033 (Electricity Capacity: MW, AGR%, CAGR%)
Table 44 Finland Bioenergy Market Forecast, 2023-2033 (US$ Billion, AGR%, CAGR%)
Table 45 Denmark Bioenergy Market Forecast, 2023-2033 (Electricity Capacity: MW, AGR%, CAGR%)
Table 46 Denmark Bioenergy Market Forecast, 2023-2033 (US$ Billion, AGR%, CAGR%)
Table 47 France Bioenergy Market Forecast, 2023-2033 (Electricity Capacity: MW, AGR%, CAGR%)
Table 48 France Bioenergy Market Forecast, 2023-2033 (US$ Billion, AGR%, CAGR%)
Table 49 Rest of Europe Bioenergy Market Forecast, 2023-2033 (Electricity Capacity: MW, AGR%, CAGR%)
Table 50 Rest of Europe Bioenergy Market Forecast, 2023-2033 (US$ Billion, AGR%, CAGR%)
Table 51 Asia Pacific Bioenergy Market Forecast by Country, 2023-2033 (Electricity Capacity: MW, AGR%, CAGR%)
Table 52 Asia Pacific Bioenergy Market Forecast by Country, 2023-2033 (US$ Billion, AGR%, CAGR%)
Table 53 Asia Pacific Bioenergy Market Forecast by Product Type, 2023-2033 (US$ Billion, AGR%, CAGR%)
Table 54 Asia Pacific Bioenergy Market Forecast by Feedstock, 2023-2033 (US$ Billion, AGR%, CAGR%)
Table 55 Asia Pacific Bioenergy Market Forecast by Application, 2023-2033 (US$ Billion, AGR%, CAGR%)
Table 56 China Bioenergy Market Forecast, 2023-2033 (Electricity Capacity: MW, AGR%, CAGR%)
Table 57 China Bioenergy Market Forecast, 2023-2033 (US$ Billion, AGR%, CAGR%)
Table 58 India Bioenergy Market Forecast, 2023-2033 (Electricity Capacity: MW, AGR%, CAGR%)
Table 59 India Bioenergy Market Forecast, 2023-2033 (US$ Billion, AGR%, CAGR%)
Table 60 Japan Bioenergy Market Forecast, 2023-2033 (Electricity Capacity: MW, AGR%, CAGR%)
Table 61 Japan Bioenergy Market Forecast, 2023-2033 (US$ Billion, AGR%, CAGR%)
Table 62 Thailand Bioenergy Market Forecast, 2023-2033 (Electricity Capacity: MW, AGR%, CAGR%)
Table 63 Thailand Bioenergy Market Forecast, 2023-2033 (US$ Billion, AGR%, CAGR%)
Table 64 Indonesia Bioenergy Market Forecast, 2023-2033 (Electricity Capacity: MW, AGR%, CAGR%)
Table 65 Indonesia Bioenergy Market Forecast, 2023-2033 (US$ Billion, AGR%, CAGR%)
Table 66 South Korea Bioenergy Market Forecast, 2023-2033 (Electricity Capacity: MW, AGR%, CAGR%)
Table 67 South Korea Bioenergy Market Forecast, 2023-2033 (US$ Billion, AGR%, CAGR%)
Table 68 Rest of Asia Pacific Bioenergy Market Forecast, 2023-2033 (Electricity Capacity: MW, AGR%, CAGR%)
Table 69 Rest of Asia Pacific Bioenergy Market Forecast, 2023-2033 (US$ Billion, AGR%, CAGR%)
Table 70 Latin America Bioenergy Market Forecast by Country, 2023-2033 (Electricity Capacity: MW, AGR%, CAGR%)
Table 71 Latin America Bioenergy Market Forecast by Country, 2023-2033 (US$ Billion, AGR%, CAGR%)
Table 72 Latin America Bioenergy Market Forecast by Product Type, 2023-2033 (US$ Billion, AGR%, CAGR%)
Table 73 Latin America Bioenergy Market Forecast by Feedstock, 2023-2033 (US$ Billion, AGR%, CAGR%)
Table 74 Latin America Bioenergy Market Forecast by Application, 2023-2033 (US$ Billion, AGR%, CAGR%)
Table 75 Brazil Bioenergy Market Forecast, 2023-2033 (Electricity Capacity: MW, AGR%, CAGR%)
Table 76 Brazil Bioenergy Market Forecast, 2023-2033 (US$ Billion, AGR%, CAGR%)
Table 77 Mexico Bioenergy Market Forecast, 2023-2033 (Electricity Capacity: MW, AGR%, CAGR%)
Table 78 Mexico Bioenergy Market Forecast, 2023-2033 (US$ Billion, AGR%, CAGR%)
Table 79 Argentina Bioenergy Market Forecast, 2023-2033 (Electricity Capacity: MW, AGR%, CAGR%)
Table 80 Argentina Bioenergy Market Forecast, 2023-2033 (US$ Billion, AGR%, CAGR%)
Table 81 Rest of Latin America Bioenergy Market Forecast, 2023-2033 (Electricity Capacity: MW, AGR%, CAGR%)
Table 82 Rest of Latin America Bioenergy Market Forecast, 2023-2033 (US$ Billion, AGR%, CAGR%)
Table 83 Middle East & Africa Bioenergy Market Forecast by Country, 2023-2033 (Electricity Capacity: MW, AGR%, CAGR%)
Table 84 Middle East & Africa Bioenergy Market Forecast by Country, 2023-2033 (US$ Billion, AGR%, CAGR%)
Table 85 Middle East & Africa Bioenergy Market Forecast by Product Type, 2023-2033 (US$ Billion, AGR%, CAGR%)
Table 86 Middle East & Africa Bioenergy Market Forecast by Feedstock, 2023-2033 (US$ Billion, AGR%, CAGR%)
Table 87 Middle East & Africa Bioenergy Market Forecast by Application, 2023-2033 (US$ Billion, AGR%, CAGR%)
Table 88 GCC Bioenergy Market Forecast, 2023-2033 (Electricity Capacity: MW, AGR%, CAGR%)
Table 89 GCC Bioenergy Market Forecast, 2023-2033 (US$ Billion, AGR%, CAGR%)
Table 90 Africa Bioenergy Market Forecast, 2023-2033 (Electricity Capacity: MW, AGR%, CAGR%)
Table 91 Africa Bioenergy Market Forecast, 2023-2033 (US$ Billion, AGR%, CAGR%)
Table 92 Rest of Middle East & Africa Bioenergy Market Forecast, 2023-2033 (Electricity Capacity: MW, AGR%, CAGR%)
Table 93 Rest of Middle East & Africa Bioenergy Market Forecast, 2023-2033 (US$ Billion, AGR%, CAGR%)
Table 94 Strategic Outlook – Mergers & Acquisitions
Table 95 Strategic Outlook – Contracts, Agreements, and Joint Ventures
Table 96 Strategic Outlook – Expansion and Investments
Table 97 Strategic Outlook – New Product Launch
Table 98 Ameresco, Inc: Key Details, (CEO, HQ, Revenue, Founded, No. of Employees, Company Type, Website, Business Segment)
Table 99 Ameresco, Inc: Product Benchmarking
Table 100 Ameresco, Inc: Strategic Outlook
Table 101 Archer-Daniels-Midland Co: Key Details, (CEO, HQ, Revenue, Founded, No. of Employees, Company Type, Website, Business Segment)
Table 102 Archer-Daniels-Midland Co: Product Benchmarking
Table 103 Archer-Daniels-Midland Co: Strategic Outlook
Table 104 Biomass Secure Power Inc: Key Details, (CEO, HQ, Revenue, Founded, No. of Employees, Company Type, Website, Business Segment)
Table 105 Biomass Secure Power Inc: Product Benchmarking
Table 106 Biomass Secure Power Inc: Strategic Outlook
Table 107 Bioenergy Devco: Key Details, (CEO, HQ, Founded, No. of Employees, Company Type, Website, Business Segment)
Table 108 Bioenergy Devco: Product Benchmarking
Table 109 Bioenergy Devco: Strategic Outlook
Table 110 BP p.l.c.: Key Details, (CEO, HQ, Revenue, Founded, No. of Employees, Company Type, Website, Business Segment)
Table 111 BP p.l.c.: Product Benchmarking
Table 112 BP p.l.c.: Strategic Outlook
Table 113 Cargill, Incorporated: Key Details, (CEO, HQ, Revenue, Founded, No. of Employees, Company Type, Website, Business Segment)
Table 114 Cargill, Incorporated: Product Benchmarking
Table 115 Cargill, Incorporated: Strategic Outlook
Table 116 Chevron Corporation: Key Details, (CEO, HQ, Revenue, Founded, No. of Employees, Company Type, Website, Business Segment)
Table 117 Chevron Corporation: Product Benchmarking
Table 118 Chevron Corporation: Strategic Outlook
Table 119 Cosan S.A.: Key Details, (CEO, HQ, Revenue, Founded, No. of Employees, Company Type, Website, Business Segment)
Table 120 Cosan S.A.: Product Benchmarking
Table 121 Cosan S.A.: Strategic Outlook
Table 122 Drax Group PLC: Key Details, (CEO, HQ, Revenue, Founded, No. of Employees, Company Type, Website, Business Segment)
Table 123 Drax Group PLC: Product Benchmarking
Table 124 Drax Group: Strategic Outlook
Table 125 Enviva Inc.: Key Details, (CEO, HQ, Revenue, Founded, No. of Employees, Company Type, Website, Business Segment)
Table 126 Enviva Inc.: Product Benchmarking
Table 127 Enviva Inc.: Strategic Outlook
Table 128 EnviTec Biogas AG: Key Details, (CEO, HQ, Revenue, Founded, No. of Employees, Company Type, Website, Business Segment)
Table 129 EnviTec Biogas AG: Product Benchmarking
Table 130 EnviTec Biogas AG: Strategic Outlook
Table 131 Enerkem Inc.: Key Details, (CEO, HQ, Founded, Company Type, Website, Business Segment)
Table 132 Enerkem Inc.: Product Benchmarking
Table 133 Enerkem Inc.: Strategic Outlook
Table 134 Neste Oyj: Key Details, (CEO, HQ, Revenue, Founded, No. of Employees, Company Type, Website, Business Segment)
Table 135 Neste Oyj: Product Benchmarking
Table 136 Neste Oyj: Strategic Outlook
Table 137 Novozymes A/S: Key Details, (CEO, HQ, Revenue, Founded, No. of Employees, Company Type, Website, Business Segment)
Table 138 Novozymes A/S: Product Benchmarking
Table 139 Novozymes A/S: Strategic Outlook
Table 140 Oersted A/S: Key Details, (CEO, HQ, Revenue, Founded, No. of Employees, Company Type, Website, Business Segment)
Table 141 Oersted A/S: Product Benchmarking
Table 142 Oersted A/S: Strategic Outlook
List of Figures
Figure 1 Bioenergy Market Segmentation
Figure 2 Bioenergy Market by Product Type: Market Attractiveness Index
Figure 3 Bioenergy Market by Feedstock: Market Attractiveness Index
Figure 4 Bioenergy Market by Application: Market Attractiveness Index
Figure 5 Bioenergy Market Attractiveness Index by Region
Figure 6 Bioenergy Market: Market Dynamics
Figure 7 Renewable Electricity Capacity, Electricity Capacity (MW)
Figure 8 Bioenergy Market by Region, 2023-2033 (US$ Billion, AGR %): “V” Shaped Recovery
Figure 9 Bioenergy Market by Region, 2023-2033 (US$ Billion, AGR %): “U” Shaped Recovery
Figure 10 Bioenergy Market by Region, 2023-2033 (US$ Billion, AGR %): “W” Shaped Recovery
Figure 11 Bioenergy Market by Region, 2023-2033 (US$ Billion, AGR %): “L” Shaped Recovery
Figure 12 Bioenergy Market: Porter’s Five Forces Analysis
Figure 13 Bioenergy Market: PEST Analysis
Figure 14 Bioenergy Market by Product Type: Market Attractiveness Index
Figure 15 Bioenergy Market Forecast by Product Type, 2023-2033 (US$ Billion, AGR %)
Figure 16 Bioenergy Market Share Forecast by Product Type, 2023, 2028, 2033 (%)
Figure 17 Solid Biomass Segment Market Forecast by Region, 2023-2033 (US$ Billion, AGR %)
Figure 18 Solid Biomass Segment Market Share Forecast by Region, 2023 & 2033 (%)
Figure 19 Liquid Biofuel Segment Market Forecast by Region, 2023-2033 (US$ Billion, AGR %)
Figure 20 Liquid Biofuel Segment Market Share Forecast by Region, 2023 & 2033 (%)
Figure 21 Biogas Segment Market Forecast by Region, 2023-2033 (US$ Billion, AGR %)
Figure 22 Biogas Segment Market Share Forecast by Region, 2023 & 2033 (%)
Figure 23 Bioenergy Market by Feedstock: Market Attractiveness Index
Figure 24 Bioenergy Market Forecast by Feedstock, 2023-2033 (US$ Billion, AGR %)
Figure 25 Bioenergy Market Share Forecast by Feedstock, 2023, 2028, 2033 (%)
Figure 26 Agricultural Waste Segment Market Forecast by Region, 2023-2033 (US$ Billion, AGR %)
Figure 27 Agricultural Waste Segment Market Share Forecast by Region, 2023 & 2033 (%)
Figure 28 Wood Waste Segment Market Forecast by Region, 2023-2033 (US$ Billion, AGR %)
Figure 29 Wood Waste Segment Market Share Forecast by Region, 2023 & 2033 (%)
Figure 30 Municipal Waste Segment Market Forecast by Region, 2023-2033 (US$ Billion, AGR %)
Figure 31 Municipal Waste Segment Market Share Forecast by Region, 2023 & 2033 (%)
Figure 32 Others Segment Market Forecast by Region, 2023-2033 (US$ Billion, AGR %)
Figure 33 Others Segment Market Share Forecast by Region, 2023 & 2033 (%)
Figure 34 Bioenergy Market by Application: Market Attractiveness Index
Figure 35 Bioenergy Market Forecast by Application, 2023-2033 (US$ Billion, AGR %)
Figure 36 Bioenergy Market Share Forecast by Application, 2023, 2028, 2033 (%)
Figure 37 Heat & Power Segment Market Forecast by Region, 2023-2033 (US$ Billion, AGR %)
Figure 38 Heat & Power Segment Market Share Forecast by Region, 2023 & 2033 (%)
Figure 39 Transportation Segment Market Forecast by Region, 2023-2033 (US$ Billion, AGR %)
Figure 40 Transportation Segment Market Share Forecast by Region, 2023 & 2033 (%)
Figure 41 Bioenergy Market Forecast by Region 2023 and 2033 (Revenue, CAGR%)
Figure 42 Bioenergy Market Share Forecast by Region 2023, 2028, 2033 (%)
Figure 43 Bioenergy Market by Region, 2023-2033 (US$ Billion, AGR %)
Figure 44 Bioenergy Market by Region, 2023-2033 (Electricity Capacity: MW, AGR %)
Figure 45 North America Bioenergy Market Attractiveness Index
Figure 46 North America Bioenergy Market by Region, 2023, 2028 & 2033 (US$ Billion)
Figure 47 North America Bioenergy Market Forecast by Country, 2023-2033 Electricity Capacity: MW, AGR %)
Figure 48 North America Bioenergy Market Forecast by Country, 2023-2033 (US$ Billion, AGR %)
Figure 49 North America Bioenergy Market Share Forecast by Country, 2023 & 2033 (%)
Figure 50 North America Bioenergy Market Forecast by Product Type, 2023-2033 (US$ Billion, AGR %)
Figure 51 North America Bioenergy Market Share Forecast by Product Type, 2023 & 2033 (%)
Figure 52 North America Bioenergy Market Forecast by Feedstock, 2023-2033 (US$ Billion, AGR %)
Figure 53 North America Bioenergy Market Share Forecast by Feedstock, 2023 & 2033 (%)
Figure 54 North America Bioenergy Market Forecast by Application, 2023-2033 (US$ Billion, AGR %)
Figure 55 North America Bioenergy Market Share Forecast Application, 2023 & 2033 (%)
Figure 56 U.S. Bioenergy Market Forecast, 2023-2033 (US$ Billion, AGR %)
Figure 57 Canada Bioenergy Market Forecast, 2023-2033 (US$ Billion, AGR %)
Figure 58 Europe Bioenergy Market Attractiveness Index
Figure 59 Europe Bioenergy Market by Region, 2023, 2028 & 2033 (US$ Billion)
Figure 60 Europe Bioenergy Market Forecast by Country, 2023-2033 Electricity Capacity: MW, AGR %)
Figure 61 Europe Bioenergy Market Forecast by Country, 2023-2033 (US$ Billion, AGR %)
Figure 62 Europe Bioenergy Market Share Forecast by Country, 2023 & 2033 (%)
Figure 63 Europe Bioenergy Market Forecast by Product Type, 2023-2033 (US$ Billion, AGR %)
Figure 64 Europe Bioenergy Market Share Forecast by Product Type, 2023 & 2033 (%)
Figure 65 Europe Bioenergy Market Forecast by Feedstock, 2023-2033 (US$ Billion, AGR %)
Figure 66 Europe Bioenergy Market Share Forecast by Feedstock, 2023 & 2033 (%)
Figure 67 Europe Bioenergy Market Forecast by Application, 2023-2033 (US$ Billion, AGR %)
Figure 68 Europe Bioenergy Market Share Forecast Application, 2023 & 2033 (%)
Figure 69 Germany Bioenergy Market Forecast, 2023-2033 (US$ Billion, AGR %)
Figure 70 UK Bioenergy Market Forecast, 2023-2033 (US$ Billion, AGR %)
Figure 71 Sweden Bioenergy Market Forecast, 2023-2033 (US$ Billion, AGR %)
Figure 72 Italy Bioenergy Market Forecast, 2023-2033 (US$ Billion, AGR %)
Figure 73 Finland Bioenergy Market Forecast, 2023-2033 (US$ Billion, AGR %)
Figure 74 Denmark Bioenergy Market Forecast, 2023-2033 (US$ Billion, AGR %)
Figure 75 France Bioenergy Market Forecast, 2023-2033 (US$ Billion, AGR %)
Figure 76 Rest of Europe Bioenergy Market Forecast, 2023-2033 (US$ Billion, AGR %)
Figure 77 Asia Pacific Bioenergy Market Attractiveness Index
Figure 78 Asia Pacific Bioenergy Market by Region, 2023, 2028 & 2033 (US$ Billion)
Figure 79 Asia Pacific Bioenergy Market Forecast by Country, 2023-2033 Electricity Capacity: MW, AGR %)
Figure 80 Asia Pacific Bioenergy Market Forecast by Country, 2023-2033 (US$ Billion, AGR %)
Figure 81 Asia Pacific Bioenergy Market Share Forecast by Country, 2023 & 2033 (%)
Figure 82 Asia Pacific Bioenergy Market Forecast by Product Type, 2023-2033 (US$ Billion, AGR %)
Figure 83 Asia Pacific Bioenergy Market Share Forecast by Product Type, 2023 & 2033 (%)
Figure 84 Asia Pacific Bioenergy Market Forecast by Feedstock, 2023-2033 (US$ Billion, AGR %)
Figure 85 Asia Pacific Bioenergy Market Share Forecast by Feedstock, 2023 & 2033 (%)
Figure 86 Asia Pacific Bioenergy Market Forecast by Application, 2023-2033 (US$ Billion, AGR %)
Figure 87 Asia Pacific Bioenergy Market Share Forecast Application, 2023 & 2033 (%)
Figure 88 China Bioenergy Market Forecast, 2023-2033 (US$ Billion, AGR %)
Figure 89 India Bioenergy Market Forecast, 2023-2033 (US$ Billion, AGR %)
Figure 90 Japan Bioenergy Market Forecast, 2023-2033 (US$ Billion, AGR %)
Figure 91 Thailand Bioenergy Market Forecast, 2023-2033 (US$ Billion, AGR %)
Figure 92 Indonesia Bioenergy Market Forecast, 2023-2033 (US$ Billion, AGR %)
Figure 93 South Korea Bioenergy Market Forecast, 2023-2033 (US$ Billion, AGR %)
Figure 94 Rest of Asia Pacific Bioenergy Market Forecast, 2023-2033 (US$ Billion, AGR %)
Figure 95 Latin America Bioenergy Market Attractiveness Index
Figure 96 Latin America Bioenergy Market by Region, 2023, 2028 & 2033 (US$ Billion)
Figure 97 Latin America Bioenergy Market Forecast by Country, 2023-2033 Electricity Capacity: MW, AGR %)
Figure 98 Latin America Bioenergy Market Forecast by Country, 2023-2033 (US$ Billion, AGR %)
Figure 99 Latin America Bioenergy Market Share Forecast by Country, 2023 & 2033 (%)
Figure 100 Latin America Bioenergy Market Forecast by Product Type, 2023-2033 (US$ Billion, AGR %)
Figure 101 Latin America Bioenergy Market Share Forecast by Product Type, 2023 & 2033 (%)
Figure 102 Latin America Bioenergy Market Forecast by Feedstock, 2023-2033 (US$ Billion, AGR %)
Figure 103 Latin America Bioenergy Market Share Forecast by Feedstock, 2023 & 2033 (%)
Figure 104 Latin America Bioenergy Market Forecast by Application, 2023-2033 (US$ Billion, AGR %)
Figure 105 Latin America Bioenergy Market Share Forecast Application, 2023 & 2033 (%)
Figure 106 Brazil Bioenergy Market Forecast, 2023-2033 (US$ Billion, AGR %)
Figure 107 Mexico Bioenergy Market Forecast, 2023-2033 (US$ Billion, AGR %)
Figure 108 Argentina Bioenergy Market Forecast, 2023-2033 (US$ Billion, AGR %)
Figure 109 Rest of Latin America Bioenergy Market Forecast, 2023-2033 (US$ Billion, AGR %)
Figure 110 Middle East & Africa Bioenergy Market Attractiveness Index
Figure 111 Middle East & Africa Bioenergy Market by Region, 2023, 2028 & 2033 (US$ Billion)
Figure 112 Middle East & Africa Bioenergy Market Forecast by Country, 2023-2033 Electricity Capacity: MW, AGR %)
Figure 113 Middle East & Africa Bioenergy Market Forecast by Country, 2023-2033 (US$ Billion, AGR %)
Figure 114 Middle East & Africa Bioenergy Market Share Forecast by Country, 2023 & 2033 (%)
Figure 115 Middle East & Africa Bioenergy Market Forecast by Product Type, 2023-2033 (US$ Billion, AGR %)
Figure 116 Middle East & Africa Bioenergy Market Share Forecast by Product Type, 2023 & 2033 (%)
Figure 117 Middle East & Africa Bioenergy Market Forecast by Feedstock, 2023-2033 (US$ Billion, AGR %)
Figure 118 Middle East & Africa Bioenergy Market Share Forecast by Feedstock, 2023 & 2033 (%)
Figure 119 Middle East & Africa Bioenergy Market Forecast by Application, 2023-2033 (US$ Billion, AGR %)
Figure 120 Middle East & Africa Bioenergy Market Share Forecast Application, 2023 & 2033 (%)
Figure 121 GCC Bioenergy Market Forecast, 2023-2033 (US$ Billion, AGR %)
Figure 122 Africa Bioenergy Market Forecast, 2023-2033 (US$ Billion, AGR %)
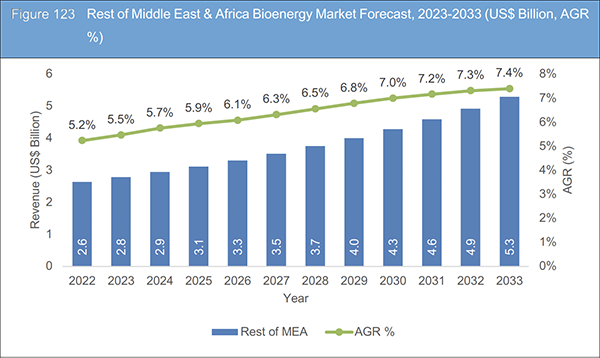
Figure 123 Rest of Middle East & Africa Bioenergy Market Forecast, 2023-2033 (US$ Billion, AGR %)
Figure 124 Bioenergy Market: Company Share, 2022
Figure 125 Ameresco, Inc: Net Revenue, 2017-2022 (US$ Billion, AGR%)
Figure 126 Ameresco, Inc: Regional Market Shares, 2022
Figure 127 Archer-Daniels-Midland Co: Net Revenue, 2017-2022 (US$ Billion, AGR%)
Figure 128 Archer-Daniels-Midland Co: R&D, 2017-2022 (US$ Billion, AGR%)
Figure 129 Archer-Daniels-Midland Co: Regional Market Shares, 2022
Figure 130 BP p.l.c.: Net Revenue, 2017-2022 (US$ Billion, AGR%)
Figure 131 BP p.l.c.: R&D, 2017-2022 (US$ Billion, AGR%)
Figure 132 BP p.l.c.: Regional Market Shares, 2022
Figure 133 Chevron Corporation: Net Revenue, 2017-2022 (US$ Billion, AGR%)
Figure 134 Chevron Corporation: R&D, 2017-2022 (US$ Billion, AGR%)
Figure 135 Chevron Corporation: Regional Market Shares, 2022
Figure 136 Cosan S.A.: Net Revenue, 2017-2022 (US$ Billion, AGR%)
Figure 137 Drax Group PLC: Net Revenue, 2017-2022 (US$ Billion, AGR%)
Figure 138 Drax Group PLC: R&D, 2017-2022 (US$ Billion, AGR%)
Figure 139 Drax Group PLC: Regional Market Shares, 2022
Figure 140 Enviva Inc.: Net Revenue, 2017-2022 (US$ Billion, AGR%)
Figure 141 EnviTec Biogas AG: Net Revenue, 2017-2022 (US$ Billion, AGR%)
Figure 142 EnviTec Biogas AG: R&D, 2017-2022 (US$ Billion, AGR%)
Figure 143 EnviTec Biogas AG: Regional Market Shares, 2022
Figure 144 Neste Oyj: Net Revenue, 2017-2022 (US$ Billion, AGR%)
Figure 145 Neste Oyj: R&D, 2017-2022 (US$ Billion, AGR%)
Figure 146 Neste Oyj: Regional Market Shares, 2022
Figure 147 Novozymes A/S: Net Revenue, 2017-2022 (US$ Billion, AGR%)
Figure 148 Novozymes A/S: R&D, 2017-2022 (US$ Billion, AGR%)
Figure 149 Novozymes A/S: Regional Market Shares, 2022
Figure 150 Oersted A/S: Net Revenue, 2017-2022 (US$ Billion, AGR%)
Figure 151 Oersted A/S: R&D, 2017-2022 (US$ Billion, AGR%)
Figure 152 Oersted A/S: Regional Market Shares, 2022
List of Companies Profiled in the Report
Ameresco, Inc.
Archer-Daniels-Midland Co
Bioenergy Devco
Biomass Secure Power Inc
BP p.l.c.
Cargill, Incorporated
Chevron Corporation
Cosan S.A.
Drax Group PLC
Enerkem Inc.
EnviTec Biogas AG
Enviva Inc.
Neste Oyj
Novozymes A/S
Oersted A/S
List of Other Companies Mentioned in the Report
A2A SpA
ACCIONA Energía, S.A.
Aceitera General Deheza S.A.
Adkins Energy, LLC
Air Liquide, S.A.
Ajman Sewerage (Pvt) Co. Ltd
Anaergia Company
Andritz AG
Bangchak Corporation
Baynouna Solar Energy Company (BSCE)
BESIX Middle East LLC
BorgWarner Inc.
BP plc
BTS Bioenergy, LLC
BTS Biogas S.A.
CEF Group (China Energy Fund)
Chevron Singapore Pte Ltd
CleanEnergy Systems, Inc.
DuPont de Nemours, Inc.
Ecopetrol S.A.
Ecospray GmbH
Ence Biogas, S.A.
Ence-Energía y Celulosa, S.A.
Enel Green Power SpA
Eni SpA
EnviTec Biogas AG
Envo Biogas Inc.
Eurowind Energy A/S
Fenaka Corporation Limited
Fulcrum BioEnergy, LLC
FutureEnergy Group, Inc.
Gecelca S.A.
Gevo, Inc.
Göteborg Energi AB
Gree Energy Group
Greenlane Renewables Inc.
Harvest Midstream LLC
HASI Corporation
ITOCHU Corporation
Itochu Enex Co. Ltd.
Joensuu Biocoal Oy
JSW Cement Limited
Lenzing AG
LG Chem Ltd.
Lignol Energy Corporation
Liqvis GmbH
Lootah Biofuels
MaderaGas S.A.
Medco Group
Meridiam Infrastructure S.A.
Microsoft Corporation
Molinos Río de la Plata S.A.I.C.
Mote Company, Inc.
Mubadala Investment Company
NewAfrica Impact Ltd
Nippon Yusen Kabushiki Kaisha (NYK)
Nopalimex, S.A. de C.V.
NOVUS Wood Group, LLC
Nuseed Pty Ltd
NYK Group
Oleaginosa Moreno Hermanos (OMH)
Orient Overseas Container Line Ltd
Pacific Ethanol, Inc.
Poet, LLC
Polska Grupa Biogazowa Sp. z o.o.
POLYTECHNIK Holding AG
Preem AB
PTT Public Company Limited
Punjab Renewable Energy Systems Pvt. Ltd
Raízen Energia S.A.
Raven SR Inc.
Red Sea Development Company
Renewable Energy Group, Inc.
Renewable.bio
Renova S.A.
Repsol, S.A.
revis bioenergy GmbH
Roeslein Alternative Energy, LLC
Ruhe Group
Saudi Arabian Refineries Company (SARCO)
Schlumberger New Energy, LLC
SGC Energy Co., Ltd.
Shin-Nippon Kaiyosha Corporation
Siemens Energy AG
Södra Cell AB
Stockholm Exergi AB
Swiss Krono Group AG
Taaleri Plc
Takachar Private Limited
Technip Energies N.V.
TotalEnergies SE
Toyofuji Shipping Co., Ltd.
Toyota Tsusho Corporation
Universal Biofuels, Inc.
Valmet Corporation
Vattenfall AB
Velocys, Inc.
Verdalia Bioenergy, Inc.
Vicentin S.A.
World Fuel Services, Inc.
ZEG Biogás e Energia S.A.
List of Associations Mentioned in the Report
Asociación Agraria Jóvenes Agricultores (ASAJA)
Brazil Ministry of Mines and Energy (MME)
Canadian Agricultural Partnership (CAP)
Clean Energy Fund (CEF)
Dubai Municipality (DM)
European Union (EU)
Innovate UK
International Energy Agency (IEA)
International Renewable Energy Agency (IRENA)
Meadow Lake Tribal Council (MLTC)
National Biofuels Board (NBB)
National Renewable Energy Laboratory (NREL)
Pacific Northwest National Laboratory (PNNL)
Philippine Coconut Authority (PCA)
Renewable Fuels Association (RFA)
U.S. Department of Energy Bioenergy Technologies Office (BETO) [DOE BETO]
U.S. Environmental Protection Agency (EPA)
U.S. Grains Council (USGC)
UK Research and Innovation (UKRI)
UN Framework Convention on Climate Change (UNFCCC)