The Reactor Cooling Systems Market Report 2023-2033: This report will prove invaluable to leading firms striving for new revenue pockets if they wish to better understand the industry and its underlying dynamics. It will be useful for companies that would like to expand into different industries or to expand their existing operations in a new region.
Meeting the Global Energy Appetite Safely and Sustainably
The escalating global demand for electricity, fuelled by rapid urbanization, industrialization, and digitalization, is compelling nations to explore diverse energy sources. Nuclear power generation offers a reliable and low-carbon solution to meet this demand, which in turn fuels the expansion of the reactor cooling systems market. Reactor cooling systems play a pivotal role in maintaining the safety and efficiency of nuclear power plants, ensuring a consistent supply of clean energy. As the energy demand continues to rise, the need for efficient cooling systems that prevent reactor overheating becomes even more crucial.
Powering the Future with Clean and Efficient Nuclear Energy
Numerous countries are embracing nuclear energy to achieve their energy security and environmental goals. As countries invest in the construction of new nuclear power plants and the modernization of existing facilities, the demand for advanced reactor cooling systems experiences a notable upsurge. These systems are vital to ensuring optimal reactor performance, mitigating overheating risks, and managing waste heat effectively. As nuclear energy infrastructure expands, the reactor cooling systems market gains momentum due to the increased demand for reliable cooling solutions that maintain safety and operational efficiency.
What Questions Should You Ask before Buying a Market Research Report?
• How is the reactor cooling systems market evolving?
• What is driving and restraining the reactor cooling systems market?
• How will each reactor cooling systems submarket segment grow over the forecast period and how much revenue will these submarkets account for in 2033?
• How will the market shares for each reactor cooling systems submarket develop from 2023 to 2033?
• What will be the main driver for the overall market from 2023 to 2033?
• Will leading reactor cooling systems markets broadly follow the macroeconomic dynamics, or will individual national markets outperform others?
• How will the market shares of the national markets change by 2033 and which geographical region will lead the market in 2033?
• Who are the leading players and what are their prospects over the forecast period?
• What are the reactor cooling systems projects for these leading companies?
• How will the industry evolve during the period between 2023 and 2033? What are the implications of reactor cooling systems projects taking place now and over the next 10 years?
• Is there a greater need for product commercialisation to further scale the reactor cooling systems market?
• Where is the reactor cooling systems market heading and how can you ensure you are at the forefront of the market?
• What are the best investment options for new product and service lines?
• What are the key prospects for moving companies into a new growth path and C-suite?
You need to discover how this will impact the reactor cooling systems market today, and over the next 10 years:
• Our 359-page report provides 138 tables and 208 charts/graphs exclusively to you.
• The report highlights key lucrative areas in the industry so you can target them – NOW.
• It contains in-depth analysis of global, regional and national sales and growth.
• It highlights for you the key successful trends, changes and revenue projections made by your competitors.
This report tells you TODAY how the reactor cooling systems market will develop in the next 10 years, and in line with the variations in COVID-19 economic recession and bounce. This market is more critical now than at any point over the last 10 years.
Forecasts to 2033 and other analyses reveal commercial prospects
• In addition to revenue forecasting to 2033, our new study provides you with recent results, growth rates, and market shares.
• You will find original analyses, with business outlooks and developments.
• Discover qualitative analyses (including market dynamics, drivers, opportunities, restraints and challenges), cost structure, impact of rising reactor cooling systems prices and recent developments.
This report includes data analysis and invaluable insight into how COVID-19 will affect the industry and your company. Four COVID-19 recovery patterns and their impact, namely, “V”, “L”, “W” and “U” are discussed in this report.
Segments Covered in the Report
Market Segment by Capacity
• Small/Medium Reactor
• Large Reactor
Market Segment by Configuration
• Once-Through Cooling
• Closed-Cycle Cooling
• Hybrid Cooling
Market Segment by Mechanism
• Direct Cooling
• Indirect Cooling
• Passive Cooling
• Active Cooling
Market Segment by System Type
• Pressurized Water Reactor (PWR) Cooling System
• Boiling Water Reactor (BWR) Cooling System
• Advanced Gas-Cooled Reactor (AGCR) Cooling System
• Pressurized Heavy Water Reactor (PHWR) Cooling System
• Other System Type
Market Segment by Component
• Heat Exchangers
• Cooling Towers
• Pumps and Valves
• Condensers
• Cooling Water Treatment Systems
• Other Components

In addition to the revenue predictions for the overall world market and segments, you will also find revenue forecasts for four regional and 20 leading national markets:
North America
• U.S.
• Canada
Europe
• Germany
• Spain
• United Kingdom
• France
• Russia
• Rest of Europe
Asia Pacific
• China
• Japan
• India
• Australia
• South Korea
• Rest of Asia Pacific
Latin America
• Brazil
• Argentina
• Rest of Latin America
Middle East & Africa
• GCC
• South Africa
• Rest of Middle East & Africa
Need industry data? Please contact us today.
The report also includes profiles and for some of the leading companies in the Reactor Cooling Systems Market, 2023 to 2033, with a focus on this segment of these companies’ operations.
Leading companies and the potential for market growth
• Areva S.A.
• Babcock International Group plc
• Bharat Heavy Electricals Limited (BHEL)
• China Nuclear Power Engineering Co Ltd
• Dongfang Electric Corporation
• General Electric Company
• Harbin Electric Company Limited
• IHI Corporation
• KSB SE & Co. KGaA
• Mitsubishi Heavy Industries, Ltd
• Rolls-Royce Limited
• Rosatom State Nuclear Energy Corporation
• Shanghai Electric Group Company Limited
• Sulzer Ltd.
• Westinghouse Electric Company LLC
Overall world revenue for Reactor Cooling Systems Market, 2023 to 2033 in terms of value the market will surpass US$9,185.3 million in 2023, our work calculates. We predict strong revenue growth through to 2033. Our work identifies which organizations hold the greatest potential. Discover their capabilities, progress, and commercial prospects, helping you stay ahead.
How will the Reactor Cooling Systems Market, 2023 to 2033 report help you?
In summary, our 350+ page report provides you with the following knowledge:
• Revenue forecasts to 2033 for Reactor Cooling Systems Market, 2023 to 2033 Market, with forecasts for capacity, configuration, mechanism, system type, component and, each forecast at a global and regional level – discover the industry’s prospects, finding the most lucrative places for investments and revenues.
• Revenue forecasts to 2033 for four regional and 20 key national markets – See forecasts for the Reactor Cooling Systems Market, 2023 to 2033 market in North America, Europe, Asia-Pacific, Latin America and Middle East & Africa. Also forecasted is the market in the US, Canada, Brazil, Germany, France, UK, Russia, China, India, Japan, and Australia among other prominent economies.
• Prospects for established firms and those seeking to enter the market – including company profiles for 15 of the major companies involved in the Reactor Cooling Systems Market, 2023 to 2033.
Find quantitative and qualitative analyses with independent predictions. Receive information that only our report contains, staying informed with invaluable business intelligence.
Information found nowhere else
With our new report, you are less likely to fall behind in knowledge or miss out on opportunities. See how our work could benefit your research, analyses, and decisions. Visiongain’s study is for everybody needing commercial analyses for the Reactor Cooling Systems Market, 2023 to 2033, market-leading companies. You will find data, trends and predictions.
To access the data contained in this document please email contactus@visiongain.com
Buy our report today Reactor Cooling Systems Market Report 2023-2033: Forecasts by Capacity (Small/Medium Reactor, Large Reactor), by Configuration (Once-Through Cooling, Closed-Cycle Cooling, Hybrid Cooling), by Mechanism (Direct Cooling, Indirect Cooling, Passive Cooling, Active Cooling), by System Type (Pressurised Water Reactor (PWR) Cooling System, Boiling Water Reactor (BWR) Cooling System, Advanced Gas-Cooled Reactor (AGCR) Cooling System, Pressurised Heavy Water Reactor (PHWR) Cooling System, Other), by Component (Heat Exchangers, Cooling Towers, Pumps and Valves, Condensers, Cooling Water Treatment Systems, Other) AND Regional and Leading National Market Analysis PLUS Analysis of Leading Companies AND COVID-19 Impact and Recovery Pattern Analysis. Avoid missing out by staying informed – order our report now.
Visiongain is a trading partner with the US Federal Government
CCR Ref number: KD4R6
Do you have any custom requirements we can help you with? Any need for a specific country, geo region, market segment or specific company information? Contact us today, we can discuss your needs and see how we can help: contactus@visiongain.com
1 Report Overview
1.1 Objectives of the Study
1.2 Introduction to Reactor Cooling Systems Market
1.3 What This Report Delivers
1.4 Why You Should Read This Report
1.5 Key Questions Answered by This Analytical Report
1.6 Who Is This Report for?
1.7 Research Methodology
1.7.1 Market Definitions
1.7.2 Market Evaluation & Forecasting Methodology
1.7.3 Data Validation
1.7.3.1 Primary Research
1.7.3.2 Secondary Research
1.8 Frequently Asked Questions (FAQs)
1.9 Associated Visiongain Reports
1.10 About Visiongain
2 Executive Summary
2.1 Segment Analysis
2.1.1 Capacity Segment: Market Attractiveness Index
2.1.2 Configuration Segment: Market Attractiveness Index
2.1.3 Mechanism Segment: Market Attractiveness Index
2.1.4 System Type Segment: Market Attractiveness Index
2.1.5 Component Segment: Market Attractiveness Index
2.2 Regional Analysis
3 Market Overview
3.1 Key Findings
3.2 Market Dynamics
3.2.1 Market Driving Factors
3.2.1.1 Increasing Demand for Nuclear Power
3.2.1.2 Development of New Reactor Technologies
3.2.1.3 Focus on Safety and Efficiency
3.2.2 Market Restraints
3.2.2.1 High Cost of Reactor Cooling Systems
3.2.2.2 Shortage of Skilled Labour
3.2.2.3 Nuclear Power Plants Are Subject To Strict Regulatory Oversight
3.2.3 Market Opportunities
3.2.3.1 Growing Demand in Emerging Markets
3.2.3.2 Development of New Coolants
3.2.3.3 Increased Investment in Research and Development
3.3 COVID-19 Impact Analysis
3.3.1 V-Shaped Recovery
3.3.2 W-Shaped Recovery
3.3.3 U-Shaped Recovery
3.3.4 L-Shaped Recovery
3.4 Porter’s Five Forces Analysis
3.4.1 Bargaining Power of Suppliers (Low)
3.4.2 Bargaining Power of Buyers (Moderate)
3.4.3 Competitive Rivalry (High)
3.4.4 Threat from Substitutes (Moderate)
3.4.5 Threat of New Entrants (Low)
3.5 PEST Analysis
3.5.1 Political Factors
3.5.2 Economic Factors
3.5.3 Social Factors
3.5.4 Technological Factors
4 Reactor Cooling Systems Market Analysis by Capacity
4.1 Key Findings
4.2 Capacity Segment: Market Attractiveness Index
4.3 Reactor Cooling Systems Market Size Estimation and Forecast by Capacity
4.4 Small/Medium Reactor Market
4.4.1 Market Size by Region, 2023-2033 (US$ Million)
4.4.2 Market Share by Region, 2023 & 2033 (%)
4.5 Large Reactor Market
4.5.1 Market Size by Region, 2023-2033 (US$ Million)
4.5.2 Market Share by Region, 2023 & 2033 (%)
5 Reactor Cooling Systems Market Analysis by Configuration
5.1 Key Findings
5.2 Configuration Segment: Market Attractiveness Index
5.3 Reactor Cooling Systems Market Size Estimation and Forecast by Configuration
5.4 Once-Through Cooling Market
5.4.1 Market Size by Region, 2023-2033 (US$ Million)
5.4.2 Market Share by Region, 2023 & 2033 (%)
5.5 Closed-Cycle Cooling Market
5.5.1 Market Size by Region, 2023-2033 (US$ Million)
5.5.2 Market Share by Region, 2023 & 2033 (%)
5.6 Hybrid Cooling Market
5.6.1 Market Size by Region, 2023-2033 (US$ Million)
5.6.2 Market Share by Region, 2023 & 2033 (%)
6 Reactor Cooling Systems Market Analysis by Mechanism
6.1 Key Findings
6.2 Mechanism Segment: Market Attractiveness Index
6.3 Reactor Cooling Systems Market Size Estimation and Forecast by Mechanism
6.4 Direct Cooling Market
6.4.1 Market Size by Region, 2023-2033 (US$ Million)
6.4.2 Market Share by Region, 2023 & 2033 (%)
6.5 Indirect Cooling Market
6.5.1 Market Size by Region, 2023-2033 (US$ Million)
6.5.2 Market Share by Region, 2023 & 2033 (%)
6.6 Passive Cooling Market
6.6.1 Market Size by Region, 2023-2033 (US$ Million)
6.6.2 Market Share by Region, 2023 & 2033 (%)
6.7 Active Cooling Market
6.7.1 Market Size by Region, 2023-2033 (US$ Million)
6.7.2 Market Share by Region, 2023 & 2033 (%)
7 Reactor Cooling Systems Market Analysis by System Type
7.1 Key Findings
7.2 System Type Segment: Market Attractiveness Index
7.3 Reactor Cooling Systems Market Size Estimation and Forecast by System Type
7.4 Pressurized Water Reactor (PWR) Cooling System Market
7.4.1 Market Size by Region, 2023-2033 (US$ Million)
7.4.2 Market Share by Region, 2023 & 2033 (%)
7.5 Boiling Water Reactor (BWR) Cooling System Market
7.5.1 Market Size by Region, 2023-2033 (US$ Million)
7.5.2 Market Share by Region, 2023 & 2033 (%)
7.6 Advanced Gas-Cooled Reactor (AGCR) Cooling System Market
7.6.1 Market Size by Region, 2023-2033 (US$ Million)
7.6.2 Market Share by Region, 2023 & 2033 (%)
7.7 Pressurized Heavy Water Reactor (PHWR) Cooling System Market
7.7.1 Market Size by Region, 2023-2033 (US$ Million)
7.7.2 Market Share by Region, 2023 & 2033 (%)
7.8 Other System Type Market
7.8.1 Market Size by Region, 2023-2033 (US$ Million)
7.8.2 Market Share by Region, 2023 & 2033 (%)
8 Reactor Cooling Systems Market Analysis by Component
8.1 Key Findings
8.2 Component Segment: Market Attractiveness Index
8.3 Reactor Cooling Systems Market Size Estimation and Forecast by Component
8.4 Heat Exchangers Market
8.4.1 Market Size by Region, 2023-2033 (US$ Million)
8.4.2 Market Share by Region, 2023 & 2033 (%)
8.5 Cooling Towers Market
8.5.1 Market Size by Region, 2023-2033 (US$ Million)
8.5.2 Market Share by Region, 2023 & 2033 (%)
8.6 Pumps and Valves Market
8.6.1 Market Size by Region, 2023-2033 (US$ Million)
8.6.2 Market Share by Region, 2023 & 2033 (%)
8.7 Condensers Market
8.7.1 Market Size by Region, 2023-2033 (US$ Million)
8.7.2 Market Share by Region, 2023 & 2033 (%)
8.8 Cooling Water Treatment Systems Market
8.8.1 Market Size by Region, 2023-2033 (US$ Million)
8.8.2 Market Share by Region, 2023 & 2033 (%)
8.9 Other Components Market
8.9.1 Market Size by Region, 2023-2033 (US$ Million)
8.9.2 Market Share by Region, 2023 & 2033 (%)
9 Reactor Cooling Systems Market Analysis by Region
9.1 Key Findings
9.2 Regional Market Size Estimation and Forecast
10 North America Reactor Cooling Systems Market Analysis
10.1 Key Findings
10.2 North America Reactor Cooling Systems Market Attractiveness Index
10.3 North America Reactor Cooling Systems Market by Country, 2023, 2028 & 2033 (US$ Million)
10.4 North America Reactor Cooling Systems Market Size Estimation and Forecast by Value
10.5 North America Reactor Cooling Systems Market by Country
10.6 North America Reactor Cooling Systems Market by Capacity
10.7 North America Reactor Cooling Systems Market by Configuration
10.8 North America Reactor Cooling Systems Market by Mechanism
10.9 North America Reactor Cooling Systems Market by System Type
10.10 North America Reactor Cooling Systems Market by Component
10.11 US Reactor Cooling Systems Market
10.12 Canada Reactor Cooling Systems Market
11 Europe Reactor Cooling Systems Market Analysis
11.1 Key Findings
11.2 Europe Reactor Cooling Systems Market Attractiveness Index
11.3 Europe Reactor Cooling Systems Market by Country, 2023, 2028 & 2033 (US$ Million)
11.4 Europe Reactor Cooling Systems Market Size Estimation and Forecast by Value
11.5 Europe Reactor Cooling Systems Market by Country
11.6 Europe Reactor Cooling Systems Market by Capacity
11.7 Europe Reactor Cooling Systems Market by Configuration
11.8 Europe Reactor Cooling Systems Market by Mechanism
11.9 Europe Reactor Cooling Systems Market by System Type
11.10 Europe Reactor Cooling Systems Market by Component
11.11 Germany Reactor Cooling Systems Market
11.12 UK Reactor Cooling Systems Market
11.13 France Reactor Cooling Systems Market
11.14 Russia Reactor Cooling Systems Market
11.15 Spain Reactor Cooling Systems Market
11.16 Rest of Europe Reactor Cooling Systems Market
12 Asia Pacific Reactor Cooling Systems Market Analysis
12.1 Key Findings
12.2 Asia Pacific Reactor Cooling Systems Market Attractiveness Index
12.3 Asia Pacific Reactor Cooling Systems Market by Country, 2023, 2028 & 2033 (US$ Million)
12.4 Asia Pacific Reactor Cooling Systems Market Size Estimation and Forecast by Value
12.5 Asia-Pacific Reactor Cooling Systems Market by Country
12.6 Asia-Pacific Reactor Cooling Systems Market by Capacity
12.7 Asia-Pacific Reactor Cooling Systems Market by Configuration
12.8 Asia-Pacific Reactor Cooling Systems Market by Mechanism
12.9 Asia-Pacific Reactor Cooling Systems Market by System Type
12.10 Asia-Pacific Reactor Cooling Systems Market by Component
12.11 China Reactor Cooling Systems Market
12.12 India Reactor Cooling Systems Market
12.13 Japan Reactor Cooling Systems Market
12.14 South Korea Reactor Cooling Systems Market
12.15 Australia Reactor Cooling Systems Market
12.16 Rest of Asia-Pacific Reactor Cooling Systems Market
13 Middle East & Africa Reactor Cooling Systems Market Analysis
13.1 Key Findings
13.2 Middle East & Africa Reactor Cooling Systems Market Attractiveness Index
13.3 Middle East & Africa Reactor Cooling Systems Market by Country, 2023, 2028 & 2033 (US$ Million)
13.4 Middle East & Africa Reactor Cooling Systems Market Size Estimation and Forecast by Value
13.5 Middle East & Africa Reactor Cooling Systems Market by Country
13.6 Middle East & Africa Reactor Cooling Systems Market by Capacity
13.7 Middle East & Africa Reactor Cooling Systems Market by Configuration
13.8 Middle East & Africa Reactor Cooling Systems Market by Mechanism
13.9 Middle East & Africa Reactor Cooling Systems Market by System Type
13.10 Middle East & Africa Reactor Cooling Systems Market by Component
13.11 GCC Reactor Cooling Systems Market
13.12 South Africa Reactor Cooling Systems Market
13.13 Rest of Middle East & Africa Reactor Cooling Systems Market
14 Latin America Reactor Cooling Systems Market Analysis
14.1 Key Findings
14.2 Latin America Reactor Cooling Systems Market Attractiveness Index
14.3 Latin America Reactor Cooling Systems Market by Country, 2023, 2028 & 2033 (US$ Million)
14.4 Latin America Reactor Cooling Systems Market Size Estimation and Forecast by Value
14.5 Latin America Reactor Cooling Systems Market by Country
14.6 Latin America Reactor Cooling Systems Market by Capacity
14.7 Latin America Reactor Cooling Systems Market by Configuration
14.8 Latin America Reactor Cooling Systems Market by Mechanism
14.9 Latin America Reactor Cooling Systems Market by System Type
14.10 Latin America Reactor Cooling Systems Market by Component
14.11 Brazil Reactor Cooling Systems Market
14.12 Argentina Reactor Cooling Systems Market
14.13 Rest of Latin America Reactor Cooling Systems
15 Company Profiles
15.1 Competitive Landscape, 2022
15.2 Strategic Outlook
15.3 Areva S.A.
15.3.1 Company Snapshot
15.3.2 Company Overview
15.3.3 Product Benchmarking
15.3.4 Strategic Outlook
15.4 General Electric Company
15.4.1 Company Snapshot
15.4.2 Company Overview
15.4.3 Financial Analysis
15.4.3.1 Net Revenue, 2018-2022
15.4.3.2 R&D, 2018-2022
15.4.3.3 Regional Revenue Share, 2022 (%)
15.4.3.4 Business Segment Revenue Share, 2022 (%)
15.4.4 Product Benchmarking
15.4.5 Strategic Outlook
15.5 Westinghouse Electric Company LLC
15.5.1 Company Snapshot
15.5.2 Company Overview
15.5.3 Product Benchmarking
15.5.4 Strategic Outlook
15.6 Mitsubishi Heavy Industries, Ltd
15.6.1 Company Snapshot
15.6.2 Company Overview
15.6.3 Financial Analysis
15.6.3.1 Net Revenue, 2018-2022
15.6.3.2 R&D, 2018-2022
15.6.3.3 Regional Revenue Share, 2022 (%)
15.6.3.4 Business Segment Revenue Share, 2022 (%)
15.6.4 Product Benchmarking
15.6.5 Strategic Outlook
15.7 Babcock International Group plc
15.7.1 Company Snapshot
15.7.2 Company Overview
15.7.3 Financial Analysis
15.7.3.1 Net Revenue, 2018-2022
15.7.3.2 Regional Revenue Share, 2022 (%)
15.7.3.3 Business Segment Revenue Share, 2022 (%)
15.7.4 Product Benchmarking
15.8 Harbin Electric Company Limited
15.8.1 Company Snapshot
15.8.2 Company Overview
15.8.3 Financial Analysis
15.8.3.1 Net Revenue, 2018-2022
15.8.3.2 R&D, 2018-2022
15.8.3.3 Regional Revenue Share, 2022 (%)
15.8.3.4 Business Segment Revenue Share, 2022 (%)
15.8.4 Product Benchmarking
15.9 Dongfang Electric Corporation
15.9.1 Company Snapshot
15.9.2 Company Overview
15.9.3 Financial Analysis
15.9.3.1 Net Revenue, 2018-2022
15.9.3.2 R&D, 2018-2022
15.9.3.3 Regional Revenue Share, 2022 (%)
15.9.3.4 Business Segment Revenue Share, 2022 (%)
15.9.4 Product Benchmarking
15.9.5 Strategic Outlook
15.10 China Nuclear Power Engineering Co Ltd
15.10.1 Company Snapshot
15.10.2 Company Overview
15.10.3 Product Benchmarking
15.10.4 Strategic Outlook
15.11 Bharat Heavy Electricals Limited (BHEL)
15.11.1 Company Snapshot
15.11.2 Company Overview
15.11.3 Financial Analysis
15.11.3.1 Net Revenue, 2018-2022
15.11.3.2 R&D, 2018-2022
15.11.3.3 Regional Revenue Share, 2022 (%)
15.11.3.4 Business Segment Revenue Share, 2022 (%)
15.11.4 Product Benchmarking
15.11.5 Strategic Outlook
15.12 Rosatom State Nuclear Energy Corporation
15.12.1 Company Snapshot
15.12.2 Company Overview
15.12.3 Product Benchmarking
15.12.4 Strategic Outlook
15.13 Sulzer Ltd.
15.13.1 Company Snapshot
15.13.2 Company Overview
15.13.3 Financial Analysis
15.13.3.1 Net Revenue, 2018-2022
15.13.3.2 R&D, 2018-2022
15.13.3.3 Regional Revenue Share, 2022 (%)
15.13.3.4 Business Segment Revenue Share, 2022 (%)
15.13.4 Product Benchmarking
15.14 Shanghai Electric Group Company Limited
15.14.1 Company Snapshot
15.14.2 Company Overview
15.14.3 Financial Analysis
15.14.3.1 Net Revenue, 2018-2022
15.14.3.2 R&D, 2018-2022
15.14.3.3 Regional Revenue Share, 2022 (%)
15.14.3.4 Business Segment Revenue Share, 2022 (%)
15.14.4 Product Benchmarking
15.14.5 Strategic Outlook
15.15 KSB SE & Co. KGaA
15.15.1 Company Snapshot
15.15.2 Company Overview
15.15.3 Product Benchmarking
15.16 Rolls-Royce Limited
15.16.1 Company Snapshot
15.16.2 Company Overview
15.16.3 Financial Analysis
15.16.3.1 Net Revenue, 2018-2022
15.16.3.2 R&D, 2018-2022
15.16.3.3 Regional Revenue Share, 2022 (%)
15.16.3.4 Business Segment Revenue Share, 2022 (%)
15.16.4 Product Benchmarking
15.16.5 Strategic Outlook
15.17 IHI Corporation
15.17.1 Company Snapshot
15.17.2 Company Overview
15.17.3 Financial Analysis
15.17.3.1 Net Revenue, 2018-2022
15.17.3.2 R&D, 2018-2022
15.17.3.3 Regional Revenue Share, 2022 (%)
15.17.3.4 Business Segment Revenue Share, 2022 (%)
15.17.4 Product Benchmarking
15.17.5 Strategic Outlook
16 Conclusion and Recommendations
16.1 Concluding Remarks from Visiongain
16.2 Recommendations for Market Players
List of Tables
Table 1 Reactor Cooling Systems Market Snapshot, 2023 & 2033 (US$ Million, CAGR %)
Table 2 Global Reactor Cooling Systems Market Forecast, 2023-2033 (US$ Mn, AGR (%), CAGR (%)) (V-Shaped Recovery Scenario)
Table 3 Global Reactor Cooling Systems Market by Region, 2023-2033 (US$ Mn, AGR (%), CAGR (%)) (V-Shaped Recovery Scenario)
Table 4 Global Reactor Cooling Systems Market Forecast, 2023-2033 (US$ Mn, AGR (%), CAGR (%)) (W-Shaped Recovery Scenario)
Table 5 Global Reactor Cooling Systems Market by Region, 2023-2033 (US$ Mn, AGR (%), CAGR (%)) (W-Shaped Recovery Scenario)
Table 6 Global Reactor Cooling Systems Market Forecast, 2023-2033 (US$ Mn, AGR (%), CAGR (%)) (U-Shaped Recovery Scenario)
Table 7 Global Reactor Cooling Systems Market by Region, 2023-2033 (US$ Mn, AGR (%), CAGR (%)) (U-Shaped Recovery Scenario)
Table 8 Global Reactor Cooling Systems Market Forecast, 2023-2033 (US$ Mn, AGR (%), CAGR (%)) (L-Shaped Recovery Scenario)
Table 9 Global Reactor Cooling Systems Market by Region, 2023-2033 (US$ Mn, AGR (%), CAGR (%)) (L-Shaped Recovery Scenario)
Table 10 Global Reactor Cooling Systems Market by Capacity, 2023-2033 (US$ Mn, AGR (%), CAGR (%))
Table 11 Small/Medium Reactor Market by Region, 2023-2033 (US$ Mn, AGR (%), CAGR (%))
Table 12 Large Reactor Market by Region, 2023-2033 (US$ Mn, AGR (%), CAGR (%))
Table 13 Global Reactor Cooling Systems Market by Configuration, 2023-2033 (US$ Mn, AGR (%), CAGR (%))
Table 14 Once-Through Cooling Market by Region, 2023-2033 (US$ Mn, AGR (%), CAGR (%))
Table 15 Closed-Cycle Cooling Market by Region, 2023-2033 (US$ Mn, AGR (%), CAGR (%))
Table 16 Hybrid Cooling Market by Region, 2023-2033 (US$ Mn, AGR (%), CAGR (%))
Table 17 Global Reactor Cooling Systems Market by Mechanism, 2023-2033 (US$ Mn, AGR (%), CAGR (%))
Table 18 Direct Cooling Market by Region, 2023-2033 (US$ Mn, AGR (%), CAGR (%))
Table 19 Indirect Cooling Market by Region, 2023-2033 (US$ Mn, AGR (%), CAGR (%))
Table 20 Passive Cooling Market by Region, 2023-2033 (US$ Mn, AGR (%), CAGR (%))
Table 21 Active Cooling Market by Region, 2023-2033 (US$ Mn, AGR (%), CAGR (%))
Table 22 Global Reactor Cooling Systems Market by System Type, 2023-2033 (US$ Mn, AGR (%), CAGR (%))
Table 23 Pressurized Water Reactor (PWR) Cooling System Market by Region, 2023-2033 (US$ Mn, AGR (%), CAGR (%))
Table 24 Boiling Water Reactor (BWR) Cooling System Market by Region, 2023-2033 (US$ Mn, AGR (%), CAGR (%))
Table 25 Advanced Gas-Cooled Reactor (AGCR) Cooling System Market by Region, 2023-2033 (US$ Mn, AGR (%), CAGR (%))
Table 26 Pressurized Heavy Water Reactor (PHWR) Cooling System Market by Region, 2023-2033 (US$ Mn, AGR (%), CAGR (%))
Table 27 Other System Type Market by Region, 2023-2033 (US$ Mn, AGR (%), CAGR (%))
Table 28 Global Reactor Cooling Systems Market by Component, 2023-2033 (US$ Mn, AGR (%), CAGR (%))
Table 29 Heat Exchangers Market by Region, 2023-2033 (US$ Mn, AGR (%), CAGR (%))
Table 30 Cooling Towers Market by Region, 2023-2033 (US$ Mn, AGR (%), CAGR (%))
Table 31 Pumps and Valves Market by Region, 2023-2033 (US$ Mn, AGR (%), CAGR (%))
Table 32 Condensers Market by Region, 2023-2033 (US$ Mn, AGR (%), CAGR (%))
Table 33 Cooling Water Treatment Systems Market by Region, 2023-2033 (US$ Mn, AGR (%), CAGR (%))
Table 34 Other Components Market by Region, 2023-2033 (US$ Mn, AGR (%), CAGR (%))
Table 35 Global Reactor Cooling Systems Market Forecast, 2023-2033 (US$ Mn, AGR (%), CAGR (%))
Table 36 Global Reactor Cooling Systems Market by Region, 2023-2033 (US$ Mn, AGR (%), CAGR (%))
Table 37 Global Reactor Cooling Systems Market by Capacity, 2023-2033 (US$ Mn, AGR (%), CAGR (%))
Table 38 Global Reactor Cooling Systems Market by Configuration, 2023-2033 (US$ Mn, AGR (%), CAGR (%))
Table 39 Global Reactor Cooling Systems Market by Mechanism, 2023-2033 (US$ Mn, AGR (%), CAGR (%))
Table 40 Global Reactor Cooling Systems Market by System Type, 2023-2033 (US$ Mn, AGR (%), CAGR (%))
Table 41 Global Reactor Cooling Systems Market by Component, 2023-2033 (US$ Mn, AGR (%), CAGR (%))
Table 42 North America Reactor Cooling Systems Market by Value, 2023-2033 (US$ Mn, AGR (%), CAGR (%))
Table 43 North America Reactor Cooling Systems Market by Country, 2023-2033 (US$ Mn, AGR (%), CAGR (%))
Table 44 North America Reactor Cooling Systems Market by Capacity, 2023-2033 (US$ Mn, AGR (%), CAGR (%))
Table 45 North America Reactor Cooling Systems Market by Configuration, 2023-2033 (US$ Mn, AGR (%), CAGR (%))
Table 46 North America Reactor Cooling Systems Market by Mechanism, 2023-2033 (US$ Mn, AGR (%), CAGR (%))
Table 47 North America Reactor Cooling Systems Market by System Type, 2023-2033 (US$ Mn, AGR (%), CAGR (%))
Table 48 North America Reactor Cooling Systems Market by Component, 2023-2033 (US$ Mn, AGR (%), CAGR (%))
Table 49 US Reactor Cooling Systems Market by Value, 2023-2033 (US$ Mn, AGR (%), CAGR (%))
Table 50 Canada Reactor Cooling Systems Market by Value, 2023-2033 (US$ Mn, AGR (%), CAGR (%))
Table 51 Europe Reactor Cooling Systems Market by Value, 2023-2033 (US$ Mn, AGR (%), CAGR (%))
Table 52 Europe Reactor Cooling Systems Market by Country, 2023-2033 (US$ Mn, AGR (%), CAGR (%))
Table 53 Europe Reactor Cooling Systems Market by Capacity, 2023-2033 (US$ Mn, AGR (%), CAGR (%))
Table 54 Europe Reactor Cooling Systems Market by Configuration, 2023-2033 (US$ Mn, AGR (%), CAGR (%))
Table 55 Europe Reactor Cooling Systems Market by Mechanism, 2023-2033 (US$ Mn, AGR (%), CAGR (%))
Table 56 Europe Reactor Cooling Systems Market by System Type, 2023-2033 (US$ Mn, AGR (%), CAGR (%))
Table 57 Europe Reactor Cooling Systems Market by Component, 2023-2033 (US$ Mn, AGR (%), CAGR (%))
Table 58 Germany Reactor Cooling Systems Market by Value, 2023-2033 (US$ Mn, AGR (%), CAGR (%))
Table 59 UK Reactor Cooling Systems Market by Value, 2023-2033 (US$ Mn, AGR (%), CAGR (%))
Table 60 France Reactor Cooling Systems Market by Value, 2023-2033 (US$ Mn, AGR (%), CAGR (%))
Table 61 Russia Reactor Cooling Systems Market by Value, 2023-2033 (US$ Mn, AGR (%), CAGR (%))
Table 62 Spain Reactor Cooling Systems Market by Value, 2023-2033 (US$ Mn, AGR (%), CAGR (%))
Table 63 Rest of Europe Reactor Cooling Systems Market by Value, 2023-2033 (US$ Mn, AGR (%), CAGR (%))
Table 64 Asia-Pacific Reactor Cooling Systems Market by Value, 2023-2033 (US$ Mn, AGR (%), CAGR (%))
Table 65 Asia-Pacific Reactor Cooling Systems Market by Country, 2023-2033 (US$ Mn, AGR (%), CAGR (%))
Table 66 Asia-Pacific Reactor Cooling Systems Market by Capacity, 2023-2033 (US$ Mn, AGR (%), CAGR (%))
Table 67 Asia-Pacific Reactor Cooling Systems Market by Configuration, 2023-2033 (US$ Mn, AGR (%), CAGR (%))
Table 68 Asia-Pacific Reactor Cooling Systems Market by Mechanism, 2023-2033 (US$ Mn, AGR (%), CAGR (%))
Table 69 Asia-Pacific Reactor Cooling Systems Market by System Type, 2023-2033 (US$ Mn, AGR (%), CAGR (%))
Table 70 Asia-Pacific Reactor Cooling Systems Market by Component, 2023-2033 (US$ Mn, AGR (%), CAGR (%))
Table 71 China Reactor Cooling Systems Market by Value, 2023-2033 (US$ Mn, AGR (%), CAGR (%))
Table 72 India Reactor Cooling Systems Market by Value, 2023-2033 (US$ Mn, AGR (%), CAGR (%))
Table 73 Japan Reactor Cooling Systems Market by Value, 2023-2033 (US$ Mn, AGR (%), CAGR (%))
Table 74 South Korea Reactor Cooling Systems Market by Value, 2023-2033 (US$ Mn, AGR (%), CAGR (%))
Table 75 Australia Reactor Cooling Systems Market by Value, 2023-2033 (US$ Mn, AGR (%), CAGR (%))
Table 76 Rest of Asia-Pacific Reactor Cooling Systems Market by Value, 2023-2033 (US$ Mn, AGR (%), CAGR (%))
Table 77 Middle East & Africa Reactor Cooling Systems Market by Value, 2023-2033 (US$ Mn, AGR (%), CAGR (%))
Table 78 Middle East & Africa Reactor Cooling Systems Market by Country, 2023-2033 (US$ Mn, AGR (%), CAGR (%))
Table 79 Middle East & Africa Reactor Cooling Systems Market by Capacity, 2023-2033 (US$ Mn, AGR (%), CAGR (%))
Table 80 Middle East & Africa Reactor Cooling Systems Market by Configuration, 2023-2033 (US$ Mn, AGR (%), CAGR (%))
Table 81 Middle East & Africa Reactor Cooling Systems Market by Mechanism, 2023-2033 (US$ Mn, AGR (%), CAGR (%))
Table 82 Middle East & Africa Reactor Cooling Systems Market by System Type, 2023-2033 (US$ Mn, AGR (%), CAGR (%))
Table 83 Middle East & Africa Reactor Cooling Systems Market by Component, 2023-2033 (US$ Mn, AGR (%), CAGR (%))
Table 84 GCC Reactor Cooling Systems Market by Value, 2023-2033 (US$ Mn, AGR (%), CAGR (%))
Table 85 South Africa Reactor Cooling Systems Market by Value, 2023-2033 (US$ Mn, AGR (%), CAGR (%))
Table 86 Rest of Middle East & Africa Reactor Cooling Systems Market by Value, 2023-2033 (US$ Mn, AGR (%), CAGR (%))
Table 87 Latin America Reactor Cooling Systems Market by Value, 2023-2033 (US$ Mn, AGR (%), CAGR (%))
Table 88 Latin America Reactor Cooling Systems Market by Country, 2023-2033 (US$ Mn, AGR (%), CAGR (%))
Table 89 Latin America Reactor Cooling Systems Market by Capacity, 2023-2033 (US$ Mn, AGR (%), CAGR (%))
Table 90 Latin America Reactor Cooling Systems Market by Configuration, 2023-2033 (US$ Mn, AGR (%), CAGR (%))
Table 91 Latin America Reactor Cooling Systems Market by Mechanism, 2023-2033 (US$ Mn, AGR (%), CAGR (%))
Table 92 Latin America Reactor Cooling Systems Market by System Type, 2023-2033 (US$ Mn, AGR (%), CAGR (%))
Table 93 Latin America Reactor Cooling Systems Market by Component, 2023-2033 (US$ Mn, AGR (%), CAGR (%))
Table 94 Brazil Reactor Cooling Systems Market by Value, 2023-2033 (US$ Mn, AGR (%), CAGR (%))
Table 95 Argentina Reactor Cooling Systems Market by Value, 2023-2033 (US$ Mn, AGR (%), CAGR (%))
Table 96 Rest of Latin America Reactor Cooling Systems Market by Value, 2023-2033 (US$ Mn, AGR (%), CAGR (%))
Table 97 Strategic Outlook
Table 98 Areva S.A.: Key Details, (CEO, HQ, Revenue, Founded, No. of Employees, Company Type, Website, Business Segment)
Table 99 Areva S.A.: Product Benchmarking
Table 100 Areva S.A.: Strategic Outlook
Table 101 General Electric Company: Key Details, (CEO, HQ, Revenue, Founded, No. of Employees, Company Type, Website, Business Segment)
Table 102 General Electric Company: Product Benchmarking
Table 103 General Electric Company: Strategic Outlook
Table 104 Westinghouse Electric Company LLC: Key Details, (CEO, HQ, Revenue, Founded, No. of Employees, Company Type, Website, Business Segment)
Table 105 Westinghouse Electric Company LLC: Product Benchmarking
Table 106 Westinghouse Electric Company LLC: Strategic Outlook
Table 107 Mitsubishi Heavy Industries, Ltd : Key Details, (CEO, HQ, Revenue, Founded, No. of Employees, Company Type, Website, Business Segment)
Table 108 Mitsubishi Heavy Industries, Ltd: Product Benchmarking
Table 109 Mitsubishi Heavy Industries, Ltd: Strategic Outlook
Table 110 Babcock International Group plc: Key Details, (CEO, HQ, Revenue, Founded, No. of Employees, Company Type, Website, Business Segment)
Table 111 Babcock International Group plc: Product Benchmarking
Table 112 Harbin Electric Company Limited: Key Details, (CEO, HQ, Revenue, Founded, No. of Employees, Company Type, Website, Business Segment)
Table 113 Harbin Electric Company Limited: Product Benchmarking
Table 114 Dongfang Electric Corporation: Key Details, (CEO, HQ, Revenue, Founded, No. of Employees, Company Type, Website, Business Segment)
Table 115 Dongfang Electric Corporation: Product Benchmarking
Table 116 Dongfang Electric Corporation: Strategic Outlook
Table 117 China Nuclear Power Engineering Co Ltd: Key Details, (CEO, HQ, Revenue, Founded, No. of Employees, Company Type, Website, Business Segment)
Table 118 China Nuclear Power Engineering Co Ltd: Product Benchmarking
Table 119 China Nuclear Power Engineering Co Ltd: Strategic Outlook
Table 120 Bharat Heavy Electricals Limited (BHEL): Key Details, (CEO, HQ, Revenue, Founded, No. of Employees, Company Type, Website, Business Segment)
Table 121 Bharat Heavy Electricals Limited (BHEL): Product Benchmarking
Table 122 Bharat Heavy Electricals Limited (BHEL): Strategic Outlook
Table 123 Rosatom State Nuclear Energy Corporation: Key Details, (CEO, HQ, Revenue, Founded, No. of Employees, Company Type, Website, Business Segment)
Table 124 Rosatom State Nuclear Energy Corporation: Product Benchmarking
Table 125 Rosatom State Nuclear Energy Corporation: Strategic Outlook
Table 126 Sulzer Ltd.: Key Details, (CEO, HQ, Revenue, Founded, No. of Employees, Company Type, Website, Business Segment)
Table 127 Sulzer Ltd: Product Benchmarking
Table 128 , Founded, No. of Employees Shanghai Electric Group Company Limited: Key Details, (CEO, HQ, Revenue, Company Type, Website, Business Segment)
Table 129 Shanghai Electric Group Company Limited: Product Benchmarking
Table 130 Shanghai Electric Group Company Limited: Strategic Outlook
Table 131 KSB SE & Co. KGaA: Key Details, (CEO, HQ, Revenue, Founded, No. of Employees, Company Type, Website, Business Segment)
Table 132 KSB SE & Co. KGaA: Product Benchmarking
Table 133 Rolls-Royce Limited: Key Details, (CEO, HQ, Revenue, Founded, No. of Employees, Company Type, Website, Business Segment)
Table 134 Rolls-Royce Limited: Product Benchmarking
Table 135 Rolls-Royce Limited: Strategic Outlook
Table 136 IHI Corporation: Key Details, (CEO, HQ, Revenue, Founded, No. of Employees, Company Type, Website, Business Segment)
Table 137 IHI Corporation: Product Benchmarking
Table 138 IHI Corporation: Strategic Outlook
List of Figures
Figure 1 Reactor Cooling Systems Market Segmentation
Figure 2 Reactor Cooling Systems Market by Capacity: Market Attractiveness Index
Figure 3 Reactor Cooling Systems Market by Configuration: Market Attractiveness Index
Figure 4 Reactor Cooling Systems Market by Mechanism: Market Attractiveness Index
Figure 5 Reactor Cooling Systems Market by System Type: Market Attractiveness Index
Figure 6 Reactor Cooling Systems Market by Component: Market Attractiveness Index
Figure 7 Reactor Cooling Systems Market Attractiveness Index by Region
Figure 8 Reactor Cooling Systems Market: Market Dynamics
Figure 9 Global Reactor Cooling Systems Market Forecast, 2023-2033 (US$ Mn, AGR (%)) (V-Shaped Recovery Scenario)
Figure 10 Global Reactor Cooling Systems Market by Region, 2023-2033 (US$ Mn, AGR (%)) (V-Shaped Recovery Scenario)
Figure 11 Global Reactor Cooling Systems Market Forecast, 2023-2033 (US$ Mn, AGR (%)) (W-Shaped Recovery Scenario)
Figure 12 Global Reactor Cooling Systems Market by Region, 2023-2033 (US$ Mn, AGR (%)) (W-Shaped Recovery Scenario)
Figure 13 Global Reactor Cooling Systems Market Forecast, 2023-2033 (US$ Mn, AGR (%)) (U-Shaped Recovery Scenario)
Figure 14 Global Reactor Cooling Systems Market by Region, 2023-2033 (US$ Mn, AGR (%)) (U-Shaped Recovery Scenario)
Figure 15 Global Reactor Cooling Systems Market Forecast, 2023-2033 (US$ Mn, AGR (%)) (L-Shaped Recovery Scenario)
Figure 16 Global Reactor Cooling Systems Market by Region, 2023-2033 (US$ Mn, AGR (%)) (L-Shaped Recovery Scenario)
Figure 17 Reactor Cooling Systems Market: Porter’s Five Forces Analysis
Figure 18 Reactor Cooling Systems Market: PEST Analysis
Figure 19 Reactor Cooling Systems Market by Capacity: Market Attractiveness Index
Figure 20 Global Reactor Cooling Systems Market by Capacity, 2023-2033 (US$ Mn, AGR (%))
Figure 21 Small/Medium Reactor Market by Region, 2023-2033 (US$ Mn, AGR (%))
Figure 22 Capacity Segment Market Share Forecast by Region, 2023 & 2033 (%)
Figure 23 Large Reactor Market by Region, 2023-2033 (US$ Mn, AGR (%))
Figure 24 Capacity Segment Market Share Forecast by Region, 2023 & 2033 (%)
Figure 25 Reactor Cooling Systems Market by Configuration: Market Attractiveness Index
Figure 26 Global Reactor Cooling Systems Market by Configuration, 2023-2033 (US$ Mn, AGR (%))
Figure 27 Once-Through Cooling Market by Region, 2023-2033 (US$ Mn, AGR (%))
Figure 28 Configuration Segment Market Share Forecast by Region, 2023 & 2033 (%)
Figure 29 Closed-Cycle Cooling Market by Region, 2023-2033 (US$ Mn, AGR (%))
Figure 30 Configuration Segment Market Share Forecast by Region, 2023 & 2033 (%)
Figure 31 Hybrid Cooling Market by Region, 2023-2033 (US$ Mn, AGR (%))
Figure 32 Configuration Segment Market Share Forecast by Region, 2023 & 2033 (%)
Figure 33 Reactor Cooling Systems Market by Mechanism: Market Attractiveness Index
Figure 34 Global Reactor Cooling Systems Market by Mechanism, 2023-2033 (US$ Mn, AGR (%))
Figure 35 Direct Cooling Market by Region, 2023-2033 (US$ Mn, AGR (%))
Figure 36 Mechanism Segment Market Share Forecast by Region, 2023 & 2033 (%)
Figure 37 Indirect Cooling Market by Region, 2023-2033 (US$ Mn, AGR (%))
Figure 38 Mechanism Segment Market Share Forecast by Region, 2023 & 2033 (%)
Figure 39 Passive Cooling Market by Region, 2023-2033 (US$ Mn, AGR (%))
Figure 40 Mechanism Segment Market Share Forecast by Region, 2023 & 2033 (%)
Figure 41 Active Cooling Market by Region, 2023-2033 (US$ Mn, AGR (%))
Figure 42 Mechanism Segment Market Share Forecast by Region, 2023 & 2033 (%)
Figure 43 Reactor Cooling Systems Market by System Type: Market Attractiveness Index
Figure 44 Global Reactor Cooling Systems Market by System Type, 2023-2033 (US$ Mn, AGR (%))
Figure 45 Pressurized Water Reactor (PWR) Cooling System Market by Region, 2023-2033 (US$ Mn, AGR (%))
Figure 46 System Type Segment Market Share Forecast by Region, 2023 & 2033 (%)
Figure 47 Boiling Water Reactor (BWR) Cooling System Market by Region, 2023-2033 (US$ Mn, AGR (%))
Figure 48 System Type Segment Market Share Forecast by Region, 2023 & 2033 (%)
Figure 49 Advanced Gas-Cooled Reactor (AGCR) Cooling System Market by Region, 2023-2033 (US$ Mn, AGR (%))
Figure 50 System Type Segment Market Share Forecast by Region, 2023 & 2033 (%)
Figure 51 Pressurized Heavy Water Reactor (PHWR) Cooling System Market by Region, 2023-2033 (US$ Mn, AGR (%))
Figure 52 System Type Segment Market Share Forecast by Region, 2023 & 2033 (%)
Figure 53 Other System Type Market by Region, 2023-2033 (US$ Mn, AGR (%))
Figure 54 System Type Segment Market Share Forecast by Region, 2023 & 2033 (%)
Figure 55 Reactor Cooling Systems Market by Component: Market Attractiveness Index
Figure 56 Global Reactor Cooling Systems Market by Component, 2023-2033 (US$ Mn, AGR (%))
Figure 57 Heat Exchangers Market by Region, 2023-2033 (US$ Mn, AGR (%))
Figure 58 Component Segment Market Share Forecast by Region, 2023 & 2033 (%)
Figure 59 Cooling Towers Market by Region, 2023-2033 (US$ Mn, AGR (%))
Figure 60 Component Segment Market Share Forecast by Region, 2023 & 2033 (%)
Figure 61 Pumps and Valves Market by Region, 2023-2033 (US$ Mn, AGR (%))
Figure 62 Component Segment Market Share Forecast by Region, 2023 & 2033 (%)
Figure 63 Condensers Market by Region, 2023-2033 (US$ Mn, AGR (%))
Figure 64 Component Segment Market Share Forecast by Region, 2023 & 2033 (%)
Figure 65 Cooling Water Treatment Systems Market by Region, 2023-2033 (US$ Mn, AGR (%))
Figure 66 Component Segment Market Share Forecast by Region, 2023 & 2033 (%)
Figure 67 Other Components Market by Region, 2023-2033 (US$ Mn, AGR (%))
Figure 68 Component Segment Market Share Forecast by Region, 2023 & 2033 (%)
Figure 69 Global Reactor Cooling Systems Market Forecast, 2023-2033 (US$ Mn, AGR (%))
Figure 70 Global Reactor Cooling Systems Market by Region, 2023-2033 (US$ Mn, AGR (%))
Figure 71 Global Reactor Cooling Systems Market by Capacity, 2023-2033 (US$ Mn, AGR (%))
Figure 72 Global Reactor Cooling Systems Market by Configuration, 2023-2033 (US$ Mn, AGR (%))
Figure 73 Global Reactor Cooling Systems Market by Mechanism, 2023-2033 (US$ Mn, AGR (%))
Figure 74 Global Reactor Cooling Systems Market by System Type, 2023-2033 (US$ Mn, AGR (%))
Figure 75 Global Reactor Cooling Systems Market by Component, 2023-2033 (US$ Mn, AGR (%))
Figure 76 North America Reactor Cooling Systems Market Attractiveness Index
Figure 77 North America Reactor Cooling Systems Market by Region, 2023, 2028 & 2033 (US$ Million)
Figure 78 North America Reactor Cooling Systems Market by Value, 2023-2033 (US$ Mn, AGR (%))
Figure 79 North America Reactor Cooling Systems Market by Country, 2023-2033 (US$ Mn, AGR (%))
Figure 80 North America Reactor Cooling Systems Market Forecast by Country, 2023-2033 (%)
Figure 81 North America Reactor Cooling Systems Market by Capacity, 2023-2033 (US$ Mn, AGR (%))
Figure 82 North America Reactor Cooling Systems Market Forecast by Capacity 2023-2033 (%)
Figure 83 North America Reactor Cooling Systems Market by Configuration, 2023-2033 (US$ Mn, AGR (%))
Figure 84 North America Reactor Cooling Systems Market Forecast by Configuration, 2023-2033 (%)
Figure 85 North America Reactor Cooling Systems Market by Mechanism, 2023-2033 (US$ Mn, AGR (%))
Figure 86 North America Reactor Cooling Systems Market Forecast by Mechanism 2023-2033 (%)
Figure 87 North America Reactor Cooling Systems Market by System Type, 2023-2033 (US$ Mn, AGR (%))
Figure 88 North America Reactor Cooling Systems Market Forecast by System Type, 2023-2033 (%)
Figure 89 North America Reactor Cooling Systems Market by Component, 2023-2033 (US$ Mn, AGR (%))
Figure 90 North America Reactor Cooling Systems Market Forecast by Component, 2023-2033 (%)
Figure 91 US Reactor Cooling Systems Market by Value, 2023-2033 (US$ Mn, AGR (%))
Figure 92 Canada Reactor Cooling Systems Market by Value, 2023-2033 (US$ Mn, AGR (%))
Figure 93 Europe Reactor Cooling Systems Market Attractiveness Index
Figure 94 Europe Reactor Cooling Systems Market by Region, 2023, 2028 & 2033 (US$ Million)
Figure 95 Europe Reactor Cooling Systems Market by Value, 2023-2033 (US$ Mn, AGR (%))
Figure 96 Europe Reactor Cooling Systems Market by Country, 2023-2033 (US$ Mn, AGR (%))
Figure 97 Europe Reactor Cooling Systems Market Forecast by Country, 2023-2033 (%)
Figure 98 Europe Reactor Cooling Systems Market by Capacity, 2023-2033 (US$ Mn, AGR (%))
Figure 99 Europe Reactor Cooling Systems Market Forecast by Capacity 2023-2033 (%)
Figure 100 Europe Reactor Cooling Systems Market by Configuration, 2023-2033 (US$ Mn, AGR (%))
Figure 101 Europe Reactor Cooling Systems Market Forecast by Configuration, 2023-2033 (%)
Figure 102 Europe Reactor Cooling Systems Market by Mechanism, 2023-2033 (US$ Mn, AGR (%))
Figure 103 Europe Reactor Cooling Systems Market Forecast by Mechanism 2023-2033 (%)
Figure 104 Europe Reactor Cooling Systems Market by System Type, 2023-2033 (US$ Mn, AGR (%))
Figure 105 Europe Reactor Cooling Systems Market Forecast by System Type, 2023-2033 (%)
Figure 106 Europe Reactor Cooling Systems Market by Component, 2023-2033 (US$ Mn, AGR (%))
Figure 107 Europe Reactor Cooling Systems Market Forecast by Component, 2023-2033 (%)
Figure 108 Germany Reactor Cooling Systems Market by Value, 2023-2033 (US$ Mn, AGR (%))
Figure 109 UK Reactor Cooling Systems Market by Value, 2023-2033 (US$ Mn, AGR (%))
Figure 110 France Reactor Cooling Systems Market by Value, 2023-2033 (US$ Mn, AGR (%))
Figure 111 Russia Reactor Cooling Systems Market by Value, 2023-2033 (US$ Mn, AGR (%))
Figure 112 Spain Reactor Cooling Systems Market by Value, 2023-2033 (US$ Mn, AGR (%))
Figure 113 Rest of Europe Reactor Cooling Systems Market by Value, 2023-2033 (US$ Mn, AGR (%))
Figure 114 Asia Pacific Reactor Cooling Systems Market Attractiveness Index
Figure 115 Asia Pacific Reactor Cooling Systems Market by Region, 2023, 2028 & 2033 (US$ Million)
Figure 116 Asia-Pacific Reactor Cooling Systems Market by Value, 2023-2033 (US$ Mn, AGR (%))
Figure 117 Asia-Pacific Reactor Cooling Systems Market by Country, 2023-2033 (US$ Mn, AGR (%))
Figure 118 Asia-Pacific Reactor Cooling Systems Market by Capacity, 2023-2033 (US$ Mn, AGR (%))
Figure 119 Asia-Pacific Reactor Cooling Systems Market Forecast by Capacity 2023-2033 (%)
Figure 120 Asia-Pacific Reactor Cooling Systems Market by Configuration, 2023-2033 (US$ Mn, AGR (%))
Figure 121 Asia-Pacific Reactor Cooling Systems Market Forecast by Configuration, 2023-2033 (%)
Figure 122 Asia-Pacific Reactor Cooling Systems Market by Mechanism, 2023-2033 (US$ Mn, AGR (%))
Figure 123 Asia-Pacific Reactor Cooling Systems Market Forecast by Mechanism 2023-2033 (%)
Figure 124 Asia-Pacific Reactor Cooling Systems Market by System Type, 2023-2033 (US$ Mn, AGR (%))
Figure 125 Asia-Pacific Reactor Cooling Systems Market Forecast by System Type, 2023-2033 (%)
Figure 126 Asia-Pacific Reactor Cooling Systems Market by Component, 2023-2033 (US$ Mn, AGR (%))
Figure 127 Asia-Pacific Reactor Cooling Systems Market Forecast by Component, 2023-2033 (%)
Figure 128 China Reactor Cooling Systems Market by Value, 2023-2033 (US$ Mn, AGR (%))
Figure 129 India Reactor Cooling Systems Market by Value, 2023-2033 (US$ Mn, AGR (%))
Figure 130 Japan Reactor Cooling Systems Market by Value, 2023-2033 (US$ Mn, AGR (%))
Figure 131 South Korea Reactor Cooling Systems Market by Value, 2023-2033 (US$ Mn, AGR (%))
Figure 132 Australia Reactor Cooling Systems Market by Value, 2023-2033 (US$ Mn, AGR (%))
Figure 133 Rest of Asia-Pacific Reactor Cooling Systems Market by Value, 2023-2033 (US$ Mn, AGR (%))
Figure 134 Middle East & Africa Reactor Cooling Systems Market Attractiveness Index
Figure 135 Middle East & Africa Reactor Cooling Systems Market by Region, 2023, 2028 & 2033 (US$ Million)
Figure 136 Middle East & Africa Reactor Cooling Systems Market by Value, 2023-2033 (US$ Mn, AGR (%))
Figure 137 Middle East & Africa Reactor Cooling Systems Market by Country, 2023-2033 (US$ Mn, AGR (%))
Figure 138 Middle East & Africa Reactor Cooling Systems Market by Capacity, 2023-2033 (US$ Mn, AGR (%))
Figure 139 Middle East & Africa Reactor Cooling Systems Market Forecast by Capacity 2023-2033 (%)
Figure 140 Middle East & Africa Reactor Cooling Systems Market by Configuration, 2023-2033 (US$ Mn, AGR (%))
Figure 141 Middle East & Africa Reactor Cooling Systems Market Forecast by Configuration, 2023-2033 (%)
Figure 142 Middle East & Africa Reactor Cooling Systems Market by Mechanism, 2023-2033 (US$ Mn, AGR (%))
Figure 143 Middle East & Africa Reactor Cooling Systems Market Forecast by Mechanism 2023-2033 (%)
Figure 144 Middle East & Africa Reactor Cooling Systems Market by System Type, 2023-2033 (US$ Mn, AGR (%))
Figure 145 Middle East & Africa Reactor Cooling Systems Market Forecast by System Type, 2023-2033 (%)
Figure 146 Middle East & Africa Reactor Cooling Systems Market by Component, 2023-2033 (US$ Mn, AGR (%))
Figure 147 Middle East & Africa Reactor Cooling Systems Market Forecast by Component, 2023-2033 (%)
Figure 148 GCC Reactor Cooling Systems Market by Value, 2023-2033 (US$ Mn, AGR (%))
Figure 149 South Africa Reactor Cooling Systems Market by Value, 2023-2033 (US$ Mn, AGR (%))
Figure 150 Rest of Middle East & Africa Reactor Cooling Systems Market by Value, 2023-2033 (US$ Mn, AGR (%))
Figure 151 Latin America Reactor Cooling Systems Market Attractiveness Index
Figure 152 Latin America Reactor Cooling Systems Market by Region, 2023, 2028 & 2033 (US$ Million)
Figure 153 Latin America Reactor Cooling Systems Market by Value, 2023-2033 (US$ Mn, AGR (%))
Figure 154 Latin America Reactor Cooling Systems Market by Country, 2023-2033 (US$ Mn, AGR (%))
Figure 155 Latin America Reactor Cooling Systems Market Forecast by Country, 2023-2033 (%)
Figure 156 Latin America Reactor Cooling Systems Market by Capacity, 2023-2033 (US$ Mn, AGR (%))
Figure 157 Latin America Reactor Cooling Systems Market Forecast by Capacity 2023-2033 (%)
Figure 158 Latin America Reactor Cooling Systems Market by Configuration, 2023-2033 (US$ Mn, AGR (%))
Figure 159 Latin America Reactor Cooling Systems Market Forecast by Configuration, 2023-2033 (%)
Figure 160 Latin America Reactor Cooling Systems Market by Mechanism, 2023-2033 (US$ Mn, AGR (%))
Figure 161 Latin America Reactor Cooling Systems Market Forecast by Mechanism 2023-2033 (%)
Figure 162 Latin America Reactor Cooling Systems Market by System Type, 2023-2033 (US$ Mn, AGR (%))
Figure 163 Latin America Reactor Cooling Systems Market Forecast by System Type, 2023-2033 (%)
Figure 164 Latin America Reactor Cooling Systems Market by Component, 2023-2033 (US$ Mn, AGR (%))
Figure 165 Latin America Reactor Cooling Systems Market Forecast by Component, 2023-2033 (%)
Figure 166 Brazil Reactor Cooling Systems Market by Value, 2023-2033 (US$ Mn, AGR (%))
Figure 167 Argentina Reactor Cooling Systems Market by Value, 2023-2033 (US$ Mn, AGR (%))
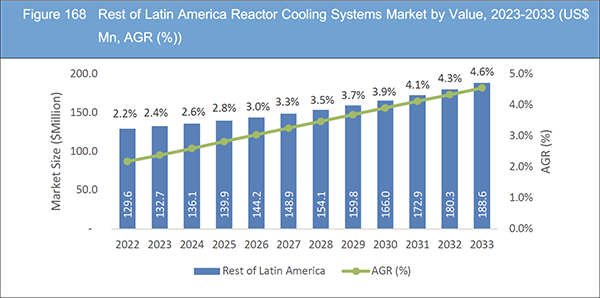
Figure 168 Rest of Latin America Reactor Cooling Systems Market by Value, 2023-2033 (US$ Mn, AGR (%))
Figure 169 Reactor Cooling Systems Market: Company Share, 2022
Figure 170 General Electric Company. Net Revenue, 2018-2022 (US$ Million, AGR%)
Figure 171 General Electric Company.: R&D, 2018-2022 (US$ Million, AGR%)
Figure 172 General Electric Company.: Regional Revenue Share, 2022 (%)
Figure 173 General Electric Company.: Business Segment Revenue Share, 2022 (%)
Figure 174 Mitsubishi Heavy Industries, Ltd.: Net Revenue, 2018-2022 (US$ Million, AGR%)
Figure 175 Mitsubishi Heavy Industries, Ltd.: R&D, 2018-2022 (US$ Million, AGR%)
Figure 176 Mitsubishi Heavy Industries, Ltd.: Regional Revenue Share, 2022 (%)
Figure 177 Mitsubishi Heavy Industries, Ltd.: Business Segment Revenue Share, 2022 (%)
Figure 178 Babcock International Group plc.: Net Revenue, 2018-2022 (US$ Million, AGR%)
Figure 179 Babcock International Group plc.: Regional Revenue Share, 2022 (%)
Figure 180 Babcock International Group plc.: Business Segment Revenue Share, 2022 (%)
Figure 181 Harbin Electric Company Limited. Net Revenue, 2018-2022 (US$ Million, AGR%)
Figure 182 Harbin Electric Company Limited. R&D, 2018-2022 (US$ Million, AGR%)
Figure 183 Harbin Electric Company Limited. Regional Revenue Share, 2022 (%)
Figure 184 Harbin Electric Company Limited. Business Segment Revenue Share, 2022 (%)
Figure 185 Dongfang Electric Corporation. Net Revenue, 2018-2022 (US$ Million, AGR%)
Figure 186 Dongfang Electric Corporation. R&D, 2018-2022 (US$ Million, AGR%)
Figure 187 Dongfang Electric Corporation. Regional Revenue Share, 2022 (%)
Figure 188 Dongfang Electric Corporation. Business Segment Revenue Share, 2022 (%)
Figure 189 Bharat Heavy Electricals Limited (BHEL).: Net Revenue, 2018-2022 (US$ Million, AGR%)
Figure 190 Bharat Heavy Electricals Limited (BHEL).: R&D, 2018-2022 (US$ Million, AGR%)
Figure 191 Bharat Heavy Electricals Limited (BHEL): Regional Revenue Share, 2022 (%)
Figure 192 Bharat Heavy Electricals Limited (BHEL): Business Segment Revenue Share, 2022 (%)
Figure 193 Sulzer Ltd.: Net Revenue, 2018-2022 (US$ Million, AGR%)
Figure 194 Sulzer Ltd.: R&D, 2018-2022 (US$ Million, AGR%)
Figure 195 Sulzer Ltd.: Regional Revenue Share, 2022 (%)
Figure 196 Sulzer Ltd.: Business Segment Revenue Share, 2022 (%)
Figure 197 Shanghai Electric Group Company Limited. Net Revenue, 2018-2022 (US$ Million, AGR%)
Figure 198 Shanghai Electric Group Company Limited. R&D, 2018-2022 (US$ Million, AGR%)
Figure 199 Shanghai Electric Group Company Limited. Regional Revenue Share, 2022 (%)
Figure 200 Shanghai Electric Group Company Limited. Business Segment Revenue Share, 2022 (%)
Figure 201 Rolls-Royce Limited. Net Revenue, 2018-2022 (US$ Million, AGR%)
Figure 202 Rolls-Royce Limited. R&D, 2018-2022 (US$ Million, AGR%)
Figure 203 Rolls-Royce Limited. Regional Revenue Share, 2022 (%)
Figure 204 Rolls-Royce Limited. Business Segment Revenue Share, 2022 (%)
Figure 205 IHI Corporation. Net Revenue, 2018-2022 (US$ Million, AGR%)
Figure 206 IHI Corporation.: R&D, 2018-2022 (US$ Million, AGR%)
Figure 207 IHI Corporation.: Regional Revenue Share, 2022 (%)
Figure 208 IHI Corporation.: Business Segment Revenue Share, 2022 (%)
List of Companies Profiled in the report
Areva S.A.
Babcock International Group plc
Bharat Heavy Electricals Limited (BHEL)
China Nuclear Power Engineering Co Ltd
Dongfang Electric Corporation
General Electric Company
Harbin Electric Company Limited
IHI Corporation
KSB SE & Co. KGaA
Mitsubishi Heavy Industries, Ltd
Rolls-Royce Limited
Rosatom State Nuclear Energy Corporation
Shanghai Electric Group Company Limited
Sulzer Ltd.
Westinghouse Electric Company LLC
List of Other Companies Mentioned in the report
ABB Group
Alfa Laval
Bechtel Corporation
BWX Technologies, Inc.
Doosan Heavy Industries & Construction
EDF Group
Framatome
General Electric Company (GE)
Hitachi, Ltd.
Korea Hydro & Nuclear Power (KHNP)
Larsen & Toubro Limited (L&T)
Mitsubishi Heavy Industries, Ltd.
Rolls-Royce Holdings plc
Rosatom State Atomic Energy Corporation
Siemens Energy AG
SPX Cooling Technologies
TOSHIBA Energy Systems & Solutions Corporation
Westinghouse Electric Company
X-energy
Zio-Podolsk
List of Associations Mentioned in the Report
American Nuclear Society (ANS)
Asia Nuclear Business Platform (ANBP)
Australian Nuclear Science and Technology Organisation (ANSTO)
Brazilian Nuclear Energy Association (ABEN)
Canadian Nuclear Association (CNA)
China National Nuclear Corporation (CNNC)
Electric Power Research Institute (EPRI)
European Nuclear Society (ENS)
Indian Nuclear Society (INS)
International Atomic Energy Agency (IAEA)
International Nuclear Societies Council (INSC)
Japan Atomic Industrial Forum (JAIF)
Korea Atomic Energy Research Institute (KAERI)
National Organization for the Development of Atomic Energy (Rosatom, Russia)
Nuclear Energy Agency (NEA)
Nuclear Energy Institute (NEI)
Nuclear Regulatory Commission (NRC)
South African Nuclear Energy Corporation (NECSA)
World Association of Nuclear Operators (WANO)
World Nuclear Association (WNA)