The AI Applications in Nuclear Reactors Market Report 2023-2033: This report will prove invaluable to leading firms striving for new revenue pockets if they wish to better understand the industry and its underlying dynamics. It will be useful for companies that would like to expand into different industries or to expand their existing operations in a new region.
AI’s Role in Enhancing Safety in Nuclear Reactors Is Multifaceted
Machine learning algorithms continuously monitor data from various sensors, such as temperature, pressure, and radiation levels, detecting deviations from normal operating conditions. Early anomaly detection allows operators to take preventive measures, preventing potential equipment failures or operational issues that could lead to accidents. Additionally, AI-based predictive maintenance systems analyze historical data to predict equipment wear and tear, helping schedule maintenance proactively, thereby reducing the risk of unplanned shutdowns and ensuring the continuous safe operation of the reactor.
Optimizing Nuclear Reactor Performance
AI’s ability to process large volumes of data in real-time enables it to optimize nuclear reactor performance. Machine learning algorithms analyse sensor data, control parameters, and historical operation data to make adjustments in reactor operations, maximizing power output while ensuring safety parameters are met. By fine-tuning operational parameters, AI-driven control systems can optimize fuel efficiency, reduce operational costs, and extend the operational life of the reactor.
What Questions Should You Ask before Buying a Market Research Report?
• How is the AI applications in nuclear reactors market evolving?
• What is driving and restraining the AI applications in nuclear reactors market?
• How will each AI applications in nuclear reactors submarket segment grow over the forecast period and how much revenue will these submarkets account for in 2033?
• How will the market shares for each AI applications in nuclear reactors submarket develop from 2023 to 2033?
• What will be the main driver for the overall market from 2023 to 2033?
• Will leading AI applications in nuclear reactors markets broadly follow the macroeconomic dynamics, or will individual national markets outperform others?
• How will the market shares of the national markets change by 2033 and which geographical region will lead the market in 2033?
• Who are the leading players and what are their prospects over the forecast period?
• What are the AI applications in nuclear reactors projects for these leading companies?
• How will the industry evolve during the period between 2023 and 2033? What are the implications of AI applications in nuclear reactors projects taking place now and over the next 10 years?
• Is there a greater need for product commercialisation to further scale the AI applications in nuclear reactors market?
• Where is the AI applications in nuclear reactors market heading and how can you ensure you are at the forefront of the market?
• What are the best investment options for new product and service lines?
• What are the key prospects for moving companies into a new growth path and C-suite?
You need to discover how this will impact the AI applications in nuclear reactors market today, and over the next 10 years:
• Our 410-page report provides 132 tables and 188 charts/graphs exclusively to you.
• The report highlights key lucrative areas in the industry so you can target them – NOW.
• It contains in-depth analysis of global, regional and national sales and growth.
• It highlights for you the key successful trends, changes and revenue projections made by your competitors.
This report tells you TODAY how the AI applications in nuclear reactors market will develop in the next 10 years, and in line with the variations in COVID-19 economic recession and bounce. This market is more critical now than at any point over the last 10 years.
Forecasts to 2033 and other analyses reveal commercial prospects
• In addition to revenue forecasting to 2033, our new study provides you with recent results, growth rates, and market shares.
• You will find original analyses, with business outlooks and developments.
• Discover qualitative analyses (including market dynamics, drivers, opportunities, restraints and challenges), cost structure, impact of rising AI applications in nuclear reactors prices and recent developments.
This report includes data analysis and invaluable insight into how COVID-19 will affect the industry and your company. Four COVID-19 recovery patterns and their impact, namely, “V”, “L”, “W” and “U” are discussed in this report.
Segments Covered in the Report
Market Segment by Design
• Nuclear Reactor Core Design
• Thermal-hydraulic Simulation Analysis
• Radiation Shielding Design
Market Segment by Systems
• Anomaly Detection Systems
• Predictive Maintenance Solutions
• Real-time Monitoring and Alert Systems
• Mitigation Strategies and Measures
Market Segment by Optimization
• Fuel Consumption Optimization
• Reactor Operations Optimization
• Enhanced Energy Output and Efficiency
• Decommissioning Processes Optimization
• Other Optimization
Market Segment by Technology
• Deep Learning (DL)
• Machine Learning (ML)
• Natural Language Processing (NLP)
• Reinforcement Learning (RL)
• Robotics and Automation
• Other Technology

In addition to the revenue predictions for the overall world market and segments, you will also find revenue forecasts for four regional and 20 leading national markets:
North America
• U.S.
• Canada
Europe
• Russia
• Spain
• United Kingdom
• France
• Ukraine
• Rest of Europe
Asia Pacific
• China
• Japan
• India
• Pakistan
• South Korea
• Rest of Asia Pacific
Latin America
• Brazil
• Mexico
• Rest of Latin America
Middle East & Africa
• GCC
• South Africa
• Rest of Middle East & Africa
Need industry data? Please contact us today.
The report also includes profiles and for some of the leading companies in the AI Applications in Nuclear Reactors Market, 2023 to 2033, with a focus on this segment of these companies’ operations.
Leading companies and the potential for market growth
• ABB Ltd
• BWX Technologies, Inc.
• Framatome
• GE Hitachi Nuclear Energy
• General Electric Company
• Honeywell International Inc.
• Kinectrics
• Mitsubishi Heavy Industries Ltd
• NuScale Power Corporation
• Rolls-Royce Limited
• Siemens Energy AG
• SNC-Lavalin Group Inc.
• TerraPower
• Terrestrial Energy
• Toshiba Corporation
Overall world revenue for AI Applications in Nuclear Reactors Market, 2023 to 2033 in terms of value the market will surpass US$593.0 million in 2023, our work calculates. We predict strong revenue growth through to 2033. Our work identifies which organizations hold the greatest potential. Discover their capabilities, progress, and commercial prospects, helping you stay ahead.
How will the AI Applications in Nuclear Reactors Market, 2023 to 2033 report help you?
In summary, our 400+ page report provides you with the following knowledge:
• Revenue forecasts to 2033 for AI Applications in Nuclear Reactors Market, 2023 to 2033 Market, with forecasts for design, optimization, technology, systems, each forecast at a global and regional level – discover the industry’s prospects, finding the most lucrative places for investments and revenues.
• Revenue forecasts to 2033 for four regional and 20 key national markets – See forecasts for the AI Applications in Nuclear Reactors Market, 2023 to 2033 market in North America, Europe, Asia-Pacific, Latin America and Middle East & Africa. Also forecasted is the market in the US, Canada, Brazil, Russia, France, UK, Ukraine, China, India, Japan, and Australia among other prominent economies.
• Prospects for established firms and those seeking to enter the market – including company profiles for 15 of the major companies involved in the AI Applications in Nuclear Reactors Market, 2023 to 2033.
Find quantitative and qualitative analyses with independent predictions. Receive information that only our report contains, staying informed with invaluable business intelligence.
Information found nowhere else
With our new report, you are less likely to fall behind in knowledge or miss out on opportunities. See how our work could benefit your research, analyses, and decisions. Visiongain’s study is for everybody needing commercial analyses for the AI Applications in Nuclear Reactors Market, 2023 to 2033, market-leading companies. You will find data, trends and predictions.
To access the data contained in this document please email contactus@visiongain.com
Buy our report today AI Applications in Nuclear Reactors Market Report 2023-2033: Forecasts by Design (Nuclear Reactor Core Design, Thermal-hydraulic Simulation Analysis, Radiation Shielding Design), by Systems (Anomaly Detection Systems, Predictive Maintenance Solutions, Real-time Monitoring and Alert Systems, Mitigation Strategies and Measures), by Optimisation (Fuel Consumption Optimisation, Reactor Operations Optimisation, Enhanced Energy Output and Efficiency, Decommissioning Processes Optimisation, Other), by Technology (Deep Learning (DL), Machine Learning (ML), Natural Language Processing (NLP), Reinforcement Learning (RL), Robotics and Automation, Other) AND Regional and Leading National Market Analysis PLUS Analysis of Leading Companies AND COVID-19 Impact and Recovery Pattern Analysis. Avoid missing out by staying informed – order our report now.
Visiongain is a trading partner with the US Federal Government
CCR Ref number: KD4R6
Do you have any custom requirements we can help you with? Any need for a specific country, geo region, market segment or specific company information? Contact us today, we can discuss your needs and see how we can help: contactus@visiongain.com
1 Report Overview
1.1 Objectives of the Study
1.2 Introduction to Reactors Market
1.3 What This Report Delivers
1.4 Why You Should Read This Report
1.5 Key Questions Answered by This Analytical Report
1.6 Who Is This Report for?
1.7 Methodology
1.7.1 Market Definitions
1.7.2 Market Evaluation & Forecasting Methodology
1.7.3 Data Validation
1.8 Frequently Asked Questions (FAQs)
1.9 Associated Visiongain Reports
1.10 About Visiongain
2 Executive Summary
3 Market Overview
3.1 Key Findings
3.2 Market Dynamics
3.2.1 Market Driving Factors
3.2.2 Market Restraining Factors
3.2.3 Market Opportunities
3.3 Porter’s Five Forces Analysis
3.3.1 Bargaining Power of Suppliers (Low to Medium)
3.3.2 Bargaining Power of Buyers (High)
3.3.3 Competitive Rivalry (Medium)
3.3.4 Threat from Substitutes (Low)
3.3.5 Threat of New Entrants (Low)
3.4 COVID-19 Impact Analysis
3.5 PEST Analysis
4 AI Application in Nuclear Reactors Market Analysis by Design
4.1 Key Findings
4.2 Design Segment: Market Attractiveness Index
4.3 AI Application in Nuclear Reactors Market Size Estimation and Forecast by Design
4.4 Nuclear Reactor Core Design
4.4.1 Market Size by Region, 2023-2033 (US$Million)
4.4.2 Market Share by Region, 2023 & 2033 (%)
4.5 Thermal-hydraulic Simulation Analysis
4.5.1 Market Size by Region, 2023-2033 (US$Million)
4.5.2 Market Share by Region, 2023 & 2033 (%)
4.6 Radiation Shielding Design
4.6.1 Market Size by Region, 2023-2033 (US$Million)
4.6.2 Market Share by Region, 2023 & 2033 (%)
5 AI Application in Nuclear Reactors Market Analysis by Systems
5.1 Key Findings
5.2 Systems Segment: Market Attractiveness Index
5.3 AI Application in Nuclear Reactors Market Size Estimation and Forecast by Systems
5.4 Anomaly Detection Systems
5.4.1 Market Size by Region, 2023-2033 (US$ Million)
5.4.2 Market Share by Region, 2023 & 2033 (%)
5.5 Predictive Maintenance Solutions
5.5.1 Market Size by Region, 2023-2033 (US$Million)
5.5.2 Market Share by Region, 2023 & 2033 (%)
5.6 Real-time Monitoring and Alert Systems
5.6.1 Market Size by Region, 2023-2033 (US$Million)
5.6.2 Market Share by Region, 2023 & 2033 (%)
5.7 Mitigation Strategies and Measures
5.7.1 Market Size by Region, 2023-2033 (US$Million)
5.7.2 Market Share by Region, 2023 & 2033 (%)
6 AI Application in Nuclear Reactors Market Analysis by Optimization
6.1 Key Findings
6.2 Optimization Segment: Market Attractiveness Index
6.3 AI Application in Nuclear Reactors Market Size Estimation and Forecast by Optimization
6.4 Fuel Consumption Optimization
6.4.1 Market Size by Region, 2023-2033 (US$Million)
6.4.2 Market Share by Region, 2023 & 2033 (%)
6.5 Reactor Operations Optimization
6.5.1 Market Size by Region, 2023-2033 (US$Million)
6.5.2 Market Share by Region, 2023 & 2033 (%)
6.6 Enhanced Energy Output and Efficiency
6.6.1 Market Size by Region, 2023-2033 (US$Million)
6.6.2 Market Share by Region, 2023 & 2033 (%)
6.7 Decommissioning Processes Optimization
6.7.1 Market Size by Region, 2023-2033 (US$Million)
6.7.2 Market Share by Region, 2023 & 2033 (%)
6.8 Other Process Optimization
6.8.1 Market Size by Region, 2023-2033 (US$Million)
6.8.2 Market Share by Region, 2023 & 2033 (%)
7 AI Application in Nuclear Reactors Market Analysis by Technology
7.1 Key Findings
7.2 Technology Segment: Market Attractiveness Index
7.3 AI Application in Nuclear Reactors Market Size Estimation and Forecast by Technology
7.4 Deep Learning (DL)
7.4.1 Market Size by Region, 2023-2033 (US$Million)
7.4.2 Market Share by Region, 2023 & 2033 (%)
7.5 Machine Learning (ML)
7.5.1 Market Size by Region, 2023-2033 (US$Million)
7.5.2 Market Share by Region, 2023 & 2033 (%)
7.6 Natural Language Processing (NLP)
7.6.1 Market Size by Region, 2023-2033 (US$Million)
7.6.2 Market Share by Region, 2023 & 2033 (%)
7.7 Reinforcement Learning (RL)
7.7.1 Market Size by Region, 2023-2033 (US$Million)
7.7.2 Market Share by Region, 2023 & 2033 (%)
7.8 Robotics and Automation
7.8.1 Market Size by Region, 2023-2033 (US$Million)
7.8.2 Market Share by Region, 2023 & 2033 (%)
7.9 Other Type
7.9.1 Market Size by Region, 2023-2033 (US$Million)
7.9.2 Market Share by Region, 2023 & 2033 (%)
8 AI Application in Nuclear Reactors Market Analysis by Region
8.1 Key Findings
8.2 Regional Market Size Estimation and Forecast
9 North America AI Application in Nuclear Reactors Market Analysis
9.1 Key Findings
9.2 North America AI Application in Nuclear Reactors Market Attractiveness Index
9.3 North America AI Application in Nuclear Reactors Market by Country, 2023, 2028 & 2033 (US$Million)
9.4 North America AI Application in Nuclear Reactors Market Size Estimation and Forecast
9.5 North America AI Application in Nuclear Reactors Market Size Estimation and Forecast by Country
9.6 North America AI Application in Nuclear Reactors Market Size Estimation and Forecast by Design
9.7 North America AI Application in Nuclear Reactors Market Size Estimation and Forecast by Systems
9.8 North America AI Application in Nuclear Reactors Market Size Estimation and Forecast by Optimization
9.9 North America AI Application in Nuclear Reactors Market Size Estimation and Forecast by Technology
9.10 U.S. AI Application in Nuclear Reactors Market Analysis
9.11 Canada AI Application in Nuclear Reactors Market Analysis
10 Europe AI Application in Nuclear Reactors Market Analysis
10.1 Key Findings
10.2 Europe AI Application in Nuclear Reactors Market Attractiveness Index
10.3 Europe AI Application in Nuclear Reactors Market by Country, 2023, 2028 & 2033 (US$Million)
10.4 Europe AI Application in Nuclear Reactors Market Size Estimation and Forecast
10.5 Europe AI Application in Nuclear Reactors Market Size Estimation and Forecast by Country
10.6 Europe AI Application in Nuclear Reactors Market Size Estimation and Forecast by Design
10.7 Europe AI Application in Nuclear Reactors Market Size Estimation and Forecast by Systems
10.8 Europe AI Application in Nuclear Reactors Market Size Estimation and Forecast by Optimization
10.9 Europe AI Application in Nuclear Reactors Market Size Estimation and Forecast by Technology
10.10 UK AI Application in Nuclear Reactors Market Analysis
10.11 France AI Application in Nuclear Reactors Market Analysis
10.12 Ukraine AI Application in Nuclear Reactors Market Analysis
10.13 Russia AI Application in Nuclear Reactors Market Analysis
10.14 Spain AI Application in Nuclear Reactors Market Analysis
10.15 Rest of Europe AI Application in Nuclear Reactors Market Analysis
11 Asia-Pacific AI Application in Nuclear Reactors Market Analysis
11.1 Key Findings
11.2 Asia-Pacific AI Application in Nuclear Reactors Market Attractiveness Index
11.3 Asia-Pacific AI Application in Nuclear Reactors Market by Country, 2023, 2028 & 2033 (US$Million)
11.4 Asia-Pacific AI Application in Nuclear Reactors Market Size Estimation and Forecast
11.5 Asia-Pacific AI Application in Nuclear Reactors Market Size Estimation and Forecast by Country
11.6 Asia-Pacific AI Application in Nuclear Reactors Market Size Estimation and Forecast by Design
11.7 Asia-Pacific AI Application in Nuclear Reactors Market Size Estimation and Forecast by Systems
11.8 Asia-Pacific AI Application in Nuclear Reactors Market Size Estimation and Forecast by Optimization
11.9 Asia-Pacific AI Application in Nuclear Reactors Market Size Estimation and Forecast by Technology
11.10 China AI Application in Nuclear Reactors Market Analysis
11.11 India AI Application in Nuclear Reactors Market Analysis
11.12 Japan AI Application in Nuclear Reactors Market Analysis
11.13 South Korea AI Application in Nuclear Reactors Market Analysis
11.14 Pakistan AI Application in Nuclear Reactors Market Analysis
11.15 Rest of Asia-Pacific AI Application in Nuclear Reactors Market Analysis
12 Middle East and Africa AI Application in Nuclear Reactors Market Analysis
12.1 Key Findings
12.2 Middle East and Africa AI Application in Nuclear Reactors Market Attractiveness Index
12.3 Middle East and Africa AI Application in Nuclear Reactors Market by Country, 2023, 2028 & 2033 (US$Million)
12.4 Middle East and Africa AI Application in Nuclear Reactors Market Size Estimation and Forecast
12.5 Middle East and Africa AI Application in Nuclear Reactors Market Size Estimation and Forecast by Country
12.6 Middle East and Africa AI Application in Nuclear Reactors Market Size Estimation and Forecast by Design
12.7 Middle East and Africa AI Application in Nuclear Reactors Market Size Estimation and Forecast by Systems
12.8 Middle East and Africa AI Application in Nuclear Reactors Market Size Estimation and Forecast by Optimization
12.9 Middle East and Africa AI Application in Nuclear Reactors Market Size Estimation and Forecast by Technology
12.10 GCC AI Application in Nuclear Reactors Market Analysis
12.11 South Africa AI Application in Nuclear Reactors Market Analysis
12.12 Rest of Middle East & Africa AI Application in Nuclear Reactors Market Analysis
13 Latin America AI Application in Nuclear Reactors Market Analysis
13.1 Key Findings
13.2 Latin America AI Application in Nuclear Reactors Market Attractiveness Index
13.3 Latin America AI Application in Nuclear Reactors Market by Country, 2023, 2028 & 2033 (US$Million)
13.4 Latin America AI Application in Nuclear Reactors Market Size Estimation and Forecast
13.5 Latin America AI Application in Nuclear Reactors Market Size Estimation and Forecast by Country
13.6 Latin America AI Application in Nuclear Reactors Market Size Estimation and Forecast by Design
13.7 Latin America AI Application in Nuclear Reactors Market Size Estimation and Forecast by Systems
13.8 Latin America AI Application in Nuclear Reactors Market Size Estimation and Forecast by Optimization
13.9 Latin America AI Application in Nuclear Reactors Market Size Estimation and Forecast by Technology
13.10 Brazil AI Application in Nuclear Reactors Market Analysis
13.11 Argentina AI Application in Nuclear Reactors Market Analysis
13.12 Rest of Latin America AI Application in Nuclear Reactors Market Analysis
14 Company Profiles
14.1 Competitive Landscape, 2022
14.2 Strategic Outlook
14.3 General Electric Company
14.3.1 Company Snapshot
14.3.2 Company Overview
14.3.3 Financial Analysis
14.3.4 Product Benchmarking
14.3.5 Strategic Outlook
14.4 Toshiba Corporation
14.4.1 Company Snapshot
14.4.2 Company Overview
14.4.3 Financial Analysis
14.4.4 Product Benchmarking
14.4.5 Strategic Outlook
14.5 Mitsubishi Heavy Industries Ltd
14.5.1 Company Snapshot
14.5.2 Company Overview
14.5.3 Financial Analysis
14.5.4 Product Benchmarking
14.5.5 Strategic Outlook
14.6 Siemens Energy AG
14.6.1 Company Snapshot
14.6.2 Company Overview
14.6.3 Financial Analysis
14.6.4 Product Benchmarking
14.6.5 Strategic Outlook
14.7 Rolls-Royce Limited
14.7.1 Company Snapshot
14.7.2 Company Overview
14.7.3 Financial Analysis
14.7.4 Product Benchmarking
14.7.5 Strategic Outlook
14.8 ABB Ltd
14.8.1 Company Snapshot
14.8.2 Company Overview
14.8.3 Financial Analysis
14.8.4 Product Benchmarking
14.8.5 Strategic Outlook
14.9 Honeywell International Inc
14.9.1 Company Snapshot
14.9.2 Company Overview
14.9.3 Financial Analysis
14.9.4 Product Benchmarking
14.9.5 Strategic Outlook
14.10 GE Hitachi Nuclear Energy
14.10.1 Company Snapshot
14.10.2 Company Overview
14.10.3 Product Benchmarking
14.10.4 Strategic Outlook
14.11 Framatome
14.11.1 Company Snapshot
14.11.2 Company Overview
14.11.3 Product Benchmarking
14.11.4 Strategic Outlook
14.12 TerraPower
14.12.1 Company Snapshot
14.12.2 Company Overview
14.12.3 Product Benchmarking
14.12.4 Strategic Outlook
14.13 Terrestrial Energy
14.13.1 Company Snapshot
14.13.2 Company Overview
14.13.3 Product Benchmarking
14.13.4 Strategic Outlook
14.14 Kinectrics
14.14.1 Company Snapshot
14.14.2 Company Overview
14.14.3 Product Benchmarking
14.14.4 Strategic Outlook
14.15 BWX Technologies, Inc.
14.15.1 Company Snapshot
14.15.2 Company Overview
14.15.3 Financial Analysis
14.15.4 Product Benchmarking
14.15.5 Strategic Outlook
14.16 SNC-Lavalin Group Inc.
14.16.1 Company Snapshot
14.16.2 Company Overview
14.16.3 Financial Analysis
14.16.4 Product Benchmarking
14.16.5 Strategic Outlook
14.17 NuScale Power Corporation
14.17.1 Company Snapshot
14.17.2 Company Overview
14.17.3 Product Benchmarking
14.17.4 Strategic Outlook
15 Conclusion and Recommendations
15.1 Concluding Remarks from Visiongain
15.2 Recommendations for Market Players
List of Tables
Table 1 AI Application in Nuclear Reactors Market Snapshot, 2023 & 2033 (US$ Million, CAGR %)
Table 2 Nuclear statistics by U.S (End of 2021)
Table 3 Grid Connections in 2023
Table 4 Grid Connection’s Construction Started
Table 5 World Population 2015- 2020
Table 6 Global AI Applications in Nuclear Reactors Market Forecast, 2023-2033 (US$ Mn, AGR (%), CAGR (%)) (V-Shaped Recovery Scenario)
Table 7 Global AI Applications in Nuclear Reactors Market by Region, 2023-2033 (US$ Mn, AGR (%), CAGR (%)) (V-Shaped Recovery Scenario)
Table 8 Global AI Applications in Nuclear Reactors Market Forecast, 2023-2033 (US$ Mn, AGR (%), CAGR (%)) (U-Shaped Recovery Scenario)
Table 9 Global AI Applications in Nuclear Reactors Market by Region, 2023-2033 (US$ Mn, AGR (%), CAGR (%)) (U-Shaped Recovery Scenario)
Table 10 Global AI Applications in Nuclear Reactors Market Forecast, 2023-2033 (US$ Mn, AGR (%), CAGR (%)) (W-Shaped Recovery Scenario)
Table 11 Global AI Applications in Nuclear Reactors Market by Region, 2023-2033 (US$ Mn, AGR (%), CAGR (%)) (W-Shaped Recovery Scenario)
Table 12 Global AI Applications in Nuclear Reactors Market Forecast, 2023-2033 (US$ Mn, AGR (%), CAGR (%)) (L-Shaped Recovery Scenario)
Table 13 Global AI Applications in Nuclear Reactors Market by Region, 2023-2033 (US$ Mn, AGR (%), CAGR (%)) (L-Shaped Recovery Scenario)
Table 14 Global AI Applications in Nuclear Reactors Market by Design, 2023-2033 (US$ Mn, AGR (%), CAGR (%))
Table 15 Nuclear Reactor Core Design Market by Region, 2023-2033 (US$ Mn, AGR (%), CAGR (%))
Table 16 Thermal-hydraulic Simulation Analysis Market by Region, 2023-2033 (US$ Mn, AGR (%), CAGR (%))
Table 17 Radiation Shielding Design Market by Region, 2023-2033 (US$ Mn, AGR (%), CAGR (%))
Table 18 Global AI Applications in Nuclear Reactors Market by Systems, 2023-2033 (US$ Mn, AGR (%), CAGR (%))
Table 19 Anomaly Detection Systems Market by Region, 2023-2033 (US$ Mn, AGR (%), CAGR (%))
Table 20 Predictive Maintenance Solutions Market by Region, 2023-2033 (US$ Mn, AGR (%), CAGR (%))
Table 21 Real-time Monitoring and Alert Systems Market by Region, 2023-2033 (US$ Mn, AGR (%), CAGR (%))
Table 22 Mitigation Strategies and Measures Market by Region, 2023-2033 (US$ Mn, AGR (%), CAGR (%))
Table 23 Global AI Applications in Nuclear Reactors Market by Optimization, 2023-2033 (US$ Mn, AGR (%), CAGR (%))
Table 24 Fuel Consumption Optimization Market by Region, 2023-2033 (US$ Mn, AGR (%), CAGR (%))
Table 25 Reactor Operations Optimization Market by Region, 2023-2033 (US$ Mn, AGR (%), CAGR (%))
Table 26 Enhanced Energy Output and Efficiency Market by Region, 2023-2033 (US$ Mn, AGR (%), CAGR (%))
Table 27 Decommissioning Processes Optimization Market by Region, 2023-2033 (US$ Mn, AGR (%), CAGR (%))
Table 28 Other Optimization Market by Region, 2023-2033 (US$ Mn, AGR (%), CAGR (%))
Table 29 Global AI Applications in Nuclear Reactors Market by Technology, 2023-2033 (US$ Mn, AGR (%), CAGR (%))
Table 30 Deep Learning (DL) Market by Region, 2023-2033 (US$ Mn, AGR (%), CAGR (%))
Table 31 Machine Learning (ML) Market by Region, 2023-2033 (US$ Mn, AGR (%), CAGR (%))
Table 32 Natural Language Processing (NLP) Market by Region, 2023-2033 (US$ Mn, AGR (%), CAGR (%))
Table 33 Reinforcement Learning (RL) Market by Region, 2023-2033 (US$ Mn, AGR (%), CAGR (%))
Table 34 Robotics and Automation Market by Region, 2023-2033 (US$ Mn, AGR (%), CAGR (%))
Table 35 Other Technology Market by Region, 2023-2033 (US$ Mn, AGR (%), CAGR (%))
Table 36 AI Application in Nuclear Reactors Market Forecast by Region, 2023-2033 (US$Million, AGR%, CAGR%)
Table 37 North America AI Applications in Nuclear Reactors Market by Value, 2023-2033 (US$ Mn, AGR (%), CAGR (%))
Table 38 North America AI Applications in Nuclear Reactors Market by Country, 2023-2033 (US$ Mn, AGR (%), CAGR (%))
Table 39 North America AI Applications in Nuclear Reactors Market by Design, 2023-2033 (US$ Mn, AGR (%), CAGR (%))
Table 40 North America AI Applications in Nuclear Reactors Market by Systems, 2023-2033 (US$ Mn, AGR (%), CAGR (%))
Table 41 North America AI Applications in Nuclear Reactors Market by Optimization, 2023-2033 (US$ Mn, AGR (%), CAGR (%))
Table 42 North America AI Applications in Nuclear Reactors Market by Technology, 2023-2033 (US$ Mn, AGR (%), CAGR (%))
Table 43 US AI Applications in Nuclear Reactors Market by Value, 2023-2033 (US$ Mn, AGR (%), CAGR (%))
Table 44 Canada AI Applications in Nuclear Reactors Market by Value, 2023-2033 (US$ Mn, AGR (%), CAGR (%))
Table 45 Europe AI Applications in Nuclear Reactors Market by Value, 2023-2033 (US$ Mn, AGR (%), CAGR (%))
Table 46 Europe AI Applications in Nuclear Reactors Market by Country, 2023-2033 (US$ Mn, AGR (%), CAGR (%))
Table 47 Europe AI Applications in Nuclear Reactors Market by Design, 2023-2033 (US$ Mn, AGR (%), CAGR (%))
Table 48 Europe AI Applications in Nuclear Reactors Market by Systems, 2023-2033 (US$ Mn, AGR (%), CAGR (%))
Table 49 Europe AI Applications in Nuclear Reactors Market by Optimization, 2023-2033 (US$ Mn, AGR (%), CAGR (%))
Table 50 Europe AI Applications in Nuclear Reactors Market by Technology, 2023-2033 (US$ Mn, AGR (%), CAGR (%))
Table 51 UK AI Applications in Nuclear Reactors Market by Value, 2023-2033 (US$ Mn, AGR (%), CAGR (%))
Table 52 France AI Applications in Nuclear Reactors Market by Value, 2023-2033 (US$ Mn, AGR (%), CAGR (%))
Table 53 Ukraine AI Applications in Nuclear Reactors Market by Value, 2023-2033 (US$ Mn, AGR (%), CAGR (%))
Table 54 Russia AI Applications in Nuclear Reactors Market by Value, 2023-2033 (US$ Mn, AGR (%), CAGR (%))
Table 55 Spain AI Applications in Nuclear Reactors Market by Value, 2023-2033 (US$ Mn, AGR (%), CAGR (%))
Table 56 Rest of Europe AI Applications in Nuclear Reactors Market by Value, 2023-2033 (US$ Mn, AGR (%), CAGR (%))
Table 57 Asia-Pacific AI Applications in Nuclear Reactors Market by Value, 2023-2033 (US$ Mn, AGR (%), CAGR (%))
Table 58 Asia-Pacific AI Applications in Nuclear Reactors Market by Country, 2023-2033 (US$ Mn, AGR (%), CAGR (%))
Table 59 Asia-Pacific AI Applications in Nuclear Reactors Market by Design, 2023-2033 (US$ Mn, AGR (%), CAGR (%))
Table 60 Asia-Pacific AI Applications in Nuclear Reactors Market by Systems, 2023-2033 (US$ Mn, AGR (%), CAGR (%))
Table 61 Asia-Pacific AI Applications in Nuclear Reactors Market by Optimization, 2023-2033 (US$ Mn, AGR (%), CAGR (%))
Table 62 Asia-Pacific AI Applications in Nuclear Reactors Market by Technology, 2023-2033 (US$ Mn, AGR (%), CAGR (%))
Table 63 China AI Applications in Nuclear Reactors Market by Value, 2023-2033 (US$ Mn, AGR (%), CAGR (%))
Table 64 India AI Applications in Nuclear Reactors Market by Value, 2023-2033 (US$ Mn, AGR (%), CAGR (%))
Table 65 Japan AI Applications in Nuclear Reactors Market by Value, 2023-2033 (US$ Mn, AGR (%), CAGR (%))
Table 66 South Korea AI Applications in Nuclear Reactors Market by Value, 2023-2033 (US$ Mn, AGR (%), CAGR (%))
Table 67 Pakistan AI Applications in Nuclear Reactors Market by Value, 2023-2033 (US$ Mn, AGR (%), CAGR (%))
Table 68 Rest of Asia-Pacific AI Applications in Nuclear Reactors Market by Value, 2023-2033 (US$ Mn, AGR (%), CAGR (%))
Table 69 Middle East & Africa AI Applications in Nuclear Reactors Market by Value, 2023-2033 (US$ Mn, AGR (%), CAGR (%))
Table 70 Middle East & Africa AI Applications in Nuclear Reactors Market by Country, 2023-2033 (US$ Mn, AGR (%), CAGR (%))
Table 71 Middle East & Africa AI Applications in Nuclear Reactors Market by Design, 2023-2033 (US$ Mn, AGR (%), CAGR (%))
Table 72 Middle East & Africa AI Applications in Nuclear Reactors Market by Systems, 2023-2033 (US$ Mn, AGR (%), CAGR (%))
Table 73 Middle East & Africa AI Applications in Nuclear Reactors Market by Optimization, 2023-2033 (US$ Mn, AGR (%), CAGR (%))
Table 74 Middle East & Africa AI Applications in Nuclear Reactors Market by Technology, 2023-2033 (US$ Mn, AGR (%), CAGR (%))
Table 75 GCC AI Applications in Nuclear Reactors Market by Value, 2023-2033 (US$ Mn, AGR (%), CAGR (%))
Table 76 South Africa AI Applications in Nuclear Reactors Market by Value, 2023-2033 (US$ Mn, AGR (%), CAGR (%))
Table 77 Rest of Middle East & Africa AI Applications in Nuclear Reactors Market by Value, 2023-2033 (US$ Mn, AGR (%), CAGR (%))
Table 78 Latin America AI Applications in Nuclear Reactors Market by Value, 2023-2033 (US$ Mn, AGR (%), CAGR (%))
Table 79 Latin America AI Applications in Nuclear Reactors Market by Country, 2023-2033 (US$ Mn, AGR (%), CAGR (%))
Table 80 Latin America AI Applications in Nuclear Reactors Market by Design, 2023-2033 (US$ Mn, AGR (%), CAGR (%))
Table 81 Latin America AI Applications in Nuclear Reactors Market by Systems, 2023-2033 (US$ Mn, AGR (%), CAGR (%))
Table 82 Latin America AI Applications in Nuclear Reactors Market by Optimization, 2023-2033 (US$ Mn, AGR (%), CAGR (%))
Table 83 Latin America AI Applications in Nuclear Reactors Market by Technology, 2023-2033 (US$ Mn, AGR (%), CAGR (%))
Table 84 Brazil AI Applications in Nuclear Reactors Market by Value, 2023-2033 (US$ Mn, AGR (%), CAGR (%))
Table 85 Argentina AI Applications in Nuclear Reactors Market by Value, 2023-2033 (US$ Mn, AGR (%), CAGR (%))
Table 86 Rest of Latin America AI Applications in Nuclear Reactors Market by Value, 2023-2033 (US$ Mn, AGR (%), CAGR (%))
Table 87 Strategic Outlook Mapping
Table 88 General Electric Company Key Details, (CEO, HQ, Revenue, Founded, No. of Employees, Company Type, Website, Business Segment)
Table 89 General Electric Company: Product Benchmarking
Table 90 General Electric Company: Strategic Outlook
Table 91 Toshiba Corporation Key Details, (CEO, HQ, Revenue, Founded, No. of Employees, Company Type, Website, Business Segment)
Table 92 Toshiba Corporation: Product Benchmarking
Table 93 Toshiba Corporation: Strategic Outlook
Table 94 Mitsubishi Heavy Industries, Ltd Key Details, (CEO, HQ, Revenue, Founded, No. of Employees, Company Type, Website, Business Segment)
Table 95 Mitsubishi Heavy Industries, Ltd: Product Benchmarking
Table 96 Mitsubishi Heavy Industries, Ltd: Strategic Outlook
Table 97 Siemens Energy AG Key Details, (CEO, HQ, Revenue, Founded, No. of Employees, Company Type, Website, Business Segment)
Table 98 Siemens Energy AG: Product Benchmarking
Table 99 Siemens Energy AG: Strategic Outlook
Table 100 Rolls-Royce Limited: Key Details, (CEO, HQ, Revenue, Founded, No. of Employees, Company Type, Website, Business Segment)
Table 101 Rolls-Royce Limited: Product Benchmarking
Table 102 Rolls-Royce Limited: Strategic Outlook
Table 103 ABB Ltd Key Details, (CEO, HQ, Revenue, Founded, No. of Employees, Company Type, Website, Business Segment)
Table 104 ABB Ltd: Product Benchmarking
Table 105 ABB Ltd: Strategic Outlook
Table 106 Honeywell International Inc Key Details, (CEO, HQ, Revenue, Founded, No. of Employees, Company Type, Website, Business Segment)
Table 107 Honeywell International Inc: Product Benchmarking
Table 108 Honeywell International Inc: Strategic Outlook
Table 109 GE Hitachi Nuclear Energy: Key Details, (CEO, HQ, Revenue, Founded, No. of Employees, Company Type, Website, Business Segment)
Table 110 GE Hitachi Nuclear Energy: Product Benchmarking
Table 111 GE Hitachi Nuclear Energy: Strategic Outlook
Table 112 Framatome: Key Details, (CEO, HQ, Revenue, Founded, No. of Employees, Company Type, Website, Business Segment)
Table 113 Framatome: Product Benchmarking
Table 114 Framatome: Strategic Outlook
Table 115 TerraPower: .Key Details, (CEO, HQ, Revenue, Founded, No. of Employees, Company Type, Website, Business Segment)
Table 116 TerraPower: Product Benchmarking
Table 117 TerraPower: Strategic Outlook
Table 118 Terrestrial Energy: Key Details, (CEO, HQ, Revenue, Founded, No. of Employees, Company Type, Website, Business Segment)
Table 119 Terrestrial Energy: Product Benchmarking
Table 120 Terrestrial Energy: Strategic Outlook
Table 121 Kinectrics: Key Details, (CEO, HQ, Revenue, Founded, No. of Employees, Company Type, Website, Business Segment)
Table 122 Kinectrics: Product Benchmarking
Table 123 Kinectrics: Strategic Outlook
Table 124 BWX Technologies, Inc.: Key Details, (CEO, HQ, Revenue, Founded, No. of Employees, Company Type, Website, Business Segment)
Table 125 BWX Technologies, Inc.: Product Benchmarking
Table 126 BWX Technologies, Inc.: Strategic Outlook
Table 127 SNC-Lavalin Group Inc.: Key Details, (CEO, HQ, Revenue, Founded, No. of Employees, Company Type, Website, Business Segment)
Table 128 SNC-Lavalin Group Inc.: Product Benchmarking
Table 129 SNC-Lavalin Group Inc.: Strategic Outlook
Table 130 NuScale Power Corporation Key Details, (CEO, HQ, Revenue, Founded, No. of Employees, Company Type, Website, Business Segment)
Table 131 NuScale Power Corporation: Product Benchmarking
Table 132 NuScale Power Corporation: Strategic Outlook
List of Figures
Figure 1 AI Application in Nuclear Reactors Market Segmentation
Figure 2 AI Application in Nuclear Reactors Market by Design: Market Attractiveness Index
Figure 3 AI Application in Nuclear Reactors Market by System: Market Attractiveness Index
Figure 4 AI Application in Nuclear Reactors Market by Optimization: Market Attractiveness Index
Figure 5 AI Application in Nuclear Reactors Market by Technology: Market Attractiveness Index
Figure 6 AI Application in Nuclear Reactors Market Attractiveness Index by Region
Figure 7 AI Application in Nuclear Reactors Market: Market Dynamics
Figure 8 Global Changes in Electricity Demand, 2017-2022
Figure 9 Overnight Capital Cost Comparison,2020
Figure 10 AI Application in Nuclear Reactors Market: Porter’s Five Forces Analysis
Figure 11 Global AI Applications in Nuclear Reactors Market Forecast by COVID 2023-2033 (%)
Figure 12 Global AI Applications in Nuclear Reactors Market Forecast, 2023-2033 (US$ Mn, AGR (%)) (V-Shaped Recovery Scenario)
Figure 13 Global AI Applications in Nuclear Reactors Market by Region, 2023-2033 (US$ Mn, AGR (%)) (V-Shaped Recovery Scenario)
Figure 14 Global AI Applications in Nuclear Reactors Market Forecast, 2023-2033 (US$ Mn, AGR (%)) (U-Shaped Recovery Scenario)
Figure 15 Global AI Applications in Nuclear Reactors Market by Region, 2023-2033 (US$ Mn, AGR (%)) (U-Shaped Recovery Scenario)
Figure 16 Global AI Applications in Nuclear Reactors Market Forecast, 2023-2033 (US$ Mn, AGR (%)) (W-Shaped Recovery Scenario)
Figure 17 Global AI Applications in Nuclear Reactors Market by Region, 2023-2033 (US$ Mn, AGR (%)) (W-Shaped Recovery Scenario)
Figure 18 Global AI Applications in Nuclear Reactors Market Forecast, 2023-2033 (US$ Mn, AGR (%)) (L-Shaped Recovery Scenario)
Figure 19 Global AI Applications in Nuclear Reactors Market by Region, 2023-2033 (US$ Mn, AGR (%)) (L-Shaped Recovery Scenario)
Figure 20 AI Application in Nuclear Reactors Market: PEST Analysis
Figure 21 AI Application in Nuclear Reactors Market by Design: Market Attractiveness Index
Figure 22 Global AI Applications in Nuclear Reactors Market by Design, 2023-2033 (US$ Mn, AGR (%))
Figure 23 AI Application in Nuclear Reactors Market Share Forecast by Design, 2023, 2028, 2033 (%)
Figure 24 Nuclear Reactor Core Design Market by Region, 2023-2033 (US$ Mn, AGR (%))
Figure 25 Nuclear Reactor Core Design Market Share Forecast by Region, 2023 & 2033 (%)
Figure 26 Thermal-hydraulic Simulation Analysis Market by Region, 2023-2033 (US$ Mn, AGR (%))
Figure 27 Thermal-hydraulic Simulation Analysis Market Share Forecast by Region, 2023 & 2033 (%)
Figure 28 Radiation Shielding Design Market by Region, 2023-2033 (US$ Mn, AGR (%))
Figure 29 Radiation Shielding Design Market Share Forecast by Region, 2023 & 2033 (%)
Figure 30 AI Application in Nuclear Reactors Market by Systems: Market Attractiveness Index
Figure 31 Global AI Applications in Nuclear Reactors Market by Systems, 2023-2033 (US$ Mn, AGR (%))
Figure 32 AI Application in Nuclear Reactors Market Share Forecast by Systems, 2023, 2028, 2033 (%)
Figure 33 Anomaly Detection Systems Market by Region, 2023-2033 (US$ Mn, AGR (%))
Figure 34 Anomaly Detection Systems Market Share Forecast by Region, 2023 & 2033 (%)
Figure 35 Predictive Maintenance Solutions Market by Region, 2023-2033 (US$ Mn, AGR (%))
Figure 36 Predictive Maintenance Solutions Market Share Forecast by Region, 2023 & 2033 (%)
Figure 37 Real-time Monitoring and Alert Systems Market by Region, 2023-2033 (US$ Mn, AGR (%))
Figure 38 Real-time Monitoring and Alert Systems Market Share Forecast by Region, 2023 & 2033 (%)
Figure 39 Mitigation Strategies and Measures Market by Region, 2023-2033 (US$ Mn, AGR (%))
Figure 40 Mitigation Strategies and Measures Market Share Forecast by Region, 2023 & 2033 (%)
Figure 41 AI Application in Nuclear Reactors Market by Optimization: Market Attractiveness Index
Figure 42 Global AI Applications in Nuclear Reactors Market by Optimization, 2023-2033 (US$ Mn, AGR (%))
Figure 43 AI Application in Nuclear Reactors Market Share Forecast by Optimization, 2023, 2028, 2033 (%)
Figure 44 Fuel Consumption Optimization Market by Region, 2023-2033 (US$ Mn, AGR (%))
Figure 45 Fuel Consumption Optimization Market Share Forecast by Region, 2023 & 2033 (%)
Figure 46 Reactor Operations Optimization Market by Region, 2023-2033 (US$ Mn, AGR (%))
Figure 47 Reactor Operations Optimization Market Share Forecast by Region, 2023 & 2033 (%)
Figure 48 Enhanced Energy Output and Efficiency Market by Region, 2023-2033 (US$ Mn, AGR (%))
Figure 49 Enhanced Energy Output and Efficiency Market Share Forecast by Region, 2023 & 2033 (%)
Figure 50 Decommissioning Processes Optimization Market by Region, 2023-2033 (US$ Mn, AGR (%))
Figure 51 Decommissioning Processes Optimization Market Share Forecast by Region, 2023 & 2033 (%)
Figure 52 Other Optimization Market by Region, 2023-2033 (US$ Mn, AGR (%))
Figure 53 Other Process Optimization Market Share Forecast by Region, 2023 & 2033 (%)
Figure 54 AI Application in Nuclear Reactors Market by Technology: Market Attractiveness Index
Figure 55 Global AI Applications in Nuclear Reactors Market by Technology, 2023-2033 (US$ Mn, AGR (%))
Figure 56 AI Application in Nuclear Reactors Market Share Forecast by Technology, 2023, 2028, 2033 (%)
Figure 57 Deep Learning (DL) Market by Region, 2023-2033 (US$ Mn, AGR (%))
Figure 58 Deep Learning (DL) Market Share Forecast by Region, 2023 & 2033 (%)
Figure 59 Machine Learning (ML) Market by Region, 2023-2033 (US$ Mn, AGR (%))
Figure 60 Machine Learning (ML) Market Share Forecast by Region, 2023 & 2033 (%)
Figure 61 Natural Language Processing (NLP) Market by Region, 2023-2033 (US$ Mn, AGR (%))
Figure 62 Natural Language Processing (NLP) Market Share Forecast by Region, 2023 & 2033 (%)
Figure 63 Reinforcement Learning (RL) Market by Region, 2023-2033 (US$ Mn, AGR (%))
Figure 64 Reinforcement Learning (RL) Market Share Forecast by Region, 2023 & 2033 (%)
Figure 65 Robotics and Automation Market by Region, 2023-2033 (US$ Mn, AGR (%))
Figure 66 Robotics and Automation Market Share Forecast by Region, 2023 & 2033 (%)
Figure 67 Other Technology Market by Region, 2023-2033 (US$ Mn, AGR (%))
Figure 68 Other Type Market Share Forecast by Region, 2023 & 2033 (%)
Figure 69 AI Application in Nuclear Reactors Market Forecast by Region 2023 and 2033 (Revenue, CAGR%)
Figure 70 AI Application in Nuclear Reactors Market Share Forecast by Region 2023, 2028, 2033 (%)
Figure 71 AI Application in Nuclear Reactors Market by Region, 2023-2033 (US$Million, AGR %)
Figure 72 North America AI Application in Nuclear Reactors Market Attractiveness Index
Figure 73 North America AI Application in Nuclear Reactors Market by Region, 2023, 2028 & 2033 (US$ Million)
Figure 74 North America AI Applications in Nuclear Reactors Market by Value, 2023-2033 (US$ Mn, AGR (%))
Figure 75 North America AI Applications in Nuclear Reactors Market by Country, 2023-2033 (US$ Mn, AGR (%))
Figure 76 North America AI Application in Nuclear Reactors Market Share Forecast by Country, 2023 & 2033 (%)
Figure 77 North America AI Applications in Nuclear Reactors Market by Design, 2023-2033 (US$ Mn, AGR (%))
Figure 78 North America AI Application in Nuclear Reactors Market Share Forecast Design 2023 & 2033 (%)
Figure 79 North America AI Applications in Nuclear Reactors Market by Systems, 2023-2033 (US$ Mn, AGR (%))
Figure 80 North America AI Application in Nuclear Reactors Market Share Forecast by Systems, 2023 & 2033 (%)
Figure 81 North America AI Applications in Nuclear Reactors Market by Optimization, 2023-2033 (US$ Mn, AGR (%))
Figure 82 North America AI Application in Nuclear Reactors Market Share Forecast by Optimization, 2023 & 2033 (%)
Figure 83 North America AI Applications in Nuclear Reactors Market by Technology, 2023-2033 (US$ Mn, AGR (%))
Figure 84 North America AI Application in Nuclear Reactors Market Share Forecast by Technology, 2023 & 2033 (%)
Figure 85 US AI Applications in Nuclear Reactors Market by Value, 2023-2033 (US$ Mn, AGR (%))
Figure 86 Canada AI Applications in Nuclear Reactors Market by Value, 2023-2033 (US$ Mn, AGR (%))
Figure 87 Europe AI Application in Nuclear Reactors Market Attractiveness Index
Figure 88 Europe AI Application in Nuclear Reactors Market by Region, 2023, 2028 & 2033 (US$Million)
Figure 89 Europe AI Applications in Nuclear Reactors Market by Value, 2023-2033 (US$ Mn, AGR (%))
Figure 90 Europe AI Applications in Nuclear Reactors Market by Country, 2023-2033 (US$ Mn, AGR (%))
Figure 91 Europe AI Application in Nuclear Reactors Market Share Forecast by Country, 2023 & 2033 (%)
Figure 92 Europe AI Applications in Nuclear Reactors Market by Design, 2023-2033 (US$ Mn, AGR (%))
Figure 93 Europe AI Application in Nuclear Reactors Market Share Forecast Design, 2023 & 2033 (%)
Figure 94 Europe AI Applications in Nuclear Reactors Market by Systems, 2023-2033 (US$ Mn, AGR (%))
Figure 95 Europe AI Application in Nuclear Reactors Market Share Forecast by Systems, 2023 & 2033 (%)
Figure 96 Europe AI Applications in Nuclear Reactors Market by Optimization, 2023-2033 (US$ Mn, AGR (%))
Figure 97 Europe AI Application in Nuclear Reactors Market Share Forecast by Optimization, 2023 & 2033 (%)
Figure 98 Europe AI Applications in Nuclear Reactors Market by Technology, 2023-2033 (US$ Mn, AGR (%))
Figure 99 Europe AI Application in Nuclear Reactors Market Share Forecast by Technology, 2023 & 2033 (%)
Figure 100 UK AI Applications in Nuclear Reactors Market by Value, 2023-2033 (US$ Mn, AGR (%))
Figure 101 France AI Applications in Nuclear Reactors Market by Value, 2023-2033 (US$ Mn, AGR (%))
Figure 102 Ukraine AI Applications in Nuclear Reactors Market by Value, 2023-2033 (US$ Mn, AGR (%))
Figure 103 Russia AI Applications in Nuclear Reactors Market by Value, 2023-2033 (US$ Mn, AGR (%))
Figure 104 Spain AI Applications in Nuclear Reactors Market by Value, 2023-2033 (US$ Mn, AGR (%))
Figure 105 Rest of Europe AI Applications in Nuclear Reactors Market by Value, 2023-2033 (US$ Mn, AGR (%))
Figure 106 Asia-Pacific AI Application in Nuclear Reactors Market Attractiveness Index
Figure 107 Asia-Pacific AI Application in Nuclear Reactors Market by Region, 2023, 2028 & 2033 (US$ Million)
Figure 108 Asia-Pacific AI Applications in Nuclear Reactors Market by Value, 2023-2033 (US$ Mn, AGR (%))
Figure 109 Asia-Pacific AI Applications in Nuclear Reactors Market by Country, 2023-2033 (US$ Mn, AGR (%))
Figure 110 Asia-Pacific AI Application in Nuclear Reactors Market Share Forecast by Country, 2023 & 2033 (%)
Figure 111 Asia-Pacific AI Applications in Nuclear Reactors Market by Design, 2023-2033 (US$ Mn, AGR (%))
Figure 112 Asia-Pacific AI Application in Nuclear Reactors Market Share Forecast Design, 2023 & 2033 (%)
Figure 113 Asia-Pacific AI Applications in Nuclear Reactors Market by Systems, 2023-2033 (US$ Mn, AGR (%))
Figure 114 Asia-Pacific AI Application in Nuclear Reactors Market Share Forecast by Systems, 2023 & 2033 (%)
Figure 115 Asia-Pacific AI Applications in Nuclear Reactors Market by Optimization, 2023-2033 (US$ Mn, AGR (%))
Figure 116 Asia-Pacific AI Application in Nuclear Reactors Market Share Forecast by Optimization, 2023 & 2033 (%)
Figure 117 Asia-Pacific AI Applications in Nuclear Reactors Market by Technology, 2023-2033 (US$ Mn, AGR (%))
Figure 118 Asia-Pacific AI Application in Nuclear Reactors Market Share Forecast by Technology, 2023 & 2033 (%)
Figure 119 China AI Applications in Nuclear Reactors Market by Value, 2023-2033 (US$ Mn, AGR (%))
Figure 120 India AI Applications in Nuclear Reactors Market by Value, 2023-2033 (US$ Mn, AGR (%))
Figure 121 Japan AI Applications in Nuclear Reactors Market by Value, 2023-2033 (US$ Mn, AGR (%))
Figure 122 South Korea AI Applications in Nuclear Reactors Market by Value, 2023-2033 (US$ Mn, AGR (%))
Figure 123 Pakistan AI Applications in Nuclear Reactors Market by Value, 2023-2033 (US$ Mn, AGR (%))
Figure 124 Rest of Asia-Pacific AI Applications in Nuclear Reactors Market by Value, 2023-2033 (US$ Mn, AGR (%))
Figure 125 Middle East and Africa AI Application in Nuclear Reactors Market Attractiveness Index
Figure 126 Middle East and Africa AI Application in Nuclear Reactors Market by Region, 2023, 2028 & 2033 (US$ Million)
Figure 127 Middle East & Africa AI Applications in Nuclear Reactors Market by Value, 2023-2033 (US$ Mn, AGR (%))
Figure 128 Middle East & Africa AI Applications in Nuclear Reactors Market by Country, 2023-2033 (US$ Mn, AGR (%))
Figure 129 Middle East and Africa AI Application in Nuclear Reactors Market Share Forecast by Country, 2023 & 2033 (%)
Figure 130 Middle East & Africa AI Applications in Nuclear Reactors Market by Design, 2023-2033 (US$ Mn, AGR (%))
Figure 131 Middle East and Africa AI Application in Nuclear Reactors Market Share Forecast by Design 2023 & 2033 (%)
Figure 132 Middle East & Africa AI Applications in Nuclear Reactors Market by Systems, 2023-2033 (US$ Mn, AGR (%))
Figure 133 Middle East and Africa AI Application in Nuclear Reactors Market Share Forecast by Systems, 2023 & 2033 (%)
Figure 134 Middle East & Africa AI Applications in Nuclear Reactors Market by Optimization, 2023-2033 (US$ Mn, AGR (%))
Figure 135 Middle East and Africa AI Application in Nuclear Reactors Market Share Forecast by Optimization, 2023 & 2033 (%)
Figure 136 Middle East & Africa AI Applications in Nuclear Reactors Market by Optimization, 2023-2033 (US$ Mn, AGR (%))
Figure 137 Middle East and Africa AI Application in Nuclear Reactors Market Share Forecast by Technology, 2023 & 2033 (%)
Figure 138 GCC AI Applications in Nuclear Reactors Market by Value, 2023-2033 (US$ Mn, AGR (%))
Figure 139 South Africa AI Applications in Nuclear Reactors Market by Value, 2023-2033 (US$ Mn, AGR (%))
Figure 140 Rest of Middle East & Africa AI Applications in Nuclear Reactors Market by Value, 2023-2033 (US$ Mn, AGR (%))
Figure 141 Latin America AI Application in Nuclear Reactors Market Attractiveness Index
Figure 142 Latin America AI Application in Nuclear Reactors Market by Region, 2023, 2028 & 2033 (US$ Million)
Figure 143 Latin America AI Applications in Nuclear Reactors Market by Value, 2023-2033 (US$ Mn, AGR (%))
Figure 144 Latin America AI Applications in Nuclear Reactors Market by Country, 2023-2033 (US$ Mn, AGR (%))
Figure 145 Latin America AI Application in Nuclear Reactors Market Share Forecast by Country, 2023 & 2033 (%)
Figure 146 Latin America AI Applications in Nuclear Reactors Market by Design, 2023-2033 (US$ Mn, AGR (%))
Figure 147 Latin America AI Application in Nuclear Reactors Market Share Forecast Design, 2023 & 2033 (%)
Figure 148 Latin America AI Applications in Nuclear Reactors Market by Systems, 2023-2033 (US$ Mn, AGR (%))
Figure 149 Latin America AI Application in Nuclear Reactors Market Share Forecast by Systems, 2023 & 2033 (%)
Figure 150 Latin America AI Applications in Nuclear Reactors Market by Optimization, 2023-2033 (US$ Mn, AGR (%))
Figure 151 Latin America AI Application in Nuclear Reactors Market Share Forecast by Optimization, 2023 & 2033 (%)
Figure 152 Latin America AI Applications in Nuclear Reactors Market by Technology, 2023-2033 (US$ Mn, AGR (%))
Figure 153 Latin America AI Application in Nuclear Reactors Market Share Forecast by Technology, 2023 & 2033 (%)
Figure 154 Brazil AI Applications in Nuclear Reactors Market by Value, 2023-2033 (US$ Mn, AGR (%))
Figure 155 Argentina AI Applications in Nuclear Reactors Market by Value, 2023-2033 (US$ Mn, AGR (%))
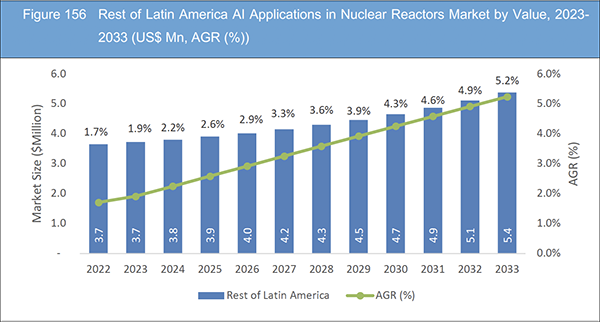
Figure 156 Rest of Latin America AI Applications in Nuclear Reactors Market by Value, 2023-2033 (US$ Mn, AGR (%))
Figure 157 AI Application in Nuclear Reactors Market: Company Share, 2022
Figure 158 General Electric Company: Net Revenue, 2018-2022 (US$ Million, AGR%)
Figure 159 General Electric Company: R&D, 2018-2022 (US$ Million, AGR%)
Figure 160 General Electric Company: Regional Revenue Share, 2022 (%)
Figure 161 General Electric Company: Business Segment Revenue Share, 2022 (%)
Figure 162 Toshiba Corporation: Net Revenue, 2018-2022 (US$ Million, AGR%)
Figure 163 Toshiba Corporation: R&D, 2018-2022 (US$ Million, AGR%)
Figure 164 Toshiba Corporation: Regional Revenue Share, 2022 (%)
Figure 165 Toshiba Corporation: Business Segment Revenue Share, 2022 (%)
Figure 166 Mitsubishi Heavy Industries, Ltd: Net Revenue, 2018-2022 (US$ Million, AGR%)
Figure 167 Mitsubishi Heavy Industries, Ltd: R&D, 2018-2022 (US$ Million, AGR%)
Figure 168 Mitsubishi Heavy Industries, Ltd: Regional Revenue Share, 2022 (%)
Figure 169 Mitsubishi Heavy Industries, Ltd: Business Segment Revenue Share, 2022 (%)
Figure 170 Siemens Energy AG: Net Revenue, 2018-2022 (US$ Million, AGR%)
Figure 171 Siemens Energy AG: R&D, 2018-2022 (US$ Million, AGR%)
Figure 172 Siemens Energy AG: Regional Revenue Share, 2022 (%)
Figure 173 Siemens Energy AG: Business Segment Revenue Share, 2022 (%)
Figure 174 Rolls-Royce Limited: Net Revenue, 2018-2022 (US$ Million, AGR%)
Figure 175 Rolls-Royce Limited: R&D, 2018-2022 (US$ Million, AGR%)
Figure 176 Rolls-Royce Limited: Regional Revenue Share, 2022 (%)
Figure 177 Rolls-Royce Limited: Business Segment Revenue Share, 2022 (%)
Figure 178 ABB Ltd: Net Revenue, 2018-2022 (US$ Million, AGR%)
Figure 179 ABB Ltd: R&D, 2018-2022 (US$ Million, AGR%)
Figure 180 ABB Ltd: Business Segment Revenue Share, 2022 (%)
Figure 181 Honeywell International Inc: Net Revenue, 2018-2022 (US$ Million, AGR%)
Figure 182 Honeywell International Inc: R&D, 2018-2022 (US$ Million, AGR%)
Figure 183 Honeywell International Inc: Regional Revenue Share, 2022 (%)
Figure 184 Honeywell International Inc: Business Segment Revenue Share, 2022 (%)
Figure 185 BWX Technologies, Inc.: Net Revenue, 2018-2022 (US$ Million, AGR%)
Figure 186 BWX Technologies, Inc.: R&D, 2018-2022 (US$ Million, AGR%)
Figure 187 SNC-Lavalin Group Inc.: Net Revenue, 2018-2022 (US$ Million, AGR%)
Figure 188 SNC-Lavalin Group Inc.: Business Segment Revenue Share, 2022 (%)
List of Companies Profiled in the report
ABB Ltd
BWX Technologies, Inc.
Framatome
GE Hitachi Nuclear Energy
General Electric Company
Honeywell International Inc.
Kinectrics
Mitsubishi Heavy Industries Ltd
NuScale Power Corporation
Rolls-Royce Limited
Siemens Energy AG
SNC-Lavalin Group Inc.
TerraPower
Terrestrial Energy
Toshiba Corporation
List of Other Companies Mentioned in the report
ANL
Argonne
Astrobotic Technology
China Huaneng
DeepMind
DOE
Dow
Electricite de France SA (EDF)
Emmanuel Macron
EPFL
Eskom
Framatome
Iberdrola
INLEX (International Nuclear Liability Expert Group)
Kansai Electric Power Company
Kinectrics
Westinghouse Electric Canada Inc
X-energy
List of Associations Mentioned in the Report
Argonne National Laboratory
Atomic Energy
Cernavoda Nuclear Power
China National Nuclear Corp. (CNNC)
Columbia University's Center
International Atomic Energy Agency
Koeberg nuclear plant
Korea Hydro Nuclear Power (KHNP)
Minister of Innovation, Science and Industry
New Energy Technology
Nuclear Regulation Authority Japan
Oak Ridge National Laboratory
Pakistan Atomic Energy Commission.
Small Modular Reactors (SMRs)
The Department of Defense
The Honourable François-Philippe Champagne
The International Atomic Energy Agency (IAEA)
The National Aeronautics and Space Administration (NASA)
The Nuclear Energy Leadership Act (NELA)
The Nuclear Energy Renewal Act (NERA)
The Times of India
The United Arab Emirates (UAE)
The United Nations Security Council
The 'United Parliamentary Front for Nuclear Technology and Activities
The World Nuclear Association
Tsinghua University's Institute of Nuclear and New Energy Technology
World Nuclear Association