The Small Modular Reactor Market Report 2023-2033: This report will prove invaluable to leading firms striving for new revenue pockets if they wish to better understand the industry and its underlying dynamics. It will be useful for companies that would like to expand into different industries or to expand their existing operations in a new region.
Growing Demand for Carbon-Free Energy
The increasing global concern about climate change and the need to reduce greenhouse gas emissions have spurred the demand for clean and sustainable energy sources. Small Modular Reactors (SMRs) offer a promising solution as they produce electricity with virtually zero carbon emissions. As countries commit to ambitious climate targets, the role of nuclear energy, including SMRs, becomes more critical in decarbonizing the power sector. The growing demand for carbon-free energy has positioned SMRs as a viable option to meet electricity needs while mitigating the environmental impact.
Flexibility and Grid Resilience
One of the key advantages of SMRs is their flexibility in power generation and grid integration. Traditional large-scale nuclear power plants have limited flexibility in adjusting their output based on fluctuating energy demands. SMRs, on the other hand, can ramp their power output up or down more rapidly, allowing them to adapt to changing grid requirements. This flexibility makes SMRs suitable for complementing intermittent renewable energy sources like solar and wind, providing grid stability and resilience, especially during peak demand periods.
What Questions Should You Ask before Buying a Market Research Report?
• How is the small modular reactor market evolving?
• What is driving and restraining the small modular reactor market?
• How will each small modular reactor submarket segment grow over the forecast period and how much revenue will these submarkets account for in 2033?
• How will the market shares for each small modular reactor submarket develop from 2023 to 2033?
• What will be the main driver for the overall market from 2023 to 2033?
• Will leading small modular reactor markets broadly follow the macroeconomic dynamics, or will individual national markets outperform others?
• How will the market shares of the national markets change by 2033 and which geographical region will lead the market in 2033?
• Who are the leading players and what are their prospects over the forecast period?
• What are the small modular reactor projects for these leading companies?
• How will the industry evolve during the period between 2023 and 2033? What are the implications of small modular reactor projects taking place now and over the next 10 years?
• Is there a greater need for product commercialisation to further scale the small modular reactor market?
• Where is the small modular reactor market heading and how can you ensure you are at the forefront of the market?
• What are the best investment options for new product and service lines?
• What are the key prospects for moving companies into a new growth path and C-suite?
You need to discover how this will impact the small modular reactor market today, and over the next 10 years:
• Our 386-page report provides 127 tables and 170 charts/graphs exclusively to you.
• The report highlights key lucrative areas in the industry so you can target them – NOW.
• It contains in-depth analysis of global, regional and national sales and growth.
• It highlights for you the key successful trends, changes and revenue projections made by your competitors.
This report tells you TODAY how the small modular reactor market will develop in the next 10 years, and in line with the variations in COVID-19 economic recession and bounce. This market is more critical now than at any point over the last 10 years.
Forecasts to 2033 and other analyses reveal commercial prospects
• In addition to revenue forecasting to 2033, our new study provides you with recent results, growth rates, and market shares.
• You will find original analyses, with business outlooks and developments.
• Discover qualitative analyses (including market dynamics, drivers, opportunities, restraints and challenges), cost structure, impact of rising small modular reactor prices and recent developments.
This report includes data analysis and invaluable insight into how COVID-19 will affect the industry and your company. Four COVID-19 recovery patterns and their impact, namely, “V”, “L”, “W” and “U” are discussed in this report.
Segments Covered in the Report
Market Segment by Deployment
• Land-based Plant
• Marine-based Plant
Market Segment by Design
• Integral Reactor Design
• Twin Reactor Design
• Other Reactor Design
Market Segment by Coolant Type
• Molten Salt Reactors (MSR)
• Gas-Cooled Reactors (GCR)
• Liquid Metal Reactors (LMR)
• Other Coolant Type
Market Segment by Type
• Pressurized Water Reactor (PWR)
• Pressurized Heavy Water Reactor (PHWR)
• High-Temperature Reactor (HTR)
• Fast Neutron Reactor (FNR)
• Other Type
Market Segment by Application
• Power Generation
• Desalination
• Process Heat Supply
• Industrial Applications
• District Heating
• Other Applications

In addition to the revenue predictions for the overall world market and segments, you will also find revenue forecasts for four regional and 20 leading national markets:
North America
• U.S.
• Canada
Europe
• Russia
• UK
• France
• Luxembourg
• Sweden
• Rest of Europe
Asia Pacific
• China
• Japan
• India
• Indonesia
• South Korea
• Rest of Asia Pacific
Latin America
• Brazil
• Mexico
• Rest of Latin America
Middle East & Africa
• GCC
• South Africa
• Rest of Middle East & Africa
Need industry data? Please contact us today.
The report also includes profiles and for some of the leading companies in the Small Modular Reactor Market, 2023 to 2033, with a focus on this segment of these companies’ operations.
Leading companies profiled in the report
• ARC Clean Energy
• China National Nuclear Corporation (CNNC)
• Framatome
• GE Hitachi Nuclear Energy (GEH)
• General Atomics (GA)
• LeadCold Reactors
• Moltex Energy
• NuScale Power Corporation
• Rolls-Royce Limited
• SNC-Lavalin Group Inc.
• Terrestrial Energy Inc.
• Tokamak Energy Ltd
• Ultra-Safe Nuclear (USNC)
• Westinghouse Electric Company LLC
• X Energy, LLC
Overall world revenue for Small Modular Reactor Market, 2023 to 2033 in terms of value the market will surpass US$86.6 billion in 2023, our work calculates. We predict strong revenue growth through to 2033. Our work identifies which organizations hold the greatest potential. Discover their capabilities, progress, and commercial prospects, helping you stay ahead.
How will the Small Modular Reactor Market, 2023 to 2033 report help you?
In summary, our 380+ page report provides you with the following knowledge:
• Revenue forecasts to 2033 for Small Modular Reactor Market, 2023 to 2033 Market, with forecasts for design, type, coolant type, application, and deployment, each forecast at a global and regional level – discover the industry’s prospects, finding the most lucrative places for investments and revenues.
• Revenue forecasts to 2033 for four regional and 20 key national markets – See forecasts for the Small Modular Reactor Market, 2023 to 2033 market in North America, Europe, Asia-Pacific, Latin America and Middle East & Africa. Also forecasted is the market in the US, Canada, Brazil, Germany, France, UK, Sweden, Luxemburg, China, India, Japan, and Australia among other prominent economies.
• Prospects for established firms and those seeking to enter the market – including company profiles for 15 of the major companies involved in the Small Modular Reactor Market, 2023 to 2033.
Find quantitative and qualitative analyses with independent predictions. Receive information that only our report contains, staying informed with invaluable business intelligence.
Information found nowhere else
With our new report, you are less likely to fall behind in knowledge or miss out on opportunities. See how our work could benefit your research, analyses, and decisions. Visiongain’s study is for everybody needing commercial analyses for the Small Modular Reactor Market, 2023 to 2033, market-leading companies. You will find data, trends and predictions.
To access the data contained in this document please email contactus@visiongain.com
Buy our report today Small Modular Reactor Market Report 2023-2033: Forecasts by Deployment (Land-based Plant, Marine-based Plant), by Design (Integral Reactor Design, Twin Reactor Design, Other), by Coolant Type (Molten Salt Reactors (MSR), Gas-Cooled Reactors (GCR), Liquid Metal Reactors (LMR), Other), by Type (Pressurised Water Reactor (PWR), Pressurised Heavy Water Reactor (PHWR), High-Temperature Reactor (HTR), Fast Neutron Reactor (FNR), Other), by Application (Power Generation, Desalination, Process Heat Supply, Industrial Applications, District Heating, Other) AND Regional and Leading National Market Analysis PLUS Analysis of Leading Companies AND COVID-19 Impact and Recovery Pattern Analysis. Avoid missing out by staying informed – order our report now.
Visiongain is a trading partner with the US Federal Government
CCR Ref number: KD4R6
Do you have any custom requirements we can help you with? Any need for a specific country, geo region, market segment or specific company information? Contact us today, we can discuss your needs and see how we can help: contactus@visiongain.com
1 Report Overview
1.1 Objectives of the Study
1.2 Introduction to Small Modular Reactor Market
1.3 What This Report Delivers
1.4 Why You Should Read This Report
1.5 Key Questions Answered by This Analytical Report
1.6 Who Is This Report for?
1.7 Research Methodology
1.7.1 Market Definitions
1.7.2 Market Evaluation & Forecasting Methodology
1.7.3 Data Validation
1.7.3.1 Primary Research
1.7.3.2 Secondary Research
1.8 Frequently Asked Questions (FAQs)
1.9 Associated Visiongain Reports
1.10 About Visiongain
2 Executive Summary
3 Market Overview
3.1 Key Findings
3.2 Market Dynamics
3.2.1 Market Driving Factors
3.2.1.1 SMRs Offer a Decentralized and Distributed Power Generation Approach
3.2.1.2 SMRs Offer a Clean and Sustainable Option for Electricity Generation Without the Greenhouse Gas Emissions Associated with Fossil Fuels
3.2.1.3 SMRs Offer a Viable Solution for Nuclear Power Plant Replacement and Expansion Due to their Smaller Size
3.2.1.4 New Materials, Advanced Control Systems, and Passive Safety Mechanisms have Enhanced the Safety and Efficiency of SMRs
3.2.2 Market Restraining Factors
3.2.2.1 Prolonged Project Timelines and Increased Costs, Discouraging Potential Investors and Hindering the Widespread Adoption of SMRs
3.2.2.2 The Development of First-of-a-Kind SMRs May Still Face Cost Overruns Due to Research, Licensing, and Regulatory Compliance Challenges
3.2.2.3 Nuclear Energy, Including SMRs, Is Often Met with Public Apprehension and Concerns About Safety, Waste Disposal, and Potential Accidents
3.2.2.4 The Declining Costs of Renewable Technologies have Led to Increased Investments in Clean Energy Projects, Creating Competition for Market Share with SMRs
3.2.3 Market Opportunities
3.2.3.1 Developing Economies, Characterized by Rapid Urbanization and Industrialization, Present a Significant Market Opportunity for Small Modular Reactors (SMRs)
3.2.3.2 SMRs Can Serve as a Decentralized Power Generation Option, providing a Stable and Clean Energy Source to Support Local Communities, Industries, and Essential Services
3.2.3.3 By Integrating SMRs in to Existing Nuclear Sites, Developers Can Capitalize on Established Infrastructure, Reducing Capital Costs and Streamlining Regulatory Approval Processes
3.2.3.4 The Concept of Hybrid Energy Systems, Combining Multiple Energy Sources, Presents an Opportunity for SMRs to Play a Crucial Role in Enhancing Energy Security
3.3 COVID-19 Impact Analysis
3.3.1 V-Shaped Recovery Scenario
3.3.2 W-Shaped Recovery Scenario
3.3.3 U-Shaped Recovery Scenario
3.3.4 L-Shaped Recovery Scenario
3.4 Porter’s Five Forces Analysis
3.4.1 Threat of New Entrants
3.4.2 Bargaining Power of Buyers
3.4.3 Bargaining Power of Suppliers
3.4.4 Threat of Substitutes
3.4.5 Competitive Rivalry
3.5 PEST Analysis
3.5.1 Political Factors
3.5.2 Economic Factors
3.5.3 Social Factors
3.5.4 Technological Factors
4 Small Modular Reactor Market Analysis by Deployment
4.1 Key Findings
4.2 Deployment Segment: Market Attractiveness Index
4.3 Small Modular Reactor Market by Deployment
4.4 Land-Based Plant
4.4.1 Market by Region, 2023-2033 (US$ Bn)
4.4.2 Market Share by Region, 2023 & 2033 (%)
4.5 Marine-Based Plant
4.5.1 Market by Region, 2023-2033 (US$ Bn)
4.5.2 Market Share by Region, 2023 & 2033 (%)
5 Small Modular Reactor Market Analysis by Design
5.1 Key Findings
5.2 Design Segment: Market Attractiveness Index
5.3 Small Modular Reactor Market by Design
5.4 Integral Reactor Design
5.4.1 Market by Region, 2023-2033 (US$ Bn)
5.4.2 Market Share by Region, 2023 & 2033 (%)
5.5 Twin Reactor Design
5.5.1 Market by Region, 2023-2033 (US$ Bn)
5.5.2 Market Share by Region, 2023 & 2033 (%)
5.6 Other Reactor Design
5.6.1 Market by Region, 2023-2033 (US$ Bn)
5.6.2 Market Share by Region, 2023 & 2033 (%)
6 Small Modular Reactor Market Analysis by Coolant Type
6.1 Key Findings
6.2 Coolant Type Segment: Market Attractiveness Index
6.3 Small Modular Reactor Market by Coolant Type
6.4 Molten Salt Reactors (MSRs)
6.4.1 Market by Region, 2023-2033 (US$ Bn)
6.4.2 Market Share by Region, 2023 & 2033 (%)
6.5 Gas-Cooled Reactors (GCR)
6.5.1 Market by Region, 2023-2033 (US$ Bn)
6.5.2 Market Share by Region, 2023 & 2033 (%)
6.6 Liquid Metal Reactors (LMR)
6.6.1 Market by Region, 2023-2033 (US$ Bn)
6.6.2 Market Share by Region, 2023 & 2033 (%)
6.7 Other Coolant Type
6.7.1 Market by Region, 2023-2033 (US$ Bn)
6.7.2 Market Share by Region, 2023 & 2033 (%)
7 Small Modular Reactor Market Analysis by Type
7.1 Key Findings
7.2 Type Segment: Market Attractiveness Index
7.3 Small Modular Reactor Market by Type
7.4 Pressurized Water Reactor (PWR)
7.4.1 Market by Region, 2023-2033 (US$ Bn)
7.4.2 Market Share by Region, 2023 & 2033 (%)
7.5 Pressurized Heavy Water Reactor (PHWR)
7.5.1 Market by Region, 2023-2033 (US$ Bn)
7.5.2 Market Share by Region, 2023 & 2033 (%)
7.6 High-Temperature Reactor (HTR)
7.6.1 Market by Region, 2023-2033 (US$ Bn)
7.6.2 Market Share by Region, 2023 & 2033 (%)
7.7 Fast Neutron Reactor (FNR)
7.7.1 Market by Region, 2023-2033 (US$ Bn)
7.7.2 Market Share by Region, 2023 & 2033 (%)
7.8 Other Type
7.8.1 Market by Region, 2023-2033 (US$ Bn)
7.8.2 Market Share by Region, 2023 & 2033 (%)
8 Small Modular Reactor Market Analysis by Application
8.1 Key Findings
8.2 Application Segment: Market Attractiveness Index
8.3 Small Modular Reactor Market by Application
8.4 Power Generation
8.4.1 Market by Region, 2023-2033 (US$ Bn)
8.4.2 Market Share by Region, 2023 & 2033 (%)
8.5 Desalination
8.5.1 Market by Region, 2023-2033 (US$ Bn)
8.5.2 Market Share by Region, 2023 & 2033 (%)
8.6 Process Heat Supply
8.6.1 Market by Region, 2023-2033 (US$ Bn)
8.6.2 Market Share by Region, 2023 & 2033 (%)
8.7 Industrial Applications
8.7.1 Market by Region, 2023-2033 (US$ Bn)
8.7.2 Market Share by Region, 2023 & 2033 (%)
8.8 District Heating
8.8.1 Market by Region, 2023-2033 (US$ Bn)
8.8.2 Market Share by Region, 2023 & 2033 (%)
8.9 Other Applications
8.9.1 Market by Region, 2023-2033 (US$ Bn)
8.9.2 Market Share by Region, 2023 & 2033 (%)
9 Small Modular Reactor Market Analysis by Region
9.1 Key Findings
9.2 Regional Market Size Estimation and Forecast
10 North America Small Modular Reactor Market Analysis
10.1 Key Findings
10.2 North America Small Modular Reactor Market Attractiveness Index
10.3 North America Small Modular Reactor Market by Country, 2023, 2028 & 2033 (US$ Billion)
10.4 North America Small Modular Reactor Market by Value
10.5 North America Small Modular Reactor Market by Country
10.6 North America Small Modular Reactor Market by Deployment
10.7 North America Small Modular Reactor Market by Design
10.8 North America Small Modular Reactor Market by Coolant Type
10.9 North America Small Modular Reactor Market by Type
10.10 North America Small Modular Reactor Market by Application
10.11 U.S. Small Modular Reactor Market Analysis
10.12 Canada Small Modular Reactor Market Analysis
11 Europe Small Modular Reactor Market Analysis
11.1 Key Findings
11.2 Europe Small Modular Reactor Market Attractiveness Index
11.3 Europe Small Modular Reactor Market by Country, 2023, 2028 & 2033 (US$ Billion)
11.4 Europe Small Modular Reactor Market by Value
11.5 Europe Small Modular Reactor Market by Country
11.6 Europe Small Modular Reactor Market by Deployment
11.7 Europe Small Modular Reactor Market by Design
11.8 Europe Small Modular Reactor Market by Coolant Type
11.9 Europe Small Modular Reactor Market by Type
11.10 Europe Small Modular Reactor Market by Application
11.11 Russia Small Modular Reactor Market Analysis
11.12 UK Small Modular Reactor Market Analysis
11.13 France Small Modular Reactor Market Analysis
11.14 Luxembourg Small Modular Reactor Market Analysis
11.15 Sweden Small Modular Reactor Market Analysis
11.16 Rest of Europe Small Modular Reactor Market Analysis
12 Asia Pacific Small Modular Reactor Market Analysis
12.1 Key Findings
12.2 Asia Pacific Small Modular Reactor Market Attractiveness Index
12.3 Asia Pacific Small Modular Reactor Market by Country, 2023, 2028 & 2033 (US$ Billion)
12.4 Asia-Pacific Small Modular Reactor Market by Value
12.5 Asia-Pacific Small Modular Reactor Market by Country
12.6 Asia-Pacific Small Modular Reactor Market by Deployment
12.7 Asia-Pacific Small Modular Reactor Market by Design
12.8 Asia-Pacific Small Modular Reactor Market by Coolant Type
12.9 Asia-Pacific Small Modular Reactor Market by Type
12.10 Asia-Pacific Small Modular Reactor Market by Application
12.11 China Small Modular Reactor Market Analysis
12.12 Indonesia Small Modular Reactor Market Analysis
12.13 Japan Small Modular Reactor Market Analysis
12.14 South Korea Small Modular Reactor Market Analysis
12.15 India Small Modular Reactor Market Analysis
12.16 Rest of Asia Pacific Small Modular Reactor Market Analysis
13 Middle East & Africa Small Modular Reactor Market Analysis
13.1 Key Findings
13.2 Middle East & Africa Small Modular Reactor Market Attractiveness Index
13.3 Middle East & Africa Small Modular Reactor Market by Country, 2023, 2028 & 2033 (US$ Billion)
13.4 Middle East & Africa Small Modular Reactor Market by Value
13.5 Middle East & Africa Small Modular Reactor Market by Country
13.6 Middle East & Africa Small Modular Reactor Market by Deployment
13.7 Middle East & Africa Small Modular Reactor Market by Design
13.8 Middle East & Africa Small Modular Reactor Market by Coolant Type
13.9 Middle East & Africa Small Modular Reactor Market by Type
13.10 Middle East & Africa Small Modular Reactor Market by Application
13.11 GCC Small Modular Reactor Market Analysis
13.12 South Africa Small Modular Reactor Market Analysis
13.13 Rest of the Middle East & Africa Small Modular Reactor Market Analysis
14 Latin America Small Modular Reactor Market Analysis
14.1 Key Findings
14.2 Latin America Small Modular Reactor Market Attractiveness Index
14.3 Latin America Small Modular Reactor Market by Country, 2023, 2028 & 2033 (US$ Billion)
14.4 Latin America Small Modular Reactor Market by Value
14.5 Latin America Small Modular Reactor Market by Country
14.6 Latin America Small Modular Reactor Market by Deployment
14.7 Latin America Small Modular Reactor Market by Design
14.8 Latin America Small Modular Reactor Market by Coolant Type
14.9 Latin America Small Modular Reactor Market by Type
14.10 Latin America Small Modular Reactor Market by Application
14.11 Brazil Small Modular Reactor Market Analysis
14.12 Argentina Small Modular Reactor Market Analysis
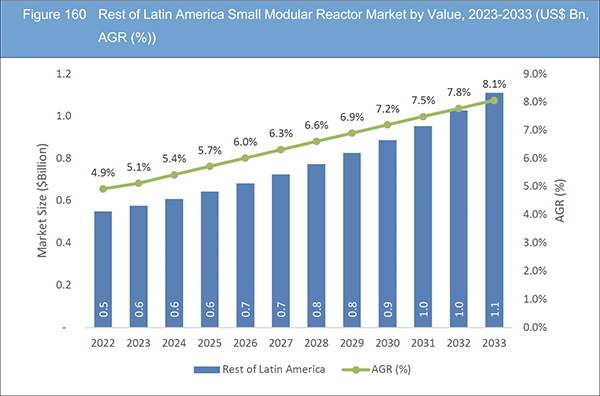
14.13 Rest of Latin America Small Modular Reactor Market Analysis
15 Company Profiles
15.1 Competitive Landscape, 2022
15.2 Strategic Outlook
15.3 Westinghouse Electric Company LLC
15.3.1 Company Snapshot
15.3.2 Company Overview
15.3.3 Product Benchmarking
15.3.4 Strategic Outlook
15.4 NuScale Power Corporation
15.4.1 Company Snapshot
15.4.2 Company Overview
15.4.3 Financial Analysis
15.4.3.1 Net Revenue, 2020-2022
15.4.3.2 R&D, 2020-2022
15.4.4 Product Benchmarking
15.4.5 Strategic Outlook
15.5 Terrestrial Energy
15.5.1 Company Snapshot
15.5.2 Company Overview
15.5.3 Product Benchmarking
15.5.4 Strategic Outlook
15.6 Moltex Energy
15.6.1 Company Snapshot
15.6.2 Company Overview
15.6.3 Product Benchmarking
15.7 GE Hitachi Nuclear Energy
15.7.1 Company Snapshot
15.7.2 Company Overview
15.7.3 Product Benchmarking
15.7.4 Strategic Outlook
15.8 X Energy, LLC
15.8.1 Company Snapshot
15.8.2 Company Overview
15.8.3 Product Benchmarking
15.8.4 Strategic Outlook
15.9 General Atomics
15.9.1 Company Snapshot
15.9.2 Company Overview
15.9.3 Product Benchmarking
15.9.4 Strategic Outlook
15.10 ARC Clean Energy
15.10.1 Company Snapshot
15.10.2 Company Overview
15.10.3 Product Benchmarking
15.10.4 Strategic Outlook
15.11 Rolls-Royce Limited
15.11.1 Company Snapshot
15.11.2 Company Overview
15.11.3 Financial Analysis
15.11.3.1 Net Revenue, 2018-2022
15.11.3.2 R&D, 2018-2022
15.11.3.3 Regional Revenue Share, 2022 (%)
15.11.3.4 Business Segment Revenue Share, 2022 (%)
15.11.4 Product Benchmarking
15.11.5 Strategic Outlook
15.12 LeadCold Reactors
15.12.1 Company Snapshot
15.12.2 Company Overview
15.12.3 Product Benchmarking
15.12.4 Strategic Outlook
15.13 Ultra-Safe Nuclear Corporation
15.13.1 Company Snapshot
15.13.2 Company Overview
15.13.3 Product Benchmarking
15.13.4 Strategic Outlook
15.14 Tokamak Energy Ltd
15.14.1 Company Snapshot
15.14.2 Company Overview
15.14.3 Product Benchmarking
15.15 SNC-Lavalin Group Inc
15.15.1 Company Snapshot
15.15.2 Company Overview
15.15.3 Financial Analysis
15.15.3.1 Net Revenue, 2018-2022
15.15.3.2 Regional Revenue Share, 2022 (%)
15.15.3.3 Business Segment Revenue Share, 2022 (%)
15.15.4 Product Benchmarking
15.16 China National Nuclear Corporation
15.16.1 Company Snapshot
15.16.2 Company Overview
15.16.3 Product Benchmarking
15.16.4 Strategic Outlook
15.17 Framatome
15.17.1 Company Snapshot
15.17.2 Company Overview
15.17.3 Product Benchmarking
15.17.4 Strategic Outlook
16 Conclusion and Recommendations
16.1 Concluding Remarks from Visiongain
16.2 Recommendations for Market Players
List of Tables
Table 1 Small Modular Reactor Market Snapshot, 2023 & 2033 (US$ Billion, CAGR %)
Table 2 Small Modular Reactor Market by Region, 2023-2033 (US$ Bn, AGR (%), CAGR (%)) (V-Shaped Recovery Scenario)
Table 3 Small Modular Reactor Market by Region, 2023-2033 (US$ Bn, AGR (%), CAGR (%)) (W-Shaped Recovery Scenario)
Table 4 Small Modular Reactor Market by Region, 2023-2033 (US$ Bn, AGR (%), CAGR (%)) (U-Shaped Recovery Scenario)
Table 5 Small Modular Reactor Market by Region, 2023-2033 (US$ Bn, AGR (%), CAGR (%)) (L-Shaped Recovery Scenario)
Table 6 Small Modular Reactor Market by Deployment, 2023-2033 (US$ Bn, AGR (%), CAGR (%))
Table 7 Land-based Plant Market by Region, 2023-2033 (US$ Bn, AGR (%), CAGR (%))
Table 8 Marine-based Plant Market by Region, 2023-2033 (US$ Bn, AGR (%), CAGR (%))
Table 9 Small Modular Reactor Market by Design, 2023-2033 (US$ Bn, AGR (%), CAGR (%))
Table 10 Integral Reactor Design Market by Region, 2023-2033 (US$ Bn, AGR (%), CAGR (%))
Table 11 Twin Reactor Design Market by Region, 2023-2033 (US$ Bn, AGR (%), CAGR (%))
Table 12 Other Reactor Design Market by Region, 2023-2033 (US$ Bn, AGR (%), CAGR (%))
Table 13 Small Modular Reactor Market by Coolant Type, 2023-2033 (US$ Bn, AGR (%), CAGR (%))
Table 14 Molten Salt Reactors (MSR) Market by Region, 2023-2033 (US$ Bn, AGR (%), CAGR (%))
Table 15 Gas-Cooled Reactors (GCR) Market by Region, 2023-2033 (US$ Bn, AGR (%), CAGR (%))
Table 16 Liquid Metal Reactors (LMR) Market by Region, 2023-2033 (US$ Bn, AGR (%), CAGR (%))
Table 17 Other Coolant Type Market by Region, 2023-2033 (US$ Bn, AGR (%), CAGR (%))
Table 18 Small Modular Reactor Market by Type, 2023-2033 (US$ Bn, AGR (%), CAGR (%))
Table 19 Pressurized Water Reactor (PWR) Market by Region, 2023-2033 (US$ Bn, AGR (%), CAGR (%))
Table 20 Pressurized Heavy Water Reactor (PHWR) Market by Region, 2023-2033 (US$ Bn, AGR (%), CAGR (%))
Table 21 High-Temperature Reactor (HTR) Market by Region, 2023-2033 (US$ Bn, AGR (%), CAGR (%))
Table 22 Fast Neutron Reactor (FNR) Market by Region, 2023-2033 (US$ Bn, AGR (%), CAGR (%))
Table 23 Other Type Market by Region, 2023-2033 (US$ Bn, AGR (%), CAGR (%))
Table 24 Small Modular Reactor Market by Application, 2023-2033 (US$ Bn, AGR (%), CAGR (%))
Table 25 Power Generation Market by Region, 2023-2033 (US$ Bn, AGR (%), CAGR (%))
Table 26 Desalination Market by Region, 2023-2033 (US$ Bn, AGR (%), CAGR (%))
Table 27 Process Heat Supply Market by Region, 2023-2033 (US$ Bn, AGR (%), CAGR (%))
Table 28 Industrial Applications Market by Region, 2023-2033 (US$ Bn, AGR (%), CAGR (%))
Table 29 District Heating Market by Region, 2023-2033 (US$ Bn, AGR (%), CAGR (%))
Table 30 Other Applications Market by Region, 2023-2033 (US$ Bn, AGR (%), CAGR (%))
Table 31 Small Modular Reactor Market by Region, 2023-2033 (US$ Bn, AGR (%), CAGR (%))
Table 32 North America Small Modular Reactor Market by Value, 2023-2033 (US$ Bn, AGR (%), CAGR (%))
Table 33 North America Small Modular Reactor Market by Country, 2023-2033 (US$ Bn, AGR (%), CAGR (%))
Table 34 North America Small Modular Reactor Market by Deployment, 2023-2033 (US$ Bn, AGR (%), CAGR (%))
Table 35 North America Small Modular Reactor Market by Design, 2023-2033 (US$ Bn, AGR (%), CAGR (%))
Table 36 North America Small Modular Reactor Market by Coolant Type, 2023-2033 (US$ Bn, AGR (%), CAGR (%))
Table 37 North America Small Modular Reactor Market by Type, 2023-2033 (US$ Bn, AGR (%), CAGR (%))
Table 38 North America Small Modular Reactor Market by Application, 2023-2033 (US$ Bn, AGR (%), CAGR (%))
Table 39 US Small Modular Reactor Market by Value, 2023-2033 (US$ Bn, AGR (%), CAGR (%))
Table 40 Canada Small Modular Reactor Market by Value, 2023-2033 (US$ Bn, AGR (%), CAGR (%))
Table 41 Europe Small Modular Reactor Market by Value, 2023-2033 (US$ Bn, AGR (%), CAGR (%))
Table 42 Europe Small Modular Reactor Market by Country, 2023-2033 (US$ Bn, AGR (%), CAGR (%))
Table 43 Europe Small Modular Reactor Market by Deployment, 2023-2033 (US$ Bn, AGR (%), CAGR (%))
Table 44 Europe Small Modular Reactor Market by Design, 2023-2033 (US$ Bn, AGR (%), CAGR (%))
Table 45 Europe Small Modular Reactor Market by Coolant Type, 2023-2033 (US$ Bn, AGR (%), CAGR (%))
Table 46 Europe Small Modular Reactor Market by Type, 2023-2033 (US$ Bn, AGR (%), CAGR (%))
Table 47 Europe Small Modular Reactor Market by Application, 2023-2033 (US$ Bn, AGR (%), CAGR (%))
Table 48 Russia Small Modular Reactor Market by Value, 2023-2033 (US$ Bn, AGR (%), CAGR (%))
Table 49 UK Small Modular Reactor Market by Value, 2023-2033 (US$ Bn, AGR (%), CAGR (%))
Table 50 France Small Modular Reactor Market by Value, 2023-2033 (US$ Bn, AGR (%), CAGR (%))
Table 51 Luxembourg Small Modular Reactor Market by Value, 2023-2033 (US$ Bn, AGR (%), CAGR (%))
Table 52 Sweden Small Modular Reactor Market by Value, 2023-2033 (US$ Bn, AGR (%), CAGR (%))
Table 53 Rest of Europe Small Modular Reactor Market by Value, 2023-2033 (US$ Bn, AGR (%), CAGR (%))
Table 54 Asia-Pacific Small Modular Reactor Market by Value, 2023-2033 (US$ Bn, AGR (%), CAGR (%))
Table 55 Asia-Pacific Small Modular Reactor Market by Country, 2023-2033 (US$ Bn, AGR (%), CAGR (%))
Table 56 Asia-Pacific Small Modular Reactor Market by Deployment, 2023-2033 (US$ Bn, AGR (%), CAGR (%))
Table 57 Asia-Pacific Small Modular Reactor Market by Design, 2023-2033 (US$ Bn, AGR (%), CAGR (%))
Table 58 Asia-Pacific Small Modular Reactor Market by Coolant Type, 2023-2033 (US$ Bn, AGR (%), CAGR (%))
Table 59 Asia-Pacific Small Modular Reactor Market by Type, 2023-2033 (US$ Bn, AGR (%), CAGR (%))
Table 60 Asia-Pacific Small Modular Reactor Market by Application, 2023-2033 (US$ Bn, AGR (%), CAGR (%))
Table 61 China Small Modular Reactor Market by Value, 2023-2033 (US$ Bn, AGR (%), CAGR (%))
Table 62 Indonesia Small Modular Reactor Market by Value, 2023-2033 (US$ Bn, AGR (%), CAGR (%))
Table 63 Japan Small Modular Reactor Market by Value, 2023-2033 (US$ Bn, AGR (%), CAGR (%))
Table 64 South Korea Small Modular Reactor Market by Value, 2023-2033 (US$ Bn, AGR (%), CAGR (%))
Table 65 India Small Modular Reactor Market by Value, 2023-2033 (US$ Bn, AGR (%), CAGR (%))
Table 66 Rest of Asia-Pacific Small Modular Reactor Market by Value, 2023-2033 (US$ Bn, AGR (%), CAGR (%))
Table 67 Middle East & Africa Small Modular Reactor Market by Value, 2023-2033 (US$ Bn, AGR (%), CAGR (%))
Table 68 Middle East & Africa Small Modular Reactor Market by Country, 2023-2033 (US$ Bn, AGR (%), CAGR (%))
Table 69 Middle East & Africa Small Modular Reactor Market by Deployment, 2023-2033 (US$ Bn, AGR (%), CAGR (%))
Table 70 Middle East & Africa Small Modular Reactor Market by Design, 2023-2033 (US$ Bn, AGR (%), CAGR (%))
Table 71 Middle East & Africa Small Modular Reactor Market by Coolant Type, 2023-2033 (US$ Bn, AGR (%), CAGR (%))
Table 72 Middle East & Africa Small Modular Reactor Market by Type, 2023-2033 (US$ Bn, AGR (%), CAGR (%))
Table 73 Middle East & Africa Small Modular Reactor Market by Application, 2023-2033 (US$ Bn, AGR (%), CAGR (%))
Table 74 GCC Small Modular Reactor Market by Value, 2023-2033 (US$ Bn, AGR (%), CAGR (%))
Table 75 South Africa Small Modular Reactor Market by Value, 2023-2033 (US$ Bn, AGR (%), CAGR (%))
Table 76 Rest of Middle East & Africa Small Modular Reactor Market by Value, 2023-2033 (US$ Bn, AGR (%), CAGR (%))
Table 77 Latin America Small Modular Reactor Market by Value, 2023-2033 (US$ Bn, AGR (%), CAGR (%))
Table 78 Latin America Small Modular Reactor Market by Country, 2023-2033 (US$ Bn, AGR (%), CAGR (%))
Table 79 Latin America Small Modular Reactor Market by Deployment, 2023-2033 (US$ Bn, AGR (%), CAGR (%))
Table 80 Latin America Small Modular Reactor Market by Design, 2023-2033 (US$ Bn, AGR (%), CAGR (%))
Table 81 Latin America Small Modular Reactor Market by Coolant Type, 2023-2033 (US$ Bn, AGR (%), CAGR (%))
Table 82 Latin America Small Modular Reactor Market by Type, 2023-2033 (US$ Bn, AGR (%), CAGR (%))
Table 83 Latin America Small Modular Reactor Market by Application, 2023-2033 (US$ Bn, AGR (%), CAGR (%))
Table 84 Brazil Small Modular Reactor Market by Value, 2023-2033 (US$ Bn, AGR (%), CAGR (%))
Table 85 Argentina Small Modular Reactor Market by Value, 2023-2033 (US$ Bn, AGR (%), CAGR (%))
Table 86 Rest of Latin America Small Modular Reactor Market by Value, 2023-2033 (US$ Bn, AGR (%), CAGR (%))
Table 87 Strategic Outlook
Table 88 Westinghouse Electric Company LLC: Key Details, (CEO, HQ, Revenue, Founded, No. of Employees, Company Type, Website, Business Segment)
Table 89 Westinghouse Electric Company LLC: Product Benchmarking
Table 90 Westinghouse Electric Company LLC: Strategic Outlook
Table 91 NuScale Power Corporation: Key Details, (CEO, HQ, Revenue, Founded, No. of Employees, Company Type, Website, Business Segment)
Table 92 NuScale Power Corporation: Product Benchmarking
Table 93 NuScale Power Corporation: Strategic Outlook
Table 94 Terrestrial Energy : Key Details, (CEO, HQ, Revenue, Founded, No. of Employees, Company Type, Website, Business Segment)
Table 95 Terrestrial Energy: Product Benchmarking
Table 96 Terrestrial Energy: Strategic Outlook
Table 97 Moltex Energy: Key Details, (CEO, HQ, Revenue, Founded, No. of Employees, Company Type, Website, Business Segment)
Table 98 Moltex Energy: Product Benchmarking
Table 99 GE Hitachi Nuclear Energy: Key Details, (CEO, HQ, Revenue, Founded, No. of Employees, Company Type, Website, Business Segment)
Table 100 GE Hitachi Nuclear Energy: Product Benchmarking
Table 101 GE Hitachi Nuclear Energy: Strategic Outlook
Table 102 X Energy, LLC: Key Details, (CEO, HQ, Revenue, Founded, No. of Employees, Company Type, Website, Business Segment)
Table 103 X Energy, LLC: Product Benchmarking
Table 104 X Energy, LLC: Strategic Outlook
Table 105 General Atomics: Key Details, (CEO, HQ, Revenue, Founded, No. of Employees, Company Type, Website, Business Segment)
Table 106 General Atomics: Product Benchmarking
Table 107 General Atomics: Strategic Outlook
Table 108 ARC Clean Energy: Key Details, (CEO, HQ, Revenue, Founded, No. of Employees, Company Type, Website, Business Segment)
Table 109 ARC Clean Energy: Product Benchmarking
Table 110 ARC Clean Energy: Strategic Outlook
Table 111 Rolls-Royce Limited: Key Details, (CEO, HQ, Revenue, Founded, No. of Employees, Company Type, Website, Business Segment)
Table 112 Rolls-Royce Limited: Product Benchmarking
Table 113 Rolls-Royce Limited: Strategic Outlook
Table 114 LeadCold Reactors : Key Details, (CEO, HQ, Revenue, Founded, No. of Employees, Company Type, Website, Business Segment)
Table 115 LeadCold Reactors: Product Benchmarking
Table 116 LeadCold Reactors: Strategic Outlook
Table 117 Ultra Safe Nuclear Corporation : Key Details, (CEO, HQ, Revenue, Founded, No. of Employees, Company Type, Website, Business Segment)
Table 118 Ultra Safe Nuclear Corporation: Product Benchmarking
Table 119 Ultra Safe Nuclear Corporation: Strategic Outlook
Table 120 Tokamak Energy Ltd: Key Details, (CEO, HQ, Revenue, Founded, No. of Employees, Company Type, Website, Business Segment)
Table 121 SNC-Lavalin Group Inc: Key Details, (CEO, HQ, Revenue, Founded, No. of Employees, Company Type, Website, Business Segment)
Table 122 SNC-Lavalin Group Inc.: Product Benchmarking
Table 123 China National Nuclear Corporation: Key Details, (CEO, HQ, Revenue, Founded, No. of Employees, Company Type, Website, Business Segment)
Table 124 China National Nuclear Corporation: Product Benchmarking
Table 125 China National Nuclear Corporation: Strategic Outlook
Table 126 Framatome: Key Details, (CEO, HQ, Revenue, Founded, No. of Employees, Company Type, Website, Business Segment)
Table 127 Framatome: Strategic Outlook
List of Figures
Figure 1 Small Modular Reactor Market Segmentation
Figure 2 Small Modular Reactor Market by Deployment: Market Attractiveness Index
Figure 3 Small Modular Reactor Market by Design: Market Attractiveness Index
Figure 4 Small Modular Reactor Market by Coolant Type: Market Attractiveness Index
Figure 5 Small Modular Reactor Market by Type: Market Attractiveness Index
Figure 6 Small Modular Reactor Market by Application: Market Attractiveness Index
Figure 7 Small Modular Reactor Market Attractiveness Index by Region
Figure 8 Small Modular Reactor Market: Market Dynamics
Figure 9 Small Modular Reactor Market by Region, 2023-2033 (US$ Bn, AGR (%)) (V-Shaped Recovery Scenario)
Figure 10 Small Modular Reactor Market by Region, 2023-2033 (US$ Bn, AGR (%)) (W-Shaped Recovery Scenario)
Figure 11 Small Modular Reactor Market by Region, 2023-2033 (US$ Bn, AGR (%)) (U-Shaped Recovery Scenario)
Figure 12 Small Modular Reactor Market by Region, 2023-2033 (US$ Bn, AGR (%)) (L-Shaped Recovery Scenario)
Figure 13 Small Modular Reactor Market: Porter’s Five Forces Analysis
Figure 14 Small Modular Reactor Market by Deployment: Market Attractiveness Index
Figure 15 Small Modular Reactor Market by Deployment, 2023-2033 (US$ Bn, AGR (%))
Figure 16 Land-based Plant Market by Region, 2023-2033 (US$ Bn, AGR (%))
Figure 17 Land-Based Plant Segment Market Share Forecast by Region, 2023 & 2033 (%)
Figure 18 Marine-based Plant Market by Region, 2023-2033 (US$ Bn, AGR (%))
Figure 19 Marine-based Plant Segment Market Share Forecast by Region, 2023 & 2033 (%)
Figure 20 Small Modular Reactor Market by Design: Market Attractiveness Index
Figure 21 Small Modular Reactor Market by Design, 2023-2033 (US$ Bn, AGR (%))
Figure 22 Integral Reactor Design Market by Region, 2023-2033 (US$ Bn, AGR (%))
Figure 23 Integral Reactor Design Segment Market Share Forecast by Region, 2023 & 2033 (%)
Figure 24 Twin Reactor Design Market by Region, 2023-2033 (US$ Bn, AGR (%))
Figure 25 Twin Reactor Design Segment Market Share Forecast by Region, 2023 & 2033 (%)
Figure 26 Other Reactor Design Market by Region, 2023-2033 (US$ Bn, AGR (%))
Figure 27 Other Reactor Design Segment Market Share Forecast by Region, 2023 & 2033 (%)
Figure 28 Small Modular Reactor Market by Coolant Type: Market Attractiveness Index
Figure 29 Small Modular Reactor Market by Coolant Type, 2023-2033 (US$ Bn, AGR (%))
Figure 30 Molten Salt Reactors (MSR) Market by Region, 2023-2033 (US$ Bn, AGR (%))
Figure 31 Molten Salt Reactors (MSR) Segment Market Share Forecast by Region, 2023 & 2033 (%)
Figure 32 Gas-Cooled Reactors (GCR) Market by Region, 2023-2033 (US$ Bn, AGR (%))
Figure 33 Gas-Cooled Reactors (GCR) Segment Market Share Forecast by Region, 2023 & 2033 (%)
Figure 34 Liquid Metal Reactors (LMR) Market by Region, 2023-2033 (US$ Bn, AGR (%))
Figure 35 Liquid Metal Reactors (LMR) Segment Market Share Forecast by Region, 2023 & 2033 (%)
Figure 36 Other Coolant Type Market by Region, 2023-2033 (US$ Bn, AGR (%))
Figure 37 Other Coolant Type Segment Market Share Forecast by Region, 2023 & 2033 (%)
Figure 38 Small Modular Reactor Market by Type: Market Attractiveness Index
Figure 39 Global Small Modular Reactor Market by Type, 2023-2033 (US$ Bn, AGR (%))
Figure 40 Pressurized Water Reactor (PWR) Market by Region, 2023-2033 (US$ Bn, AGR (%))
Figure 41 Pressurized Water Reactor (PWR) Segment Market Share Forecast by Region, 2023 & 2033 (%)
Figure 42 Pressurized Heavy Water Reactor (PHWR) Market by Region, 2023-2033 (US$ Bn, AGR (%))
Figure 43 Pressurized Heavy Water Reactor (PHWR) Segment Market Share Forecast by Region, 2023 & 2033 (%)
Figure 44 High-Temperature Reactor (HTR) Market by Region, 2023-2033 (US$ Bn, AGR (%))
Figure 45 High-Temperature Reactor (HTR) Segment Market Share Forecast by Region, 2023 & 2033 (%)
Figure 46 Fast Neutron Reactor (FNR) Market by Region, 2023-2033 (US$ Bn, AGR (%))
Figure 47 Fast Neutron Reactor (FNR) Segment Market Share Forecast by Region, 2023 & 2033 (%)
Figure 48 Other Type Market by Region, 2023-2033 (US$ Bn, AGR (%))
Figure 49 Other Type Segment Market Share Forecast by Region, 2023 & 2033 (%)
Figure 50 Small Modular Reactor Market by Application: Market Attractiveness Index
Figure 51 Small Modular Reactor Market by Application, 2023-2033 (US$ Bn, AGR (%))
Figure 52 Power Generation Market by Region, 2023-2033 (US$ Bn, AGR (%))
Figure 53 Power Generation Segment Market Share Forecast by Region, 2023 & 2033 (%)
Figure 54 Desalination Market by Region, 2023-2033 (US$ Bn, AGR (%))
Figure 55 Desalination Segment Market Share Forecast by Region, 2023 & 2033 (%)
Figure 56 Process Heat Supply Market by Region, 2023-2033 (US$ Bn, AGR (%))
Figure 57 Process Heat Supply Segment Market Share Forecast by Region, 2023 & 2033 (%)
Figure 58 Industrial Applications Market by Region, 2023-2033 (US$ Bn, AGR (%))
Figure 59 Industrial Applications Segment Market Share Forecast by Region, 2023 & 2033 (%)
Figure 60 District Heating Market by Region, 2023-2033 (US$ Bn, AGR (%))
Figure 61 District Heating Segment Market Share Forecast by Region, 2023 & 2033 (%)
Figure 62 Other Applications Market by Region, 2023-2033 (US$ Bn, AGR (%))
Figure 63 Other Applications Segment Market Share Forecast by Region, 2023 & 2033 (%)
Figure 64 Small Modular Reactor Market Forecast by Region 2023 and 2033 (Revenue, CAGR%)
Figure 65 Small Modular Reactor Market by Region, 2023-2033 (US$ Bn, AGR (%))
Figure 66 North America Small Modular Reactor Market Attractiveness Index
Figure 67 North America Small Modular Reactor Market by Region, 2023, 2028 & 2033 (US$ Billion)
Figure 68 North America Small Modular Reactor Market by Value, 2023-2033 (US$ Bn, AGR (%))
Figure 69 North America Small Modular Reactor Market by Country, 2023-2033 (US$ Bn, AGR (%))
Figure 70 North America Small Modular Reactor Market Share Forecast by Country, 2023 & 2033 (%)
Figure 71 North America Small Modular Reactor Market by Deployment, 2023-2033 (US$ Bn, AGR (%))
Figure 72 North America Small Modular Reactor Market Share Forecast by Deployment, 2023 & 2033 (%)
Figure 73 North America Small Modular Reactor Market by Design, 2023-2033 (US$ Bn, AGR (%))
Figure 74 North America Small Modular Reactor Market Share Forecast by Design, 2023 & 2033 (%)
Figure 75 North America Small Modular Reactor Market by Coolant Type, 2023-2033 (US$ Bn, AGR (%))
Figure 76 North America Small Modular Reactor Market Share Forecast by Coolant Type, 2023 & 2033 (%)
Figure 77 North America Small Modular Reactor Market by Type, 2023-2033 (US$ Bn, AGR (%))
Figure 78 North America Small Modular Reactor Market Share Forecast by Type, 2023 & 2033 (%)
Figure 79 North America Small Modular Reactor Market by Application, 2023-2033 (US$ Bn, AGR (%))
Figure 80 North America Small Modular Reactor Market Share Forecast by Application, 2023 & 2033 (%)
Figure 81 US Small Modular Reactor Market by Value, 2023-2033 (US$ Bn, AGR (%))
Figure 82 Canada Small Modular Reactor Market by Value, 2023-2033 (US$ Bn, AGR (%))
Figure 83 Europe Small Modular Reactor Market Attractiveness Index
Figure 84 Europe Small Modular Reactor Market by Region, 2023, 2028 & 2033 (US$ Billion)
Figure 85 Europe Small Modular Reactor Market by Value, 2023-2033 (US$ Bn, AGR (%))
Figure 86 Europe Small Modular Reactor Market by Country, 2023-2033 (US$ Bn, AGR (%))
Figure 87 Europe Small Modular Reactor Market Share Forecast by Country, 2023 & 2033 (%)
Figure 88 Europe Small Modular Reactor Market by Deployment, 2023-2033 (US$ Bn, AGR (%))
Figure 89 Europe Small Modular Reactor Market Share Forecast by Deployment, 2023 & 2033 (%)
Figure 90 Europe Small Modular Reactor Market by Design, 2023-2033 (US$ Bn, AGR (%))
Figure 91 Europe Small Modular Reactor Market Share Forecast by Design, 2023 & 2033 (%)
Figure 92 Europe Small Modular Reactor Market by Coolant Type, 2023-2033 (US$ Bn, AGR (%))
Figure 93 Europe Small Modular Reactor Market Share Forecast by Coolant Type, 2023 & 2033 (%)
Figure 94 Europe Small Modular Reactor Market by Type, 2023-2033 (US$ Bn, AGR (%))
Figure 95 Europe Small Modular Reactor Market Share Forecast by Type, 2023 & 2033 (%)
Figure 96 Europe Small Modular Reactor Market by Application, 2023-2033 (US$ Bn, AGR (%))
Figure 97 Europe Small Modular Reactor Market Share Forecast by Application, 2023 & 2033 (%)
Figure 98 Russia Small Modular Reactor Market by Value, 2023-2033 (US$ Bn, AGR (%))
Figure 99 UK Small Modular Reactor Market by Value, 2023-2033 (US$ Bn, AGR (%))
Figure 100 France Small Modular Reactor Market by Value, 2023-2033 (US$ Bn, AGR (%))
Figure 101 Luxembourg Small Modular Reactor Market by Value, 2023-2033 (US$ Bn, AGR (%))
Figure 102 Sweden Small Modular Reactor Market by Value, 2023-2033 (US$ Bn, AGR (%))
Figure 103 Rest of Europe Small Modular Reactor Market by Value, 2023-2033 (US$ Bn, AGR (%))
Figure 104 Asia Pacific Small Modular Reactor Market Attractiveness Index
Figure 105 Asia Pacific Small Modular Reactor Market by Region, 2023, 2028 & 2033 (US$ Billion)
Figure 106 Asia-Pacific Small Modular Reactor Market by Value, 2023-2033 (US$ Bn, AGR (%))
Figure 107 Asia-Pacific Small Modular Reactor Market by Country, 2023-2033 (US$ Bn, AGR (%))
Figure 108 Asia Pacific Small Modular Reactor Market Share Forecast by Country, 2023 & 2033 (%)
Figure 109 Asia-Pacific Small Modular Reactor Market by Deployment, 2023-2033 (US$ Bn, AGR (%))
Figure 110 Asia Pacific Small Modular Reactor Market Share Forecast by Deployment, 2023 & 2033 (%)
Figure 111 Asia-Pacific Small Modular Reactor Market by Design, 2023-2033 (US$ Bn, AGR (%))
Figure 112 Asia Pacific Small Modular Reactor Market Share Forecast by Design, 2023 & 2033 (%)
Figure 113 Asia-Pacific Small Modular Reactor Market by Coolant Type, 2023-2033 (US$ Bn, AGR (%))
Figure 114 North America Small Modular Reactor Market Share Forecast by Coolant Type, 2023 & 2033 (%)
Figure 115 Asia-Pacific Small Modular Reactor Market by Type, 2023-2033 (US$ Bn, AGR (%))
Figure 116 North America Small Modular Reactor Market Share Forecast by Type, 2023 & 2033 (%)
Figure 117 Asia-Pacific Small Modular Reactor Market by Application, 2023-2033 (US$ Bn, AGR (%))
Figure 118 North America Small Modular Reactor Market Share Forecast by Application, 2023 & 2033 (%)
Figure 119 China Small Modular Reactor Market by Value, 2023-2033 (US$ Bn, AGR (%))
Figure 120 Indonesia Small Modular Reactor Market by Value, 2023-2033 (US$ Bn, AGR (%))
Figure 121 Japan Small Modular Reactor Market by Value, 2023-2033 (US$ Bn, AGR (%))
Figure 122 South Korea Small Modular Reactor Market by Value, 2023-2033 (US$ Bn, AGR (%))
Figure 123 India Small Modular Reactor Market by Value, 2023-2033 (US$ Bn, AGR (%))
Figure 124 Rest of Asia-Pacific Small Modular Reactor Market by Value, 2023-2033 (US$ Bn, AGR (%))
Figure 125 Middle East & Africa Small Modular Reactor Market Attractiveness Index
Figure 126 Middle East & Africa Small Modular Reactor Market by Region, 2023, 2028 & 2033 (US$ Billion)
Figure 127 Middle East & Africa Small Modular Reactor Market by Value, 2023-2033 (US$ Bn, AGR (%))
Figure 128 Middle East & Africa Small Modular Reactor Market by Country, 2023-2033 (US$ Bn, AGR (%))
Figure 129 Middle East & Africa Small Modular Reactor Market Share Forecast by Country, 2023 & 2033 (%)
Figure 130 Middle East & Africa Small Modular Reactor Market by Deployment, 2023-2033 (US$ Bn, AGR (%))
Figure 131 Middle East & Africa Small Modular Reactor Market Share Forecast by Deployment, 2023 & 2033 (%)
Figure 132 Middle East & Africa Small Modular Reactor Market by Design, 2023-2033 (US$ Bn, AGR (%))
Figure 133 Middle East & Africa Small Modular Reactor Market Share Forecast by Design, 2023 & 2033 (%)
Figure 134 Middle East & Africa Small Modular Reactor Market by Coolant Type, 2023-2033 (US$ Bn, AGR (%))
Figure 135 Middle East & Africa Small Modular Reactor Market Share Forecast by Coolant Type, 2023 & 2033 (%)
Figure 136 Middle East & Africa Small Modular Reactor Market by Type, 2023-2033 (US$ Bn, AGR (%))
Figure 137 Middle East & Africa Small Modular Reactor Market Share Forecast by Type, 2023 & 2033 (%)
Figure 138 Middle East & Africa Small Modular Reactor Market by Application, 2023-2033 (US$ Bn, AGR (%))
Figure 139 Middle East & Africa Small Modular Reactor Market Share Forecast by Application, 2023 & 2033 (%)
Figure 140 GCC Small Modular Reactor Market by Value, 2023-2033 (US$ Bn, AGR (%))
Figure 141 South Africa Small Modular Reactor Market by Value, 2023-2033 (US$ Bn, AGR (%))
Figure 142 Rest of Middle East & Africa Small Modular Reactor Market by Value, 2023-2033 (US$ Bn, AGR (%))
Figure 143 Latin America Small Modular Reactor Market Attractiveness Index
Figure 144 Latin America Small Modular Reactor Market by Region, 2023, 2028 & 2033 (US$ Billion)
Figure 145 Latin America Small Modular Reactor Market by Value, 2023-2033 (US$ Bn, AGR (%))
Figure 146 Latin America Small Modular Reactor Market by Country, 2023-2033 (US$ Bn, AGR (%))
Figure 147 Latin America Small Modular Reactor Market Share Forecast by Country, 2023 & 2033 (%)
Figure 148 Latin America Small Modular Reactor Market by Deployment, 2023-2033 (US$ Bn, AGR (%))
Figure 149 Latin America Small Modular Reactor Market Share Forecast by Deployment, 2023 & 2033 (%)
Figure 150 Latin America Small Modular Reactor Market by Design, 2023-2033 (US$ Bn, AGR (%))
Figure 151 Latin America Small Modular Reactor Market Share Forecast by Design, 2023 & 2033 (%)
Figure 152 Latin America Small Modular Reactor Market by Coolant Type, 2023-2033 (US$ Bn, AGR (%))
Figure 153 Latin America Small Modular Reactor Market Share Forecast by Coolant Type, 2023 & 2033 (%)
Figure 154 Latin America Small Modular Reactor Market by Type, 2023-2033 (US$ Bn, AGR (%))
Figure 155 Latin America Small Modular Reactor Market Share Forecast by Type, 2023 & 2033 (%)
Figure 156 Latin America Small Modular Reactor Market by Application, 2023-2033 (US$ Bn, AGR (%))
Figure 157 Latin America Small Modular Reactor Market Share Forecast by Application, 2023 & 2033 (%)
Figure 158 Brazil Small Modular Reactor Market by Value, 2023-2033 (US$ Bn, AGR (%))
Figure 159 Argentina Small Modular Reactor Market by Value, 2023-2033 (US$ Bn, AGR (%))
Figure 160 Rest of Latin America Small Modular Reactor Market by Value, 2023-2033 (US$ Bn, AGR (%))
Figure 161 Small Modular Reactor Market: Company Share, 2022
Figure 162 NuScale Power Corporation.: Net Revenue, 2018-2022 (US$ Million, AGR%)
Figure 163 NuScale Power Corporation.: R&D, 2018-2022 (US$ Million, AGR%)
Figure 164 Rolls-Royce Limited.: Net Revenue, 2018-2022 (US$ Million, AGR%)
Figure 165 Rolls-Royce Limited.: R&D, 2018-2022 (US$ Million, AGR%)
Figure 166 Rolls-Royce Limited.: Regional Revenue Share, 2022 (%)
Figure 167 Rolls-Royce Limited.: Business Segment Revenue Share, 2022 (%)
Figure 168 SNC-Lavalin Group Inc.: Net Revenue, 2018-2022 (US$ Million, AGR%)
Figure 169 SNC-Lavalin Group Inc.: Regional Revenue Share, 2022 (%)
Figure 170 SNC-Lavalin Group Inc.: Business Segment Revenue Share, 2022 (%)
List of Companies Profiled in the report
ARC Clean Energy
China National Nuclear Corporation (CNNC)
Framatome
GE Hitachi Nuclear Energy (GEH)
General Atomics (GA)
LeadCold Reactors
Moltex Energy
NuScale Power Corporation
Rolls-Royce Limited
SNC-Lavalin Group Inc.
Terrestrial Energy Inc.
Tokamak Energy Ltd
Ultra-Safe Nuclear (USNC)
Westinghouse Electric Company LLC
X Energy, LLC
List of Other Companies Mentioned in the report
Advanced Reactor Concepts LLC
Areva SA (now Framatome)
Babcock & Wilcox
Bechtel Corporation
BWX Technologies Inc.
China General Nuclear Power Group (CGN)
China National Nuclear Corporation (CNNC)
EDF Group
Energoatom
Fluor Corporation
Framatome
GE-Hitachi Nuclear Energy
General Atomics
Holtec International
Hyperion Power Generation Inc.
Idaho National Laboratory
Institute of Energy Economics, Japan (IEEJ)
JGC Holdings Corporation
Korea Electric Power Corporation (KEPCO)
LeadCold Reactors Inc.
Lightbridge Corporation
Mitsubishi Heavy Industries
Moltex Energy
National Nuclear Laboratory (UK)
NuScale Power
OKB Gidropress
OKBM Afrikantov
Oklo Inc.
Oregon State University (NuScale)
Rolls-Royce
Rosatom
SNC-Lavalin
Southern Company
StarCore Nuclear
TerraPower LLC
Terrestrial Energy Inc.
ThorCon Power
Toshiba Corporation
U-Battery Developments Limited
Ultra Safe Nuclear Corporation (USNC)
Westinghouse Electric Company
Wood Group
X-Energy LLC
X-energy LLC
Xcel Energy
List of Associations Mentioned in the Report
Advanced Nuclear Technology Industry Consortium (ANTI)
Advanced Reactor Development Association (ARDA)
American Nuclear Society (ANS)
American Society of Mechanical Engineers (ASME) - Nuclear Division
Australian Nuclear Science and Technology Organization (ANSTO)
Canadian Nuclear Association (CNA)
Canadian Nuclear Safety Commission (CNSC)
European Nuclear Society (ENS)
European Small Modular Reactor (SMR) Industry Association
Generation IV International Forum (GIF)
International Atomic Energy Agency (IAEA)
International Framework for Nuclear Energy Cooperation (IFNEC)
International SMR Forum
International Thorium Energy Organization (IThEO)
Japan Atomic Industrial Forum (JAIF)
Nuclear Energy Agency (NEA)
Nuclear Energy Institute (NEI)
Nuclear Industry Association (NIA) UK
U.S. Nuclear Regulatory Commission (NRC)
World Nuclear Association (WNA)