The Non-Destructive Testing (NDT) Market Report 2023-2033: This report will prove invaluable to leading firms striving for new revenue pockets if they wish to better understand the industry and its underlying dynamics. It will be useful for companies that would like to expand into different industries or to expand their existing operations in a new region.
Expansion of Infrastructure and Industrial Developments, Technological Advancements, and Government Laws Governing Public Safety and Product Quality are Driving Market Growth
The non-destructive testing (NDT) market plays a crucial role in infrastructure and industrial projects by ensuring the safety, quality, and reliability of materials, components, and structures without causing damage. Rapid urbanization, infrastructure development, and industrial expansion in emerging economies are driving the demand for NDT across the world. Latest or upcoming construction projects, including bridges, pipelines, power plants, and manufacturing facilities mandatory to require thorough inspection and quality assessment during their construction, operation, and maintenance phases. For instance, in June 2023, a public infrastructure firm called “Shreeji Infrastructure” won a US25.4 million engineering, procurement, and construction (EPC) contract from Coal India for 35W solar projects in West Bengal. Also, in January 2023, QatarEnergy invested US$6 billion in petrochemicals project with Chevron Phillips Chemical Co. to develop 2.1 million mt/year ethylene project in Ras Laffan.
Lack of Skilled Workforce to Perform NDT and Inspection Tasks and Limitations in Detecting Certain Defects to Hamper Industry Growth
The detection of defects is a critical aspect of ensuring the quality and reliability of products and structures across various industries. While non-destructive testing (NDT) techniques have been developed to identify flaws without causing damage, there are certain limitations that can hamper the detection of certain defects. For example, limitation is the size and depth of the defect. NDT methods rely on physical or electromagnetic properties to identify flaws, such as ultrasonic waves, X-rays, or magnetic fields. However, if a defect is too small or shallow, it may not produce a detectable signal or may be overlooked during inspection. Different NDT methods are suitable for specific types of defects. For instance, the ultrasonic testing is effective for detecting internal flaws such as cracks or delamination, but it may not be as effective in identifying surface defects. Similarly, X-ray inspection is excellent for detecting internal voids or inclusions, but it may not be as sensitive to certain types of structural discontinuities.
What Questions Should You Ask before Buying a Market Research Report?
• How is the non-destructive testing (NDT) market evolving?
• What is driving and restraining the non-destructive testing (NDT) market?
• How will each non-destructive testing (NDT) submarket segment grow over the forecast period and how much revenue will these submarkets account for in 2033?
• How will the market shares for each non-destructive testing (NDT) submarket develop from 2023 to 2033?
• What will be the main driver for the overall market from 2023 to 2033?
• Will leading non-destructive testing (NDT) markets broadly follow the macroeconomic dynamics, or will individual national markets outperform others?
• How will the market shares of the national markets change by 2033 and which geographical region will lead the market in 2033?
• Who are the leading players and what are their prospects over the forecast period?
• What are the non-destructive testing (NDT) projects for these leading companies?
• How will the industry evolve during the period between 2023 and 2033? What are the implications of non-destructive testing (NDT) projects taking place now and over the next 10 years?
• Is there a greater need for product commercialisation to further scale the non-destructive testing (NDT) market?
• Where is the non-destructive testing (NDT) market heading and how can you ensure you are at the forefront of the market?
• What are the best investment options for new product and service lines?
• What are the key prospects for moving companies into a new growth path and C-suite?
You need to discover how this will impact the non-destructive testing (NDT) market today, and over the next 10 years:
• Our 367-page report provides 137 tables and 209 charts/graphs exclusively to you.
• The report highlights key lucrative areas in the industry so you can target them – NOW.
• It contains in-depth analysis of global, regional and national sales and growth.
• It highlights for you the key successful trends, changes and revenue projections made by your competitors.
This report tells you TODAY how the non-destructive testing (NDT) market will develop in the next 10 years, and in line with the variations in COVID-19 economic recession and bounce. This market is more critical now than at any point over the last 10 years.
Forecasts to 2033 and other analyses reveal commercial prospects
• In addition to revenue forecasting to 2033, our new study provides you with recent results, growth rates, and market shares.
• You will find original analyses, with business outlooks and developments.
• Discover qualitative analyses (including market dynamics, drivers, opportunities, restraints and challenges), cost structure, impact of rising non-destructive testing (NDT) prices and recent developments.
This report includes data analysis and invaluable insight into how COVID-19 will affect the industry and your company. Four COVID-19 recovery patterns and their impact, namely, “V”, “L”, “W” and “U” are discussed in this report.
Segments Covered in the Report
Flaw Type
• Surface Cracks & Flaws
• Internal Flaws & Discontinuities
• Lack of Bond or Lack of Fusion
• Non-Metallic Inclusions (Slag, Porosity)
• Material Quality
• Laminations & Thickness Measurement
Material
• Ferrous Forgings & Stampings
• Ferrous Raw Materials & Rolled Products
• Ferrous Tube & Pipe
• Iron & Steel Castings
• Non-Ferrous Components & Materials
Technique
• Ultrasonic Testing
• Visual Testing
• Radiographic Testing
• Liquid Penetrant Testing
• Eddy-Current Testing
• Magnetic Particle Testing
Application
• Automotive & Railway Industry
• Aerospace Industry
• Petrochemical & Gas Industries
• Pipe & Tube Manufacturing Industry
• Shipbuilding Industry
• Non-Ferrous Components & Materials
End Use
• Designing
• Manufacturing Quality
• In-service Inspection
• Plant Life Extension
• Other End-Use

In addition to the revenue predictions for the overall world market and segments, you will also find revenue forecasts for five regional and 16 leading national markets:
North America
• U.S.
• Canada
Europe
• Germany
• UK
• France
• Spain
• Italy
• Rest of Europe
Asia Pacific
• China
• Japan
• India
• Australia
• South Korea
• Rest of Asia Pacific
Latin America
• Brazil
• Mexico
• Rest of Latin America
MEA
• GCC
• South Africa
• Rest of MEA
Need industry data? Please contact us today.
The report also includes profiles and for some of the leading companies in the Non-Destructive Testing (NDT) Market, 2023 to 2033, with a focus on this segment of these companies’ operations.
Leading companies and the potential for market growth
• Acuren
• Anritsu Corporation
• Ashtead Technology, Inc.
• Eddyfi Technology
• Fischer Technology Inc.
• FPrimeC Solutions Inc.
• Fujifilm Holding Corporation
• GE Measurement
• Intertek Group PLC
• Magnaflux Corporation
• Mistras group
• Nikon Corporation
• Olympus Corporation
• SGS SA
• Sonatest Ltd.
• T.D. Williamson, Inc.
Overall world revenue for Non-Destructive Testing (NDT) Market, 2023 to 2033 in terms of value the market will surpass US$9,574.6 million in 2023, our work calculates. We predict strong revenue growth through to 2033. Our work identifies which organizations hold the greatest potential. Discover their capabilities, progress, and commercial prospects, helping you stay ahead.
How will the Non-Destructive Testing (NDT) Market, 2023 to 2033 report help you?
In summary, our 360+ page report provides you with the following knowledge:
• Revenue forecasts to 2033 for Non-Destructive Testing (NDT) Market, 2023 to 2033 Market, with forecasts for application, system, and end user, each forecast at a global and regional level – discover the industry’s prospects, finding the most lucrative places for investments and revenues.
• Revenue forecasts to 2033 for five regional and 16 key national markets – See forecasts for the Non-Destructive Testing (NDT) Market, 2023 to 2033 market in North America, Europe, Asia-Pacific, Latin America, and MEA. Also forecasted is the market in the US, Canada, Mexico, Brazil, Germany, France, UK, Italy, China, India, Japan, and Australia among other prominent economies.
• Prospects for established firms and those seeking to enter the market – including company profiles for 16 of the major companies involved in the Non-Destructive Testing (NDT) Market, 2023 to 2033.
Find quantitative and qualitative analyses with independent predictions. Receive information that only our report contains, staying informed with invaluable business intelligence.
Information found nowhere else
With our new report, you are less likely to fall behind in knowledge or miss out on opportunities. See how our work could benefit your research, analyses, and decisions. Visiongain’s study is for everybody needing commercial analyses for the Non-Destructive Testing (NDT) Market, 2023 to 2033, market-leading companies. You will find data, trends and predictions.
To access the data contained in this document please email contactus@visiongain.com
Buy our report today Non-Destructive Testing (NDT) Market Report 2023-2033: Forecasts by Flaw Type (Surface Cracks & Flaws, Internal Flaws & Discontinuities, Lack of Bond or Lack of Fusion, Non-Metallic Inclusions (Slag, Porosity), Material Quality, Laminations & Thickness Measurement), by Material (Ferrous Forgings & Stampings, Ferrous Raw Materials & Rolled Products, Ferrous Tube & Pipe, Iron & Steel Castings, Non-Ferrous Components & Materials), by Technique (Ultrasonic Testing, Visual Testing, Radiographic Testing, Liquid Penetrant Testing, Eddy-Current Testing, Magnetic Particle Testing), by Application (Automotive & Railway Industry, Aerospace Industry, Petrochemical & Gas Industries, Pipe & Tube Manufacturing Industry, Shipbuilding Industry, Non-Ferrous Components & Materials), by End-use (Designing, Manufacturing Quality, In-service Inspection, Plant Life Extension, Other) AND Regional and Leading National Market Analysis PLUS Analysis of Leading Companies AND COVID-19 Impact and Recovery Pattern Analysis. Avoid missing out by staying informed – order our report now.
Visiongain is a trading partner with the US Federal Government
CCR Ref number: KD4R6
Do you have any custom requirements we can help you with? Any need for a specific country, geo region, market segment or specific company information? Contact us today, we can discuss your needs and see how we can help: contactus@visiongain.com
1 Report Overview
1.1 Objectives of the Study
1.2 Introduction to Non-Destructive Testing (NDT) Market
1.3 What This Report Delivers
1.4 Why You Should Read This Report
1.5 Key Questions Answered by This Analytical Report
1.6 Who is This Report for?
1.7 Methodology
1.7.1 Market Definitions
1.7.2 Market Evaluation & Forecasting Methodology
1.7.3 Data Validation
1.7.3.1 Primary Research
1.7.3.2 Secondary Research
1.8 Frequently Asked Questions (FAQs)
1.9 Associated Visiongain Reports
1.10 About Visiongain
2 Executive Summary
3 Market Overview
3.1 Key Findings
3.2 Market Dynamics
3.2.1 Market Driving Factors
3.2.1.1 Expansion of Infrastructure and Industrial Projects
3.2.1.2 Technological Advancements in NDT Techniques
3.2.1.3 Increasing Safety and Quality Regulations
3.2.2 Market Restraining Factors
3.2.2.1 Lack of Skilled Workforce to Perform NDT and Inspection Tasks
3.2.2.2 Limitations in Detecting Certain Defects
3.2.3 Market Opportunities
3.2.3.1 The Future of NDT With Wireless Sensors, A.I. And IoT
3.2.3.2 Use of Drones and Crawling Robots for NDT
3.3 COVID-19 Impact Analysis
3.4 Porter’s Five Forces Analysis
3.4.1 Bargaining Power of Suppliers
3.4.2 Bargaining Power of Buyers
3.4.3 Competitive Rivalry
3.4.4 Threat from Substitutes
3.4.5 Threat of New Entrants
3.5 PEST Analysis
4 Non-Destructive Testing (NDT) Market Analysis by Flaw Type
4.1 Key Findings
4.2 Flaw Type Segment: Market Attractiveness Index
4.3 Non-Destructive Testing (NDT) Market Size Estimation and Forecast by Flaw Type
4.4 Surface Cracks & Flaws
4.4.1 Market Size by Region, 2023-2033 (US$ Million)
4.4.2 Market Share by Region, 2023 & 2033 (%)
4.5 Internal Flaws & Discontinuities
4.5.1 Market Size by Region, 2023-2033 (US$ Million)
4.5.2 Market Share by Region, 2023 & 2033 (%)
4.6 Lack of Bond or Lack of Fusion
4.6.1 Market Size by Region, 2023-2033 (US$ Million)
4.6.2 Market Share by Region, 2023 & 2033 (%)
4.7 Non-Metallic Inclusions (Slag, Porosity)
4.7.1 Market Size by Region, 2023-2033 (US$ Million)
4.7.2 Market Share by Region, 2023 & 2033 (%)
4.8 Material Quality
4.8.1 Market Size by Region, 2023-2033 (US$ Million)
4.8.2 Market Share by Region, 2023 & 2033 (%)
4.9 Laminations & Thickness Measurement
4.9.1 Market Size by Region, 2023-2033 (US$ Million)
4.9.2 Market Share by Region, 2023 & 2033 (%)
5 Non-Destructive Testing (NDT) Market Analysis by Material
5.1 Key Findings
5.2 Material Segment: Market Attractiveness Index
5.3 Non-Destructive Testing (NDT) Market Size Estimation and Forecast by Material
5.4 Ferrous Forgings & Stampings
5.4.1 Market Size by Region, 2023-2033 (US$ Million)
5.4.2 Market Share by Region, 2023 & 2033 (%)
5.5 Ferrous Raw Materials & Rolled Products
5.5.1 Market Size by Region, 2023-2033 (US$ Million)
5.5.2 Market Share by Region, 2023 & 2033 (%)
5.6 Ferrous Tube & Pipe
5.6.1 Market Size by Region, 2023-2033 (US$ Million)
5.6.2 Market Share by Region, 2023 & 2033 (%)
5.7 Iron & Steel Castings
5.7.1 Market Size by Region, 2023-2033 (US$ Million)
5.7.2 Market Share by Region, 2023 & 2033 (%)
5.8 Non-Ferrous Components & Materials
5.8.1 Market Size by Region, 2023-2033 (US$ Million)
5.8.2 Market Share by Region, 2023 & 2033 (%)
6 Non-Destructive Testing (NDT) Market Analysis by Technique
6.1 Key Findings
6.2 Component Segment: Market Attractiveness Index
6.3 Non-Destructive Testing (NDT) Market Size Estimation and Forecast by Technique
6.4 Ultrasonic Testing
6.4.1 Market Size by Region, 2023-2033 (US$ Million)
6.4.2 Market Share by Region, 2023 & 2033 (%)
6.5 Visual Testing
6.5.1 Market Size by Region, 2023-2033 (US$ Million)
6.5.2 Market Share by Region, 2023 & 2033 (%)
6.6 Radiographic Testing
6.6.1 Market Size by Region, 2023-2033 (US$ Million)
6.6.2 Market Share by Region, 2023 & 2033 (%)
6.7 Liquid Penetrant Testing
6.7.1 Market Size by Region, 2023-2033 (US$ Million)
6.7.2 Market Share by Region, 2023 & 2033 (%)
6.8 Eddy-Current Testing
6.8.1 Market Size by Region, 2023-2033 (US$ Million)
6.8.2 Market Share by Region, 2023 & 2033 (%)
6.9 Magnetic Particle Testing
6.9.1 Market Size by Region, 2023-2033 (US$ Million)
6.9.2 Market Share by Region, 2023 & 2033 (%)
7 Non-Destructive Testing (NDT) Market Analysis by Application
7.1 Key Findings
7.2 Application Segment: Market Attractiveness Index
7.3 Non-Destructive Testing (NDT) Market Size Estimation and Forecast by Application
7.4 Automotive & Railway Industry
7.4.1 Market Size by Region, 2023-2033 (US$ Million)
7.4.2 Market Share by Region, 2023 & 2033 (%)
7.5 Aerospace Industry
7.5.1 Market Size by Region, 2023-2033 (US$ Million)
7.5.2 Market Share by Region, 2023 & 2033 (%)
7.6 Petrochemical & Gas Industries
7.6.1 Market Size by Region, 2023-2033 (US$ Million)
7.6.2 Market Share by Region, 2023 & 2033 (%)
7.7 Pipe & Tube Manufacturing Industry
7.7.1 Market Size by Region, 2023-2033 (US$ Million)
7.7.2 Market Share by Region, 2023 & 2033 (%)
7.8 Shipbuilding Industry
7.8.1 Market Size by Region, 2023-2033 (US$ Million)
7.8.2 Market Share by Region, 2023 & 2033 (%)
7.9 Non-Ferrous Components & Materials
7.9.1 Market Size by Region, 2023-2033 (US$ Million)
7.9.2 Market Share by Region, 2023 & 2033 (%)
8 Non-Destructive Testing (NDT) Market Analysis by End Use
8.1 Key Findings
8.2 End Use Segment: Market Attractiveness Index
8.3 Non-Destructive Testing (NDT) Market Size Estimation and Forecast by End Use
8.4 Designing
8.4.1 Market Size by Region, 2023-2033 (US$ Million)
8.4.2 Market Share by Region, 2023 & 2033 (%)
8.5 Manufacturing Quality
8.5.1 Market Size by Region, 2023-2033 (US$ Million)
8.5.2 Market Share by Region, 2023 & 2033 (%)
8.6 In-service Inspection
8.6.1 Market Size by Region, 2023-2033 (US$ Million)
8.6.2 Market Share by Region, 2023 & 2033 (%)
8.7 Plant Life Extension
8.7.1 Market Size by Region, 2023-2033 (US$ Million)
8.7.2 Market Share by Region, 2023 & 2033 (%)
8.8 Other End-Use
8.8.1 Market Size by Region, 2023-2033 (US$ Million)
8.8.2 Market Share by Region, 2023 & 2033 (%)
9 Non-Destructive Testing (NDT) Market Analysis by Region
9.1 Key Findings
9.2 Regional Market Size Estimation and Forecast
10 North America Non-Destructive Testing (NDT) Market Analysis
10.1 Key Findings
10.2 North America Non-Destructive Testing (NDT) Market Attractiveness Index
10.3 North America Non-Destructive Testing (NDT) Market by Country, 2023, 2028 & 2033 (US$ Million)
10.4 North America Non-Destructive Testing (NDT) Market Size Estimation and Forecast by Country
10.5 North America Non-Destructive Testing (NDT) Market Size Estimation and Forecast by Flaw Type
10.6 North America Non-Destructive Testing (NDT) Market Size Estimation and Forecast by Material
10.7 North America Non-Destructive Testing (NDT) Market Size Estimation and Forecast by Technique
10.8 North America Non-Destructive Testing (NDT) Market Size Estimation and Forecast by Application
10.9 North America Non-Destructive Testing (NDT) Market Size Estimation and Forecast by End Use
10.10 U.S. Non-Destructive Testing (NDT) Market Analysis
10.11 Canada Non-Destructive Testing (NDT) Market Analysis
11 Europe Non-Destructive Testing (NDT) Market Analysis
11.1 Key Findings
11.2 Europe Non-Destructive Testing (NDT) Market Attractiveness Index
11.3 Europe Non-Destructive Testing (NDT) Market by Country, 2023, 2028 & 2033 (US$ Million)
11.4 Europe Non-Destructive Testing (NDT) Market Size Estimation and Forecast by Country
11.5 Europe Non-Destructive Testing (NDT) Market Size Estimation and Forecast by Flaw Type
11.6 Europe Non-Destructive Testing (NDT) Market Size Estimation and Forecast by Material
11.7 Europe Non-Destructive Testing (NDT) Market Size Estimation and Forecast by Technique
11.8 Europe Non-Destructive Testing (NDT) Market Size Estimation and Forecast by Application
11.9 Europe Non-Destructive Testing (NDT) Market Size Estimation and Forecast by End Use
11.10 Germany Non-Destructive Testing (NDT) Market Analysis
11.11 France Non-Destructive Testing (NDT) Market Analysis
11.12 UK Non-Destructive Testing (NDT) Market Analysis
11.13 Italy Non-Destructive Testing (NDT) Market Analysis
11.14 Spain Non-Destructive Testing (NDT) Market Analysis
11.15 Rest of Europe Non-Destructive Testing (NDT) Market Analysis
12 Asia Pacific Non-Destructive Testing (NDT) Market Analysis
12.1 Key Findings
12.2 Asia Pacific Non-Destructive Testing (NDT) Market Attractiveness Index
12.3 Asia Pacific Non-Destructive Testing (NDT) Market by Country, 2023, 2028 & 2033 (US$ Million)
12.4 Asia Pacific Non-Destructive Testing (NDT) Market Size Estimation and Forecast by Country
12.5 Asia Pacific Non-Destructive Testing (NDT) Market Size Estimation and Forecast by Flaw Type
12.6 Asia Pacific Non-Destructive Testing (NDT) Market Size Estimation and Forecast by Material
12.7 Asia Pacific Non-Destructive Testing (NDT) Market Size Estimation and Forecast by Technique
12.8 Asia Pacific Non-Destructive Testing (NDT) Market Size Estimation and Forecast by Application
12.9 Asia Pacific Non-Destructive Testing (NDT) Market Size Estimation and Forecast by End Use
12.10 China Non-Destructive Testing (NDT) Market Analysis
12.11 Japan Non-Destructive Testing (NDT) Market Analysis
12.12 India Non-Destructive Testing (NDT) Market Analysis
12.13 Australia Non-Destructive Testing (NDT) Market Analysis
12.14 South Korea Non-Destructive Testing (NDT) Market Analysis
12.15 Rest of Asia Pacific Non-Destructive Testing (NDT) Market Analysis
13 Latin America Non-Destructive Testing (NDT) Market Analysis
13.1 Key Findings
13.2 Latin America Non-Destructive Testing (NDT) Market Attractiveness Index
13.3 Latin America Non-Destructive Testing (NDT) Market by Country, 2023, 2028 & 2033 (US$ Million)
13.4 Latin America Non-Destructive Testing (NDT) Market Size Estimation and Forecast by Country
13.5 Latin America Non-Destructive Testing (NDT) Market Size Estimation and Forecast by Flaw Type
13.6 Latin America Non-Destructive Testing (NDT) Market Size Estimation and Forecast by Material
13.7 Latin America Non-Destructive Testing (NDT) Market Size Estimation and Forecast by Technique
13.8 Latin America Non-Destructive Testing (NDT) Market Size Estimation and Forecast by Application
13.9 Latin America Non-Destructive Testing (NDT) Market Size Estimation and Forecast by End Use
13.10 Brazil Non-Destructive Testing (NDT) Market Analysis
13.11 Mexico Non-Destructive Testing (NDT) Market Analysis
13.12 Rest of Latin America Non-Destructive Testing (NDT) Market Analysis
14 MEA Non-Destructive Testing (NDT) Market Analysis
14.1 Key Findings
14.2 MEA Non-Destructive Testing (NDT) Market Attractiveness Index
14.3 MEA Non-Destructive Testing (NDT) Market by Country, 2023, 2028 & 2033 (US$ Million)
14.4 MEA Non-Destructive Testing (NDT) Market Size Estimation and Forecast by Country
14.5 MEA Non-Destructive Testing (NDT) Market Size Estimation and Forecast by Flaw Type
14.6 MEA Non-Destructive Testing (NDT) Market Size Estimation and Forecast by Material
14.7 MEA Non-Destructive Testing (NDT) Market Size Estimation and Forecast by Technique
14.8 MEA Non-Destructive Testing (NDT) Market Size Estimation and Forecast by Application
14.9 MEA Non-Destructive Testing (NDT) Market Size Estimation and Forecast by End Use
14.10 GCC Non-Destructive Testing (NDT) Market Analysis
14.11 South Africa Non-Destructive Testing (NDT) Market Analysis
14.12 Rest of MEA Non-Destructive Testing (NDT) Market Analysis
15 Company Profiles
15.1 Competitive Landscape, 2022
15.2 Strategic Outlook
15.3 Acuren Inspection Inc.
15.3.1 Company Snapshot
15.3.2 Company Overview
15.3.3 Product Benchmarking
15.3.4 Strategic Outlook
15.4 Anritsu Corporation
15.4.1 Company Snapshot
15.4.2 Company Overview
15.4.3 Financial Analysis
15.4.3.1 Net Revenue, 2017-2021
15.4.3.2 R&D, 2017-2021
15.4.3.3 Regional Market Shares, 2021
15.4.3.4 Segment Market Shares, 2021
15.4.4 Product Benchmarking
15.4.5 Strategic Outlook
15.5 Ashtead Technology, Inc.
15.5.1 Company Snapshot
15.5.2 Company Overview
15.5.3 Financial Analysis
15.5.3.1 Net Revenue, 2017-2022
15.5.3.2 Regional Market Shares, 2021
15.5.4 Product Benchmarking
15.5.5 Strategic Outlook
15.6 Eddyfi Technology
15.6.1 Company Snapshot
15.6.2 Company Overview
15.6.3 Product Benchmarking
15.6.4 Strategic Outlook
15.7 Fischer Technology Inc.
15.7.1 Company Snapshot
15.7.2 Company Overview
15.7.3 Product Benchmarking
15.7.4 Strategic Outlook
15.8 FPrimeC Solutions Inc.
15.8.1 Company Snapshot
15.8.2 Company Overview
15.8.3 Product Benchmarking
15.9 Fujifilm Holding Corporation
15.9.1 Company Snapshot
15.9.2 Company Overview
15.9.3 Financial Analysis
15.9.3.1 Net Revenue, 2017-2022
15.9.3.2 R&D, 2017-2021
15.9.3.3 Regional Market Shares, 2021
15.9.3.4 Segment Market Shares, 2021
15.9.4 Product Benchmarking
15.9.5 Strategic Outlook
15.10 GE Measurement & Control
15.10.1 Company Snapshot
15.10.2 Company Overview
15.10.3 Financial Analysis
15.10.3.1 Net Revenue, 2017-2022
15.10.3.2 R&D, 2017-2022
15.10.3.3 Regional Market Shares, 2022
15.10.3.4 Segment Market Shares, 2022
15.10.4 Product Benchmarking
15.10.5 Strategic Outlook
15.11 Intertek Group PLC
15.11.1 Company Snapshot
15.11.2 Company Overview
15.11.3 Financial Analysis
15.11.3.1 Net Revenue, 2017-2022
15.11.3.2 Regional Market Shares, 2022
15.11.3.3 Segment Market Shares, 2022
15.11.4 Product Benchmarking
15.11.5 Strategic Outlook
15.12 Magnaflux Corporation
15.12.1 Company Snapshot
15.12.2 Company Overview
15.12.3 Product Benchmarking
15.12.4 Strategic Outlook
15.13 Mistras Group
15.13.1 Company Snapshot
15.13.2 Company Overview
15.13.3 Financial Analysis
15.13.3.1 Net Revenue, 2017-2022
15.13.3.2 R&D, 2017-2022
15.13.3.3 Regional Market Shares, 2022
15.13.3.4 Segment Market Shares, 2022
15.13.4 Product Benchmarking
15.13.5 Strategic Outlook
15.14 Nikon Corporation
15.14.1 Company Snapshot
15.14.2 Company Overview
15.14.3 Financial Analysis
15.14.3.1 Net Revenue, 2017-2022
15.14.3.2 Regional Market Shares, 2022
15.14.3.3 Segment Market Shares, 2022
15.14.4 Product Benchmarking
15.14.5 Strategic Outlook
15.15 Olympus Corporation
15.15.1 Company Snapshot
15.15.2 Company Overview
15.15.3 Financial Analysis
15.15.3.1 Net Revenue, 2017-2022
15.15.3.2 Regional Market Shares, 2022
15.15.3.3 Segment Market Shares, 2022
15.15.4 Product Benchmarking
15.15.5 Strategic Outlook
15.16 SGS SA
15.16.1 Company Snapshot
15.16.2 Company Overview
15.16.3 Financial Analysis
15.16.3.1 Net Revenue, 2017-2022
15.16.3.2 Regional Market Shares, 2022
15.16.3.3 Segment Market Shares, 2022
15.16.4 Product Benchmarking
15.16.5 Strategic Outlook
15.17 Sonatest Ltd.
15.17.1 Company Snapshot
15.17.2 Company Overview
15.17.3 Product Benchmarking
15.17.4 Strategic Outlook
15.18 T.D. Williamson, Inc.
15.18.1 Company Snapshot
15.18.2 Company Overview
15.18.3 Product Benchmarking
15.18.4 Strategic Outlook
16 Conclusion and Recommendations
16.1 Concluding Remarks from Visiongain
16.2 Recommendations for Market Players
List of Tables
Table 1. Non-Destructive Testing (NDT) Market Snapshot, 2023 & 2033 (US$ Million, CAGR %)
Table 2. Non-Destructive Testing (NDT) Market Forecast by Region, 2023-2033 (US$ Million, AGR%, CAGR%): “V” Shaped Recovery
Table 3. Non-Destructive Testing (NDT) Market Forecast by Region, 2023-2033 (US$ Million, AGR%, CAGR%): “U” Shaped Recovery
Table 4. Non-Destructive Testing (NDT) Market Forecast by Region, 2023-2033 (US$ Million, AGR%, CAGR%): “W” Shaped Recovery
Table 5. Non-Destructive Testing (NDT) Market Forecast by Region, 2023-2033 (US$ Million, AGR%, CAGR%): “L” Shaped Recovery
Table 6. Non-Destructive Testing (NDT) Market Forecast by Flaw Type, 2023-2033 (US$ Million, AGR%, CAGR%)
Table 7. Surface Cracks & Flaws Market Forecast by Region, 2023-2033 (US$ Million, AGR%, CAGR%)
Table 8. Internal Flaws & Discontinuities Segment Market Forecast by Region, 2023-2033 (US$ Million, AGR%, CAGR%)
Table 9. Lack of Bond or Lack of Fusion Market Forecast by Region, 2023-2033 (US$ Million, AGR%, CAGR%)
Table 10. Non-Metallic Inclusions (Slag, Porosity) Segment Market Forecast by Region, 2023-2033 (US$ Million, AGR%, CAGR%)
Table 11. Material Quality Market Forecast by Region, 2023-2033 (US$ Million, AGR%, CAGR%)
Table 12. Laminations & Thickness Measurement Segment Market Forecast by Region, 2023-2033 (US$ Million, AGR%, CAGR%)
Table 13. Non-Destructive Testing (NDT) Market Forecast by Material, 2023-2033 (US$ Million, AGR%, CAGR%)
Table 14. Ferrous Forgings & Stampings Segment Market Forecast by Region, 2023-2033 (US$ Million, AGR%, CAGR%)
Table 15. Ferrous Raw Materials & Rolled Products Segment Market Forecast by Region, 2023-2033 (US$ Million, AGR%, CAGR%)
Table 16. Ferrous Tube & Pipe Segment Market Forecast by Region, 2023-2033 (US$ Million, AGR%, CAGR%)
Table 17. Iron & Steel Castings Segment Market Forecast by Region, 2023-2033 (US$ Million, AGR%, CAGR%)
Table 18. Non-Ferrous Components & Materials Segment Market Forecast by Region, 2023-2033 (US$ Million, AGR%, CAGR%)
Table 19. Non-Destructive Testing (NDT) Market Forecast by Technique, 2023-2033 (US$ Million, AGR%, CAGR%)
Table 20. Ultrasonic Testing Segment Market Forecast by Region, 2023-2033 (US$ Million, AGR%, CAGR%)
Table 21. Visual Testing Segment Market Forecast by Region, 2023-2033 (US$ Million, AGR%, CAGR%)
Table 22. Radiographic Testing Segment Market Forecast by Region, 2023-2033 (US$ Million, AGR%, CAGR%)
Table 23. Liquid Penetrant Testing Segment Market Forecast by Region, 2023-2033 (US$ Million, AGR%, CAGR%)
Table 24. Eddy-Current Testing Segment Market Forecast by Region, 2023-2033 (US$ Million, AGR%, CAGR%)
Table 25. Magnetic Particle Testing Segment Market Forecast by Region, 2023-2033 (US$ Million, AGR%, CAGR%)
Table 26. Non-Destructive Testing (NDT) Market Forecast by Application, 2023-2033 (US$ Million, AGR%, CAGR%)
Table 27. Automotive & Railway Industry Segment Market Forecast by Region, 2023-2033 (US$ Million, AGR%, CAGR%)
Table 28. Aerospace Industry Segment Market Forecast by Region, 2023-2033 (US$ Million, AGR%, CAGR%)
Table 29. Petrochemical & Gas Industries Segment Market Forecast by Region, 2023-2033 (US$ Million, AGR%, CAGR%)
Table 30. Pipe & Tube Manufacturing Industry Segment Market Forecast by Region, 2023-2033 (US$ Million, AGR%, CAGR%)
Table 31. Shipbuilding Industry Segment Market Forecast by Region, 2023-2033 (US$ Million, AGR%, CAGR%)
Table 32. Non-Ferrous Components & Materials Segment Market Forecast by Region, 2023-2033 (US$ Million, AGR%, CAGR%)
Table 33. Non-Destructive Testing (NDT) Market Forecast by End Use, 2023-2033 (US$ Million, AGR%, CAGR%)
Table 34. Designing Segment Market Forecast by Region, 2023-2033 (US$ Million, AGR%, CAGR%)
Table 35. Manufacturing Quality Segment Market Forecast by Region, 2023-2033 (US$ Million, AGR%, CAGR%)
Table 36. In-service Inspection Segment Market Forecast by Region, 2023-2033 (US$ Million, AGR%, CAGR%)
Table 37. Plant Life Extension Segment Market Forecast by Region, 2023-2033 (US$ Million, AGR%, CAGR%)
Table 38. Other End-Use Segment Market Forecast by Region, 2023-2033 (US$ Million, AGR%, CAGR%)
Table 39. Non-Destructive Testing (NDT) Market Forecast by Region, 2023-2033 (US$ Million, AGR%, CAGR%)
Table 40. North America Non-Destructive Testing (NDT) Market Forecast by Country, 2023-2033 (US$ Million, AGR%, CAGR%)
Table 41. North America Non-Destructive Testing (NDT) Market Forecast by Flaw Type, 2023-2033 (US$ Million, AGR%, CAGR%)
Table 42. North America Non-Destructive Testing (NDT) Market Forecast by Material, 2023-2033 (US$ Million, AGR%, CAGR%)
Table 43. North America Non-Destructive Testing (NDT) Market Forecast by Technique, 2023-2033 (US$ Million, AGR%, CAGR%)
Table 44. North America Non-Destructive Testing (NDT) Market Forecast by Application, 2023-2033 (US$ Million, AGR%, CAGR%)
Table 45. North America Non-Destructive Testing (NDT) Market Forecast by End Use, 2023-2033 (US$ Million, AGR%, CAGR%)
Table 46. U.S. Non-Destructive Testing (NDT) Market Forecast, 2023-2033 (US$ Million, AGR%, CAGR%)
Table 47. Canada Non-Destructive Testing (NDT) Market Forecast, 2023-2033 (US$ Million, AGR%, CAGR%)
Table 48. Europe Non-Destructive Testing (NDT) Market Forecast by Country, 2023-2033 (US$ Million, AGR%, CAGR%)
Table 49. Europe Non-Destructive Testing (NDT) Market Forecast by Flaw Type, 2023-2033 (US$ Million, AGR%, CAGR%)
Table 50. Europe Non-Destructive Testing (NDT) Market Forecast by Material, 2023-2033 (US$ Million, AGR%, CAGR%)
Table 51. Europe Non-Destructive Testing (NDT) Market Forecast by Technique, 2023-2033 (US$ Million, AGR%, CAGR%)
Table 52. Europe Non-Destructive Testing (NDT) Market Forecast by Application, 2023-2033 (US$ Million, AGR%, CAGR%)
Table 53. Europe Non-Destructive Testing (NDT) Market Forecast by End Use, 2023-2033 (US$ Million, AGR%, CAGR%)
Table 54. Germany Non-Destructive Testing (NDT) Market Forecast, 2023-2033 (US$ Million, AGR%, CAGR%)
Table 55. France Non-Destructive Testing (NDT) Market Forecast, 2023-2033 (US$ Million, AGR%, CAGR%)
Table 56. UK Non-Destructive Testing (NDT) Market Forecast, 2023-2033 (US$ Million, AGR%, CAGR%)
Table 57. Italy Non-Destructive Testing (NDT) Market Forecast, 2023-2033 (US$ Million, AGR%, CAGR%)
Table 58. Spain Non-Destructive Testing (NDT) Market Forecast, 2023-2033 (US$ Million, AGR%, CAGR%)
Table 59. Rest of Europe Non-Destructive Testing (NDT) Market Forecast, 2023-2033 (US$ Million, AGR%, CAGR%)
Table 60. Asia Pacific Non-Destructive Testing (NDT) Market Forecast by Country, 2023-2033 (US$ Million, AGR%, CAGR%)
Table 61. Asia Pacific Non-Destructive Testing (NDT) Market Forecast by Flaw Type, 2023-2033 (US$ Million, AGR%, CAGR%)
Table 62. Asia Pacific Non-Destructive Testing (NDT) Market Forecast by Material, 2023-2033 (US$ Million, AGR%, CAGR%)
Table 63. North America Non-Destructive Testing (NDT) Market Forecast by Technique, 2023-2033 (US$ Million, AGR%, CAGR%)
Table 64. Asia Pacific Non-Destructive Testing (NDT) Market Forecast by Application, 2023-2033 (US$ Million, AGR%, CAGR%)
Table 65. Asia Pacific Non-Destructive Testing (NDT) Market Forecast by End Use, 2023-2033 (US$ Million, AGR%, CAGR%)
Table 66. China Non-Destructive Testing (NDT) Market Forecast, 2023-2033 (US$ Million, AGR%, CAGR%)
Table 67. Japan Non-Destructive Testing (NDT) Market Forecast, 2023-2033 (US$ Million, AGR%, CAGR%)
Table 68. India Non-Destructive Testing (NDT) Market Forecast, 2023-2033 (US$ Million, AGR%, CAGR%)
Table 69. Australia Non-Destructive Testing (NDT) Market Forecast, 2023-2033 (US$ Million, AGR%, CAGR%)
Table 70. South Korea Non-Destructive Testing (NDT) Market Forecast, 2023-2033 (US$ Million, AGR%, CAGR%)
Table 71. Rest of Asia Pacific Non-Destructive Testing (NDT) Market Forecast, 2023-2033 (US$ Million, AGR%, CAGR%)
Table 72. Latin America Non-Destructive Testing (NDT) Market Forecast by Country, 2023-2033 (US$ Million, AGR%, CAGR%)
Table 73. Latin America Non-Destructive Testing (NDT) Market Forecast by Flaw Type, 2023-2033 (US$ Million, AGR%, CAGR%)
Table 74. Latin America Non-Destructive Testing (NDT) Market Forecast by Material, 2023-2033 (US$ Million, AGR%, CAGR%)
Table 75. Latin America Non-Destructive Testing (NDT) Market Forecast by Technique, 2023-2033 (US$ Million, AGR%, CAGR%)
Table 76. Latin America Non-Destructive Testing (NDT) Market Forecast by Application, 2023-2033 (US$ Million, AGR%, CAGR%)
Table 77. Latin America Non-Destructive Testing (NDT) Market Forecast by End Use, 2023-2033 (US$ Million, AGR%, CAGR%)
Table 78. Brazil Non-Destructive Testing (NDT) Market Forecast, 2023-2033 (US$ Million, AGR%, CAGR%)
Table 79. Mexico Non-Destructive Testing (NDT) Market Forecast, 2023-2033 (US$ Million, AGR%, CAGR%)
Table 80. Rest of Latin America Non-Destructive Testing (NDT) Market Forecast, 2023-2033 (US$ Million, AGR%, CAGR%)
Table 81. MEA Non-Destructive Testing (NDT) Market Forecast by Country, 2023-2033 (US$ Million, AGR%, CAGR%)
Table 82. MEA Non-Destructive Testing (NDT) Market Forecast by Flaw Type, 2023-2033 (US$ Million, AGR%, CAGR%)
Table 83. MEA Non-Destructive Testing (NDT) Market Forecast by Material, 2023-2033 (US$ Million, AGR%, CAGR%)
Table 84. MEA Non-Destructive Testing (NDT) Market Forecast by Technique, 2023-2033 (US$ Million, AGR%, CAGR%)
Table 85. MEA Non-Destructive Testing (NDT) Market Forecast by Application, 2023-2033 (US$ Million, AGR%, CAGR%)
Table 86. MEA Non-Destructive Testing (NDT) Market Forecast by End Use, 2023-2033 (US$ Million, AGR%, CAGR%)
Table 87. GCC Non-Destructive Testing (NDT) Market Forecast, 2023-2033 (US$ Million, AGR%, CAGR%)
Table 88. South Africa Non-Destructive Testing (NDT) Market Forecast, 2023-2033 (US$ Million, AGR%, CAGR%)
Table 89. Rest of MEA Non-Destructive Testing (NDT) Market Forecast, 2023-2033 (US$ Million, AGR%, CAGR%)
Table 90. Strategic Outlook
Table 91. Acuren Inspection Inc.: Key Details, (CEO, HQ, Founded, No. of Employees, Company Type, Website, Business Segment)
Table 92. Acuren Inspection Inc.: Product Benchmarking
Table 93. Acuren Inspection Inc.: Strategic Outlook
Table 94. Anritsu Corporation: Key Details, (CEO, HQ, Revenue, Founded, Company Type, Website, Business Segment)
Table 95. Anritsu Corporation: Product Benchmarking
Table 96. Anritsu Corporation: Strategic Outlook
Table 97. Ashtead Technology, Inc.: Key Details, (CEO, HQ, Revenue, Founded, No. of Employees, Company Type, Website, Business Segment)
Table 98. Ashtead Technology, Inc.: Product Benchmarking
Table 99. Ashtead Technology, Inc.: Strategic Outlook
Table 100. Eddyfi Technology: Key Details, (CEO, HQ, Revenue, Founded, No. of Employees, Company Type, Website, Business Segment)
Table 101. Eddyfi Technology: Product Benchmarking
Table 102. Eddyfi Technology: Strategic Outlook
Table 103. Fischer Technology Inc.: Key Details, (CEO, HQ, Revenue, Founded, No. of Employees, Company Type, Website, Business Segment)
Table 104. Fischer Technology Inc.: Product Benchmarking
Table 105. Fischer Technology Inc.: Strategic Outlook
Table 106. FPrimeC Solutions Inc.: Key Details, (CEO, HQ, Founded, No. of Employees, Company Type, Website, Business Segment)
Table 107. FPrimeC Solutions Inc.: Product Benchmarking
Table 108. Fujifilm Holding Corporation: Key Details, (CEO, HQ, Revenue, Founded, No. of Employees, Company Type, Website, Business Segment)
Table 109. Fujifilm Holding Corporation: Product Benchmarking
Table 110. Fujifilm Holding Corporation: Strategic Outlook
Table 111. GE Measurement & Control: Key Details, (CEO, HQ, Revenue, Founded, No. of Employees, Company Type, Website, Business Segment)
Table 112. GE Measurement & Control: Product Benchmarking
Table 113. GE Measurement & Control: Strategic Outlook
Table 114. Intertek Group PLC: Key Details, (CEO, HQ, Revenue, Founded, No. of Employees, Company Type, Website, Business Segment)
Table 115. Intertek Group PLC: Product Benchmarking
Table 116. Intertek Group PLC: Strategic Outlook
Table 117. Magnaflux Corporation: Key Details, (CEO, HQ, Founded, No. of Employees, Company Type, Website, Business Segment)
Table 118. Magnaflux Corporation: Product Benchmarking
Table 119. Magnaflux Corporation: Strategic Outlook
Table 120. Mistras Group: Key Details, (CEO, HQ, Revenue, Founded, No. of Employees, Company Type, Website, Business Segment)
Table 121. Mistras Group: Product Benchmarking
Table 122. Mistras Group: Strategic Outlook
Table 123. Nikon Corporation: Key Details, (CEO, HQ, Revenue, Founded, No. of Employees, Company Type, Website, Business Segment)
Table 124. Nikon Corporation: Product Benchmarking
Table 125. Nikon Corporation: Strategic Outlook
Table 126. Olympus Corporation: Key Details, (CEO, HQ, Revenue, Founded, No. of Employees, Company Type, Website, Business Segment)
Table 127. Olympus Corporation: Product Benchmarking
Table 128. Olympus Corporation: Strategic Outlook
Table 129. SGS SA: Key Details, (CEO, HQ, Revenue, Founded, No. of Employees, Company Type, Website, Business Segment)
Table 130. SGS SA: Product Benchmarking
Table 131. SGS SA: Strategic Outlook
Table 132. Sonatest Ltd.: Key Details, (CEO, HQ, Founded, No. of Employees, Company Type, Website, Business Segment)
Table 133. Sonatest Ltd.: Product Benchmarking
Table 134. Sonatest Ltd.: Strategic Outlook
Table 135. T.D. Williamson, Inc.: Key Details, (CEO, HQ, Founded, No. of Employees, Company Type, Website, Business Segment)
Table 136. T.D. Williamson, Inc.: Product Benchmarking
Table 137. T.D. Williamson, Inc.: Strategic Outlook
List of Figures
Figure 1 Non-Destructive Testing (NDT) Market Segmentation
Figure 2 Non-Destructive Testing (NDT) Market by Flaw Type: Market Attractiveness Index
Figure 3 Non-Destructive Testing (NDT) Market by Material: Market Attractiveness Index
Figure 4 Non-Destructive Testing (NDT) Market by Technique: Market Attractiveness Index
Figure 5 Non-Destructive Testing (NDT) Market by Material: Market Attractiveness Index
Figure 6 Non-Destructive Testing (NDT) Market by End Use: Market Attractiveness Index
Figure 7 Non-Destructive Testing (NDT) Market Attractiveness Index by Region
Figure 8 Non-Destructive Testing (NDT) Market: Market Dynamics
Figure 9 Non-Destructive Testing (NDT) Market by Region, 2023-2033 (US$ Million, AGR %): “V” Shaped Recovery
Figure 10 Non-Destructive Testing (NDT) Market by Region, 2023-2033 (US$ Million, AGR %): “U” Shaped Recovery
Figure 11 Non-Destructive Testing (NDT) Market by Region, 2023-2033 (US$ Million, AGR %): “W” Shaped Recovery
Figure 12 Non-Destructive Testing (NDT) Market by Region, 2023-2033 (US$ Million, AGR %): “L” Shaped Recovery
Figure 13 Non-Destructive Testing (NDT) Market: Porter’s Five Forces Analysis
Figure 14 Non-Destructive Testing (NDT) Market: PEST Analysis
Figure 15 Non-Destructive Testing (NDT) Market by Flaw Type: Market Attractiveness Index
Figure 16 Non-Destructive Testing (NDT) Market Forecast by Flaw Type, 2023-2033 (US$ Million, AGR %)
Figure 17 Non-Destructive Testing (NDT) Market Share Forecast by Flaw Type, 2023, 2028, 2033 (%)
Figure 18 Surface Cracks & Flaws Segment Market Forecast by Region, 2023-2033 (US$ Million, AGR %)
Figure 19 Surface Cracks & Flaws Segment Market Share Forecast by Region, 2023 & 2033 (%)
Figure 20 Internal Flaws & Discontinuities Segment Market Forecast by Region, 2023-2033 (US$ Million, AGR %)
Figure 21 Internal Flaws & Discontinuities Segment Market Share Forecast by Region, 2023 & 2033 (%)
Figure 22 Lack of Bond or Lack of Fusion Segment Market Forecast by Region, 2023-2033 (US$ Million, AGR %)
Figure 23 Lack of Bond or Lack of Fusion Segment Market Share Forecast by Region, 2023 & 2033 (%)
Figure 24 Non-Metallic Inclusions (Slag, Porosity) Segment Market Forecast by Region, 2023-2033 (US$ Million, AGR %)
Figure 25 Non-Metallic Inclusions (Slag, Porosity) Segment Market Share Forecast by Region, 2023 & 2033 (%)
Figure 26 Material Quality Segment Market Forecast by Region, 2023-2033 (US$ Million, AGR %)
Figure 27 Material Quality Segment Market Share Forecast by Region, 2023 & 2033 (%)
Figure 28 Laminations & Thickness Measurement Segment Market Forecast by Region, 2023-2033 (US$ Million, AGR %)
Figure 29 Laminations & Thickness Measurement Segment Market Share Forecast by Region, 2023 & 2033 (%)
Figure 30 Non-Destructive Testing (NDT) Market by Material: Market Attractiveness Index
Figure 31 Non-Destructive Testing (NDT) Market Forecast by Material, 2023-2033 (US$ Million, AGR %)
Figure 32 Non-Destructive Testing (NDT) Market Share Forecast by Material, 2023, 2028, 2033 (%)
Figure 33 Ferrous Forgings & Stampings Segment Market Forecast by Region, 2023-2033 (US$ Million, AGR %)
Figure 34 Ferrous Forgings & Stampings Segment Market Share Forecast by Region, 2023 & 2033 (%)
Figure 35 Ferrous Raw Materials & Rolled Products Segment Market Forecast by Region, 2023-2033 (US$ Million, AGR %)
Figure 36 Ferrous Raw Materials & Rolled Products Segment Market Share Forecast by Region, 2023 & 2033 (%)
Figure 37 Ferrous Tube & Pipe Segment Market Forecast by Region, 2023-2033 (US$ Million, AGR %)
Figure 38 Ferrous Tube & Pipe Segment Market Share Forecast by Region, 2023 & 2033 (%)
Figure 39 Iron & Steel Castings Segment Market Forecast by Region, 2023-2033 (US$ Million, AGR %)
Figure 40 Iron & Steel Castings Segment Market Share Forecast by Region, 2023 & 2033 (%)
Figure 41 Non-Ferrous Components & Materials Segment Market Forecast by Region, 2023-2033 (US$ Million, AGR %)
Figure 42 Non-Ferrous Components & Materials Segment Market Share Forecast by Region, 2023 & 2033 (%)
Figure 43 Non-Destructive Testing (NDT) Market by Technique: Market Attractiveness Index
Figure 44 Non-Destructive Testing (NDT) Market Forecast by Technique, 2023-2033 (US$ Million, AGR %)
Figure 45 Non-Destructive Testing (NDT) Market Share Forecast by Technique, 2023, 2028, 2033 (%)
Figure 46 Ultrasonic Testing Segment Market Forecast by Region, 2023-2033 (US$ Million, AGR %)
Figure 47 Ultrasonic Testing Segment Market Share Forecast by Region, 2023 & 2033 (%)
Figure 48 Visual Testing Segment Market Forecast by Region, 2023-2033 (US$ Million, AGR %)
Figure 49 Visual Testing Segment Market Share Forecast by Region, 2023 & 2033 (%)
Figure 50 Radiographic Testing Segment Market Forecast by Region, 2023-2033 (US$ Million, AGR %)
Figure 51 Radiographic Testing Segment Market Share Forecast by Region, 2023 & 2033 (%)
Figure 52 Liquid Penetrant Testing Segment Market Forecast by Region, 2023-2033 (US$ Million, AGR %)
Figure 53 Liquid Penetrant Testing Segment Market Share Forecast by Region, 2023 & 2033 (%)
Figure 54 Eddy-Current Testing Segment Market Forecast by Region, 2023-2033 (US$ Million, AGR %)
Figure 55 Eddy-Current Testing Segment Market Share Forecast by Region, 2023 & 2033 (%)
Figure 56 Magnetic Particle Testing Segment Market Forecast by Region, 2023-2033 (US$ Million, AGR %)
Figure 57 Magnetic Particle Testing Segment Market Share Forecast by Region, 2023 & 2033 (%)
Figure 58 Non-Destructive Testing (NDT) Market by Application: Market Attractiveness Index
Figure 59 Non-Destructive Testing (NDT) Market Forecast by Application, 2023-2033 (US$ Million, AGR %)
Figure 60 Non-Destructive Testing (NDT) Market Share Forecast by Application, 2023, 2028, 2033 (%)
Figure 61 Automotive & Railway Industry Segment Market Forecast by Region, 2023-2033 (US$ Million, AGR %)
Figure 62 Automotive & Railway Industry Segment Market Share Forecast by Region, 2023 & 2033 (%)
Figure 63 Aerospace Industry Segment Market Forecast by Region, 2023-2033 (US$ Million, AGR %)
Figure 64 Aerospace Industry Segment Market Share Forecast by Region, 2023 & 2033 (%)
Figure 65 Petrochemical & Gas Industries Segment Market Forecast by Region, 2023-2033 (US$ Million, AGR %)
Figure 66 Petrochemical & Gas Industries Segment Market Share Forecast by Region, 2023 & 2033 (%)
Figure 67 Pipe & Tube Manufacturing Industry Segment Market Forecast by Region, 2023-2033 (US$ Million, AGR %)
Figure 68 Pipe & Tube Manufacturing Industry Segment Market Share Forecast by Region, 2023 & 2033 (%)
Figure 69 Shipbuilding Industry Segment Market Forecast by Region, 2023-2033 (US$ Million, AGR %)
Figure 70 Shipbuilding Industry Segment Market Share Forecast by Region, 2023 & 2033 (%)
Figure 71 Non-Ferrous Components & Materials Segment Market Forecast by Region, 2023-2033 (US$ Million, AGR %)
Figure 72 Non-Ferrous Components & Materials Segment Market Share Forecast by Region, 2023 & 2033 (%)
Figure 73 Non-Destructive Testing (NDT) Market by End Use: Market Attractiveness Index
Figure 74 Non-Destructive Testing (NDT) Market Forecast by End Use, 2023-2033 (US$ Million, AGR %)
Figure 75 Non-Destructive Testing (NDT) Market Share Forecast by Material, 2023, 2028, 2033 (%)
Figure 76 Designing Segment Market Forecast by Region, 2023-2033 (US$ Million, AGR %)
Figure 77 Designing Segment Market Share Forecast by Region, 2023 & 2033 (%)
Figure 78 Manufacturing Quality Segment Market Forecast by Region, 2023-2033 (US$ Million, AGR %)
Figure 79 Manufacturing Quality Segment Market Share Forecast by Region, 2023 & 2033 (%)
Figure 80 In-service Inspection Segment Market Forecast by Region, 2023-2033 (US$ Million, AGR %)
Figure 81 In-service Inspection Segment Market Share Forecast by Region, 2023 & 2033 (%)
Figure 82 Plant Life Extension Segment Market Forecast by Region, 2023-2033 (US$ Million, AGR %)
Figure 83 Plant Life Extension Segment Market Share Forecast by Region, 2023 & 2033 (%)
Figure 84 Other End-Use Segment Market Forecast by Region, 2023-2033 (US$ Million, AGR %)
Figure 85 Other End-Use Segment Market Share Forecast by Region, 2023 & 2033 (%)
Figure 86 Non-Destructive Testing (NDT) Market Forecast by Region 2023 and 2033 (Revenue, CAGR%)
Figure 87 Non-Destructive Testing (NDT)Market Share Forecast by Region 2023, 2028, 2033 (%)
Figure 88 Non-Destructive Testing (NDT) Market by Region, 2023-2033 (US$ Million, AGR %)
Figure 89 North America Non-Destructive Testing (NDT) Market Attractiveness Index
Figure 90 North America Non-Destructive Testing (NDT) Market by Region, 2023, 2028 & 2033 (US$ Million)
Figure 91 North America Non-Destructive Testing (NDT) Market Forecast by Country, 2023-2033 (US$ Million, AGR %)
Figure 92 North America Non-Destructive Testing (NDT) Market Share Forecast by Country, 2023 & 2033 (%)
Figure 93 North America Non-Destructive Testing (NDT) Market Forecast by Flaw Type, 2023-2033 (US$ Million, AGR %)
Figure 94 North America Non-Destructive Testing (NDT) Market Share Forecast by Flaw Type, 2023 & 2033 (%)
Figure 95 North America Non-Destructive Testing (NDT) Market Forecast by Material, 2023-2033 (US$ Million, AGR %)
Figure 96 North America Non-Destructive Testing (NDT) Market Share Forecast by Material, 2023 & 2033 (%)
Figure 97 North America Non-Destructive Testing (NDT) Market Forecast by Technique, 2023-2033 (US$ Million, AGR %)
Figure 98 North America Non-Destructive Testing (NDT) Market Share Forecast by Technique, 2023 & 2033 (%)
Figure 99 North America Non-Destructive Testing (NDT) Market Forecast by Application, 2023-2033 (US$ Million, AGR %)
Figure 100 North America Non-Destructive Testing (NDT) Market Share Forecast by Application, 2023 & 2033 (%)
Figure 101 North America Non-Destructive Testing (NDT) Market Forecast by End Use, 2023-2033 (US$ Million, AGR %)
Figure 102 North America Non-Destructive Testing (NDT) Market Share Forecast by End Use, 2023 & 2033 (%)
Figure 103 U.S. Non-Destructive Testing (NDT) Market Forecast, 2023-2033 (US$ Million, AGR %)
Figure 104 Canada Non-Destructive Testing (NDT) Market Forecast, 2023-2033 (US$ Million, AGR %)
Figure 105 Europe Non-Destructive Testing (NDT) Market Attractiveness Index
Figure 106 Europe Non-Destructive Testing (NDT) Market by Region, 2023, 2028 & 2033 (US$ Million)
Figure 107 Europe Non-Destructive Testing (NDT) Market Forecast by Country, 2023-2033 (US$ Million, AGR %)
Figure 108 Europe Non-Destructive Testing (NDT) Market Share Forecast by Country, 2023 & 2033 (%)
Figure 109 Europe Non-Destructive Testing (NDT) Market Forecast by Flaw Type, 2023-2033 (US$ Million, AGR %)
Figure 110 Europe Non-Destructive Testing (NDT) Market Share Forecast by Flaw Type, 2023 & 2033 (%)
Figure 111 Europe Non-Destructive Testing (NDT) Market Forecast by Material, 2023-2033 (US$ Million, AGR %)
Figure 112 Europe Non-Destructive Testing (NDT) Market Share Forecast by Material, 2023 & 2033 (%)
Figure 113 Europe Non-Destructive Testing (NDT) Market Forecast by Technique, 2023-2033 (US$ Million, AGR %)
Figure 114 Europe Non-Destructive Testing (NDT) Market Share Forecast by Technique, 2023 & 2033 (%)
Figure 115 Europe Non-Destructive Testing (NDT) Market Forecast by Application, 2023-2033 (US$ Million, AGR %)
Figure 116 Europe Non-Destructive Testing (NDT) Market Share Forecast by Application, 2023 & 2033 (%)
Figure 117 Europe Non-Destructive Testing (NDT) Market Forecast by End Use, 2023-2033 (US$ Million, AGR %)
Figure 118 Europe Non-Destructive Testing (NDT) Market Share Forecast by End Use, 2023 & 2033 (%)
Figure 119 Germany Non-Destructive Testing (NDT) Market Forecast, 2023-2033 (US$ Million, AGR %)
Figure 120 France Non-Destructive Testing (NDT) Market Forecast, 2023-2033 (US$ Million, AGR %)
Figure 121 UK Non-Destructive Testing (NDT) Market Forecast, 2023-2033 (US$ Million, AGR %)
Figure 122 Italy Non-Destructive Testing (NDT) Market Forecast, 2023-2033 (US$ Million, AGR %)
Figure 123 Spain Non-Destructive Testing (NDT) Market Forecast, 2023-2033 (US$ Million, AGR %)
Figure 124 Rest of Europe Non-Destructive Testing (NDT) Market Forecast, 2023-2033 (US$ Million, AGR %)
Figure 125 Asia Pacific Non-Destructive Testing (NDT) Market Attractiveness Index
Figure 126 Asia Pacific Non-Destructive Testing (NDT) Market by Region, 2023, 2028 & 2033 (US$ Million)
Figure 127 Asia Pacific Non-Destructive Testing (NDT) Market Forecast by Country, 2023-2033 (US$ Million, AGR %)
Figure 128 Asia Pacific Non-Destructive Testing (NDT) Market Share Forecast by Country, 2023 & 2033 (%)
Figure 129 Asia Pacific Non-Destructive Testing (NDT) Market Forecast by Flaw Type, 2023-2033 (US$ Million, AGR %)
Figure 130 Asia Pacific Non-Destructive Testing (NDT) Market Share Forecast by Flaw Type, 2023 & 2033 (%)
Figure 131 Asia Pacific Non-Destructive Testing (NDT) Market Forecast by Material, 2023-2033 (US$ Million, AGR %)
Figure 132 Asia Pacific Non-Destructive Testing (NDT) Market Share Forecast by Material, 2023 & 2033 (%)
Figure 133 Asia Pacific Non-Destructive Testing (NDT) Market Forecast by Technique, 2023-2033 (US$ Million, AGR %)
Figure 134 Asia Pacific Non-Destructive Testing (NDT) Market Share Forecast by Technique, 2023 & 2033 (%)
Figure 135 Asia Pacific Non-Destructive Testing (NDT) Market Forecast by Application, 2023-2033 (US$ Million, AGR %)
Figure 136 Asia Pacific Non-Destructive Testing (NDT) Market Share Forecast by Application, 2023 & 2033 (%)
Figure 137 Asia Pacific Non-Destructive Testing (NDT) Market Forecast by End Use, 2023-2033 (US$ Million, AGR %)
Figure 138 Asia Pacific Non-Destructive Testing (NDT) Market Share Forecast by End Use, 2023 & 2033 (%)
Figure 139 China Non-Destructive Testing (NDT) Market Forecast, 2023-2033 (US$ Million, AGR %)
Figure 140 Japan Non-Destructive Testing (NDT) Market Forecast, 2023-2033 (US$ Million, AGR %)
Figure 141 India Non-Destructive Testing (NDT) Market Forecast, 2023-2033 (US$ Million, AGR %)
Figure 142 Australia Non-Destructive Testing (NDT) Market Forecast, 2023-2033 (US$ Million, AGR %)
Figure 143 South Korea Non-Destructive Testing (NDT) Market Forecast, 2023-2033 (US$ Million, AGR %)
Figure 144 Rest of Asia Pacific Non-Destructive Testing (NDT) Market Forecast, 2023-2033 (US$ Million, AGR %)
Figure 145 Latin America Non-Destructive Testing (NDT) Market Attractiveness Index
Figure 146 Latin America Non-Destructive Testing (NDT) Market by Region, 2023, 2028 & 2033 (US$ Million)
Figure 147 Latin America Non-Destructive Testing (NDT) Market Forecast by Country, 2023-2033 (US$ Million, AGR %)
Figure 148 Latin America Non-Destructive Testing (NDT) Market Share Forecast by Country, 2023 & 2033 (%)
Figure 149 Latin America Non-Destructive Testing (NDT) Market Forecast by Flaw Type, 2023-2033 (US$ Million, AGR %)
Figure 150 Latin America Non-Destructive Testing (NDT) Market Share Forecast by Flaw Type, 2023 & 2033 (%)
Figure 151 Latin America Non-Destructive Testing (NDT) Market Forecast by Material, 2023-2033 (US$ Million, AGR %)
Figure 152 Latin America Non-Destructive Testing (NDT) Market Share Forecast by Material, 2023 & 2033 (%)
Figure 153 Latin America Non-Destructive Testing (NDT) Market Forecast by Technique, 2023-2033 (US$ Million, AGR %)
Figure 154 Latin America Non-Destructive Testing (NDT) Market Share Forecast by Technique, 2023 & 2033 (%)
Figure 155 Latin America Non-Destructive Testing (NDT) Market Forecast by Application, 2023-2033 (US$ Million, AGR %)
Figure 156 Latin America Non-Destructive Testing (NDT) Market Share Forecast by Application, 2023 & 2033 (%)
Figure 157 Latin America Non-Destructive Testing (NDT) Market Forecast by End Use, 2023-2033 (US$ Million, AGR %)
Figure 158 Latin America Non-Destructive Testing (NDT) Market Share Forecast by End Use, 2023 & 2033 (%)
Figure 159 Brazil Non-Destructive Testing (NDT) Market Forecast, 2023-2033 (US$ Million, AGR %)
Figure 160 Mexico Non-Destructive Testing (NDT) Market Forecast, 2023-2033 (US$ Million, AGR %)
Figure 161 Rest of Latin America Non-Destructive Testing (NDT) Market Forecast, 2023-2033 (US$ Million, AGR %)
Figure 162 MEA Non-Destructive Testing (NDT) Market Attractiveness Index
Figure 163 MEA Non-Destructive Testing (NDT) Market by Region, 2023, 2028 & 2033 (US$ Million)
Figure 164 MEA Non-Destructive Testing (NDT) Market Forecast by Country, 2023-2033 (US$ Million, AGR %)
Figure 165 MEA Non-Destructive Testing (NDT) Market Share Forecast by Country, 2023 & 2033 (%)
Figure 166 MEA Non-Destructive Testing (NDT) Market Forecast by Flaw Type, 2023-2033 (US$ Million, AGR %)
Figure 167 MEA Non-Destructive Testing (NDT) Market Share Forecast by Flaw Type, 2023 & 2033 (%)
Figure 168 MEA Non-Destructive Testing (NDT) Market Forecast by Material, 2023-2033 (US$ Million, AGR %)
Figure 169 MEA Non-Destructive Testing (NDT) Market Share Forecast by Material, 2023 & 2033 (%)
Figure 170 MEA Non-Destructive Testing (NDT) Market Forecast by Technique, 2023-2033 (US$ Million, AGR %)
Figure 171 MEA Non-Destructive Testing (NDT) Market Share Forecast by Technique, 2023 & 2033 (%)
Figure 172 MEA Non-Destructive Testing (NDT) Market Forecast by Application, 2023-2033 (US$ Million, AGR %)
Figure 173 MEA Non-Destructive Testing (NDT) Market Share Forecast by Application, 2023 & 2033 (%)
Figure 174 MEA Non-Destructive Testing (NDT) Market Forecast by End Use, 2023-2033 (US$ Million, AGR %)
Figure 175 MEA Non-Destructive Testing (NDT) Market Share Forecast by End Use, 2023 & 2033 (%)
Figure 176 GCC Non-Destructive Testing (NDT) Market Forecast, 2023-2033 (US$ Million, AGR %)
Figure 177 South Africa Non-Destructive Testing (NDT) Market Forecast, 2023-2033 (US$ Million, AGR %)
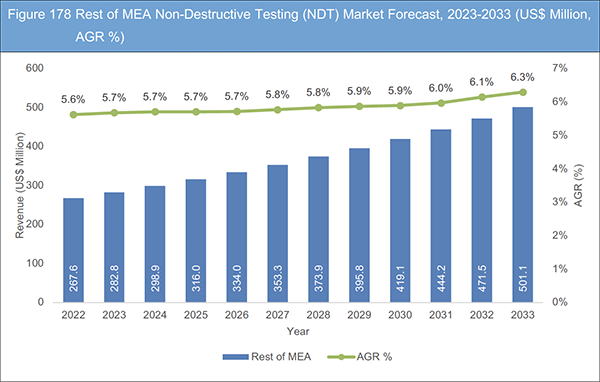
Figure 178 Rest of MEA Non-Destructive Testing (NDT) Market Forecast, 2023-2033 (US$ Million, AGR %)
Figure 179 Non-Destructive Testing (NDT) Market: Company Share/Ranking, 2022
Figure 180 Anritsu Corporation: Net Revenue, 2017-2021 (US$ Million, AGR%)
Figure 181 Anritsu Corporation: R&D, 2017-2021 (US$ Million, AGR%)
Figure 182 Anritsu Corporation: Regional Market Shares, 2021
Figure 183 Anritsu Corporation: Segment Market Shares, 2021
Figure 184 Ashtead Technology, Inc.: Net Revenue, 2017-2022 (US$ Million, AGR%)
Figure 185 Ashtead Technology, Inc.: Regional Market Shares, 2022
Figure 186 Fujifilm Holding Corporation: Net Revenue, 2017-2022 (US$ Million, AGR%)
Figure 187 Fujifilm Holding Corporation: R&D, 2017-2021 (US$ Million, AGR%)
Figure 188 Fujifilm Holding Corporation: Regional Market Shares, 2021
Figure 189 Fujifilm Holding Corporation: Segment Market Shares, 2021
Figure 190 GE Measurement & Control: Net Revenue, 2017-2022 (US$ Million, AGR%)
Figure 191 GE Measurement & Control: R&D, 2017-2022 (US$ Million, AGR%)
Figure 192 GE Measurement & Control: Regional Market Shares, 2022
Figure 193 GE Measurement & Control: Segment Market Shares, 2022
Figure 194 Intertek Group PLC: Net Revenue, 2017-2022 (US$ Million, AGR%)
Figure 195 Intertek Group PLC: Regional Market Shares, 2022
Figure 196 Intertek Group PLC: Segment Market Shares, 2022
Figure 197 Mistras Group: Net Revenue, 2017-2022 (US$ Million, AGR%)
Figure 198 Mistras Group: R&D, 2017-2022 (US$ Million, AGR%)
Figure 199 Mistras Group: Regional Market Shares, 2022
Figure 200 Mistras Group: Segment Market Shares, 2022
Figure 201 Nikon Corporation: Net Revenue, 2017-2022 (US$ Million, AGR%)
Figure 202 Nikon Corporation: Regional Market Shares, 2022
Figure 203 Nikon Corporation: Segment Market Shares, 2022
Figure 204 Olympus Corporation: Net Revenue, 2017-2022 (US$ Million, AGR%)
Figure 205 Olympus Corporation: Regional Market Shares, 2022
Figure 206 Olympus Corporation: Segment Market Shares, 2022
Figure 207 SGS SA: Net Revenue, 2017-2022 (US$ Million, AGR%)
Figure 208 SGS SA: Regional Market Shares, 2022
Figure 209 SGS SA: Segment Market Shares, 2022
List of Companies Profiled in the Report
Acuren
Anritsu Corporation
Ashtead Technology, Inc.
Eddyfi Technology
Fischer Technology Inc.
FPrimeC Solutions Inc.
Fujifilm Holding Corporation
GE Measurement
Intertek Group PLC
Magnaflux Corporation
Mistras group
Nikon Corporation
Olympus Corporation
SGS SA
Sonatest Ltd.
T.D. Williamson, Inc
List of Other Companies Mentioned in the Report
Apave Group
Applus RTD UK Ltd.
Bureau Veritas UK Ltd.
Elsyca NV
Hyundai Engineering & Construction Co., Ltd.
IGM Group
Larsen & Toubro Limited (L&T)
M2M
NDT Corporation Fuji Electric Co., Ltd.
NIKON Metrology Japan
Rohmann GmbH
RPS Group Plc
Shimadzu Corporation
Structural Monitoring Systems Plc
Taihei Boeki Co., Ltd.
Tecnatom Group
Tecnatom Group
TUV Rheinland AG
YXLON International
Zetec Inc.
List of Associations Mentioned in the Report
Aerospace Industries Association (AIA)
American Petroleum Institute (API)
American Society for Non-destructive Testing (ASNT)
American Society of Mechanical Engineers (ASME)
American Welding Society (AWS)
Canadian Society for Non-destructive Testing (CSNDT)
China Machinery Industry Federation (CMIF)
China Mechanical Engineering Society (CMES)
Chinese Society for Non-Destructive Testing (CSNDT)
Engineering Integrity Society (EIS)
French Association of Energy Engineers (AFEC)
French Association of Mechanical Engineering (AFM)
French Nuclear Safety Authority (ASN)
German Welding Society (DVS)
International Pipeline and Offshore Contractors Association (IPLOCA)
Japanese Society of Material Science (JSMS)
National Association of Testing Authorities, USA (NATA)
National Energy Board (NEB)
Non-Destructive Testing and Structural Health Monitoring (AEND)
Spanish Association of Aeronautics and Space Technologists (AETE)
Spanish Welding Association (CESOL)
Technical Inspection Association (TÜV)
 Market Report 2023-2033")