Industries > Packaging > Top 30 Glass Packaging Companies 2020
Top 30 Glass Packaging Companies 2020
Market Share Analysis, Financials & Key Strategies and Achievements Details for the Leading Glass Packaging Companies Including, Owens-Illinois, Asahi Glass Co., Ltd., Ardagh Group, Verallia SA, Vidrala SA, BA Glass BV, Gerresheimer AG, Vetropack Holding Ltd, Stölzle Glass Group, Wiegand Glass GmbH and More
How this 196-page report will inform you:
• View extensive profiles of the leading 30 companies in the glass packaging market to keep your knowledge ahead of your competition and ensure you exploit key business opportunities
• The report provides detailed sales of the market and the commercial drivers and restraints, allowing you to more effectively compete in the market. Our study shows current market data, market shares, original analysis and insight into commercial developments
• The report provides 248 tables, charts, and graphs
• Let our analysts present you with a thorough assessment of the current glass packaging market. This analysis will achieve quicker, easier understanding. Also, you will gain from our analyst’s industry expertise allowing you to demonstrate your authority on the glass packaging sector.
• Discover sales for the top 30 glass packaging companies
• What are the prospects for the top 30 glass packaging companies? How is the market evolving? Which company generates the most revenue? Use our study and expert insight to grow your business and give you more industry influence. Stay informed about the potential for each of these glass packaging market with individual analysis 2019
• Explore the factors affecting top companies, and learn about the forces influencing market dynamics
• Explore the strengths, weaknesses, opportunities and threats (SWOT) affecting the industry. Discover what the present and future outlook for business will be. Learn about the following business critical issues
• Identify who are the leading 30 companies in the glass packaging industry
• Our report reveals the companies which hold the greatest potential. In particular, exploring and analyzing the activities of these companies: See where the expected gains will be. Our work explains that potential, helping you stay ahead. Gain a thorough understanding of the competitive landscape with profiles of 30 leading glass packaging companies examining their positioning, capabilities product portfolios, services, focus, strategies, M&A activity, and future outlook.
Discover information found nowhere else in this independent assessment of the top 30 glass packaging companies
Top 30 Glass Packaging Companies report provides impartial glass packaging sector analysis. With the independent business intelligence found only in our work, you will discover where the prospects are for profit. In particular, our new research provides you with key strategic advantages: independent and objective analysis and revealing company profiles will provide you with that necessary edge, allowing you to gain ground over your competitors.
With this report you are less likely to fall behind in knowledge or miss crucial business opportunities. You will save time and receive recognition for your market insight. See how you this report could benefit and enhance your research, analysis, company presentations and ultimately your individual business decisions and your company’s prospects.
What makes this report unique?
Visiongain’s research methodology involves an exclusive blend of primary and secondary sources providing informed analysis. This methodology allows insight into the key drivers and restraints behind market dynamics and competitive developments. The report therefore presents a comprehensive analysis of the top 30 glass packaging companies including revenue, market share, products, services and outlook.
Why choose Visiongain business intelligence?
Visiongain’s increasingly diverse sector coverage strengthens our research portfolio. The growing cross-sector convergence of key verticals and the interplay of game changing technologies across hitherto unrelated industries are creating new synergies, resulting in new business opportunities for you to leverage.
Buy our report today Top 30 Glass Packaging Companies 2020: Market Share Analysis, Financials & Key Strategies and Achievements Details for the Leading Glass Packaging Companies Including, Owens-Illinois, Asahi Glass Co., Ltd., Ardagh Group, Verallia SA, Vidrala SA, BA Glass BV, Gerresheimer AG, Vetropack Holding Ltd, Stölzle Glass Group, Wiegand Glass GmbH and More. Avoid missing out by staying informed – order our report now.
Visiongain is a trading partner with the US Federal Government
CCR Ref number: KD4R6
Do you have any custom requirements we can help you with? Any need for specific country, geo region, market segment or specific company information? Contact us today, we can discuss your needs and see how we can help: sara.peerun@visiongain.com
1 Report Overview
1.1 Global Glass Packaging Market Overview
1.2 Global Glass Packaging Market Segmentation
1.3 Why You Should Read This Report
1.4 How This Report Delivers
1.5 Key Questions Answered by This Analytical Report Include:
1.6 Who is This Report For?
1.7 Methodology
1.7.1 Secondary Research
1.7.2 Market Evaluation & Forecasting Methodology
1.8 Frequently Asked Questions (FAQ)
1.9 Associated Visiongain Reports
1.10 About Visiongain
2 Introduction To Glass Packaging
2.1 What is glass packaging?
2.2 Types of glass packaging
2.3 Major end-user industries of glass packaging
2.4 Benefits of using glass packaging
2.5 Properties of glass packaging
2.6 Raw Materials
3 Competitor Positioning In The Glass Packaging Market
3.1 Top 30 Glass Packaging Company Share Analysis 2018
3.2 Composition of the Glass Packaging Market
3.2.1 Glass Packaging Market Composition Overview
3.2.2 Positioning of Top 30 Glass Packaging Companies
4 Market Overview
4.1 Market Definition and Scope
4.2 Porter’s Five Forces analysis
4.2.1 Porter’s analysis
4.3 Market Dynamics
4.3.1 Drivers
4.3.2 Restraints
4.3.3 Opportunities
5 Top 30 Glass Packaging Companies
5.1 Owens-Illinois
5.1.1 Owens-Illinois Key Developments 2014-2019
5.1.2 Owens-Illinois Sales 2015-2018
5.1.3 Owens-Illinois Net Income 2015-2018
5.1.4 Owens-Illinois Organisational Structure
5.1.5 Owens-Illinois Glass Packaging Market Products / Services
5.1.6 Owens-Illinois Primary Market Competitors 2019
5.1.7 Owens-Illinois Overview
5.1.8 Owens-Illinois Key Financial Ratios
5.1.9 Owens-IllinoisFinancial Outlook
5.1.10 Owens-Illinois SWOT Analysis
5.2 Ardagh Group
5.2.1 Ardagh Group Key Developments 2014-2019
5.2.2 Ardagh Group Sales 2015-2018
5.2.3 Ardagh Group Net Income 2015-2018
5.2.4 Ardagh Group Organisational Structure
5.2.5 Ardagh Group Glass Packaging Market Products / Services
5.2.6 Ardagh Group Primary Market Competitors 2019
5.2.7 Ardagh Group Overview
5.2.8 Ardagh Group Key Financial Ratios
5.2.9 Ardagh Group Financial Outlook
5.2.10 Ardagh Group SWOT Analysis
5.3 Şişecam Group
5.3.1 Şişecam Group Key Developments 2014-2019
5.3.2 Şişecam Group Sales 2015-2018
5.3.3 Şişecam Group Net Income 2015-2018
5.3.4 Şişecam Group Organisational Structure
5.3.5 Şişecam Group Glass Packaging Market Products / Services
5.3.6 Şişecam Group Primary Market Competitors 2019
5.3.7 Şişecam Group Overview
5.3.8 Şişecam Group Key Financial Ratios
5.3.9 Şişecam Group Financial Outlook
5.3.10 Şişecam Group SWOT Analysis
5.4 Asahi Glass Co., Ltd.
5.4.1 Asahi Glass Co., Ltd. Key Developments 2014-2019
5.4.2 Asahi Glass Co., Ltd. Sales 2015-2018
5.4.3 Asahi Glass Co., Ltd. Net Income 2015-2018
5.4.4 Asahi Glass Co., Ltd. Organisational Structure
5.4.5 Asahi Glass Co., Ltd. Glass Packaging Market Products / Services
5.4.6 Asahi Glass Co., Ltd. Primary Market Competitors 2019
5.4.7 Asahi Glass Co., Ltd. Overview
5.4.8 Asahi Glass Co., Ltd. Key Financial Ratios
5.4.9 Asahi Glass Co., Ltd. Financial Outlook
5.4.10 Asahi Glass Co., Ltd. SWOT Analysis
5.5 BA Glass BV
5.5.1 BA Glass BV Key Developments 2014-2019
5.5.2 BA Glass BV Sales 2015-2018
5.5.3 BA Glass BV Net Income 2015-2018
5.5.4 BA Glass BV Organisational Structure
5.5.5 BA Glass BV Glass Packaging Market Products / Services
5.5.6 BA Glass BV Primary Market Competitors 2019
5.5.7 BA Glass BV Overview
5.5.8 BA Glass BV Key Financial Ratios
5.5.9 BA Glass BV Financial Outlook
5.5.10 BA Glass BV SWOT Analysis
5.6 Bormioli Rocco SpA
5.6.1 Bormioli Rocco SpA Key Developments 2014-2019
5.6.2 Bormioli Rocco SpA Organisational Structure
5.6.3 Bormioli Rocco SpA Glass Packaging Market Products / Services
5.6.4 Bormioli Rocco SpA Primary Market Competitors 2019
5.6.5 Bormioli Rocco SpA Overview
5.6.6 Bormioli Rocco SpA SWOT Analysis
5.7 Gallo Glass Company
5.7.1 Gallo Glass Company Organisational Structure
5.7.2 Gallo Glass Company Glass Packaging Market Products / Services
5.7.3 Gallo Glass Company Primary Market Competitors 2019
5.7.4 Gallo Glass Company Overview
5.7.5 Gallo Glass Company SWOT Analysis
5.8 Gerresheimer AG
5.8.1 Gerresheimer AG Key Developments 2014-2019
5.8.2 Gerresheimer AG Sales 2015-2018
5.8.3 Gerresheimer AG Net Income 2015-2018
5.8.4 Gerresheimer AG Organisational Structure
5.8.5 Gerresheimer AG Glass Packaging Market Products/Services
5.8.6 Gerresheimer AG Primary Market Competitors 2019
5.8.7 Gerresheimer AG Overview
5.8.8 Gerresheimer AG Key Financial Ratios
5.8.9 Gerresheimer AG Financial Outlook
5.8.10 Gerresheimer AG SWOT Analysis
5.9 HEINZ-GLAS GmbH & Co. KGaA
5.9.1 HEINZ-GLAS GmbH & Co. KGaA Key Developments 2014-2019
5.9.2 HEINZ-GLAS GmbH & Co. KGaA Organisational Structure
5.9.3 HEINZ-GLAS GmbH & Co. KGaA Glass Packaging Market Products/Services
5.9.4 HEINZ-GLAS GmbH & Co. KGaA Primary Market Competitors 2019
5.9.5 HEINZ-GLAS GmbH & Co. KGaA Overview
5.9.6 HEINZ-GLAS GmbH & Co. KGaA SWOT Analysis
5.10 Hindustan National Glass Industries Ltd.
5.10.1 Hindustan National Glass Industries Ltd. Key Developments 2014-2019
5.10.2 Hindustan National Glass Industries Ltd. Sales 2015-2018
5.10.3 Hindustan National Glass Industries Ltd. Net Income 2015-2018
5.10.4 Hindustan National Glass Industries Ltd. Organisational Structure
5.10.5 Hindustan National Glass Industries Ltd. Glass Packaging Market Products/Services
5.10.6 Hindustan National Glass Industries Ltd. Primary Market Competitors 2019
5.10.7 Hindustan National Glass Industries Ltd. Overview
5.10.8 Hindustan National Glass Industries Ltd. Key Financial Ratios
5.10.9 Hindustan National Glass Industries Ltd. Financial Outlook
5.10.10 Hindustan National Glass Industries Ltd. SWOT Analysis
5.11 Koa Glass Co. Ltd.
5.11.1 Koa Glass Co. Ltd. Organisational Structure
5.11.2 Koa Glass Co. Ltd. Glass Packaging Market Products/Services
5.11.3 Koa Glass Co. Ltd. Primary Market Competitors 2019
5.11.4 Koa Glass Co. Ltd. Overview
5.11.5 Koa Glass Co. Ltd. SWOT Analysis
5.12 Nihon Yamamura Glass Co. Ltd.
5.12.1 Nihon Yamamura Glass Co. Ltd. Key Developments 2014-2019
5.12.2 Nihon Yamamura Glass Co. Ltd. Sales 2015-2018
5.12.3 Nihon Yamamura Glass Co. Ltd. Net Income 2015-2018
5.12.4 Nihon Yamamura Glass Co. Ltd. Organisational Structure
5.12.5 Nihon Yamamura Glass Co. Ltd. Glass Packaging Market Products/Services
5.12.6 Nihon Yamamura Glass Co. Ltd. Primary Market Competitors 2019
5.12.7 Nihon Yamamura Glass Co. Ltd. Overview
5.12.8 Nihon Yamamura Glass Co. Ltd. Key Financial Ratios
5.12.9 Nihon Yamamura Glass Co. Ltd. Financial Outlook
5.12.10 Nihon Yamamura Glass Co. Ltd. SWOT Analysis
5.13 Orora Packaging Pty. Ltd.
5.13.1 Orora Packaging Pty. Ltd. Key Developments 2014-2019
5.13.2 Orora Packaging Pty. Ltd. Sales 2015-2018
5.13.3 Orora Packaging Pty. Ltd. Net Income 2015-2018
5.13.4 Orora Packaging Pty. Ltd. Organisational Structure
5.13.5 Orora Packaging Pty. Ltd. Glass Packaging Market Products/Services
5.13.6 Orora Packaging Pty. Ltd. Primary Market Competitors 2019
5.13.7 Orora Packaging Pty. Ltd. Overview
5.13.8 Orora Packaging Pty. Ltd. Key Financial Ratios
5.13.9 Orora Packaging Pty. Ltd. Financial Outlook
5.13.10 Orora Packaging Pty. Ltd. SWOT Analysis
5.14 Piramal Glass Private Ltd
5.14.1 Piramal Glass Private Ltd Key Developments 2014-2019
5.14.2 Piramal Glass Private Ltd Organisational Structure
5.14.3 Piramal Glass Private Ltd Glass Packaging Market Products/Services
Piramal Glass Private Ltd Primary Market Competitors 2019
5.14.4 Piramal Glass Private Ltd Overview
5.14.5 Piramal Glass Private Ltd SWOT Analysis
5.15 Groupe Pochet
5.15.1 Groupe Pochet Organisational Structure
5.15.2 Groupe Pochet Glass Packaging Market Products/Services
5.15.3 Groupe Pochet Primary Market Competitors 2019
5.15.4 Groupe Pochet Overview
5.15.5 Groupe Pochet SWOT Analysis
5.16 SaverGlass Inc.
5.16.1 SaverGlass Inc. Key Developments 2014-2019
5.16.2 SaverGlass Inc. Organisational Structure
5.16.3 SaverGlass Inc. Glass Packaging Market Products/Services
5.16.4 SaverGlass Inc. Primary Market Competitors 2019
5.16.5 SaverGlass Inc. Overview
5.16.6 SaverGlass Inc. SWOT Analysis
5.17 SGD S.A.
5.17.1 SGD S.A. Key Developments 2014-2019
5.17.2 SGD S.A. Organisational Structure
5.17.3 SGD S.A. Glass Packaging Market Products/Services
5.17.4 SGD S.A. Primary Market Competitors 2019
5.17.5 SGD S.A. Overview
5.17.6 SGD S.A. SWOT Analysis
5.18 Stölzle Glass Group
5.18.1 Stölzle Glass Group Key Developments 2014-2019
5.18.2 Stölzle Glass Group Organisational Structure
5.18.3 Stölzle Glass Group Glass Packaging Market Products/Services
5.18.4 Stölzle Glass Group Primary Market Competitors 2019
5.18.5 Stölzle Glass Group Overview
5.18.6 Stölzle Glass Group SWOT Analysis
5.19 Verallia SA
5.19.1 Verallia SA Key Developments 2014-2019
5.19.2 Verallia SA Sales 2015-2018
5.19.3 Verallia SA Net Income 2015-2018
5.19.4 Verallia SA Organisational Structure
5.19.5 Verallia SA Glass Packaging Market Products/Services
5.19.6 Verallia SA Primary Market Competitors 2019
5.19.7 Verallia SA Overview
5.19.8 Verallia SA Key Financial Ratios
5.19.9 Verallia SA Financial Outlook
5.19.10 Verallia SA SWOT Analysis
5.20 Vetropack Holding Ltd
5.20.1 Vetropack Holding Ltd Key Developments 2014-2019
5.20.2 Vetropack Holding Ltd Sales 2015-2018
5.20.3 Vetropack Holding Ltd Net Income 2015-2018
5.20.4 Vetropack Holding Ltd Organisational Structure
5.20.5 Vetropack Holding Ltd Glass Packaging Market Products/Services
5.20.6 Vetropack Holding Ltd Primary Market Competitors 2019
5.20.7 Vetropack Holding Ltd Overview
5.20.8 Vetropack Holding Ltd Key Financial Ratios
5.20.9 Vetropack Holding Ltd Financial Outlook
5.20.10 Vetropack Holding Ltd SWOT Analysis
5.21 Vidrala SA
5.21.1 Vidrala SA Key Developments 2014-2019
5.21.2 Vidrala SA Sales 2015-2018
5.21.3 Vidrala SA Net Income 2015-2018
5.21.4 Vidrala SA Organisational Structure
5.21.5 Vidrala SA Glass Packaging Market Products/Services
5.21.6 Vidrala SA Primary Market Competitors 2019
5.21.7 Vidrala SA Overview
5.21.8 Vidrala SA Key Financial Ratios
5.21.9 Vidrala SA Financial Outlook
5.21.10 Vidrala SA SWOT Analysis
5.22 Vitro, S.A.B de C.V.
5.22.1 Vitro, S.A.B de C.V. Key Developments 2014-2019
5.22.2 Vitro, S.A.B de C.V. Sales 2015-2018
5.22.3 Vitro, S.A.B de C.V. Net Income 2015-2018
5.22.4 Vitro, S.A.B de C.V. Organisational Structure
5.22.5 Vitro, S.A.B de C.V. Glass Packaging Market Products/Services
5.22.6 Vitro, S.A.B de C.V. Primary Market Competitors 2019
5.22.7 Vitro, S.A.B de C.V. Overview
5.22.8 Vitro, S.A.B de C.V. Key Financial Ratios
5.22.9 Vitro, S.A.B de C.V. Financial Outlook
5.22.10 Vitro, S.A.B de C.V. SWOT Analysis
5.23 Wiegand Glass GmbH
5.23.1 Wiegand Glass GmbH Key Developments 2014-2019
5.23.2 Wiegand Glass GmbH Organisational Structure
5.23.3 Wiegand Glass GmbH Glass Packaging Market Products/Services
5.23.4 Wiegand Glass GmbH Primary Market Competitors 2019
5.23.5 Wiegand Glass GmbH Overview
5.23.6 Wiegand Glass GmbH SWOT Analysis
5.24 Zignago Vetro
5.24.1 Zignago Vetro Key Developments 2014-2019
5.24.2 Zignago Vetro Sales 2015-2018
5.24.3 Zignago Vetro Net Income 2015-2018
5.24.4 Zignago Vetro Organisational Structure
5.24.5 Zignago Vetro Glass Packaging Market Products/Services
5.24.6 Zignago Vetro Primary Market Competitors 2019
5.24.7 Zignago Vetro Overview
5.24.8 Zignago Vetro Key Financial Ratios
5.24.9 Zignago Vetro Financial Outlook
5.24.10 Zignago Vetro SWOT Analysis
5.25 Allied Glass Containers Ltd
5.25.1 Allied Glass Containers Ltd Key Developments 2014-2019
5.25.2 Allied Glass Containers Ltd Organisational Structure
5.25.3 Allied Glass Containers Ltd Glass Packaging Market Products/Services
5.25.4 Allied Glass Containers Ltd Primary Market Competitors 2019
5.25.5 Allied Glass Containers Ltd Overview
5.25.6 Allied Glass Containers Ltd SWOT Analysis
5.26 Toyo Glass Co., Ltd.
5.26.1 Toyo Glass Co., Ltd. Organisational Structure
5.26.2 Toyo Glass Co., Ltd. Glass Packaging Market Products/Services
5.26.3 Toyo Glass Co., Ltd. Primary Market Competitors 2019
5.26.4 Toyo Glass Co., Ltd. Overview
5.26.5 Toyo Glass Co., Ltd. SWOT Analysis
5.27 Haldyn Glass Limited
5.27.1 Haldyn Glass Ltd Sales 2015-2018
5.27.2 Haldyn Glass Ltd Net Income 2015-2018
5.27.3 Haldyn Glass Limited Organisational Structure
5.27.4 Haldyn Glass Limited Glass Packaging Market Products/Services
5.27.5 Haldyn Glass Limited Primary Market Competitors 2019
5.27.6 Haldyn Glass Limited Overview
5.27.7 Haldyn Glass Limited Key Financial Ratios
5.27.8 Haldyn Glass Limited Financial Outlook
5.27.9 Haldyn Glass Limited SWOT Analysis
5.28 Consol Glass Ltd
5.28.1 Consol Glass Ltd Key Developments 2014-2019
5.28.2 Consol Glass Ltd Organisational Structure
5.28.3 Consol Glass Ltd Glass Packaging Market Products/Services
5.28.4 Consol Glass Ltd Primary Market Competitors 2019
5.28.5 Consol Glass Ltd Overview
5.28.6 Consol Glass Ltd SWOT Analysis
5.29 Takemoto Yohki Co Ltd
5.29.1 Takemoto Yohki Co Ltd Key Developments 2014-2019
5.29.2 Takemoto Yohki Co Ltd Organisational Structure
5.29.3 Takemoto Yohki Co Ltd Glass Packaging Market Products/Services
5.29.4 Takemoto Yohki Co Ltd Primary Market Competitors 2019
5.29.5 Takemoto Yohki Co Ltd Overview
5.29.6 Takemoto Yohki Co Ltd SWOT Analysis
5.30 Carib Glassworks Limited
5.30.1 Carib Glassworks Limited Organisational Structure
5.30.2 Carib Glassworks Limited Glass Packaging Market Products/Services
5.30.3 Carib Glassworks Limited Primary Market Competitors 2019
5.30.4 Carib Glassworks Limited Overview
5.30.5 Carib Glassworks Limited SWOT Analysis
6 SWOT Analysis Of The Glass Packaging Market
6.1 Strengths
6.1.1 Chemical Properties
6.1.2 Sustainability
6.1.3 Premium Image
6.2 Weaknesses
6.2.1 Competition
6.2.2 Weight
6.3 Opportunities
6.3.1 Innovation
6.3.2 Demand for eco-friendly packaging materials
6.3.3 Threats
6.3.4 Growing Popularity of Flexible Packaging
6.3.5 Environmental Impacts
7 Conclusion
8 Glossary
8.1.1 Associated Visiongain Reports
8.1.2 Visiongain Report Sales Order Form
Appendix A
About Visiongain
Appendix B
Visiongain report evaluation form
LIST OF TABLES
Table 3.1 Top 30 Player Positioning in 2019
Table 5.1 Owens-Illinois Profile 2018 (Glass Packaging Market Ranking, Glass Packaging Market Share %, CEO, Parent Company Sales US$m, Sales in the Market US$m, Share of Company Sales from the Market %, Business Segment in the Market, HQ, Founded, No. of Employees, Website)
Table 5.2 Selected Recent Owens-Illinois Glass Packaging Market Developments 2014-2019 (Date, Strategy, Details)
Table 5.3 Owens-Illinois Sales 2015-2018 (US$m, AGR %)
Table 5.4 Owens-Illinois Net Income 2015-2018 (US$m, AGR %)
Table 5.5 Owens-Illinois Glass Packaging Market Products / Services (Product, Specification / Features)
Table 5.6 Owens-Illinois: Key Financial Ratios, 2018
Table 5.7 Owens-Illinois SWOT Analysis 2019
Table 5.8 Ardagh Group Profile 2018 (Glass Packaging Market Ranking, Glass Packaging Market Share %, CEO, Parent Company Sales US$m, Sales in the Market US$m, Share of Company Sales from the Market %, Business Segment in the Market, HQ, Founded, No. of Employees, Website)
Table 5.9 Recent Ardagh Group Glass Packaging Market Developments 2014-2019 (Date, Strategy, Details)
Table 5.10 Ardagh Group Sales 2015-2018 (US$m, AGR %)
Table 5.11 Ardagh Group Net Income 2015-2018 (US$m, AGR %)
Table 5.12 Ardagh Group Glass Packaging Market Products / Services (Product, Specification / Features)
Table 5.13 Ardagh Group: Key Financial Ratios, 2018
Table 5.14 Ardagh Group SWOT Analysis 2019
Table 5.15 Şişecam Group Profile 2018 (Glass Packaging Market Ranking, Glass Packaging Market Share %, CEO, Parent Company Sales US$m, Sales in the Market US$m, Share of Company Sales from the Market %, Business Segment in the Market, HQ, Founded, No. of Employees, Website)
Table 5.16 Şişecam Group Glass Packaging Market Developments 2014-2019 (Date, Strategy, Details)
Table 5.17 Şişecam Group Sales 2015-2018 (US$m, AGR %)
Table 5.18 Şişecam Group Net Income 2015-2018 (US$m, AGR %)
Table 5.19 Şişecam Group Glass Packaging Market Products / Services (Product, Specification / Features)
Table 5.20 Şişecam Group: Key Financial Ratios, 2018
Table 5.21 Şişecam Group SWOT Analysis 2019
Table 5.22 Asahi Glass Co., Ltd. Profile 2018 (Glass Packaging Market Ranking, Glass Packaging Market Share %, CEO, Parent Company Sales US$b, Sales in the Market US$b, Share of Company Sales from the Market %, Business Segment in the Market, HQ, Founded, No. of Employees, Website)
Table 5.23 Selected Recent Asahi Glass Co., Ltd. Glass Packaging Market Developments 2014-2019 (Date, Strategy, Details)
Table 5.24 Asahi Glass Co., Ltd. Sales 2015-2018 (US$ b, AGR %)
Table 5.25Asahi Glass Co., Ltd. Net Income 2015-2018 (US$m, AGR %)
Table 5.26 Asahi Glass Co., Ltd. Glass Packaging Market Products / Services (Product, Specification / Features)
Table 5.27Asahi Glass Co., Ltd.: Key Financial Ratios, 2018
Table 5.28 Asahi Glass Co., Ltd. SWOT Analysis 2019
Table 5.29 BA Glass BV Profile 2018 (Glass Packaging Market Ranking, Glass Packaging Market Share %, CEO, Parent Company Sales US$m, Sales in the Market US$m, Share of Company Sales from the Market %, Business Segment in the Market, HQ, Founded, No. of Employees, Website)
Table 5.30 Recent Developments BA Glass BVGlass Packaging Market 2014-2019 (Date, Strategy, Details)
Table 5.31 BA Glass BV Sales 2015-2018 (US$ b, AGR %)
Table 5.32 BA Glass BV Net Income 2015-2018 (US$m, AGR %)
Table 5.33 BA Glass BV Glass Packaging Market Products / Services (Product, Specification / Features)
Table 5.34 BA Glass BV: Key Financial Ratios, 2018
Table 5.35 BA Glass BVSWOT Analysis 2019
Table 5.36 Bormioli Rocco SpA Profile 2018 (Glass Packaging Market Ranking, Glass Packaging Market Share %, CEO, Parent Company Sales US$m, Sales in the Market US$m, Share of Company Sales from the Market %, Business Segment in the Market, HQ, Founded, No. of Employees, Website)
Table 5.37 Selected Recent Bormioli Rocco SpAGlass Packaging Market Developments 2014-2019 (Date, Strategy, Details)
Table 5.38 Bormioli Rocco SpA Glass Packaging Market Products / Services (Product, Specification / Features)
Table 5.39Bormioli Rocco SpASWOT Analysis 2019
Table 5.40 Gallo Glass Company Profile 2018 (Glass Packaging Market Ranking, Glass Packaging Market Share %, CEO, Parent Company Sales US$m, Sales in the Market US$m, Share of Company Sales from the Market %, Business Segment in the Market, HQ, Founded, No. of Employees, Website)
Table 5.41 Gallo Glass Company Glass Packaging Market Products / Services (Product, Specification / Features)
Table 5.42 Gallo Glass Company SWOT Analysis 2019
Table 5.43 Gerresheimer AG Profile 2018 (Glass Packaging Market Ranking, Glass Packaging Market Share %, CEO, Parent Company Sales US$m, Sales in the Market US$m, Share of Company Sales from the Market %, Business Segment in the Market, HQ, Founded, No. of Employees, Website)
Table 5.44 Gerresheimer AG Glass Packaging Market Developments 2014-2019 (Date, Strategy, Details)
Table 5.45 Gerresheimer AG Sales 2015-2018 (US$ m, AGR %)
Table 5.46 Gerresheimer AG Net Income 2015-2018 (US$m, AGR %)
Table 5.47 Gerresheimer AG Glass Packaging Market Products / Services (Product, Specification / Features)
Table 5.48 Gerresheimer AG: Key Financial Ratios, 2018
Table 5.49 Gerresheimer AGSWOT Analysis 2019
Table 5.50 HEINZ-GLAS GmbH & Co. KGaA Profile 2018 (Glass Packaging Market Ranking, Glass Packaging Market Share %, CEO, Parent Company Sales US$m, Sales in the Market US$m, Share of Company Sales from the Market %, Business Segment in the Market, HQ, Founded, No. of Employees, Website)
Table 5.51 HEINZ-GLAS GmbH & Co. KGaA Glass Packaging Market Developments 2014-2019 (Date, Strategy, Details)
Table 5.52 HEINZ-GLAS GmbH & Co. KGaA Glass Packaging Market Products / Services (Product, Specification / Features)
Table 5.53 HEINZ-GLAS GmbH & Co. KGaA SWOT Analysis 2019
Table 5.54 Hindustan National Glass Industries Ltd. Profile 2018 (Glass Packaging Market Ranking, Glass Packaging Market Share %, CEO, Parent Company Sales US$m, Sales in the Market US$m, Share of Company Sales from the Market %, Business Segment in the Market, HQ, Founded, No. of Employees, Website)
Table 5.55 Hindustan National Glass Industries Ltd. Glass Packaging Market Developments 2014-2019 (Date, Strategy, Details)
Table 5.56 Hindustan National Glass Industries Ltd. Sales 2015-2018 (US$ m, AGR %)
Table 5.57 Hindustan National Glass Industries Ltd. Net Income 2015-2018 (US$m, AGR %)
Table 5.58 Hindustan National Glass Industries Ltd. Glass Packaging Market Products / Services (Product, Specification / Features)
Table 5.59 Hindustan National Glass Industries Ltd.: Key Financial Ratios, 2018
Table 5.60 Hindustan National Glass Industries Ltd. SWOT Analysis 2019
Table 5.61 Koa Glass Co. Ltd. Profile 2018 (Glass Packaging Market Ranking, Glass Packaging Market Share %, CEO, Parent Company Sales US$m, Sales in the Market US$m, Share of Company Sales from the Market %, Business Segment in the Market, HQ, Founded, No. of Employees, Website)
Table 5.62 Koa Glass Co. Ltd.Glass Packaging Market Products / Services (Product, Specification / Features)
Table 5.63 Koa Glass Co. Ltd. SWOT Analysis 2019
Table 5.64 Nihon Yamamura Glass Co. Ltd. Profile 2018 (Glass Packaging Market Ranking, Glass Packaging Market Share %, CEO, Parent Company Sales US$m, Sales in the Market US$m, Share of Company Sales from the Market %, Business Segment in the Market, HQ, Founded, No. of Employees, Website)
Table 5.65 Nihon Yamamura Glass Co. Ltd. Glass Packaging Market Developments 2014-2019 (Date, Strategy, Details)
Table 5.66 Nihon Yamamura Glass Co. Ltd. Sales 2015-2018 (US$ m, AGR %)
Table 5.67 Nihon Yamamura Glass Co. Ltd. Net Income 2015-2018 (US$m, AGR %)
Table 5.68 Nihon Yamamura Glass Co. Ltd. Glass Packaging Market Products / Services (Product, Specification / Features)
Table 5.69 Nihon Yamamura Glass Co. Ltd.: Key Financial Ratios, 2018
Table 5.70 Nihon Yamamura Glass Co. Ltd. SWOT Analysis 2019
Table 5.71 Orora Packaging Pty. Ltd. Profile 2018 (Glass Packaging Market Ranking, Glass Packaging Market Share %, CEO, Parent Company Sales US$m, Sales in the Market US$m, Share of Company Sales from the Market %, Business Segment in the Market, HQ, Founded, No. of Employees, Website)
Table 5.72 Orora Packaging Pty. Ltd. Glass Packaging Market Developments 2014-2019 (Date, Strategy, Details)
Table 5.73 Orora Packaging Pty. Ltd. Sales 2015-2018 (US$ m, AGR %)
Table 5.74 Orora Packaging Pty. Ltd. Net Income 2015-2018 (US$m, AGR %)
Table 5.74 Orora Packaging Pty. Ltd. Glass Packaging Market Products / Services (Product, Specification / Features)
Table 5.75 Orora Packaging Pty. Ltd.: Key Financial Ratios, 2018
Table 5.76 Orora Packaging Pty. Ltd. SWOT Analysis 2019
Table 5.77 Piramal Glass Private Ltd Profile 2018 (Glass Packaging Market Ranking, Glass Packaging Market Share %, CEO, Parent Company Sales US$m, Sales in the Market US$ m, Share of Company Sales from the Market %, Business Segment in the Market, HQ, Founded, No. of Employees, Website)
Table 5.78 Piramal Glass Private Ltd Glass Packaging Market Developments 2014-2019 (Date, Strategy, Details)
Table 5.79 Piramal Glass Private Ltd Glass Packaging Market Products / Services (Product, Specification / Features)
Table 5.80 Piramal Glass Private Ltd SWOT Analysis 2019
Table 5.81 Groupe Pochet Profile 2018 (Glass Packaging Market Ranking, Glass Packaging Market Share %, CEO, Parent Company Sales US$m, Sales in the Market US$ m, Share of Company Sales from the Market %, Business Segment in the Market, HQ, Founded, No. of Employees, Website)
Table 5.82 Groupe Pochet Glass Packaging Market Products / Services (Product, Specification / Features)
Table 5.83 Groupe Pochet SWOT Analysis 2019
Table 5.84 SaverGlass Inc. Profile 2018 (Glass Packaging Market Ranking, Glass Packaging Market Share %, CEO, Parent Company Sales US$m, Sales in the Market US$ m, Share of Company Sales from the Market %, Business Segment in the Market, HQ, Founded, No. of Employees, Website)
Table 5.85 SaverGlass Inc. Glass Packaging Market Developments 2014-2019 (Date, Strategy, Details)
Table 5.86 SaverGlass Inc.Glass Packaging Market Products / Services (Product, Specification / Features)
Table 5.87 SaverGlass Inc. SWOT Analysis 2019
Table 5.88 SGD S.A. Profile 2018 (Glass Packaging Market Ranking, Glass Packaging Market Share %, CEO, Parent Company Sales US$m, Sales in the Market US$ m, Share of Company Sales from the Market %, Business Segment in the Market, HQ, Founded, No. of Employees, Website)
Table 5.89 SGD S.A. Glass Packaging Market Developments 2014-2019 (Date, Strategy, Details)
Table 5.90 SGD S.A. Glass Packaging Market Products / Services (Product, Specification / Features)
Table 5.91 SGD S.A.SWOT Analysis 2019
Table 5.92 Stölzle Glass Group Profile 2018 (Glass Packaging Market Ranking, Glass Packaging Market Share %, CEO, Parent Company Sales US$m, Sales in the Market US$ m, Share of Company Sales from the Market %, Business Segment in the Market, HQ, Founded, No. of Employees, Website)
Table 5.93 Stölzle Glass Group Glass Packaging Market Developments 2014-2019 (Date, Strategy, Details)
Table 5.94 Stölzle Glass Group Glass Packaging Market Products / Services (Product, Specification / Features)
Table 5.95 Stölzle Glass Group SWOT Analysis 2019
Table 5.96 Verallia SA Profile 2018 (Glass Packaging Market Ranking, Glass Packaging Market Share %, CEO, Parent Company Sales US$m, Sales in the Market US$ m, Share of Company Sales from the Market %, Business Segment in the Market, HQ, Founded, No. of Employees, Website)
Table 5.97 Verallia SA Glass Packaging Market Developments 2014-2019 (Date, Strategy, Details)
Table 5.98 Verallia SA Sales 2015-2018 (US$ m, AGR %)
Table 5.99 Verallia SA Net Income 2015-2018 (US$m, AGR %)
Table 5.100 Verallia SA Glass Packaging Market Products / Services (Product, Specification / Features)
Table 5.101 Verallia SA: Key Financial Ratios, 2018
Table 5.102 Verallia SA SWOT Analysis 2019
Table 5.103 Vetropack Holding Ltd Profile 2018 (Glass Packaging Market Ranking, Glass Packaging Market Share %, CEO, Parent Company Sales US$m, Sales in the Market US$ m, Share of Company Sales from the Market %, Business Segment in the Market, HQ, Founded, No. of Employees, Website)
Table 5.104 Vetropack Holding Ltd Glass Packaging Market Developments 2014-2019 (Date, Strategy, Details)
Table 5.105 Vetropack Holding Ltd Sales 2015-2018 (US$ m, AGR %)
Table 5.106 Vetropack Holding LtdNet Income 2015-2018 (US$ m, AGR %)
Table 5.107 Vetropack Holding Ltd Glass Packaging Market Products / Services (Product, Specification / Features)
Table 5.108 Vetropack Holding Ltd: Key Financial Ratios, 2018
Table 5.109 Vetropack Holding Ltd SWOT Analysis 2019
Table 5.110 Vidrala SA Profile 2018 (Glass Packaging Market Ranking, Glass Packaging Market Share %, CEO, Parent Company Sales US$m, Sales in the Market US$ m, Share of Company Sales from the Market %, Business Segment in the Market, HQ, Founded, No. of Employees, Website)
Table 5.111 Vidrala SA Glass Packaging Market Developments 2014-2019 (Date, Strategy, Details)
Table 5.112 Vidrala SA Sales 2015-2018 (US$ m, AGR %)
Table 5.113 Vidrala SANet Income 2015-2018 (US$ m, AGR %)
Table 5.114 Vidrala SA Glass Packaging Market Products / Services (Product, Specification / Features)
Table 5.115 Vidrala SA: Key Financial Ratios, 2018
Table 5.116 Vidrala SA SWOT Analysis 2019
Table 5.117 Vitro, S.A.B de C.V. Profile 2018 (Glass Packaging Market Ranking, Glass Packaging Market Share %, CEO, Parent Company Sales US$m, Sales in the Market US$ m, Share of Company Sales from the Market %, Business Segment in the Market, HQ, Founded, No. of Employees, Website)
Table 5.118 Vitro, S.A.B de C.V. Glass Packaging Market Developments 2014-2019 (Date, Strategy, Details)
Table 5.119 Vitro, S.A.B de C.V. Sales 2015-2018 (US$ m, AGR %)
Table 5.120 Vitro, S.A.B de C.V.Net Income 2015-2018 (US$ m, AGR %)
Table 5.121 Vitro, S.A.B de C.V. Glass Packaging Market Products / Services (Product, Specification / Features)
Table 5.122 Vitro, S.A.B de C.V.: Key Financial Ratios, 2018
Table 5.123 Vitro, S.A.B de C.V.SWOT Analysis 2019
Table 5.124 Wiegand Glass GmbH Profile 2018 (Glass Packaging Market Ranking, Glass Packaging Market Share %, CEO, Parent Company Sales US$m, Sales in the Market US$ m, Share of Company Sales from the Market %, Business Segment in the Market, HQ, Founded, No. of Employees, Website)
Table 5.125 Wiegand Glass GmbH Glass Packaging Market Developments 2014-2019 (Date, Strategy, Details)
Table 5.126 Wiegand Glass GmbH Glass Packaging Market Products / Services (Product, Specification / Features)
Table 5.127 Wiegand Glass GmbH SWOT Analysis 2019
Table 5.128 Zignago Vetro Profile 2018 (Glass Packaging Market Ranking, Glass Packaging Market Share %, CEO, Parent Company Sales US$m, Sales in the Market US$ m, Share of Company Sales from the Market %, Business Segment in the Market, HQ, Founded, No. of Employees, Website)
Table 5.129 Zignago Vetro Glass Packaging Market Developments 2014-2019 (Date, Strategy, Details)
Table 5.130 Zignago Vetro Sales 2015-2018 (US$ m, AGR %)
Table 5.131 Zignago VetroNet Income 2015-2018 (US$ m, AGR %)
Table 5.132 Zignago Vetro Glass Packaging Market Products / Services (Product, Specification / Features)
Table 5.133 Zignago Vetro: Key Financial Ratios, 2018
Table 5.134 Zignago Vetro SWOT Analysis 2019
Table 5.135 Allied Glass Containers Ltd Profile 2018 (Glass Packaging Market Ranking, Glass Packaging Market Share %, CEO, Parent Company Sales US$m, Sales in the Market US$ m, Share of Company Sales from the Market %, Business Segment in the Market, HQ, Founded, No. of Employees, Website)
Table 5.136 Allied Glass Containers Ltd Glass Packaging Market Developments 2014-2019 (Date, Strategy, Details)
Table 5.137 Allied Glass Containers Ltd Glass Packaging Market Products / Services (Product, Specification / Features)
Table 5.138 Allied Glass Containers Ltd SWOT Analysis 2019
Table 5.139 Toyo Glass Co., Ltd. Profile 2018 (Glass Packaging Market Ranking, Glass Packaging Market Share %, CEO, Parent Company Sales US$m, Sales in the Market US$ m, Share of Company Sales from the Market %, Business Segment in the Market, HQ, Founded, No. of Employees, Website)
Table 5.140 Toyo Glass Co., Ltd. Glass Packaging Market Products / Services (Product, Specification / Features)
Table 5.141 Toyo Glass Co., Ltd. SWOT Analysis 2019
Table 5.142 Haldyn Glass Limited Profile 2018 (Glass Packaging Market Ranking, Glass Packaging Market Share %, Chairman, Parent Company Sales US$m, Sales in the Market US$ m, Share of Company Sales from the Market %, Business Segment in the Market, HQ, Founded, No. of Employees, Website)
Table 5.143 Haldyn Glass Ltd Sales 2015-2018 (US$ m, AGR %)
Table 5.144 Haldyn Glass Ltd Net Income 2015-2018 (US$ m, AGR %)
Table 5.145 Haldyn Glass Limited Glass Packaging Market Products / Services (Product, Specification / Features)
Table 5.146 Haldyn Glass Limited: Key Financial Ratios, 2018
Table 5.147 Haldyn Glass Limited SWOT Analysis 2019
Table 5.148 Consol Glass Ltd Profile 2018 (Glass Packaging Market Ranking, Glass Packaging Market Share %, CEO, Parent Company Sales US$m, Sales in the Market US$ m, Share of Company Sales from the Market %, Business Segment in the Market, HQ, Founded, No. of Employees, Website)
Table 5.149 Consol Glass Ltd Glass Packaging Market Developments 2014-2019 (Date, Strategy, Details)
Table 5.150 Consol Glass Ltd Glass Packaging Market Products / Services (Product, Specification / Features)
Table 5.151 Consol Glass Ltd SWOT Analysis 2019
Table 5.152 Takemoto Yohki Co Ltd Profile 2018 (Glass Packaging Market Ranking, Glass Packaging Market Share %, CEO, Parent Company Sales US$m, Sales in the Market US$ m, Share of Company Sales from the Market %, Business Segment in the Market, HQ, Founded, No. of Employees, Website)
Table 5.153 Takemoto Yohki Co Ltd Glass Packaging Market Developments 2014-2019 (Date, Strategy, Details)
Table 5.154 Takemoto Yohki Co Ltd Glass Packaging Market Products / Services (Product, Specification / Features)
Table 5.155Takemoto Yohki Co Ltd SWOT Analysis 2019
Table 5.156 Carib Glassworks Limited Profile 2018 (Glass Packaging Market Ranking, Glass Packaging Market Share %, Managing Director, Parent Company Sales US$m, Sales in the Market US$ m, Share of Company Sales from the Market %, Business Segment in the Market, HQ, Founded, No. of Employees, Website)
Table 5.157 Carib Glassworks Limited Glass Packaging Market Products / Services (Product, Specification / Features)
Table 5.158 Carib Glassworks Limited SWOT Analysis 2019
able 5.143 Haldyn Glass Ltd Sales 2015-2018 (US$ m, AGR %)
Table 5.144 Haldyn Glass Ltd Net Income 2015-2018 (US$ m, AGR %)
Table 5.145 Haldyn Glass Limited Glass Packaging Market Products / Services (Product, Specification / Features)
Table 5.146 Haldyn Glass Limited: Key Financial Ratios, 2018
Table 5.147 Haldyn Glass Limited SWOT Analysis 2019
Table 5.148 Consol Glass Ltd Profile 2018 (Glass Packaging Market Ranking, Glass Packaging Market Share %, CEO, Parent Company Sales US$m, Sales in the Market US$ m, Share of Company Sales from the Market %, Business Segment in the Market, HQ, Founded, No. of Employees, Website)
Table 5.149 Consol Glass Ltd Glass Packaging Market Developments 2014-2019 (Date, Strategy, Details)
Table 5.150 Consol Glass Ltd Glass Packaging Market Products / Services (Product, Specification / Features)
Table 5.151 Consol Glass Ltd SWOT Analysis 2019
Table 5.152 Takemoto Yohki Co Ltd Profile 2018 (Glass Packaging Market Ranking, Glass Packaging Market Share %, CEO, Parent Company Sales US$m, Sales in the Market US$ m, Share of Company Sales from the Market %, Business Segment in the Market, HQ, Founded, No. of Employees, Website)
Table 5.153 Takemoto Yohki Co Ltd Glass Packaging Market Developments 2014-2019 (Date, Strategy, Details)
Table 5.154 Takemoto Yohki Co Ltd Glass Packaging Market Products / Services (Product, Specification / Features)
Table 5.155Takemoto Yohki Co Ltd SWOT Analysis 2019
Table 5.156 Carib Glassworks Limited Profile 2018 (Glass Packaging Market Ranking, Glass Packaging Market Share %, Managing Director, Parent Company Sales US$m, Sales in the Market US$ m, Share of Company Sales from the Market %, Business Segment in the Market, HQ, Founded, No. of Employees, Website)
Table 5.157 Carib Glassworks Limited Glass Packaging Market Products / Services (Product, Specification / Features)
Table 5.158 Carib Glassworks Limited SWOT Analysis 2019
LIST OF FIGURES
Figure 3.1 Company Share Analysis 2018
Figure 4.1 Moderate to High Bargaining Power of Suppliers
Figure 4.2 Low to Moderate Bargaining Power of Buyers
Figure 4.3 Low Threat of New Entrant
Figure 4.4 Moderate Threat of Substitution
Figure 3.5 Moderate Competitive Rivalry
Figure 5.1 Owens-Illinois Sales 2015-2018 (US$m, AGR %)
Figure 5.2 Owens-Illinois Net Income 2015-2018 (US$m, AGR %)
Figure 5.3 Owens-Illinois Organizational Structure 2019
Figure 5.4 Owens-Illinois Primary Market Competitors 2019
Figure 5.5 Ardagh Group Sales 2015-2018 (US$m, AGR %)
Figure 5.6 Ardagh Group Net Income 2015-2018 (US$m, AGR %)
Figure 5.7 Ardagh Group Organizational Structure 2019
Figure 5.8 Ardagh Group Primary Market Competitors 2019
Figure 5.9 Şişecam Group Sales 2015-2018 (US$m, AGR %)
Figure 5.10 Şişecam Group Net Income 2015-2018 (US$m)
Figure 5.11 Şişecam Group Organizational Structure 2019
Figure 5.12 Şişecam Group Primary Market Competitors 2019
Figure 5.13 Asahi Glass Co., Ltd. Sales 2015-2018 (US$b, AGR %)
Figure 5.14 Asahi Glass Co., Ltd. Net Income 2015-2018 (US$m)
Figure 5.15 Asahi Glass Co., Ltd. Organizational Structure 2019
Figure 5.16 Asahi Glass Co., Ltd. Primary Market Competitors 2019
Figure 5.17 BA Glass BV Sales 2015-2018 (US$m, AGR %)
Figure 5.18 BA Glass BV Net Income 2015-2018 (US$m)
Figure 5.19 BA Glass BV Organizational Structure 2019
Figure 5.20 BA Glass BV Primary Market Competitors 2019
Figure 5.21 Bormioli Rocco SpA Organizational Structure 2019
Figure 5.22 Bormioli Rocco SpA Primary Market Competitors 2019
Figure 5.23 Gallo Glass Company Organizational Structure 2019
Figure 5.24 Gallo Glass Company Primary Market Competitors 2019
Figure 5.25 Gerresheimer AG Sales 2015-2018 (US$m, AGR %)
Figure 5.26 Gerresheimer AG Net Income 2015-2018 (US$m)
Figure 5.27 Gerresheimer AG Organizational Structure 2019
Figure 5.28 Gerresheimer AG Primary Market Competitors 2019
Figure 5.29 HEINZ-GLAS GmbH & Co. KGaA Organizational Structure 2019
Figure 5.30 HEINZ-GLAS GmbH & Co. KGaA Primary Market Competitors 2019
Figure 5.31 Hindustan National Glass Industries Ltd. Sales 2015-2018 (US$m, AGR %)
Figure 5.32 Hindustan National Glass Industries Ltd. Net Income 2015-2018 (US$m)
Figure 5.33 Hindustan National Glass Industries Ltd. Organizational Structure 2019
Figure 5.34 Hindustan National Glass Industries Ltd. Primary Market Competitors 2019
Figure 5.35 Koa Glass Co. Ltd. Organizational Structure 2019
Figure 5.36 Koa Glass Co. Ltd. Primary Market Competitors 2019
Figure 5.37 Nihon Yamamura Glass Co. Ltd. Sales 2015-2018 (US$m, AGR %)
Figure 5.38 Nihon Yamamura Glass Co. Ltd. Net Income 2015-2018 (US$m)
Figure 5.39 Nihon Yamamura Glass Co. Ltd. Organizational Structure 2019
Figure 5.40 Nihon Yamamura Glass Co. Ltd. Primary Market Competitors 2019
Figure 5.41 Orora Packaging Pty. Ltd. Sales 2015-2018 (US$m, AGR %)
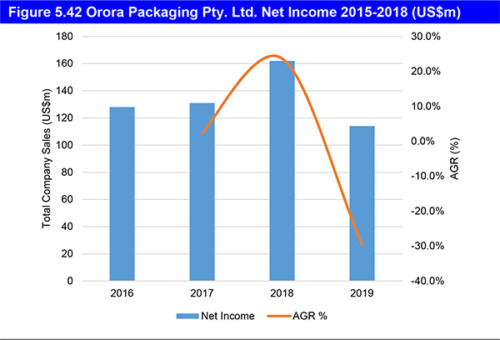
Figure 5.42 Orora Packaging Pty. Ltd. Net Income 2015-2018 (US$m)
Figure 5.43 Orora Packaging Pty. Ltd. Organizational Structure 2019
Figure 5.44 Orora Packaging Pty. Ltd. Primary Market Competitors 2019
Figure 5.46 Piramal Glass Private Ltd Primary Market Competitors 2019
Figure 5.45 Piramal Glass Private Ltd Organizational Structure 2019
Figure 5.46 Piramal Glass Private Ltd Primary Market Competitors 2019
Figure 5.47 Groupe Pochet Organizational Structure 2019
Figure 5.48 Groupe Pochet Primary Market Competitors 2019
Figure 5.49 SaverGlass Inc. Organizational Structure 2019
Figure 5.50 SaverGlass Inc. Primary Market Competitors 2019
Figure 5.51 SGD S.A. Organizational Structure 2019
Figure 5.52 SGD S.A. Primary Market Competitors 2019
Figure 5.53 Stölzle Glass Group Organizational Structure 2019
Figure 5.54 Stölzle Glass Group Primary Market Competitors 2019
Figure 5.55 Verallia SA Sales 2015-2018 (US$m, AGR %)
Figure 5.56 Verallia SA Net Income 2015-2018 (US$m)
Figure 5.57 Verallia SA Organizational Structure 2019
Figure 5.58 Verallia SA Primary Market Competitors 2019
Figure 5.59 Vetropack Holding Ltd Sales 2015-2018 (US$m, AGR %)
Figure 5.60 Vetropack Holding Ltd Net Income 2015-2018 (US$m, AGR %)
Figure 5.61 Vetropack Holding Ltd Organizational Structure 2019
Figure 5.62 Vetropack Holding Ltd Primary Market Competitors 2019
Figure 5.63 Vidrala SA Sales 2015-2018 (US$m, AGR %)
Figure 5.64 Vidrala SA Net Income 2015-2018 (US$m, AGR %)
Figure 5.65 Vidrala SA Organizational Structure 2019
Figure 5.66 Vidrala SA Primary Market Competitors 2019
Figure 5.67 Vitro, S.A.B de C.V. Sales 2015-2018 (US$m, AGR %)
Figure 5.68 Vitro, S.A.B de C. V.Net Income 2015-2018 (US$m, AGR %)
Figure 5.69 Vitro, S.A.B de C.V. Organizational Structure 2019
Figure 5.70 Vitro, S.A.B de C.V. Primary Market Competitors 2019
Figure 5.71 Wiegand Glass GmbH Organizational Structure 2019
Figure 5.72 Wiegand Glass GmbH Primary Market Competitors 2019
Figure 5.73 Zignago Vetro Sales 2015-2018 (US$m, AGR %)
Figure 5.74 Zignago Vetro Net Income 2015-2018 (US$m, AGR %)
Figure 5.75 Zignago Vetro Organizational Structure 2019
Figure 5.76 Zignago Vetro Primary Market Competitors 2019
Figure 5.77 Allied Glass Containers Ltd Organizational Structure 2019
Figure 5.78 Allied Glass Containers Ltd Primary Market Competitors 2019
Figure 5.79 Toyo Glass Co., Ltd. Organizational Structure 2019
Figure 5.80 Toyo Glass Co., Ltd. Primary Market Competitors 2019
Figure 5.81 Haldyn Glass Ltd Sales 2015-2018 (US$m, AGR %)
Figure 5.82 Haldyn Glass Ltd Net Income 2015-2018 (US$m, AGR %)
Figure 5.83 Haldyn Glass Limited Organizational Structure 2019
Figure 5.84 Haldyn Glass Limited Primary Market Competitors 2019
Figure 5.85 Consol Glass Ltd Organizational Structure 2019
Figure 5.86 Consol Glass Ltd Primary Market Competitors 2019
Figure 5.87 Takemoto Yohki Co Ltd Organizational Structure 2019
Figure 5.88 Takemoto Yohki Co Ltd Primary Market Competitors 2019
Figure 5.89 Carib Glassworks Limited Organizational Structure 2019
Figure 5.90 Carib Glassworks Limited Primary Market Competitors 2019
Allied Glass Containers
Ardagh Group
Asahi Glass
BA Glass
Bormioli Rocco
Carib Glassworks
Consol Glass
Gallo Glass
Gerresheimer
Groupe Pochet
Haldyn Glass
HEINZ-GLAS
Hindustan National Glass Industries
Koa Glass
Nihon Yamamura Glass
Orora Packaging
Owens-Illinois
Piramal Glass Private
SaverGlass
SGD
Şişecam Group
Stölzle Glass Group
Takemoto Yohki
Toyo Glass
Verallia
Vetropack Holding
Vidrala
Vitro
Wiegand Glass
Zignago Vetro
Download sample pages
Complete the form below to download your free sample pages for Top 30 Glass Packaging Companies 2020
Related reports
-

eClinical Solution Market Report 2019-2029
E-Clinical solution is an electronic medium of clinical study and research in pharmaceutical and biotechnical industry, the eClinical software helps...
Full DetailsPublished: 01 January 1970 -
Recycled Packaging Materials Market Report 2019-2029
The latest report from business intelligence provider, Visiongain offers a comprehensive analysis of the global Recycled Packaging Materials market. Visiongain...Full DetailsPublished: 29 March 2019 -

Pharmaceutical Glass Packaging Market Report 2020-2030
Our study lets you assess forecasted sales at overall world market and regional level. See financial performance of companies, trends,...
Full DetailsPublished: 01 January 1970 -
E-Commerce Packaging Market Report 2020-2030
Our 300+ page report provides 400+ tables and charts/graphs. Read on to discover the most lucrative areas in the industry...
Full DetailsPublished: 30 June 2020 -
PET Packaging Market Forecast 2018-2028
Visiongain’s definitive new report assesses that the PET Packaging market will exceed $56bn in 2017.
...Full DetailsPublished: 12 December 2017 -
Glass Packaging Market Report 2021-2031
Key factor driving the market growth is increasing demand of packaged food products in different developing countries, including China, India,...Full DetailsPublished: 14 January 2021 -
Rigid Plastic Packaging Market Report 2020-2030
Global rigid plastic packaging market is anticipated to surpass USD 300 billion by 2030 while growing at a CAGR of...
Full DetailsPublished: 10 February 2020 -
Active, Smart and Intelligent Packaging Market Report 2020-2030
Active, Smart And Intelligent Packaging market is projected to reach US$23.76 billion in 2020.
...Full DetailsPublished: 18 March 2020 -

Luxury Packaging Market Forecast 2020-2030
The increase in packaging innovations is another major factor anticipated to drive the market growth in years to come.
...Full DetailsPublished: 01 May 2020 -

Global Renewable Plastic Packaging Market Research Report 2020-2030 – Market Size, Industry Outlook, Market Forecast Report
Favorable government policies, availability of bioplastic raw materials, plenty of suppliers, and environmentally friendly properties are expected to drive global...Full DetailsPublished: 27 July 2020
Download sample pages
Complete the form below to download your free sample pages for Top 30 Glass Packaging Companies 2020
Do you have any custom requirements we can help you with?
Any specific country, geo region, market segment or specific company information?
Email us today, we can discuss your needs and see how we can help: jamie.roberts@visiongain.com
Would you like a free report overview of the report of your choice?
If so, please drop an email to Jamie Roberts stating your chosen report title to jamie.robertsvisiongain.com
Visiongain packaging related reports are compiled using a broad and rich mixture of both primary and secondary information to produce an overall industry outlook. In order to provide our clients with the best product possible product, visiongain analysts reach out to market-leading vendors and industry experts but also review a wealth of financial data and product information from a vast range of sources. To find out more about our reports methodology, please email jamie.roberts@visiongain.com
Would you like to get the latest Visiongain packaging reports catalogue?
What are the dynamic growth sectors? where are the regional business opportunities?
Which technologies will prevail and who are the leading companies succeeding in these sectors and why?
If you want definitive answers to business critical questions, discover Visiongain’s full range of business intelligence reports.
If so, please email Jamie Roberts on jamie.roberts@visiongain.com or call her today on +44 207 336 6100
Adhesive & Sealant Council
Alliance of Foam Packaging Recyclers
American Bakers Association
American Chemistry Council
American Forest & Paper Association
American Frozen Food Institute
American Institute of Food Distributors
American Iron and Steel Institute
American Management Association
American National Standards Institute
American Plastics Council (APC)
American Society for Testing and Materials
Association for Suppliers of Printing, Publishing
AICC, The Independent Packaging Association
Association of Industrial Metallizers, Coaters and Laminators (AIMCAL)
Automated Identification Manufacturer
Automated Imaging Association
Can Manufacturers Institute
Chocolate Manufacturers Association of the U.S.A.
Consumer Healthcare Products Association
Contract Manufacturing and Packaging Association
Converting Equipment Manufacturers Association
Corrugated Packaging Council
Drug, Chemical & Allied Trade Association
Envelope Manufacturers Association
Fibre Box Association
Flexible Packaging Association
Flexographic Technical AssociationFlexographic Technical Association
Foil Stamping and Embossing Association
Food and Drug Law Institute
Food Institute
Food Marketing Institute
Food Processing Machinery & Supplies Association
Foodservice & Packaging Institute
Glass Packaging Institute
Graphic Arts Technical Foundation
Gravure Association of America
Grocery Manufacturers of America
Healthcare Compliance Packaging Council
High Definition Flexo Consortium
Institute of Food Technologists
Institute of Packaging Professionals
International Association of Food Industry Suppliers
International Bottled Water Association
International Dairy Foods Association
International Foodservice Manufacturers Association
International Safe Transit Association
Label Printing Industries of America
Material Handling Industry of America
National Association of Container Distributors
National Association of Manufacturers
National Chicken Council
National Coil Coating Association
National Confectioners Association of the U.S.A.
National Freight Claim & Security
National Institute of Packaging, Handling & Logistics Engineers
National Paper Trade Association
National Wooden Pallet & Container
Open Modular Architecture Controls (OMAC) Packaging Workgroup
Packaging Association of Canada
Paperboard Packaging Council
Petroleum Packaging Council
Pharmaceutical Research and Manufacturers of America
PMMI: The Association for Packaging and Processing Technologies
Polystyrene Packaging Council
Pressure Sensitive Tape Council
Printing Industries of America
Processing and Packaging Machinery Association (PPMA)
Produce Marketing Association, Inc.
Research & Development Associates for Military Food & Packaging Systems
Robotic Industries Association (RIA)
Snack Food Association
Soap & Detergent Association
Society of Glass and Ceramic Decorators
Society of Manufacturing Engineers
Society of Plastics Engineers (SPE)
Society of the Plastics Industry (SPI)
Steel Recycling Institute
Steel Shipping Containers Institute
Tag and Label Manufacturers Institute
Technical Association of the Pulp & Paper Industry
The Aluminum Association
Transportation Consumer Protection Council
Transportation Loss Prevention & Security Association
Tube Council of North America
Uniform Code Council, Inc.
Western Packaging Association (WPA)
World Packaging Organisation
Latest Packaging news
Visiongain Publishes Caps & Closures Market Report 2024-2034
The global caps & closures market was valued at US$80.8 billion in 2023 and is projected to grow at a CAGR of 9% during the forecast period 2024-2034.
22 February 2024
Visiongain Publishes Flexible (Converted) Plastic Packaging Market Report 2024-2034
The global Flexible (Converted) Plastic Packaging market was valued at US$157.3 billion in 2023 and is projected to grow at a CAGR of 5.4% during the forecast period 2024-2034.
04 January 2024
Visiongain Publishes Beverage Packaging Market Report 2023-2033
The global Beverage Packaging market was valued at US$144.3 billion in 2022 and is projected to grow at a CAGR of 4.6% during the forecast period 2023-2033.
28 September 2023
Visiongain Publishes Cosmetics Packaging Market Report 2023-2033
The global Cosmetics Packaging market is projected to grow at a CAGR of 4.3% by 2033
21 July 2023
