1. Report Overview
1.1 Introduction to E-Commerce Packaging Market
1.1. Global E-Commerce Packaging Market Segmentation
1.2 E-Commerce Packaging Market Definition
1.3 Why You Should Read This Report
1.4 What This Report Delivers
1.5 Key Questions Answered By This Analytical Report Include:
1.6 Who is This Report For?
1.7 Methodology
1.7.1 COVID-19 Impact: Recovery Scenarios
1.7.2 Market Evaluation & Forecasting Methodology
1.7.3 Market Size Estimation
1.8 Frequently Asked Questions (FAQs)
1.9 Associated Visiongain Reports
1.10 About Visiongain
2 Executive Summary
3 Global E-Commerce Packaging Market Overview
3.1 Market Trend Analysis
3.1.1 Drivers
3.1.2 Restraints
3.1.3 Opportunities
3.1.4 Challenges
3.2 SWOT Analysis
3.2.1 Strengths
3.2.2 Weaknesses
3.2.3 Opportunities
3.2.4 Threats
3.3 Industry analysis - Porter’s
3.3.1 Buyer Power
3.3.2 Supplier Power
3.3.3 Competitive Rivalry
3.3.4 Threat of Substitute
3.3.5 Threat of New Entrants
3.4 Industry analysis – PEST Analysis
3.4.1 Political
3.4.2 Economical
3.4.3 Social
3.4.4 Technological
4 Global E-Commerce Packaging Market Size Forecast 2020-2030 by Material
4.1 Global E-Commerce Packaging Market for Plastic Segment: Revenue Forecast 2020-2030
4.1.1 Global E-Commerce Packaging Market for Plastic Segment: Recovery Forecasts (V,U, W, L)
4.2 Global E-Commerce Packaging Market for Corrugated Board Segment: Revenue Forecast 2020-2030
4.2.1 Global E-Commerce Packaging Market for Corrugated Board Segment: Recovery Forecasts (V,U, W, L)
4.3 Global E-Commerce Packaging Market for Paper Segment: Revenue Forecast 2020-2030
4.3.1 Global E-Commerce Packaging Market for Paper Segment: Recovery Forecasts (V,U, W, L)
4.4 Global E-Commerce Packaging Market for Others Segment: Revenue Forecast 2020-2030
4.4.1 Global E-Commerce Packaging Market for Others Segment: Recovery Forecasts (V,U, W, L)
5 Global E-Commerce Packaging Market Size Forecast 2020-2030 by Application
5.1 Global E-Commerce Packaging Market for Consumer Electronics Segment: Revenue Forecast 2020-2030
5.1.1 Global E-Commerce Packaging Market for Consumer Electronics Segment: Recovery Forecasts (V,U, W, L)
5.2 Global E-Commerce Packaging Market for Fashion and Apparel Segment: Revenue Forecast 2020-2030
5.2.1 Global E-Commerce Packaging Market for Fashion and Apparel Segment: Recovery Forecasts (V,U, W, L)
5.3 Global E-Commerce Packaging Market for Food & Beverages Segment: Revenue Forecast 2020-2030
5.3.1 Global E-Commerce Packaging Market for Food & Beverages Segment: Recovery Forecasts (V,U, W, L)
5.4 Global E-Commerce Packaging Market for Personal Care Products Segment: Revenue Forecast 2020-2030
5.4.1 Global E-Commerce Packaging Market for Personal Care Products Segment: Recovery Forecasts (V,U, W, L)
5.5 Global E-Commerce Packaging Market for Others Segment: Revenue Forecast 2020-2030
5.5.1 Global E-Commerce Packaging Market for Others Segment: Recovery Forecasts (V,U, W, L)
6 Regional and Leading National E-Commerce Packaging Market Forecasts 2020-2030
6.1 Global E-Commerce Packaging Market by National Market Forecast 2020-2030
6.1.1 Global E-Commerce Packaging Market Forecast 2020-2030, Recovery Scenarios (V, U, W, L)
6.2 North America
6.2.1 North America E-Commerce Packaging Market by Country Forecast 2020-2030
6.2.2 North America E-Commerce Packaging Market by Country Forecast 2020-2030, Recovery Scenarios(V, U, W, L)
6.2.3 North America E-Commerce Packaging Market Forecast by Material, 2020-2030 (US$ billion, AGR%)
6.2.4 North America E-Commerce Packaging Market Forecast by Application, 2020-2030 (US$ billion, AGR%)
6.2.5 U.S. E-Commerce Packaging Market Forecast 2020-2030
6.2.5.1 U.S. E-Commerce Packaging Market Forecast, 2020-2030: Recovery Scenarios (V, U, W, L)
6.2.6 Canada E-Commerce Packaging Market Forecast 2020-2030
6.2.6.1 Canada E-Commerce Packaging Market Forecast, 2020-2030: Recovery Scenarios (V, U, W, L)
6.3 Europe
6.3.1 Europe E-Commerce Packaging Market by Country Forecast 2020-2030
6.3.2 Europe E-Commerce Packaging Market by Country Forecast 2020-2030, Recovery Scenarios (V, U, W, L)
6.3.3 Europe E-Commerce Packaging Market Forecast by Material, 2020-2030 (US$ billion, AGR%)
6.3.4 Europe E-Commerce Packaging Market Forecast by Application, 2020-2030 (US$ billion, AGR%)
6.3.5 Germany E-Commerce Packaging Market Forecast 2020-2030
6.3.5.1 Germany E-Commerce Packaging Market Forecast, 2020-2030: Recovery Scenarios (V, U, W, L)
6.3.6 UK E-Commerce Packaging Market Forecast 2020-2030
6.3.6.1 UK E-Commerce Packaging Market Forecast, 2020-2030: Recovery Scenarios (V, U, W, L)
6.3.7 France E-Commerce Packaging Market Forecast 2020-2030
6.3.7.1 France E-Commerce Packaging Market Forecast, 2020-2030: Recovery Scenarios (V, U, W, L)
6.3.8 Italy E-Commerce Packaging Market Forecast 2020-2030
6.3.8.1 Italy E-Commerce Packaging Market Forecast, 2020-2030: Recovery Scenarios (V, U, W, L)
6.3.9 Spain E-Commerce Packaging Market Forecast 2020-2030
6.3.9.1 Spain E-Commerce Packaging Market Forecast, 2020-2030: Recovery Scenarios (V, U, W, L)
6.3.10 Rest of Europe E-Commerce Packaging Market Forecast 2020-2030
6.3.10.1 Rest of Europe E-Commerce Packaging Market Forecast, 2020-2030: Recovery Scenarios (V, U, W, L)
6.4 Asia Pacific
6.4.1 Asia Pacific E-Commerce Packaging Market by Country Forecast 2020-2030
6.4.2 Asia Pacific E-Commerce Packaging Market by Country Forecast 2020-2030, Recovery Scenarios (V, U, W, L)
6.4.3 Asia Pacific E-Commerce Packaging Market Forecast by Material, 2020-2030 (US$ billion, AGR%)
6.4.4 Asia Pacific E-Commerce Packaging Market Forecast by Application, 2020-2030 (US$ billion, AGR%)
6.4.5 China E-Commerce Packaging Market Forecast 2020-2030
6.4.5.1 China E-Commerce Packaging Market Forecast, 2020-2030: Recovery Scenarios (V, U, W, L)
6.4.6 Japan E-Commerce Packaging Market Forecast 2020-2030
6.4.6.1 Japan E-Commerce Packaging Market Forecast, 2020-2030: Recovery Scenarios (V, U, W, L)
6.4.7 India E-Commerce Packaging Market Forecast 2020-2030
6.4.7.1 India E-Commerce Packaging Market Forecast, 2020-2030: Recovery Scenarios (V, U, W, L)
6.4.8 Singapore E-Commerce Packaging Market Forecast 2020-2030
6.4.8.1 Singapore E-Commerce Packaging Market Forecast, 2020-2030: Recovery Scenarios (V, U, W, L)
6.4.9 Australia E-Commerce Packaging Market Forecast 2020-2030
6.4.9.1 Australia E-Commerce Packaging Market Forecast, 2020-2030: Recovery Scenarios (V, U, W, L)
6.4.10 South Korea E-Commerce Packaging Market Forecast 2020-2030
6.4.10.1 South Korea E-Commerce Packaging Market Forecast, 2020-2030: Recovery Scenarios (V, U, W, L)
6.4.11 Rest of Asia Pacific E-Commerce Packaging Market Forecast 2020-2030
6.4.11.1 Rest of Asia Pacific E-Commerce Packaging Market Forecast, 2020-2030: Recovery Scenarios (V, U, W, L)
6.5 Latin America
6.5.1 Latin America E-Commerce Packaging Market by Country Forecast 2020-2030
6.5.2 Latin America E-Commerce Packaging Market by Country Forecast 2020-2030, Recovery Scenarios (V, U, W, L)
6.5.3 Latin America E-Commerce Packaging Market Forecast by Material, 2020-2030 (US$ billion, AGR%)
6.5.4 Latin America E-Commerce Packaging Market Forecast by Application, 2020-2030 (US$ billion, AGR%)
6.5.5 Brazil E-Commerce Packaging Market Forecast 2020-2030
6.5.5.1 Brazil E-Commerce Packaging Market Forecast, 2020-2030: Recovery Scenarios (V, U, W, L)
6.5.6 Mexico E-Commerce Packaging Market Forecast 2020-2030
6.5.6.1 Mexico E-Commerce Packaging Market Forecast, 2020-2030: Recovery Scenarios (V, U, W, L)
6.5.7 Argentina E-Commerce Packaging Market Forecast 2020-2030
6.5.7.1 Argentina E-Commerce Packaging Market Forecast, 2020-2030: Recovery Scenarios (V, U, W, L)
6.5.8 Rest of Latin America E-Commerce Packaging Market Forecast 2020-2030
6.5.8.1 Rest of Latin America E-Commerce Packaging Market Forecast, 2020-2030: Recovery Scenarios (V, U, W, L)
6.6 MEA
6.6.1 MEA E-Commerce Packaging Market by Country Forecast 2020-2030
6.6.2 MEA E-Commerce Packaging Market by Country Forecast 2020-2030, Recovery Scenarios (V, U, W, L)
6.6.3 MEA E-Commerce Packaging Market Forecast by Material, 2020-2030 (US$ billion, AGR%)
6.6.4 MEA E-Commerce Packaging Market Forecast by Application, 2020-2030 (US$ billion, AGR%)
6.6.5 GCC E-Commerce Packaging Market Forecast 2020-2030
6.6.5.1 GCC E-Commerce Packaging Market Forecast, 2020-2030: Recovery Scenarios (V, U, W, L)
6.6.6 South Africa E-Commerce Packaging Market Forecast 2020-2030
6.6.6.1 South Africa E-Commerce Packaging Market Forecast, 2020-2030: Recovery Scenarios (V, U, W, L)
6.6.7 Rest of MEA E-Commerce Packaging Market Forecast 2020-2030
6.6.7.1 Rest of Middle East and Africa E-Commerce Packaging Market Forecast, 2020-2030: Recovery Scenarios (V, U, W, L)
7 Leading Companies in the E-Commerce Packaging Market
7.1 Amcor PLC
7.1.1 Amcor PLC: Company Snapshot
7.1.2 Amcor PLC: Company Overview
7.1.3 Amcor PLC: Company Financials
7.1.4 Amcor PLC: Products
7.1.5 Amcor PLC: Recent Developments
7.2 DS Smith PLC
7.2.1 DS Smith PLC: Company Snapshot
7.2.2 DS Smith PLC: Company Overview
7.2.3 DS Smith PLC: Company Financials
7.2.4 DS Smith PLC: Products
7.2.5 DS Smith PLC: Recent Developments
7.3 Georgia-Pacific Corporation
7.3.1 Georgia-Pacific Corporation: Company Snapshot
7.3.2 Georgia-Pacific Corporation: Company Overview
7.3.3 Georgia-Pacific Corporation: Products
7.3.4 Georgia-Pacific Corporation: Recent Developments
7.4 WestRock Company
7.4.1 WestRock Company: Company Snapshot
7.4.2 WestRock Company: Company Overview
7.4.3 WestRock Company: Company Financials
7.4.4 WestRock Company: Products
7.4.5 WestRock Company: Recent Developments
7.5 Sealed Air
7.5.1 Sealed Air: Company Snapshot
7.5.2 Sealed Air: Company Overview
7.5.3 Sealed Air: Company Financials
7.5.4 Sealed Air: Recent Developments
7.5.5 Sealed Air: Products
7.6 International Paper Co.
7.6.1 International Paper Co.: Company Snapshot
7.6.2 International Paper Co.: Company Overview
7.6.3 International Paper Co.: Company Financials
7.6.4 International Paper Co.: Products
7.6.5 International Paper Co.: Recent Developments
7.7 Ball Corporation
7.7.1 Ball Corporation: Company Snapshot
7.7.2 Ball Corporation: Company Overview
7.7.3 Ball Corporation: Company Financials
7.7.4 Ball Corporation: Products
7.7.5 Ball Corporation: Recent Developments
7.8 Crown Holdings Inc.
7.8.1 Crown Holdings Inc.: Company Snapshot
7.8.2 Crown Holdings Inc.: Company Overview
7.8.3 Crown Holdings Inc.: Company Financials
7.8.4 Crown Holdings Inc.: Products
7.8.5 Crown Holdings Inc.: Recent Developments
7.9 Sonoco Products Company
7.9.1 Sonoco Products Company: Company Snapshot
7.9.2 Sonoco Products Company: Company Overview
7.9.3 Sonoco Products Company: Company Financials
7.9.4 Sonoco Products Company: Products
7.9.5 Sonoco Products Company: Recent Developments
7.10 Graphic Packaging International, LLC
7.10.1 Graphic Packaging International, LLC: Company Snapshot
7.10.2 Graphic Packaging International, LLC: Company Overview
7.10.3 Graphic Packaging International, LLC: Company Financials
7.10.4 Graphic Packaging International, LLC: Products
7.10.5 Graphic Packaging International, LLC: Recent Developments
8 Conclusions and Recommendations
8.1 Impact of COVID-19 Across Major Economies on E-Commerce Sector
8.2 Associated Visiongain Reports
Visiongain Report Sales Order Form
9 Appendix A
9.1 About Visiongain
9.2 Appendix B
9.3 Visiongain report evaluation form
List of Tables
Table 1 Global E-Commerce Packaging Market Snapshot, 2020 & 2030 (US$ billion, CAGR %)
Table 2 WORLD INTERNET USAGE AND POPULATION STATISTICS 2019 Year-End Estimates
Table 3 Global E-Commerce Packaging Market Forecast by Material, 2020-2030 (US$ billion, AGR %, CAGR %)
Table 4 Global E-Commerce Packaging Market for Plastic Segment: Revenue Forecast 2020-2030 (US$ billion, AGR%, CAGR%)
Table 5 “V” Shaped Recovery: Global E-Commerce Packaging Market for Plastic Segment, Revenue Forecast 2020-2030 (US$ billion, AGR%, CAGR%)
Table 6 “U” Shaped Recovery: Global E-Commerce Packaging Market for Plastic Segment, Revenue Forecast 2020-2030 (US$ billion, AGR%, CAGR%)
Table 7 “W” Shaped Recovery: Global E-Commerce Packaging Market for Plastic Segment, Revenue Forecast 2020-2030 (US$ billion, AGR%, CAGR%)
Table 8 “L” Shaped Recovery: Global E-Commerce Packaging Market for Plastic Segment, Revenue Forecast 2020-2030 (US$ billion, AGR%, CAGR%)
Table 9 Global E-Commerce Packaging Market for Corrugated Board Segment: Revenue Forecast 2020-2030 (US$ billion, AGR%, CAGR%)
Table 10 “V” Shaped Recovery: Global E-Commerce Packaging Market for Corrugated Board Segment, Revenue Forecast 2020-2030 (US$ billion, AGR%, CAGR%)
Table 11 “U” Shaped Recovery: Global E-Commerce Packaging Market for Corrugated Board Segment, Revenue Forecast 2020-2030 (US$ billion, AGR%, CAGR%)
Table 12 “W” Shaped Recovery: Global E-Commerce Packaging Market for Corrugated Board Segment, Revenue Forecast 2020-2030 (US$ billion, AGR%, CAGR%)
Table 13 “L” Shaped Recovery: Global E-Commerce Packaging Market for Corrugated Board Segment, Revenue Forecast 2020-2030 (US$ billion, AGR%, CAGR%)
Table 14 Global E-Commerce Packaging Market for Paper Segment: Revenue Forecast 2020-2030 (US$ billion, AGR%, CAGR%)
Table 15 “V” Shaped Recovery: Global E-Commerce Packaging Market for Paper Segment, Revenue Forecast 2020-2030 (US$ billion, AGR%, CAGR%)
Table 16 “U” Shaped Recovery: Global E-Commerce Packaging Market for Paper Segment, Revenue Forecast 2020-2030 (US$ billion, AGR%, CAGR%)
Table 17 “W” Shaped Recovery: Global E-Commerce Packaging Market for Paper Segment, Revenue Forecast 2020-2030 (US$ billion, AGR%, CAGR%)
Table 18 “L” Shaped Recovery: Global E-Commerce Packaging Market for Paper Segment, Revenue Forecast 2020-2030 (US$ billion, AGR%, CAGR%)
Table 19 Global E-Commerce Packaging Market for Others Segment: Revenue Forecast 2020-2030 (US$ billion, AGR%, CAGR%)
Table 20 “V” Shaped Recovery: Global E-Commerce Packaging Market for Others Segment, Revenue Forecast 2020-2030 (US$ billion, AGR%, CAGR%)
Table 21 “U” Shaped Recovery: Global E-Commerce Packaging Market for Others Segment, Revenue Forecast 2020-2030 (US$ billion, AGR%, CAGR%)
Table 22 “W” Shaped Recovery: Global E-Commerce Packaging Market for Others Segment, Revenue Forecast 2020-2030 (US$ billion, AGR%, CAGR%)
Table 23 “L” Shaped Recovery: Global E-Commerce Packaging Market for Others Segment, Revenue Forecast 2020-2030 (US$ billion, AGR%, CAGR%)
Table 24 Global E-Commerce Packaging Market Forecast by Application, 2020-2030 (US$ billion, AGR %, CAGR %)
Table 25 Global E-Commerce Packaging Market for Consumer Electronics Segment: Revenue Forecast 2020-2030 (US$ billion, AGR%, CAGR%)
Table 26 “V” Shaped Recovery: Global E-Commerce Packaging Market for Consumer Electronics Segment, Revenue Forecast 2020-2030 (US$ billion, AGR%, CAGR%)
Table 27 “U” Shaped Recovery: Global E-Commerce Packaging Market for Consumer Electronics Segment, Revenue Forecast 2020-2030 (US$ billion, AGR%, CAGR%)
Table 28 “W” Shaped Recovery: Global E-Commerce Packaging Market for Consumer Electronics Segment, Revenue Forecast 2020-2030 (US$ billion, AGR%, CAGR%)
Table 29 “L” Shaped Recovery: Global E-Commerce Packaging Market for Consumer Electronics Segment, Revenue Forecast 2020-2030 (US$ billion, AGR%, CAGR%)
Table 30 Global E-Commerce Packaging Market for Fashion and Apparel Segment: Revenue Forecast 2020-2030 (US$ billion, AGR%, CAGR%)
Table 31 “V” Shaped Recovery: Global E-Commerce Packaging Market for Fashion and Apparel Segment, Revenue Forecast 2020-2030 (US$ billion, AGR%, CAGR%)
Table 32 “U” Shaped Recovery: Global E-Commerce Packaging Market for Fashion and Apparel Segment, Revenue Forecast 2020-2030 (US$ billion, AGR%, CAGR%)
Table 33 “W” Shaped Recovery: Global E-Commerce Packaging Market for Fashion and Apparel Segment, Revenue Forecast 2020-2030 (US$ billion, AGR%, CAGR%)
Table 34 “L” Shaped Recovery: Global E-Commerce Packaging Market for Fashion and Apparel Segment, Revenue Forecast 2020-2030 (US$ billion, AGR%, CAGR%)
Table 35 Global E-Commerce Packaging Market for Food & Beverages Segment: Revenue Forecast 2020-2030 (US$ billion, AGR%, CAGR%)
Table 36 “V” Shaped Recovery: Global E-Commerce Packaging Market for Food & Beverages Segment, Revenue Forecast 2020-2030 (US$ billion, AGR%, CAGR%)
Table 37 “U” Shaped Recovery: Global E-Commerce Packaging Market for Food & Beverages Segment, Revenue Forecast 2020-2030 (US$ billion, AGR%, CAGR%)
Table 38 “W” Shaped Recovery: Global E-Commerce Packaging Market for Food & Beverages Segment, Revenue Forecast 2020-2030 (US$ billion, AGR%, CAGR%)
Table 39 “L” Shaped Recovery: Global E-Commerce Packaging Market for Food & Beverages Segment, Revenue Forecast 2020-2030 (US$ billion, AGR%, CAGR%)
Table 40 Global E-Commerce Packaging Market for Personal Care Products Segment: Revenue Forecast 2020-2030 (US$ billion, AGR%, CAGR%)
Table 41 “V” Shaped Recovery: Global E-Commerce Packaging Market for Personal Care Products Segment, Revenue Forecast 2020-2030 (US$ billion, AGR%, CAGR%)
Table 42 “U” Shaped Recovery: Global E-Commerce Packaging Market for Personal Care Products Segment, Revenue Forecast 2020-2030 (US$ billion, AGR%, CAGR%)
Table 43 “W” Shaped Recovery: Global E-Commerce Packaging Market for Personal Care Products Segment, Revenue Forecast 2020-2030 (US$ billion, AGR%, CAGR%)
Table 44 “L” Shaped Recovery: Global E-Commerce Packaging Market for Personal Care Products Segment, Revenue Forecast 2020-2030 (US$ billion, AGR%, CAGR%)
Table 45 Global E-Commerce Packaging Market for Others Segment: Revenue Forecast 2020-2030 (US$ billion, AGR%, CAGR%)
Table 46 “V” Shaped Recovery: Global E-Commerce Packaging Market for Others Segment, Revenue Forecast 2020-2030 (US$ billion, AGR%, CAGR%)
Table 47 “U” Shaped Recovery: Global E-Commerce Packaging Market for Others Segment, Revenue Forecast 2020-2030 (US$ billion, AGR%, CAGR%)
Table 48 “W” Shaped Recovery: Global E-Commerce Packaging Market for Others Segment, Revenue Forecast 2020-2030 (US$ billion, AGR%, CAGR%)
Table 49 “L” Shaped Recovery: Global E-Commerce Packaging Market for Others Segment, Revenue Forecast 2020-2030 (US$ billion, AGR%, CAGR%)
Table 50 Global E-Commerce Packaging Market Forecast by Region, 2020-2030 (US$ billion, AGR %,)
Table 51 “V” Shaped Recovery: Global E-Commerce Packaging Market Forecast by Region, 2020-2030 (US$ billion, AGR %,)
Table 52 “U” Shaped Recovery: Global E-Commerce Packaging Market Forecast by Region, 2020-2030 (US$ billion, AGR %,)
Table 53 “W” Shaped Recovery: Global E-Commerce Packaging Market Forecast by Region, 2020-2030 (US$ billion, AGR %,)
Table 54 “L” Shaped Recovery: Global E-Commerce Packaging Market Forecast by Region, 2020-2030 (US$ billion, AGR %,)
Table 55 North America E-Commerce Packaging Market Forecast by Country, 2020-2030 (US$ billion, AGR %,)
Table 56 “V” Shaped Recovery: North America E-Commerce Packaging Market Forecast by Country, 2020-2030 (US$ billion, AGR %,)
Table 57 “U” Shaped Recovery: North America E-Commerce Packaging Market Forecast by Country, 2020-2030 (US$ billion, AGR %,)
Table 58 “W” Shaped Recovery: North America E-Commerce Packaging Market Forecast by Country, 2020-2030 (US$ billion, AGR %,)
Table 59 “L” Shaped Recovery: North America E-Commerce Packaging Market Forecast by Country, 2020-2030 (US$ billion, AGR %,)
Table 60 North America E-Commerce Packaging Market Forecast by Material, 2020-2030 (US$ billion, AGR %,)
Table 61 North America E-Commerce Packaging Market Forecast by Application, 2020-2030 (US$ billion, AGR %,)
Table 62 U.S. E-Commerce Packaging Market Forecast 2020-2030 (US$ billion, AGR %, CAGR %)
Table 63 “V” Shaped Recovery: U.S. E-Commerce Packaging Market Forecast, 2020-2030 (US$ billion, AGR %,)
Table 64 “U” Shaped Recovery: U.S. E-Commerce Packaging Market Forecast, 2020-2030 (US$ billion, AGR %,)
Table 65 “W” Shaped Recovery: U.S. E-Commerce Packaging Market Forecast, 2020-2030 (US$ billion, AGR %,)
Table 66 “L” Shaped Recovery: U.S. E-Commerce Packaging Market Forecast, 2020-2030 (US$ billion, AGR %,)
Table 67 Canada E-Commerce Packaging Market Forecast 2020-2030 (US$ billion, AGR %, CAGR %)
Table 68 “V” Shaped Recovery: Canada E-Commerce Packaging Market Forecast, 2020-2030 (US$ billion, AGR %,)
Table 69 “U” Shaped Recovery: Canada E-Commerce Packaging Market Forecast, 2020-2030 (US$ billion, AGR %,)
Table 70 “W” Shaped Recovery: Canada E-Commerce Packaging Market Forecast, 2020-2030 (US$ billion, AGR %,)
Table 71 “L” Shaped Recovery: Canada E-Commerce Packaging Market Forecast, 2020-2030 (US$ billion, AGR %,)
Table 72 Europe E-Commerce Packaging Market Forecast by Country, 2020-2030 (US$ billion, AGR %,)
Table 73 “V” Shaped Recovery: Europe E-Commerce Packaging Market Forecast by Country, 2020-2030 (US$ billion, AGR %,)
Table 74 “U” Shaped Recovery: Europe E-Commerce Packaging Market Forecast by Country, 2020-2030 (US$ billion, AGR %,)
Table 75 “W” Shaped Recovery: Europe E-Commerce Packaging Market Forecast by Country, 2020-2030 (US$ billion, AGR %,)
Table 76 “L” Shaped Recovery: Europe E-Commerce Packaging Market Forecast by Country, 2020-2030 (US$ billion, AGR %,)
Table 77 Europe E-Commerce Packaging Market Forecast by Material, 2020-2030 (US$ billion, AGR %,)
Table 78 Europe E-Commerce Packaging Market Forecast by Application, 2020-2030 (US$ billion, AGR %,)
Table 79 Germany E-Commerce Packaging Market Forecast 2020-2030 (US$ billion, AGR %, CAGR %)
Table 80 “V” Shaped Recovery: Germany E-Commerce Packaging Market Forecast, 2020-2030 (US$ billion, AGR %,)
Table 81 “U” Shaped Recovery: Germany E-Commerce Packaging Market Forecast, 2020-2030 (US$ billion, AGR %,)
Table 82 “W” Shaped Recovery: Germany E-Commerce Packaging Market Forecast, 2020-2030 (US$ billion, AGR %,)
Table 83 “L” Shaped Recovery: Germany E-Commerce Packaging Market Forecast, 2020-2030 (US$ billion, AGR %,)
Table 84 UK E-Commerce Packaging Market Forecast 2020-2030 (US$ billion, AGR %, CAGR %)
Table 85 “V” Shaped Recovery: UK E-Commerce Packaging Market Forecast, 2020-2030 (US$ billion, AGR %,)
Table 86 “U” Shaped Recovery: UK E-Commerce Packaging Market Forecast, 2020-2030 (US$ billion, AGR %,)
Table 87 “W” Shaped Recovery: UK E-Commerce Packaging Market Forecast, 2020-2030 (US$ billion, AGR %,)
Table 88 “L” Shaped Recovery: UK E-Commerce Packaging Market Forecast, 2020-2030 (US$ billion, AGR %,)
Table 89 France E-Commerce Packaging Market Forecast 2020-2030 (US$ billion, AGR %, CAGR %)
Table 90 “V” Shaped Recovery: France E-Commerce Packaging Market Forecast, 2020-2030 (US$ billion, AGR %,)
Table 91 “U” Shaped Recovery: France E-Commerce Packaging Market Forecast, 2020-2030 (US$ billion, AGR %,)
Table 92 “W” Shaped Recovery: France E-Commerce Packaging Market Forecast, 2020-2030 (US$ billion, AGR %,)
Table 93 “L” Shaped Recovery: France E-Commerce Packaging Market Forecast, 2020-2030 (US$ billion, AGR %,)
Table 94 Italy E-Commerce Packaging Market Forecast 2020-2030 (US$ billion, AGR %, CAGR %)
Table 95 “V” Shaped Recovery: Italy E-Commerce Packaging Market Forecast, 2020-2030 (US$ billion, AGR %,)
Table 96 “U” Shaped Recovery: Italy E-Commerce Packaging Market Forecast, 2020-2030 (US$ billion, AGR %,)
Table 97 “W” Shaped Recovery: Italy E-Commerce Packaging Market Forecast, 2020-2030 (US$ billion, AGR %,)
Table 98 “L” Shaped Recovery: Italy E-Commerce Packaging Market Forecast, 2020-2030 (US$ billion, AGR %,)
Table 99 Spain E-Commerce Packaging Market Forecast 2020-2030 (US$ billion, AGR %, CAGR %)
Table 100 “V” Shaped Recovery: Spain E-Commerce Packaging Market Forecast, 2020-2030 (US$ billion, AGR %,)
Table 101 “U” Shaped Recovery: Spain E-Commerce Packaging Market Forecast, 2020-2030 (US$ billion, AGR %,)
Table 102 “W” Shaped Recovery: Spain E-Commerce Packaging Market Forecast, 2020-2030 (US$ billion, AGR %,)
Table 103 “L” Shaped Recovery: Spain E-Commerce Packaging Market Forecast, 2020-2030 (US$ billion, AGR %,)
Table 104 Rest of Europe E-Commerce Packaging Market Forecast 2020-2030 (US$ billion, AGR %, CAGR %)
Table 105 “V” Shaped Recovery: Rest of Europe E-Commerce Packaging Market Forecast, 2020-2030 (US$ billion, AGR %,)
Table 106 “U” Shaped Recovery: Rest of Europe E-Commerce Packaging Market Forecast, 2020-2030 (US$ billion, AGR %,)
Table 107 “W” Shaped Recovery: Rest of Europe E-Commerce Packaging Market Forecast, 2020-2030 (US$ billion, AGR %,)
Table 108 “L” Shaped Recovery: Rest of Europe E-Commerce Packaging Market Forecast, 2020-2030 (US$ billion, AGR %,)
Table 109 Asia Pacific E-Commerce Packaging Market Forecast by Country, 2020-2030 (US$ billion, AGR %,)
Table 110 “V” Shaped Recovery: Asia Pacific E-Commerce Packaging Market Forecast by Country, 2020-2030 (US$ billion, AGR %,)
Table 111 “U” Shaped Recovery: Asia Pacific E-Commerce Packaging Market Forecast by Country, 2020-2030 (US$ billion, AGR %,)
Table 112 “W” Shaped Recovery: Asia Pacific E-Commerce Packaging Market Forecast by Country, 2020-2030 (US$ billion, AGR %,)
Table 113 “L” Shaped Recovery: Asia Pacific E-Commerce Packaging Market Forecast by Country, 2020-2030 (US$ billion, AGR %,)
Table 114 Asia Pacific E-Commerce Packaging Market Forecast by Material, 2020-2030 (US$ billion, AGR %,)
Table 115 Asia Pacific E-Commerce Packaging Market Forecast by Application, 2020-2030 (US$ billion, AGR %,)
Table 116 China E-Commerce Packaging Market Forecast 2020-2030 (US$ billion, AGR %, CAGR %)
Table 117 “V” Shaped Recovery: China E-Commerce Packaging Market Forecast, 2020-2030 (US$ billion, AGR %,)
Table 118 “U” Shaped Recovery: China E-Commerce Packaging Market Forecast, 2020-2030 (US$ billion, AGR %,)
Table 119 “W” Shaped Recovery: China E-Commerce Packaging Market Forecast, 2020-2030 (US$ billion, AGR %,)
Table 120 “L” Shaped Recovery: China E-Commerce Packaging Market Forecast, 2020-2030 (US$ billion, AGR %,)
Table 121 Japan E-Commerce Packaging Market Forecast 2020-2030 (US$ billion, AGR %, CAGR %)
Table 122 “V” Shaped Recovery: Japan E-Commerce Packaging Market Forecast, 2020-2030 (US$ billion, AGR %,)
Table 123 “U” Shaped Recovery: Japan E-Commerce Packaging Market Forecast, 2020-2030 (US$ billion, AGR %,)
Table 124 “W” Shaped Recovery: Japan E-Commerce Packaging Market Forecast, 2020-2030 (US$ billion, AGR %,)
Table 125 “L” Shaped Recovery: Japan E-Commerce Packaging Market Forecast, 2020-2030 (US$ billion, AGR %,)
Table 126 India E-Commerce Packaging Market Forecast 2020-2030 (US$ billion, AGR %, CAGR %)
Table 127 “V” Shaped Recovery: India E-Commerce Packaging Market Forecast, 2020-2030 (US$ billion, AGR %,)
Table 128 “U” Shaped Recovery: India E-Commerce Packaging Market Forecast, 2020-2030 (US$ billion, AGR %,)
Table 129 “W” Shaped Recovery: India E-Commerce Packaging Market Forecast, 2020-2030 (US$ billion, AGR %,)
Table 130 “L” Shaped Recovery: India E-Commerce Packaging Market Forecast, 2020-2030 (US$ billion, AGR %,)
Table 131 Singapore E-Commerce Packaging Market Forecast 2020-2030 (US$ billion, AGR %, CAGR %)
Table 132 “V” Shaped Recovery: Singapore E-Commerce Packaging Market Forecast, 2020-2030 (US$ billion, AGR %,)
Table 133 “U” Shaped Recovery: Singapore E-Commerce Packaging Market Forecast, 2020-2030 (US$ billion, AGR %,)
Table 134 “W” Shaped Recovery: Singapore E-Commerce Packaging Market Forecast, 2020-2030 (US$ billion, AGR %,)
Table 135 “L” Shaped Recovery: Singapore E-Commerce Packaging Market Forecast, 2020-2030 (US$ billion, AGR %,)
Table 136 Australia E-Commerce Packaging Market Forecast 2020-2030 (US$ billion, AGR %, CAGR %)
Table 137 “V” Shaped Recovery: Australia E-Commerce Packaging Market Forecast, 2020-2030 (US$ billion, AGR %,)
Table 138 “U” Shaped Recovery: Australia E-Commerce Packaging Market Forecast, 2020-2030 (US$ billion, AGR %,)
Table 139 “W” Shaped Recovery: Australia E-Commerce Packaging Market Forecast, 2020-2030 (US$ billion, AGR %,)
Table 140 “L” Shaped Recovery: Australia E-Commerce Packaging Market Forecast, 2020-2030 (US$ billion, AGR %,)
Table 141 South Korea E-Commerce Packaging Market Forecast 2020-2030 (US$ billion, AGR %, CAGR %)
Table 142 “V” Shaped Recovery: South Korea E-Commerce Packaging Market Forecast, 2020-2030 (US$ billion, AGR %,)
Table 143 “U” Shaped Recovery: South Korea E-Commerce Packaging Market Forecast, 2020-2030 (US$ billion, AGR %,)
Table 144 “W” Shaped Recovery: South Korea E-Commerce Packaging Market Forecast, 2020-2030 (US$ billion, AGR %,)
Table 145 “L” Shaped Recovery: South Korea E-Commerce Packaging Market Forecast, 2020-2030 (US$ billion, AGR %,)
Table 146 Rest of Asia Pacific E-Commerce Packaging Market Forecast 2020-2030 (US$ billion, AGR %, CAGR %)
Table 147 “V” Shaped Recovery: Rest of Asia Pacific E-Commerce Packaging Market Forecast, 2020-2030 (US$ billion, AGR %,)
Table 148 “U” Shaped Recovery: Rest of Asia Pacific E-Commerce Packaging Market Forecast, 2020-2030 (US$ billion, AGR %,)
Table 149 “W” Shaped Recovery: Rest of Asia Pacific E-Commerce Packaging Market Forecast, 2020-2030 (US$ billion, AGR %,)
Table 150 “L” Shaped Recovery: Rest of Asia Pacific E-Commerce Packaging Market Forecast, 2020-2030 (US$ billion, AGR %,)
Table 151 Latin America E-Commerce Packaging Market Forecast by Country, 2020-2030 (US$ billion, AGR %,)
Table 152 “V” Shaped Recovery: Latin America E-Commerce Packaging Market Forecast by Country, 2020-2030 (US$ billion, AGR %,)
Table 153 “U” Shaped Recovery: Latin America E-Commerce Packaging Market Forecast by Country, 2020-2030 (US$ billion, AGR %,)
Table 154 “W” Shaped Recovery: Latin America E-Commerce Packaging Market Forecast by Country, 2020-2030 (US$ billion, AGR %,)
Table 155 “L” Shaped Recovery: Latin America E-Commerce Packaging Market Forecast by Country, 2020-2030 (US$ billion, AGR %,)
Table 156 Latin America E-Commerce Packaging Market Forecast by Material, 2020-2030 (US$ billion, AGR %,)
Table 157 Latin America E-Commerce Packaging Market Forecast by Application, 2020-2030 (US$ billion, AGR %,)
Table 158 Brazil E-Commerce Packaging Market Forecast 2020-2030 (US$ billion, AGR %, CAGR %)
Table 159 “V” Shaped Recovery: Brazil E-Commerce Packaging Market Forecast, 2020-2030 (US$ billion, AGR %,)
Table 160 “U” Shaped Recovery: Brazil E-Commerce Packaging Market Forecast, 2020-2030 (US$ billion, AGR %,)
Table 161 “W” Shaped Recovery: Brazil E-Commerce Packaging Market Forecast, 2020-2030 (US$ billion, AGR %,)
Table 162 “L” Shaped Recovery: Brazil E-Commerce Packaging Market Forecast, 2020-2030 (US$ billion, AGR %,)
Table 163 Mexico E-Commerce Packaging Market Forecast 2020-2030 (US$ billion, AGR %, CAGR %)
Table 164 “V” Shaped Recovery: Mexico E-Commerce Packaging Market Forecast, 2020-2030 (US$ billion, AGR %,)
Table 165 “U” Shaped Recovery: Mexico E-Commerce Packaging Market Forecast, 2020-2030 (US$ billion, AGR %,)
Table 166 “W” Shaped Recovery: Mexico E-Commerce Packaging Market Forecast, 2020-2030 (US$ billion, AGR %,)
Table 167 “L” Shaped Recovery: Mexico E-Commerce Packaging Market Forecast, 2020-2030 (US$ billion, AGR %,)
Table 168 Argentina E-Commerce Packaging Market Forecast 2020-2030 (US$ billion, AGR %, CAGR %)
Table 169 “V” Shaped Recovery: Argentina E-Commerce Packaging Market Forecast, 2020-2030 (US$ billion, AGR %,)
Table 170 “U” Shaped Recovery: Argentina E-Commerce Packaging Market Forecast, 2020-2030 (US$ billion, AGR %,)
Table 171 “W” Shaped Recovery: Argentina E-Commerce Packaging Market Forecast, 2020-2030 (US$ billion, AGR %,)
Table 172 “L” Shaped Recovery: Argentina E-Commerce Packaging Market Forecast, 2020-2030 (US$ billion, AGR %,)
Table 173 Rest of Latin America E-Commerce Packaging Market Forecast 2020-2030 (US$ billion, AGR %, CAGR %)
Table 174 “V” Shaped Recovery: Rest of Latin America E-Commerce Packaging Market Forecast, 2020-2030 (US$ billion, AGR %,)
Table 175 “U” Shaped Recovery: Rest of Latin America E-Commerce Packaging Market Forecast, 2020-2030 (US$ billion, AGR %,)
Table 176 “W” Shaped Recovery: Rest of Latin America E-Commerce Packaging Market Forecast, 2020-2030 (US$ billion, AGR %,)
Table 177 “L” Shaped Recovery: Rest of Latin America E-Commerce Packaging Market Forecast, 2020-2030 (US$ billion, AGR %,)
Table 178 MEA E-Commerce Packaging Market Forecast by Country, 2020-2030 (US$ billion, AGR %,)
Table 179 “V” Shaped Recovery: MEA E-Commerce Packaging Market Forecast by Country, 2020-2030 (US$ billion, AGR %,)
Table 180 “U” Shaped Recovery: MEA E-Commerce Packaging Market Forecast by Country, 2020-2030 (US$ billion, AGR %,)
Table 181 “W” Shaped Recovery: MEA E-Commerce Packaging Market Forecast by Country, 2020-2030 (US$ billion, AGR %,)
Table 182 “L” Shaped Recovery: MEA E-Commerce Packaging Market Forecast by Country, 2020-2030 (US$ billion, AGR %,)
Table 183 MEA E-Commerce Packaging Market Forecast by Material, 2020-2030 (US$ billion, AGR %,)
Table 184 MEA E-Commerce Packaging Market Forecast by Application, 2020-2030 (US$ billion, AGR %,)
Table 185 GCC E-Commerce Packaging Market Forecast 2020-2030 (US$ billion, AGR %, CAGR %)
Table 186 “V” Shaped Recovery: GCC E-Commerce Packaging Market Forecast, 2020-2030 (US$ billion, AGR %,)
Table 187 “U” Shaped Recovery: GCC E-Commerce Packaging Market Forecast, 2020-2030 (US$ billion, AGR %,)
Table 188 “W” Shaped Recovery: GCC E-Commerce Packaging Market Forecast, 2020-2030 (US$ billion, AGR %,)
Table 189 “L” Shaped Recovery: GCC E-Commerce Packaging Market Forecast, 2020-2030 (US$ billion, AGR %,)
Table 190 South Africa E-Commerce Packaging Market Forecast 2020-2030 (US$ billion, AGR %, CAGR %)
Table 191 “V” Shaped Recovery: South Africa E-Commerce Packaging Market Forecast, 2020-2030 (US$ billion, AGR %,)
Table 192 “U” Shaped Recovery: South Africa E-Commerce Packaging Market Forecast, 2020-2030 (US$ billion, AGR %,)
Table 193 “W” Shaped Recovery: South Africa E-Commerce Packaging Market Forecast, 2020-2030 (US$ billion, AGR %,)
Table 194 “L” Shaped Recovery: South Africa E-Commerce Packaging Market Forecast, 2020-2030 (US$ billion, AGR %,)
Table 195 Rest of MEA E-Commerce Packaging Market Forecast 2020-2030 (US$ billion, AGR %, CAGR %)
Table 196 “V” Shaped Recovery: Rest of Middle East and Africa E-Commerce Packaging Market Forecast, 2020-2030 (US$ billion, AGR %,)
Table 197 “U” Shaped Recovery: Rest of Middle East and Africa E-Commerce Packaging Market Forecast, 2020-2030 (US$ billion, AGR %,)
Table 198 “W” Shaped Recovery: Rest of Middle East and Africa E-Commerce Packaging Market Forecast, 2020-2030 (US$ billion, AGR %,)
Table 199 “L” Shaped Recovery: Rest of Middle East and Africa E-Commerce Packaging Market Forecast, 2020-2030 (US$ billion, AGR %,)
Table 200 Amcor PLC Profile 2020 (CEO, Business Segment, HQ, Founded, No. of Employees, Website)
Table 201 Amcor Ltd.: Products/Services (Segment of Business, Product, Specification / Features)
Table 202 Amcor Ltd.: Key Developments 2015-2020 (Date, Strategy, Details)
Table 203 DS Smith PLC Profile 2020 (CEO, Business Segment, HQ, Founded, No. of Employees, Website)
Figure 193 DS Smith Plc Active, Smart and Intelligent Packaging Market Products / Services (Segment of Business, Product, Specification / Features)
Table 204 DS Smith Plc: Market Developments 2015-2019 (Date, Strategy, Details)
Table 205 Georgia-Pacific Corporation Profile 2020 (CEO, Business Segment, HQ, Founded, No. of Employees, Website)
Table 206 Georgia-Pacific Corporation: Products/Services (Product, Specification / Features)
Table 207 WestRock Company Profile 2020 (CEO, Business Segment, HQ, Founded, No. of Employees, Website)
Table 208 WestRock Company: Products/Services (Segment of Business, Product, Specification / Features)
Table 209 WestRock Company: Recent Developments 2015-2019 (Date, Strategy, Details)
Table 210 Sealed Air Profile 2020 (CEO, Business Segment, HQ, Founded, No. of Employees, Website)
Table 211 Sealed Air Packaging Products/Services (Segment of Business, Product, Specification / Features)
Table 212 International Paper Co. Profile 2020 (CEO, Business Segment, HQ, Founded, No. of Employees, Website)
Table 213 International Paper Co.: Products/Services (Product, Specification / Features)
Table 214 Ball Corporation Profile 2020 (CEO, Business Segment, HQ, Founded, No. of Employees, Website)
Table 215 Ball Corporation: Products/Services (Segment of Business, Product, Specification / Features)
Table 216 Ball Corporation: Recent Developments 2015-2019 (Date, Strategy, Details)
Table 217 Crown Holdings Inc. Profile 2020 (CEO, Business Segment, HQ, Founded, No. of Employees, Website)
Table 218 Crown Holdings Inc.: Products/Services (Segment of Business, Product, Specification / Features)
Table 219 Crown Holdings, Inc: Recent Developments 2015-2019 (Date, Strategy, Details)
Table 220 Sonoco Products Company Profile 2020 (CEO, Business Segment, HQ, Founded, No. of Employees, Website)
Table 221 Sonoco Products Company: Products/Services (Segment of Business, Product, Specification / Features)
Table 222 Sonoco Products Co.: Recent Developments 2015-2019 (Date, Strategy, Details)
Table 223 Graphic Packaging International, LLC Profile 2020 (CEO, Business Segment, HQ, Founded, No. of Employees, Website)
Table 224 Graphic Packaging International, LLC: Products/Services (Segment of Business, Specification / Features)
Table 225 Graphic Packaging Holding Co.: Market Developments 2016-2020 (Date, Strategy, Details)
List of Figures
Figure 1 Global E-Commerce Packaging Market Segmentation
Figure 2 Global E-Commerce Packaging Market: Market Trends
Figure 4 Global E-Commerce Packaging Market: SWOT Analysis
Figure 5 Porter’s Analysis
Figure 6 PEST Analysis
Figure 7 Global E-Commerce Packaging Market Forecast by Material, 2020-2030 (US$ billion, AGR%)
Figure 8 Global E-Commerce Packaging Market Share Forecast by Material, 2020, 2025, 2030 (%)
Figure 9 Global E-Commerce Packaging Market for Plastic Segment: Revenue Forecast 2020-2030 (US$ billion, AGR%)
Figure 10 “V” Shaped Recovery: Global E-Commerce Packaging Market for Plastic Segment, Revenue Forecast 2020-2030 (US$ billion, AGR%)
Figure 11 “U” Shaped Recovery: Global E-Commerce Packaging Market for Plastic Segment, Revenue Forecast 2020-2030 (US$ billion, AGR%)
Figure 12 “W” Shaped Recovery: Global E-Commerce Packaging Market for Plastic Segment, Revenue Forecast 2020-2030 (US$ billion, AGR%)
Figure 13 “L” Shaped Recovery: Global E-Commerce Packaging Market for Plastic Segment, Revenue Forecast 2020-2030 (US$ billion, AGR%)
Figure 14 Global E-Commerce Packaging Market for Corrugated Board Segment: Revenue Forecast 2020-2030 (US$ billion, AGR%)
Figure 15 “V” Shaped Recovery: Global E-Commerce Packaging Market for Corrugated Board Segment, Revenue Forecast 2020-2030 (US$ billion, AGR%)
Figure 16 “U” Shaped Recovery: Global E-Commerce Packaging Market for Corrugated Board Segment, Revenue Forecast 2020-2030 (US$ billion, AGR%)
Figure 17 “W” Shaped Recovery: Global E-Commerce Packaging Market for Corrugated Board Segment, Revenue Forecast 2020-2030 (US$ billion, AGR%)
Figure 18 “L” Shaped Recovery: Global E-Commerce Packaging Market for Corrugated Board Segment, Revenue Forecast 2020-2030 (US$ billion, AGR%)
Figure 19 Global E-Commerce Packaging Market for Paper Segment: Revenue Forecast 2020-2030 (US$ billion, AGR%)
Figure 20 “V” Shaped Recovery: Global E-Commerce Packaging Market for Paper Segment, Revenue Forecast 2020-2030 (US$ billion, AGR%)
Figure 21 “U” Shaped Recovery: Global E-Commerce Packaging Market for Paper Segment, Revenue Forecast 2020-2030 (US$ billion, AGR%)
Figure 22 “W” Shaped Recovery: Global E-Commerce Packaging Market for Paper Segment, Revenue Forecast 2020-2030 (US$ billion, AGR%)
Figure 23 “L” Shaped Recovery: Global E-Commerce Packaging Market for Paper Segment, Revenue Forecast 2020-2030 (US$ billion, AGR%)
Figure 24 Global E-Commerce Packaging Market for Others Segment: Revenue Forecast 2020-2030 (US$ billion, AGR%)
Figure 25 “V” Shaped Recovery: Global E-Commerce Packaging Market for Others Segment, Revenue Forecast 2020-2030 (US$ billion, AGR%)
Figure 26 “U” Shaped Recovery: Global E-Commerce Packaging Market for Others Segment, Revenue Forecast 2020-2030 (US$ billion, AGR%)
Figure 27 “W” Shaped Recovery: Global E-Commerce Packaging Market for Others Segment, Revenue Forecast 2020-2030 (US$ billion, AGR%)
Figure 28 “L” Shaped Recovery: Global E-Commerce Packaging Market for Others Segment, Revenue Forecast 2020-2030 (US$ billion, AGR%)
Figure 29 Global E-Commerce Packaging Market Forecast by Application, 2020-2030 (US$ billion, AGR %)
Figure 30 Global E-Commerce Packaging Market Share Forecast by Application, 2020, 2025, 2030 (%)
Figure 31 Global E-Commerce Packaging Market for Consumer Electronics Segment: Revenue Forecast 2020-2030 (US$ billion, AGR%)
Figure 32 “V” Shaped Recovery: Global E-Commerce Packaging Market for Consumer Electronics Segment, Revenue Forecast 2020-2030 (US$ billion, AGR%)
Figure 33 “U” Shaped Recovery: Global E-Commerce Packaging Market for Consumer Electronics Segment, Revenue Forecast 2020-2030 (US$ billion, AGR%)
Figure 34 “W” Shaped Recovery: Global E-Commerce Packaging Market for Consumer Electronics Segment, Revenue Forecast 2020-2030 (US$ billion, AGR%)
Figure 35 “L” Shaped Recovery: Global E-Commerce Packaging Market for Consumer Electronics Segment, Revenue Forecast 2020-2030 (US$ billion, AGR%)
Figure 36 Ecommerce fashion industry Worldwide revenue in billions of USD, AGR%
Figure 37 Global E-Commerce Packaging Market for Fashion and Apparel Segment: Revenue Forecast 2020-2030 (US$ billion, AGR%)
Figure 38 “V” Shaped Recovery: Global E-Commerce Packaging Market for Fashion and Apparel Segment, Revenue Forecast 2020-2030 (US$ billion, AGR%)
Figure 39 “U” Shaped Recovery: Global E-Commerce Packaging Market for Fashion and Apparel Segment, Revenue Forecast 2020-2030 (US$ billion, AGR%)
Figure 40 “W” Shaped Recovery: Global E-Commerce Packaging Market for Fashion and Apparel Segment, Revenue Forecast 2020-2030 (US$ billion, AGR%)
Figure 41 “L” Shaped Recovery: Global E-Commerce Packaging Market for Fashion and Apparel Segment, Revenue Forecast 2020-2030 (US$ billion, AGR%)
Figure 42 Global E-Commerce Packaging Market for Food & Beverages Segment: Revenue Forecast 2020-2030 (US$ billion, AGR%)
Figure 43 “V” Shaped Recovery: Global E-Commerce Packaging Market for Food & Beverages Segment, Revenue Forecast 2020-2030 (US$ billion, AGR%)
Figure 44 “U” Shaped Recovery: Global E-Commerce Packaging Market for Food & Beverages Segment, Revenue Forecast 2020-2030 (US$ billion, AGR%)
Figure 45 “W” Shaped Recovery: Global E-Commerce Packaging Market for Food & Beverages Segment, Revenue Forecast 2020-2030 (US$ billion, AGR%)
Figure 46 “L” Shaped Recovery: Global E-Commerce Packaging Market for Food & Beverages Segment, Revenue Forecast 2020-2030 (US$ billion, AGR%)
Figure 47 Global E-Commerce Packaging Market for Personal Care Products Segment: Revenue Forecast 2020-2030 (US$ billion, AGR%)
Figure 48 “V” Shaped Recovery: Global E-Commerce Packaging Market for Personal Care Products Segment, Revenue Forecast 2020-2030 (US$ billion, AGR%)
Figure 49 “U” Shaped Recovery: Global E-Commerce Packaging Market for Personal Care Products Segment, Revenue Forecast 2020-2030 (US$ billion, AGR%)
Figure 50 “W” Shaped Recovery: Global E-Commerce Packaging Market for Personal Care Products Segment, Revenue Forecast 2020-2030 (US$ billion, AGR%)
Figure 51 “L” Shaped Recovery: Global E-Commerce Packaging Market for Personal Care Products Segment, Revenue Forecast 2020-2030 (US$ billion, AGR%)
Figure 52 Global E-Commerce Packaging Market for Others Segment: Revenue Forecast 2020-2030 (US$ billion, AGR%)
Figure 53 “V” Shaped Recovery: Global E-Commerce Packaging Market for Others Segment, Revenue Forecast 2020-2030 (US$ billion, AGR%)
Figure 54 “U” Shaped Recovery: Global E-Commerce Packaging Market for Others Segment, Revenue Forecast 2020-2030 (US$ billion, AGR%)
Figure 55 “W” Shaped Recovery: Global E-Commerce Packaging Market for Others Segment, Revenue Forecast 2020-2030 (US$ billion, AGR%)
Figure 56 “L” Shaped Recovery: Global E-Commerce Packaging Market for Others Segment, Revenue Forecast 2020-2030 (US$ billion, AGR%)
Figure 57 Global E-Commerce Packaging Market Forecast by Region 2020-2030 (US$ billion, AGR%)
Figure 58 Global E-Commerce Packaging Market Share Forecast by Region 2020, 2025, 2030 (%)
Figure 59 North America E-Commerce Packaging Market Forecast by Country 2020-2030 (US$ billion, AGR%)
Figure 60 North America E-Commerce Packaging Market Share Forecast by Country 2020, 2025, 2030 (%)
Figure 61 North America E-Commerce Packaging Market Forecast by Material, 2020-2030 (US$ billion, AGR%)
Figure 62 North America E-Commerce Packaging Market Forecast by Application, 2020-2030 (US$ billion, AGR %)
Figure 63 Estimated US e-commerce sales
Figure 64 U.S. E-Commerce Packaging Market Forecast 2020-2030 (US$ billion, AGR %)
Figure 65 “V” Shaped Recovery: U.S. E-Commerce Packaging Market, Revenue Forecast 2020-2030 (US$ billion, AGR%)
Figure 66 “U” Shaped Recovery: U.S. E-Commerce Packaging Market, Revenue Forecast 2020-2030 (US$ billion, AGR%)
Figure 67 “W” Shaped Recovery: U.S. E-Commerce Packaging Market, Revenue Forecast 2020-2030 (US$ billion, AGR%)
Figure 68 “L” Shaped Recovery: U.S. E-Commerce Packaging Market, Revenue Forecast 2020-2030 (US$ billion, AGR%)
Figure 69 Canada E-Commerce Packaging Market Forecast 2020-2030 (US$ billion, AGR %)
Figure 70 “V” Shaped Recovery: Canada E-Commerce Packaging Market, Revenue Forecast 2020-2030 (US$ billion, AGR%)
Figure 71 “U” Shaped Recovery: Canada E-Commerce Packaging Market, Revenue Forecast 2020-2030 (US$ billion, AGR%)
Figure 72 “W” Shaped Recovery: Canada E-Commerce Packaging Market, Revenue Forecast 2020-2030 (US$ billion, AGR%)
Figure 73 “L” Shaped Recovery: Canada E-Commerce Packaging Market, Revenue Forecast 2020-2030 (US$ billion, AGR%)
Figure 74 Europe E-Commerce Packaging Market Forecast by Country 2020-2030 (US$ billion, AGR%)
Figure 75 Europe E-Commerce Packaging Market Share Forecast by Country 2020, 2025, 2030 (%)
Figure 76 Europe E-Commerce Packaging Market Forecast by Material, 2020-2030 (US$ billion, AGR%)
Figure 77 Europe E-Commerce Packaging Market Forecast by Application, 2020-2030 (US$ billion)
Figure 78 Germany E-Commerce Packaging Market Forecast 2020-2030 (US$ billion, AGR %)
Figure 79 “V” Shaped Recovery: Germany E-Commerce Packaging Market, Revenue Forecast 2020-2030 (US$ billion, AGR%)
Figure 80 “U” Shaped Recovery: Germany E-Commerce Packaging Market, Revenue Forecast 2020-2030 (US$ billion, AGR%)
Figure 81 “W” Shaped Recovery: Germany E-Commerce Packaging Market, Revenue Forecast 2020-2030 (US$ billion, AGR%)
Figure 82 “L” Shaped Recovery: Germany E-Commerce Packaging Market, Revenue Forecast 2020-2030 (US$ billion, AGR%)
Figure 83 UK E-Commerce Packaging Market Forecast 2020-2030 (US$ billion, AGR %)
Figure 84 “V” Shaped Recovery: UK E-Commerce Packaging Market, Revenue Forecast 2020-2030 (US$ billion, AGR%)
Figure 85 “U” Shaped Recovery: UK E-Commerce Packaging Market, Revenue Forecast 2020-2030 (US$ billion, AGR%)
Figure 86 “W” Shaped Recovery: UK E-Commerce Packaging Market, Revenue Forecast 2020-2030 (US$ billion, AGR%)
Figure 87 “L” Shaped Recovery: UK E-Commerce Packaging Market, Revenue Forecast 2020-2030 (US$ billion, AGR%)
Figure 88 France E-Commerce Packaging Market Forecast 2020-2030 (US$ billion, AGR %)
Figure 89 “V” Shaped Recovery: France E-Commerce Packaging Market, Revenue Forecast 2020-2030 (US$ billion, AGR%)
Figure 90 “U” Shaped Recovery: France E-Commerce Packaging Market, Revenue Forecast 2020-2030 (US$ billion, AGR%)
Figure 91 “W” Shaped Recovery: France E-Commerce Packaging Market, Revenue Forecast 2020-2030 (US$ billion, AGR%)
Figure 92 “L” Shaped Recovery: France E-Commerce Packaging Market, Revenue Forecast 2020-2030 (US$ billion, AGR%)
Figure 93 Italy E-Commerce Packaging Market Forecast 2020-2030 (US$ billion, AGR %)
Figure 94 “V” Shaped Recovery: Italy E-Commerce Packaging Market, Revenue Forecast 2020-2030 (US$ billion, AGR%)
Figure 95 “U” Shaped Recovery: Italy E-Commerce Packaging Market, Revenue Forecast 2020-2030 (US$ billion, AGR%)
Figure 96 “W” Shaped Recovery: Italy E-Commerce Packaging Market, Revenue Forecast 2020-2030 (US$ billion, AGR%)
Figure 97 “L” Shaped Recovery: Italy E-Commerce Packaging Market, Revenue Forecast 2020-2030 (US$ billion, AGR%)
Figure 98 Spain E-Commerce Packaging Market Forecast 2020-2030 (US$ billion, AGR %)
Figure 99 “V” Shaped Recovery: Spain E-Commerce Packaging Market, Revenue Forecast 2020-2030 (US$ billion, AGR%)
Figure 100 “U” Shaped Recovery: Spain E-Commerce Packaging Market, Revenue Forecast 2020-2030 (US$ billion, AGR%)
Figure 101 “W” Shaped Recovery: Spain E-Commerce Packaging Market, Revenue Forecast 2020-2030 (US$ billion, AGR%)
Figure 102 “L” Shaped Recovery: Spain E-Commerce Packaging Market, Revenue Forecast 2020-2030 (US$ billion, AGR%)
Figure 103 Rest of Europe E-Commerce Packaging Market Forecast 2020-2030 (US$ billion, AGR %)
Figure 104 “V” Shaped Recovery: Rest of Europe E-Commerce Packaging Market, Revenue Forecast 2020-2030 (US$ billion, AGR%)
Figure 105 “U” Shaped Recovery: Rest of Europe E-Commerce Packaging Market, Revenue Forecast 2020-2030 (US$ billion, AGR%)
Figure 106 “W” Shaped Recovery: Rest of Europe E-Commerce Packaging Market, Revenue Forecast 2020-2030 (US$ billion, AGR%)
Figure 107 “L” Shaped Recovery: Rest of Europe E-Commerce Packaging Market, Revenue Forecast 2020-2030 (US$ billion, AGR%)
Figure 108 Asia Pacific E-Commerce Packaging Market Forecast by Country 2020-2030 (US$ billion, AGR%)
Figure 109 Asia Pacific E-Commerce Packaging Market Share Forecast by Country 2020, 2025, 2030 (%)
Figure 110 Asia Pacific E-Commerce Packaging Market Forecast by Material, 2020-2030 (US$ billion, AGR%)
Figure 111 Asia Pacific E-Commerce Packaging Market Forecast by Application, 2020-2030 (US$ billion, AGR%)
Figure 112 China E-Commerce Packaging Market Forecast 2020-2030 (US$ billion, AGR %)
Figure 113 “V” Shaped Recovery: China E-Commerce Packaging Market, Revenue Forecast 2020-2030 (US$ billion, AGR%)
Figure 114 “U” Shaped Recovery: China E-Commerce Packaging Market, Revenue Forecast 2020-2030 (US$ billion, AGR%)
Figure 115 “W” Shaped Recovery: China E-Commerce Packaging Market, Revenue Forecast 2020-2030 (US$ billion, AGR%)
Figure 116 “L” Shaped Recovery: China E-Commerce Packaging Market, Revenue Forecast 2020-2030 (US$ billion, AGR%)
Figure 117 Japan E-Commerce Packaging Market Forecast 2020-2030 (US$ billion, AGR %)
Figure 118 “V” Shaped Recovery: Japan E-Commerce Packaging Market, Revenue Forecast 2020-2030 (US$ billion, AGR%)
Figure 119 “U” Shaped Recovery: Japan E-Commerce Packaging Market, Revenue Forecast 2020-2030 (US$ billion, AGR%)
Figure 120 “W” Shaped Recovery: Japan E-Commerce Packaging Market, Revenue Forecast 2020-2030 (US$ billion, AGR%)
Figure 121 “L” Shaped Recovery: Japan E-Commerce Packaging Market, Revenue Forecast 2020-2030 (US$ billion, AGR%)
Figure 122 India E-Commerce Packaging Market Forecast 2020-2030 (US$ billion, AGR %)
Figure 123 “V” Shaped Recovery: India E-Commerce Packaging Market, Revenue Forecast 2020-2030 (US$ billion, AGR%)
Figure 124 “U” Shaped Recovery: India E-Commerce Packaging Market, Revenue Forecast 2020-2030 (US$ billion, AGR%)
Figure 125 “W” Shaped Recovery: India E-Commerce Packaging Market, Revenue Forecast 2020-2030 (US$ billion, AGR%)
Figure 126 “L” Shaped Recovery: India E-Commerce Packaging Market, Revenue Forecast 2020-2030 (US$ billion, AGR%)
Figure 127 Singapore E-Commerce Packaging Market Forecast 2020-2030 (US$ billion, AGR %)
Figure 128 “V” Shaped Recovery: Singapore E-Commerce Packaging Market, Revenue Forecast 2020-2030 (US$ billion, AGR%)
Figure 129 “U” Shaped Recovery: Singapore E-Commerce Packaging Market, Revenue Forecast 2020-2030 (US$ billion, AGR%)
Figure 130 “W” Shaped Recovery: Singapore E-Commerce Packaging Market, Revenue Forecast 2020-2030 (US$ billion, AGR%)
Figure 131 “L” Shaped Recovery: Singapore E-Commerce Packaging Market, Revenue Forecast 2020-2030 (US$ billion, AGR%)
Figure 132 Australia E-Commerce Packaging Market Forecast 2020-2030 (US$ billion, AGR %)
Figure 133 “V” Shaped Recovery: Australia E-Commerce Packaging Market, Revenue Forecast 2020-2030 (US$ billion, AGR%)
Figure 134 “U” Shaped Recovery: Australia E-Commerce Packaging Market, Revenue Forecast 2020-2030 (US$ billion, AGR%)
Figure 135 “W” Shaped Recovery: Australia E-Commerce Packaging Market, Revenue Forecast 2020-2030 (US$ billion, AGR%)
Figure 136 “L” Shaped Recovery: Australia E-Commerce Packaging Market, Revenue Forecast 2020-2030 (US$ billion, AGR%)
Figure 137 South Korea E-Commerce Packaging Market Forecast 2020-2030 (US$ billion, AGR %)
Figure 138 “V” Shaped Recovery: South Korea E-Commerce Packaging Market, Revenue Forecast 2020-2030 (US$ billion, AGR%)
Figure 139 “U” Shaped Recovery: South Korea E-Commerce Packaging Market, Revenue Forecast 2020-2030 (US$ billion, AGR%)
Figure 140 “W” Shaped Recovery: South Korea E-Commerce Packaging Market, Revenue Forecast 2020-2030 (US$ billion, AGR%)
Figure 141 “L” Shaped Recovery: South Korea E-Commerce Packaging Market, Revenue Forecast 2020-2030 (US$ billion, AGR%)
Figure 142 Rest of Asia Pacific E-Commerce Packaging Market Forecast 2020-2030 (US$ billion, AGR %)
Figure 143 “V” Shaped Recovery: Rest of Asia Pacific E-Commerce Packaging Market, Revenue Forecast 2020-2030 (US$ billion, AGR%)
Figure 144 “U” Shaped Recovery: Rest of Asia Pacific E-Commerce Packaging Market, Revenue Forecast 2020-2030 (US$ billion, AGR%)
Figure 145 “W” Shaped Recovery: Rest of Asia Pacific E-Commerce Packaging Market, Revenue Forecast 2020-2030 (US$ billion, AGR%)
Figure 146 “L” Shaped Recovery: Rest of Asia Pacific E-Commerce Packaging Market, Revenue Forecast 2020-2030 (US$ billion, AGR%)
Figure 147 Latin America E-Commerce Packaging Market Forecast by Country 2020-2030 (US$ billion, AGR%)
Figure 148 Latin America E-Commerce Packaging Market Share Forecast by Country 2020, 2025, 2030 (%)
Figure 149 Latin America E-Commerce Packaging Market Forecast by Material, 2020-2030 (US$ billion, AGR %)
Figure 150 Latin America E-Commerce Packaging Market Forecast by Application, 2020-2030 (US$ billion, AGR%)
Figure 151 Brazil E-Commerce Packaging Market Forecast 2020-2030 (US$ billion, AGR %)
Figure 152 “V” Shaped Recovery: Brazil E-Commerce Packaging Market, Revenue Forecast 2020-2030 (US$ billion, AGR%)
Figure 153 “U” Shaped Recovery: Brazil E-Commerce Packaging Market, Revenue Forecast 2020-2030 (US$ billion, AGR%)
Figure 154 “W” Shaped Recovery: Brazil E-Commerce Packaging Market, Revenue Forecast 2020-2030 (US$ billion, AGR%)
Figure 155 “L” Shaped Recovery: Brazil E-Commerce Packaging Market, Revenue Forecast 2020-2030 (US$ billion, AGR%)
Figure 156 Mexico E-Commerce Packaging Market Forecast 2020-2030 (US$ billion, AGR %)
Figure 157 “V” Shaped Recovery: Mexico E-Commerce Packaging Market, Revenue Forecast 2020-2030 (US$ billion, AGR%)
Figure 158 “U” Shaped Recovery: Mexico E-Commerce Packaging Market, Revenue Forecast 2020-2030 (US$ billion, AGR%)
Figure 159 “W” Shaped Recovery: Mexico E-Commerce Packaging Market, Revenue Forecast 2020-2030 (US$ billion, AGR%)
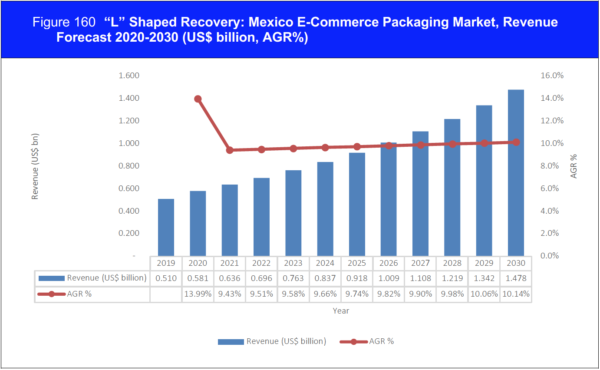
Figure 160 “L” Shaped Recovery: Mexico E-Commerce Packaging Market, Revenue Forecast 2020-2030 (US$ billion, AGR%)
Figure 161 Argentina E-Commerce Packaging Market Forecast 2020-2030 (US$ billion, AGR %)
Figure 162 “V” Shaped Recovery: Argentina E-Commerce Packaging Market, Revenue Forecast 2020-2030 (US$ billion, AGR%)
Figure 163 “U” Shaped Recovery: Argentina E-Commerce Packaging Market, Revenue Forecast 2020-2030 (US$ billion, AGR%)
Figure 164 “W” Shaped Recovery: Argentina E-Commerce Packaging Market, Revenue Forecast 2020-2030 (US$ billion, AGR%)
Figure 165 “L” Shaped Recovery: Argentina E-Commerce Packaging Market, Revenue Forecast 2020-2030 (US$ billion, AGR%)
Figure 166 Rest of Latin America E-Commerce Packaging Market Forecast 2020-2030 (US$ billion, AGR %)
Figure 167 “V” Shaped Recovery: Rest of Latin America E-Commerce Packaging Market, Revenue Forecast 2020-2030 (US$ billion, AGR%)
Figure 168 “U” Shaped Recovery: Rest of Latin America E-Commerce Packaging Market, Revenue Forecast 2020-2030 (US$ billion, AGR%)
Figure 169 “W” Shaped Recovery: Rest of Latin America E-Commerce Packaging Market, Revenue Forecast 2020-2030 (US$ billion, AGR%)
Figure 170 “L” Shaped Recovery: Rest of Latin America E-Commerce Packaging Market, Revenue Forecast 2020-2030 (US$ billion, AGR%)
Figure 171 E-commerce penetration as percentage of total retail sales, 2019
Figure 172 MEA E-Commerce Packaging Market Forecast by Country 2020-2030 (US$ billion, AGR%)
Figure 173 MEA E-Commerce Packaging Market Share Forecast by Country 2020, 2025, 2030 (%)
Figure 174 MEA E-Commerce Packaging Market Forecast by Material, 2020-2030 (US$ billion, AGR%)
Figure 175 MEA E-Commerce Packaging Market Forecast by Application, 2020-2030 (US$ billion, AGR%)
Figure 176 GCC E-Commerce Packaging Market Forecast 2020-2030 (US$ billion, AGR %)
Figure 177 “V” Shaped Recovery: GCC E-Commerce Packaging Market, Revenue Forecast 2020-2030 (US$ billion, AGR%)
Figure 178 “U” Shaped Recovery: GCC E-Commerce Packaging Market, Revenue Forecast 2020-2030 (US$ billion, AGR%)
Figure 179 “W” Shaped Recovery: GCC E-Commerce Packaging Market, Revenue Forecast 2020-2030 (US$ billion, AGR%)
Figure 180 “L” Shaped Recovery: GCC E-Commerce Packaging Market, Revenue Forecast 2020-2030 (US$ billion, AGR%)
Figure 181 South Africa E-Commerce Packaging Market Forecast 2020-2030 (US$ billion, AGR %)
Figure 182 “V” Shaped Recovery: South Africa E-Commerce Packaging Market, Revenue Forecast 2020-2030 (US$ billion, AGR%)
Figure 183 “U” Shaped Recovery: South Africa E-Commerce Packaging Market, Revenue Forecast 2020-2030 (US$ billion, AGR%)
Figure 184 “W” Shaped Recovery: South Africa E-Commerce Packaging Market, Revenue Forecast 2020-2030 (US$ billion, AGR%)
Figure 185 “L” Shaped Recovery: South Africa E-Commerce Packaging Market, Revenue Forecast 2020-2030 (US$ billion, AGR%)
Figure 186 Rest of MEA E-Commerce Packaging Market Forecast 2020-2030 (US$ billion, AGR %)
Figure 187 “V” Shaped Recovery: Rest of Middle East and Africa E-Commerce Packaging Market, Revenue Forecast 2020-2030 (US$ billion, AGR%)
Figure 188 “U” Shaped Recovery: Rest of Middle East and Africa E-Commerce Packaging Market, Revenue Forecast 2020-2030 (US$ billion, AGR%)
Figure 189 “W” Shaped Recovery: Rest of Middle East and Africa E-Commerce Packaging Market, Revenue Forecast 2020-2030 (US$ billion, AGR%)
Figure 190 “L” Shaped Recovery: Rest of Middle East and Africa E-Commerce Packaging Market, Revenue Forecast 2020-2030 (US$ billion, AGR%)
Figure 191 Amcor PLC : Company Financials (2015-2019)
Figure 192 DS Smith PLC : Company Financials (2015-2018)
Figure 194 WestRock Company : Company Financials (2015-2019)
Figure 195 Sealed Air : Company Financials (2015-2019)
Figure 196 International Paper Co. : Company Financials (2015-2019)
Figure 197 Ball Corporation : Company Financials (2015-2019)
Figure 198 Crown Holdings Inc. : Company Financials (2015-2019)
Figure 199 Sonoco Products Company : Company Financials (2015-2019)
Figure 200 Graphic Packaging International, LLC : Company Financials (2015-2019)