Industries > Packaging > Caps & Closures Market Report 2021-2031

Caps & Closures Market Report 2021-2031
Forecasts by Material (Plastics (Screw-On Caps, Dispensing Caps, Liquid Carton Closures, Plastic Lotion Pumps, Plastic Aerosol Sprays), Metals (Roll-On Pilfer-Proof Caps, Easy-Open Can Ends, Non-Refillable Closures, Crown Caps, Metal Lug Closures), Corks (Rubber Stoppers, Glass Stoppers, Other Products), by Application (Alcoholic Beverages (Beer, Wine, Other Alcoholic Beverages), Non-Alcoholic Beverages (Bottled Water, Carbonated Soft Drinks, Non-Carbonated Soft Drinks, Juices & Health Drinks, Dairy Drinks), Food, Healthcare, Other Applications), by Distribution Channel (Online and Offline) and Leading Regional/Country market analysis. PLUS Analysis of Leading Caps & Closures Companies AND COVID-19 Recovery Scenarios
Caps & Closures Market–our new study reveals trends, R&D progress, and predicted revenues
Where is the Caps & Closures market heading TODAY?
How this unique in-depth Caps & Closures Market report helps you
This exclusive 410+ page report delivers to you essential market information
• Revenue forecasts to 2031 for Caps & Closures Market, with forecasts for Product, Application and Distribution Channel,
• Each element forecasted at a global, regional and country level
• Discover which country has the best prospects for increased growth while we tell you the most lucrative places for investments and revenues
This one-off report gives you
• Revenue forecasts to 2031 for the Key-5 regional and Key-9 national markets
This report tells you TODAY how the Caps & Closures Market market will develop in the next 10 years, and in-line with the variations in COVID-19 economic recession and bounce. This market is more critical now than at any point over the last 10 years and is NOT AVAILABLE ANYWHERE ELSE
UNIQUE COVID-19 VARIATIONS– only available in this Visiongain report are dedicated analysis of 4 different rebound scenarios of how the market will develop – no matter how COVID-19 affects the economy.
To access the data contained in this document please email contactus@visiongain.com
Discover how to stay ahead
Our 416-page report provides 350 tables and 297 charts/graphs.
Forecasts to 2031 and other analyses reveal the commercial prospects
• In addition to revenue forecasting to 2031, our new study provides you with recent results, growth rates, and market shares.
• You find original analyses, with business outlooks and developments.
• Discover qualitative analyses including market dynamics, (drivers, opportunities, restraints and challenges), SWOT Analysis, Porters Five Forces Analysis, PEST Analysis, Value Chain Analysis and Covid 19 impact analysis.
Discover sales predictions for the world market and submarkets
Caps & Closures: Product
• Plastic:
• Screw-On Caps
• Dispensing Caps
• Liquid Carton Closures
• Plastic Lotion Pumps
• Plastic Aerosol Sprays
• Metal:
• Roll-On Pilfer-Proof Caps
• Easy-Open Can Ends
• Non-Refillable Closures
• Crown Caps
• Metal Lug Closures
• Corks
• Rubber Stoppers
• Glass Stoppers
• Other Products
Caps & Closures: Application
• Alcoholic Beverages:
• Beer
• Wine
• Other Alcoholic Beverages
• Non-Alcoholic Beverages:
• Bottled Water
• Carbonated Soft Drinks
• Non-Carbonated Soft Drinks
• Juices & Health Drinks
• Dairy Drinks
• Food
• Healthcare
• Other Applications
Caps & Closures: Distribution Channel
• Online
• Offline

In addition to the revenue predictions for the overall world market and segments, you will also find revenue forecasts for 5 regional and 7 leading national markets:
• North America:
• U.S.
• Rest of North America
• Europe:
• Germany
• United Kingdom
• Rest of Europe
• Asia Pacific:
• China
• India
• Rest of Asia Pacific
• Rest of the World
Need industry data? Please contact us today.
The report also includes profiles and for some of the leading companies in the Caps & Closures Market, with a focus on this segment of these companies’ operations.
Leading companies and the potential for market growth
Overall world revenue for Caps & Closures Market will surpass $xx billion in 2021, our work calculates. We predict strong revenue growth through to 2031.
Our work identifies which organizations hold the greatest potential. Discover their capabilities, progress, and commercial prospects, helping you stay ahead.
• Prospects for established firms and those seeking to enter the market– including company profiles for 15 of the major companies involved in the Caps & Closures Market. Some of the company’s profiled in this report includes Amcor Ltd., AptarGroup Inc., Ball Corporation, BASF SE, Crow Holdings Inc., and DS Smith Plc.
Find quantitative and qualitative analyses with independent predictions. Receive information that only our report contains, staying informed with this invaluable business intelligence.
Information found nowhere else
With our newly report title, you are less likely to fall behind in knowledge or miss out on opportunities. See how our work could benefit your research, analyses, and decisions.
Visiongain’s study is for everybody needing commercial analyses for the Caps & Closures Market and leading companies. You will find data, trends and predictions.
To access the data contained in this document please email contactus@visiongain.com
Buy our report today Global Caps & Closures Market Analysis: Forecasts by Material (Plastics (Screw-On Caps, Dispensing Caps, Liquid Carton Closures, Plastic Lotion Pumps, Plastic Aerosol Sprays), Metals (Roll-On Pilfer-Proof Caps, Easy-Open Can Ends, Non-Refillable Closures, Crown Caps, Metal Lug Closures), Corks (Rubber Stoppers, Glass Stoppers, Other Products), by Application (Alcoholic Beverages (Beer, Wine, Other Alcoholic Beverages), Non-Alcoholic Beverages (Bottled Water, Carbonated Soft Drinks, Non-Carbonated Soft Drinks, Juices & Health Drinks, Dairy Drinks), Food, Healthcare, Other Applications), by Distribution Channel (Online and Offline) and Leading Regional/Country market analysis. PLUS Analysis of Leading Caps & Closures Companies AND COVID-19 Recovery Scenarios. Avoid missing out by staying informed – order our report now.
Visiongain is a trading partner with the US Federal Government
CCR Ref number: KD4R6
Do you have any custom requirements we can help you with? Any need for a specific country, geo region, market segment or specific company information? Contact us today, we can discuss your needs and see how we can help: sara.peerun@visiongain.com
1. Report Overview
1.1. Global Caps & Closures Market Overview
1.1.1. Global Caps & Closures Market Segmentation
1.1.2. Caps & Closures Market Definition
1.1.3. Definition of Products
1.1.4. Definition of Distribution Channel
1.2. Why You Should Read This Report
1.3. What This Report Delivers
1.4. Key Questions Answered By This Analytical Report Include:
1.5. Who is This Report For?
1.6. Methodology
1.7. Frequently Asked Questions (FAQs)
1.8. Associated Visiongain Reports
1.9. About Visiongain
2. Executive Summary
3. Global Caps & Closures Market Outlook
3.1. Market Trend Analysis
3.1.1. Drivers
3.1.1.1. Demand from Non-alcoholic Beverages Industries
3.1.1.2. Advancement in Logistic Industry
3.1.1.3. Increasing Demand of Long Shelf Life Food and Beverage
3.1.2. Restraint
3.1.2.1. Complexity of Raw Material Purchase
3.1.3. Opportunity
3.1.3.1. Demand of Caps and Closures in Pharmaceutical Segment
3.1.3.2. Development of New Products
3.2. SWOT Analysis
3.3. Industry analysis - Porter’s
3.4. PEST Analysis
3.5. Value Chain Analysis
3.6. Covid-19 Impact Analysis
4. Global Caps & Closures Market Size Forecast 2021-2031 by Material: Plastic material accounted for largest market share
(Pre COVID and V, U, W and L COVID recovery scenarios)
4.1. Material Submarket 2021-2031: Rubber Stopper segment will grow with a fastest pace
(Pre COVID and V, U, W and L COVID recovery scenarios)
4.1.1. Screw-On Caps: Keep beverage bottle better sealed to prevent oxidation
(Pre COVID and V, U, W and L COVID recovery scenarios)
4.1.2. Dispensing Caps: Maximum freedom of product design
(Pre COVID and V, U, W and L COVID recovery scenarios)
4.1.3. Liquid Carton Closures: Light weight, extended shelf life and biodegradable property
(Pre COVID and V, U, W and L COVID recovery scenarios)
4.1.4. Plastic Lotion Pumps: It has higher usage for viscus liquid
(Pre COVID and V, U, W and L COVID recovery scenarios)
4.1.5. Plastic Aerosol Sprays: Majorly used for pharmaceutical medicine
(Pre COVID and V, U, W and L COVID recovery scenarios)
4.2. Metal Submarket 2021-2031: Roll on pilfer proof cap stopper segment will grow with a fastest pace
(Pre COVID and V, U, W and L COVID recovery scenarios)
4.2.1. Roll-On Pilfer-Proof Caps: It have threading which engages with bottle finish during cap application
(Pre COVID and V, U, W and L COVID recovery scenarios)
4.2.2. Easy-Open Can Ends: Popular among disposable packaging
(Pre COVID and V, U, W and L COVID recovery scenarios)
4.2.3. Non-Refillable Closures: Requirement of tamper-proof closure has increased
(Pre COVID and V, U, W and L COVID recovery scenarios)
4.2.4. Crown Caps: Usage for medical devices
(Pre COVID and V, U, W and L COVID recovery scenarios)
4.2.5. Metal Lug Closures: Increased usage in glass bottle and jars
(Pre COVID and V, U, W and L COVID recovery scenarios)
4.3. Corks Submarket 2021-2031: Rubber Stopper segment will grow with a fastest pace
(Pre COVID and V, U, W and L COVID recovery scenarios)
4.4. Rubber Stoppers Submarket 2021-2031: It is flexible and compressible
(Pre COVID and V, U, W and L COVID recovery scenarios)
4.5. Glass Stoppers Submarket 2021-2031: Help in oxidization food or beverage which is packaged
(Pre COVID and V, U, W and L COVID recovery scenarios)
4.6. Other Materials Submarket 2021-2031: Key metal considered under this segment is ceramic caps
(Pre COVID and V, U, W and L COVID recovery scenarios)
5. Global Caps & Closures Market Size Forecast 2021-2031 by Application: Non-Alcoholic Beverages accounted for largest market share
(Pre COVID and V, U, W and L COVID recovery scenarios)
5.1. Alcoholic Beverages Submarket 2021-2031: Beer segment will grow with a fastest pace
(Pre COVID and V, U, W and L COVID recovery scenarios)
5.1.1. Beer: It is the widely consumer alcoholic beverage where caps and closure is a major part
(Pre COVID and V, U, W and L COVID recovery scenarios)
5.1.2. Wine: Requirement of this application is growing at a higher pace
(Pre COVID and V, U, W and L COVID recovery scenarios)
5.1.3. Other Alcoholic Beverages: This segment includes whisky, vodka and other alcoholic beverages
(Pre COVID and V, U, W and L COVID recovery scenarios)
5.2. Non-Alcoholic Beverages Submarket 2021-2031: Bottled Water cap stopper segment will grow with a fastest pace
(Pre COVID and V, U, W and L COVID recovery scenarios)
5.2.1. Bottled Water: It is highest usable cap and closure application
(Pre COVID and V, U, W and L COVID recovery scenarios)
5.2.2. Carbonated Soft Drinks: Carbonated water and other types of soda can help relieve the stomach of aches which improve product usage
(Pre COVID and V, U, W and L COVID recovery scenarios)
5.2.3. Non-Carbonated Soft Drinks: It includes include fruit punch, fruit drinks, ice tea, coffee with sugar, and sport drinks
(Pre COVID and V, U, W and L COVID recovery scenarios)
5.2.4. Juices & Health Drinks: Increasing health awareness of this product is driving the market growth
(Pre COVID and V, U, W and L COVID recovery scenarios)
5.2.5. Dairy Drinks: Milk is the largest used application in dairy segment
(Pre COVID and V, U, W and L COVID recovery scenarios)
5.3. Food Submarket 2021-2031: Global food packaging market will grow with a fastest pace
(Pre COVID and V, U, W and L COVID recovery scenarios)
5.4. Healthcare Submarket 2021-2031: Increasing demand in developing economies
(Pre COVID and V, U, W and L COVID recovery scenarios)
5.5. Other Applications Submarket 2021-2031: This includes chemical, cosmetics, toiletry and automotive industry
(Pre COVID and V, U, W and L COVID recovery scenarios)
6. Global Caps & Closures Market Size Forecast 2021-2031 by Distribution Channel: Offline accounted for largest market share
(Pre COVID and V, U, W and L COVID recovery scenarios)
6.1. Online distribution channel Submarket 2021-2031: Fastest growing distribution channel
(Pre COVID and V, U, W and L COVID recovery scenarios)
6.2. Offline distribution channel Submarket 2021-2031: Accounted for largest market share
(Pre COVID and V, U, W and L COVID recovery scenarios)
7. Regional and Leading National Caps & Closures Market Forecasts 2021-2031
North America expected to hold the largest market share
(Pre COVID and V, U, W and L COVID recovery scenarios)
7.1. North America Material Submarket 2021-2031: U.S. is the market leader in North America region
(Pre COVID and V, U, W and L COVID recovery scenarios)
7.2. North America Application Submarket 2021-2031: Bottled water is the largest application in North America
(Pre COVID and V, U, W and L COVID recovery scenarios)
7.3. North America Distribution Channel Submarket 2021-2031: Demand of online product is increasing in packaging industry
(Pre COVID and V, U, W and L COVID recovery scenarios)
7.3.1. U.S. Material Submarket 2021-2031: Investment in plastic material
(Pre COVID and V, U, W and L COVID recovery scenarios)
7.3.2. U.S. Application Submarket 2021-2031: Consumption of non-alcoholic beverage is higher
(Pre COVID and V, U, W and L COVID recovery scenarios)
7.3.3. U.S. Distribution Channel Submarket 2021-2031: Hypermarket and supermarket sale most of the caps and closure
(Pre COVID and V, U, W and L COVID recovery scenarios)
7.3.4. Rest of the North America Material Submarket 2021-2031: Improved market share of key players for metal material
(Pre COVID and V, U, W and L COVID recovery scenarios)
7.3.5. Rest of the North America Application Submarket 2021-2031: Beer alcoholic segment will boost the market demand
(Pre COVID and V, U, W and L COVID recovery scenarios)
7.3.6. Rest of the North America Distribution Channel Submarket 2021-2031: Offline sale most of the caps and closure
(Pre COVID and V, U, W and L COVID recovery scenarios)
7.4. Europe Material Submarket 2021-2031: Germany is the market leader in Europe region
(Pre COVID and V, U, W and L COVID recovery scenarios)
7.5. Europe Application Submarket 2021-2031: Dispensing Caps are used with push pump or trigger sprays in Europe
(Pre COVID and V, U, W and L COVID recovery scenarios)
7.6. Europe Distribution Channel Submarket 2021-2031: Dispensing Caps are ideal for controlled amounts of liquid
(Pre COVID and V, U, W and L COVID recovery scenarios)
7.6.1. Germany Material Submarket 2021-2031: Investment in plastic material
(Pre COVID and V, U, W and L COVID recovery scenarios)
7.6.2. Germany Application Submarket 2021-2031: Consumption of non-alcoholic beverage is higher
(Pre COVID and V, U, W and L COVID recovery scenarios)
7.6.3. Germany Distribution Channel Submarket 2021-2031: Online segment is growing with a higher pace
(Pre COVID and V, U, W and L COVID recovery scenarios)
7.6.4. U.K. Material Submarket 2021-2031: Here caps and closures are available in a lesser price which drives its market growth
(Pre COVID and V, U, W and L COVID recovery scenarios)
7.6.5. U.K. Application Submarket 2021-2031: Beverage manufacturer prefer to use this product type in plastic bottle or tetra packs
(Pre COVID and V, U, W and L COVID recovery scenarios)
7.6.6. U.K. Distribution Channel Submarket 2021-2031: Close sales through online is increasing at a higher pace
(Pre COVID and V, U, W and L COVID recovery scenarios)
7.6.7. Rest of the Europe Material Submarket 2021-2031: industrial usage also has significant demand of plastic closures
(Pre COVID and V, U, W and L COVID recovery scenarios)
7.6.8. Rest of the Europe Application Submarket 2021-2031: Usage of recreational drug ethanol, a type of alcohol produced by fermentation of grains
(Pre COVID and V, U, W and L COVID recovery scenarios)
7.6.9. Rest of the Europe Distribution Channel Submarket 2021-2031: Improvement in alcoholic closure sales through direct sales channel
7.6.10. (Pre COVID and V, U, W and L COVID recovery scenarios)
7.7. Asia Pacific Material Submarket 2021-2031: China is the market leader in Asia Pacific region
(Pre COVID and V, U, W and L COVID recovery scenarios)
7.8. Asia Pacific Application Submarket 2021-2031: the adoption of modern and advanced packaging
(Pre COVID and V, U, W and L COVID recovery scenarios)
7.9. Asia Pacific Distribution Channel Submarket 2021-2031: Caps & closures manufactured from blended products will sales through online channel
(Pre COVID and V, U, W and L COVID recovery scenarios)
7.9.1. China Material Submarket 2021-2031: plastic accounted for major market share
(Pre COVID and V, U, W and L COVID recovery scenarios)
7.9.2. China Application Submarket 2021-2031: Fruit juice caps and closure will have a higher demand
(Pre COVID and V, U, W and L COVID recovery scenarios)
7.9.3. China Distribution Channel Submarket 2021-2031: Online distribution channel is growing with a higher pace
(Pre COVID and V, U, W and L COVID recovery scenarios)
7.9.4. India Material Submarket 2021-2031: Increasing demand from food and beverage segment
(Pre COVID and V, U, W and L COVID recovery scenarios)
7.9.5. India Application Submarket 2021-2031: non-alcoholic beverage segment is accounted for largest market demand
(Pre COVID and V, U, W and L COVID recovery scenarios)
7.9.6. India Distribution Channel Submarket 2021-2031: Close sales through online is increasing at a higher pace
(Pre COVID and V, U, W and L COVID recovery scenarios)
7.9.7. Rest of the Asia Pacific Material Submarket 2021-2031: Improving spending in premium products
(Pre COVID and V, U, W and L COVID recovery scenarios)
7.9.8. Rest of the Asia Pacific Application Submarket 2021-2031: Branded bottled water has higher demand
(Pre COVID and V, U, W and L COVID recovery scenarios)
7.9.9. Rest of the Asia Pacific Distribution Channel Submarket 2021-2031: Rise in the number of supermarkets and hypermarkets
(Pre COVID and V, U, W and L COVID recovery scenarios)
7.10. Rest of the world Material Submarket 2021-2031: Advanced RFID tags, holograms, or smart labels to enhance goods security and safety drive market demand
(Pre COVID and V, U, W and L COVID recovery scenarios)
7.11. Rest of the world Application Submarket 2021-2031: Increasing number of manufacturers in developing countries
(Pre COVID and V, U, W and L COVID recovery scenarios)
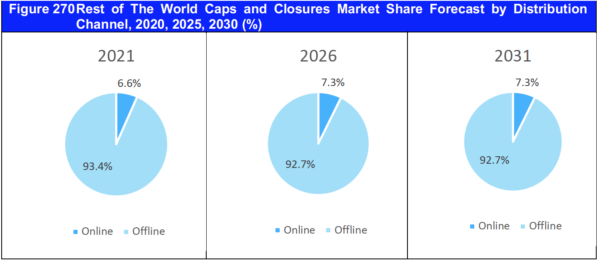
7.12. Rest of the world Distribution Channel Submarket 2021-2031: Improved logistic industry
(Pre COVID and V, U, W and L COVID recovery scenarios)
8. Leading Companies in the Caps & Closures Market
8.1. Leading 10 Caps & Closures Company Sales Share Analysis 2019
8.2. Amcor Ltd.
8.2.1. Amcor Ltd. Caps & Closures Market Overview
8.2.2. Amcor Ltd. Caps & Closures Future Outlook
8.2.3. Amcor Ltd. Total Company Sales 2015-2019
8.2.4. Amcor Ltd. Net Income 2015-2019
8.2.5. Amcor Ltd. Caps & Closures Recent Developments
8.2.6. Amcor Ltd. Caps & Closures Materials / Service
8.2.7. Amcor Ltd. Primary SWOT Analysis
8.3. AptarGroup Inc.
8.3.1. AptarGroup Inc. Caps & Closures Market Overview
8.3.2. AptarGroup Inc. Caps & Closures Future Outlook
8.3.3. AptarGroup Inc. Total Company Sales 2015-2019
8.3.4. AptarGroup Inc. Net Income 2015-2019
8.3.5. AptarGroup Inc. Caps & Closures Recent Developments
8.3.6. AptarGroup Inc. Caps & Closures Materials / Service
8.3.7. AptarGroup Inc. Primary SWOT Analysis
8.4. Ball Corporation
8.4.1. Ball Corporation Caps & Closures Market Overview
8.4.2. Ball Corporation Caps & Closures Future Outlook
8.4.3. Ball Corporation Total Company Sales 2015-2019
8.4.4. Ball Corporation Net Income 2015-2019
8.4.5. Ball Corporation Caps & Closures Recent Developments
8.4.6. Ball Corporation Caps & Closures Materials / Service
8.4.7. Ball Corporation Primary SWOT Analysis
8.5. BASF SE
8.5.1. BASF SE Caps & Closures Market Overview
8.5.2. BASF SE Caps & Closures Future Outlook
8.5.3. BASF SE Total Company Sales 2015-2019
8.5.4. BASF SE Net Income 2015-2019
8.5.5. BASF SE Caps & Closures Recent Developments
8.5.6. BASF SE Caps & Closures Materials / Service
8.5.7. BASF SE Primary SWOT Analysis
8.6. Crow Holdings Inc.
8.6.1. Crow Holdings Inc. Caps & Closures Market Overview
8.6.2. Crow Holdings Inc. Caps & Closures Future Outlook
8.6.3. Crow Holdings Inc. Total Company Sales 2015-2019
8.6.4. Crow Holdings Inc. Net Income 2015-2019
8.6.5. Crow Holdings Inc. Caps & Closures Recent Developments
8.6.6. Crow Holdings Inc. Caps & Closures Materials / Service
8.6.7. Crow Holdings Inc. Primary SWOT Analysis
8.7. DS Smith Plc
8.7.1. DS Smith Plc Caps & Closures Market Overview
8.7.2. DS Smith Plc Caps & Closures Future Outlook
8.7.3. DS Smith Plc Total Company Sales 2015-2019
8.7.4. DS Smith Plc Net Income 2015-2019
8.7.5. DS Smith Plc Caps & Closures Recent Developments
8.7.6. DS Smith Plc Caps & Closures Materials / Service
8.7.7. DS Smith Plc Primary SWOT Analysis
8.8. Sonoco Material Co.
8.8.1. Sonoco Material Co. Caps & Closures Market Overview
8.8.2. Sonoco Material Co. Caps & Closures Future Outlook
8.8.3. Sonoco Material Co. Total Company Sales 2015-2019
8.8.4. Sonoco Material Co. Net Income 2015-2019
8.8.5. Sonoco Material Co. Caps & Closures Recent Developments
8.8.6. Sonoco Material Co. Caps & Closures Materials / Service
8.8.7. Sonoco Material Co. Primary SWOT Analysis
8.9. Tetra Laval
8.9.1. Tetra Laval Caps & Closures Market Overview
8.9.2. Tetra Laval Caps & Closures Future Outlook
8.9.3. Tetra Laval Total Company Sales 2015-2019
8.9.4. Tetra Laval Net Income 2015-2019
8.9.5. Tetra Laval Caps & Closures Recent Developments
8.9.6. Tetra Laval Caps & Closures Materials / Service
8.9.7. Tetra Laval Primary SWOT Analysis
8.10. WestRock Company
8.10.1. WestRock Company Caps & Closures Market Overview
8.10.2. WestRock Company Caps & Closures Future Outlook
8.10.3. WestRock Company Total Company Sales 2015-2019
8.10.4. WestRock Company Net Income 2015-2019
8.10.5. WestRock Company Caps & Closures Recent Developments
8.10.6. WestRock Company Caps & Closures Materials / Service
8.10.7. WestRock Company Primary SWOT Analysis
8.11. WS Packaging Group, Inc.
8.11.1. WS Packaging Group, Inc. Caps & Closures Market Overview
8.11.2. WS Packaging Group, Inc. Caps & Closures Future Outlook
8.11.3. WS Packaging Group, Inc. Total Company Sales 2015-2019
8.11.4. WS Packaging Group, Inc. Net Income 2015-2019
8.11.5. WS Packaging Group, Inc. Caps & Closures Recent Developments
8.11.6. WS Packaging Group, Inc. Caps & Closures Materials / Service
8.11.7. WS Packaging Group, Inc. Primary SWOT Analysis
8.12. Berry Global Inc.
8.12.1. Berry Global Inc. Caps & Closures Market Overview
8.12.2. Berry Global Inc. Caps & Closures Future Outlook
8.12.3. Berry Global Inc. Total Company Sales 2015-2019
8.12.4. Berry Global Inc. Net Income 2015-2019
8.12.5. Berry Global Inc. Caps & Closures Recent Developments
8.12.6. Berry Global Inc. Caps & Closures Materials / Service
8.12.7. Berry Global Inc. Primary SWOT Analysis
8.13. Smurfit Kappa Group PLC
8.13.1. Smurfit Kappa Group PLC Caps & Closures Market Overview
8.13.2. Smurfit Kappa Group PLC Caps & Closures Future Outlook
8.13.3. Smurfit Kappa Group PLC Total Company Sales 2015-2019
8.13.4. Smurfit Kappa Group PLC Net Income 2015-2019
8.13.5. Smurfit Kappa Group PLC Caps & Closures Recent Developments
8.13.6. Smurfit Kappa Group PLC Caps & Closures Materials / Service
8.13.7. Smurfit Kappa Group PLC Primary SWOT Analysis
8.14. Silgan Holdings Inc.
8.14.1. Silgan Holdings Inc. Caps & Closures Market Overview
8.14.2. Silgan Holdings Inc. Caps & Closures Future Outlook
8.14.3. Silgan Holdings Inc. Total Company Sales 2015-2019
8.14.4. Silgan Holdings Inc. Net Income 2015-2019
8.14.5. Silgan Holdings Inc. Caps & Closures Recent Developments
8.14.6. Silgan Holdings Inc. Caps & Closures Materials / Service
8.14.7. Silgan Holdings Inc. Primary SWOT Analysis
8.15. Intertape Polymer Group Inc.
8.15.1. Intertape Polymer Group Inc. Caps & Closures Market Overview
8.15.2. Intertape Polymer Group Inc. Caps & Closures Future Outlook
8.15.3. Intertape Polymer Group Inc. Total Company Sales 2015-2019
8.15.4. Intertape Polymer Group Inc. Net Income 2015-2019
8.15.5. Intertape Polymer Group Inc. Caps & Closures Recent Developments
8.15.6. Intertape Polymer Group Inc. Caps & Closures Materials / Service
8.15.7. Intertape Polymer Group Inc. Primary SWOT Analysis
8.16. Brambles Limited
8.16.1. Brambles Limited Caps & Closures Market Overview
8.16.2. Brambles Limited Caps & Closures Future Outlook
8.16.3. Brambles Limited Total Company Sales 2015-2019
8.16.4. Brambles Limited Net Income 2015-2019
8.16.5. Brambles Limited Caps & Closures Recent Developments
8.16.6. Brambles Limited Caps & Closures Materials / Service
8.16.7. Brambles Limited Primary SWOT Analysis
9. Conclusions and Recommendations
9.1. Associated Visiongain Reports
9.2. Visiongain Report Sales Order Form
10. Appendix A
10.1. About Visiongain
11. Appendix B
11.1. Visiongain report evaluation form
LIST OF TABLES
Table 1 Global Caps and Closures Market Snapshot, 2021 & 2031 (US$ Bn, CAGR %)
Table 2 Global Caps and Closures Market Forecast by Product, 2021-2031 (US$ Bn, AGR %, CAGR %)
Table 3 Global Caps and Closures Market CAGR Forecast by Product, (2021, 2026, 2031)
Table 4 Plastic product market forecast, V Shaped recovery, 2021-2031 (US$ Bn, AGR %)
Table 5 Plastic product market forecast, U Shaped recovery, 2021-2031 (US$ Bn, AGR %)
Table 6 Plastic product market forecast, L Shaped recovery, 2021-2031 (US$ Bn, AGR %)
Table 7 Plastic product market forecast, W Shaped recovery, 2021-2031 (US$ Bn, AGR %)
Table 8 Plastic product market forecast, Without Covid 19 impact, 2021-2031 (US$ Bn, AGR %)
Table 9 Screw-On market forecast, V Shape Recovery, 2021-2031 (US$ Bn, AGR %)
Table 10 Screw-On market forecast, U shape recovery, 2021-2031 (US$ Bn, AGR %)
Table 11 Screw-On market forecast, L shaped recovery, 2021-2031 (US$ Bn, AGR %)
Table 12 Screw-On market forecast, W shaped recovery, 2021-2031 (US$ Bn, AGR %)
Table 13 Screw-On market forecast, Without Covid 19 Impact, 2021-2031 (US$ Bn, AGR %)
Table 14 Dispensing Caps market forecast, V Shape Recovery, 2021-2031 (US$ Bn, AGR %)
Table 15 Dispensing Caps market forecast, U shape recovery, 2021-2031 (US$ Bn, AGR %)
Table 16 Dispensing Caps market forecast, L shaped recovery, 2021-2031 (US$ Bn, AGR %)
Table 17 Dispensing Caps market forecast, W shaped recovery, 2021-2031 (US$ Bn, AGR %)
Table 18 Dispensing Caps market forecast, Without Covid 19 Impact, 2021-2031 (US$ Bn, AGR %)
Table 19 Liquid Carton Closures market forecast, V Shape Recovery, 2021-2031 (US$ Bn, AGR %)
Table 20 Liquid Carton Closures market forecast, U shape recovery, 2021-2031 (US$ Bn, AGR %)
Table 21 Liquid Carton Closures market forecast, L shaped recovery, 2021-2031 (US$ Bn, AGR %)
Table 22 Liquid Carton Closures market forecast, W shaped recovery, 2021-2031 (US$ Bn, AGR %)
Table 23 Liquid Carton Closures market forecast, Without Covid 19 Impact, 2021-2031 (US$ Bn, AGR %)
Table 24 Plastic Lotion Pumps market forecast, V Shape Recovery, 2021-2031 (US$ Bn, AGR %)
Table 25 Plastic Lotion Pumps market forecast, U shape recovery, 2021-2031 (US$ Bn, AGR %)
Table 26 Plastic Lotion Pumps market forecast, L shaped recovery, 2021-2031 (US$ Bn, AGR %)
Table 27 Plastic Lotion Pumps market forecast, W shaped recovery, 2021-2031 (US$ Bn, AGR %)
Table 28 Plastic Lotion Pumps market forecast, Without Covid 19 Impact, 2021-2031 (US$ Bn, AGR %)
Table 29 Plastic Aerosol Sprays market forecast, V Shape Recovery, 2021-2031 (US$ Bn, AGR %)
Table 30 Plastic Aerosol Sprays market forecast, U shape recovery, 2021-2031 (US$ Bn, AGR %)
Table 31 Plastic Aerosol Sprays market forecast, L shaped recovery, 2021-2031 (US$ Bn, AGR %)
Table 32 Plastic Aerosol Sprays market forecast, W shaped recovery, 2021-2031 (US$ Bn, AGR %)
Table 33 Plastic Aerosol Sprays market forecast, Without Covid 19 Impact, 2021-2031 (US$ Bn, AGR %)
Table 34 Metal product market forecast, V Shaped recovery, 2021-2031 (US$ Bn, AGR %)
Table 35 Metal product market forecast, U Shaped recovery, 2021-2031 (US$ Bn, AGR %)
Table 36 Metal product market forecast, L Shaped recovery, 2021-2031 (US$ Bn, AGR %)
Table 37 Metal product market forecast, W Shaped recovery, 2021-2031 (US$ Bn, AGR %)
Table 38 Metal product market forecast, Without Covid 19 impact, 2021-2031 (US$ Bn, AGR %)
Table 39 Roll on Pilfer Proof market forecast, V Shape Recovery, 2021-2031 (US$ Bn, AGR %)
Table 40 Roll on Pilfer Proof market forecast, U shape recovery, 2021-2031 (US$ Bn, AGR %)
Table 41 Roll on Pilfer Proof market forecast, L shaped recovery, 2021-2031 (US$ Bn, AGR %)
Table 42 Roll on Pilfer Proof market forecast, W shaped recovery, 2021-2031 (US$ Bn, AGR %)
Table 43 Roll on Pilfer Proof market forecast, Without Covid 19 Impact, 2021-2031 (US$ Bn, AGR %)
Table 44 Easy Open Can Ends market forecast, V Shape Recovery, 2021-2031 (US$ Bn, AGR %)
Table 45 Easy Open Can Ends market forecast, U shape recovery, 2021-2031 (US$ Bn, AGR %)
Table 46 Easy Open Can Ends market forecast, L shaped recovery, 2021-2031 (US$ Bn, AGR %)
Table 47 Easy Open Can Ends market forecast, W shaped recovery, 2021-2031 (US$ Bn, AGR %)
Table 48 Easy Open Can Ends market forecast, Without Covid 19 Impact, 2021-2031 (US$ Bn, AGR %)
Table 49 Non-Refillable Closures market forecast, V Shape Recovery, 2021-2031 (US$ Bn, AGR %)
Table 50 Non-Refillable Closures market forecast, U shape recovery, 2021-2031 (US$ Bn, AGR %)
Table 51 Non-Refillable Closures market forecast, L shaped recovery, 2021-2031 (US$ Bn, AGR %)
Table 52 Non-Refillable Closures market forecast, W shaped recovery, 2021-2031 (US$ Bn, AGR %)
Table 53 Non-Refillable Closures market forecast, Without Covid 19 Impact, 2021-2031 (US$ Bn, AGR %)
Table 54 Crown Caps market forecast, V Shape Recovery, 2021-2031 (US$ Bn, AGR %)
Table 55 Crown Caps market forecast, U shape recovery, 2021-2031 (US$ Bn, AGR %)
Table 56 Crown Caps market forecast, L shaped recovery, 2021-2031 (US$ Bn, AGR %)
Table 57 Crown Caps market forecast, W shaped recovery, 2021-2031 (US$ Bn, AGR %)
Table 58 Crown Caps market forecast, Without Covid 19 Impact, 2021-2031 (US$ Bn, AGR %)
Table 59 Metal Lug Closures market forecast, V Shape Recovery, 2021-2031 (US$ Bn, AGR %)
Table 60 Metal Lug Closures market forecast, U shape recovery, 2021-2031 (US$ Bn, AGR %)
Table 61 Metal Lug Closures market forecast, L shaped recovery, 2021-2031 (US$ Bn, AGR %)
Table 62 Metal Lug Closures market forecast, W shaped recovery, 2021-2031 (US$ Bn, AGR %)
Table 63 Metal Lug Closures market forecast, Without Covid 19 Impact, 2021-2031 (US$ Bn, AGR %)
Table 64 Cork product market forecast, V Shaped recovery, 2021-2031 (US$ Bn, AGR %)
Table 65 Cork product market forecast, U Shaped recovery, 2021-2031 (US$ Bn, AGR %)
Table 66 Cork product market forecast, L Shaped recovery, 2021-2031 (US$ Bn, AGR %)
Table 67 Cork product market forecast, W Shaped recovery, 2021-2031 (US$ Bn, AGR %)
Table 68 Cork product market forecast, without Covid 19 impact, 2021-2031 (US$ Bn, AGR %)
Table 69 Rubber Stoppers product market forecast, V Shaped recovery, 2021-2031 (US$ Bn, AGR %)
Table 70 Rubber Stoppers product market forecast, U Shaped recovery, 2021-2031 (US$ Bn, AGR %)
Table 71 Rubber Stoppers product market forecast, L Shaped recovery, 2021-2031 (US$ Bn, AGR %)
Table 72 Rubber Stoppers product market forecast, W Shaped recovery, 2021-2031 (US$ Bn, AGR %)
Table 73 Rubber Stoppers product market forecast, Without Covid 19 impact, 2021-2031 (US$ Bn, AGR %)
Table 74 Glass Stoppers product market forecast, V Shaped recovery, 2021-2031 (US$ Bn, AGR %)
Table 75 Glass Stoppers product market forecast, U Shaped recovery, 2021-2031 (US$ Bn, AGR %)
Table 76 Glass Stoppers product market forecast, L Shaped recovery, 2021-2031 (US$ Bn, AGR %)
Table 77 Glass Stoppers product market forecast, W Shaped recovery, 2021-2031 (US$ Bn, AGR %)
Table 78 Glass Stoppers product market forecast, Without Covid 19 impact, 2021-2031 (US$ Bn, AGR %)B
Table 79 Other products market forecast, V Shaped recovery, 2021-2031 (US$ Bn, AGR %)
Table 80 Other products market forecast, U Shaped recovery, 2021-2031 (US$ Bn, AGR %)
Table 81 Other products market forecast, L Shaped recovery, 2021-2031 (US$ Bn, AGR %)
Table 82 Other products market forecast, W Shaped recovery, 2021-2031 (US$ Bn, AGR %)
Table 83 Other products market forecast, Without Covid 19 impact, 2021-2031 (US$ Bn, AGR %)
Table 84 Global Caps and Closures Market Forecast by Application, 2021-2031 (US$ Bn, AGR %, CAGR %)
Table 85 Global Caps and Closures Market CAGR Forecast by Application, (2021, 2026, 2031)
Table 86 Alcoholic beverage market forecast, V Shaped recovery, 2021-2031 (US$ Bn, AGR %)
Table 87 Alcoholic beverage market forecast, U Shaped recovery, 2021-2031 (US$ Bn, AGR %)
Table 88 Alcoholic beverage market forecast, L Shaped recovery, 2021-2031 (US$ Bn, AGR %)
Table 89 Alcoholic beverage market forecast, W Shaped recovery, 2021-2031 (US$ Bn, AGR %)
Table 90 Alcoholic beverage market forecast, Without Covid 19 impact, 2021-2031 (US$ Bn, AGR %)
Table 91 Non-alcoholic beverage market forecast, V Shaped recovery, 2021-2031 (US$ Bn, AGR %)
Table 92 Non-alcoholic beverage market forecast, U Shaped recovery, 2021-2031 (US$ Bn, AGR %)
Table 93 Non-alcoholic beverage market forecast, L Shaped recovery, 2021-2031 (US$ Bn, AGR %)
Table 94 Non-alcoholic beverage market forecast, W Shaped recovery, 2021-2031 (US$ Bn, AGR %)
Table 95 Non-alcoholic beverage market forecast, Without Covid 19 impact, 2021-2031 (US$ Bn, AGR %)
Table 96 Food application market forecast, V Shaped recovery, 2021-2031 (US$ Bn, AGR %)
Table 97 Food application market forecast, U Shaped recovery, 2021-2031 (US$ Bn, AGR %)
Table 98 Food application market forecast, L Shaped recovery, 2021-2031 (US$ Bn, AGR %)
Table 99 Food application market forecast, W Shaped recovery, 2021-2031 (US$ Bn, AGR %)
Table 100 Food application market forecast, Without Covid 19 impact, 2021-2031 (US$ Bn, AGR %)
Table 101 Healthcare application market forecast, V Shaped recovery, 2021-2031 (US$ Bn, AGR %)
Table 102 Healthcare application market forecast, U Shaped recovery, 2021-2031 (US$ Bn, AGR %)
Table 103 Healthcare application market forecast, L Shaped recovery, 2021-2031 (US$ Bn, AGR %)
Table 104 Healthcare application market forecast, W Shaped recovery, 2021-2031 (US$ Bn, AGR %)
Table 105 Healthcare application market forecast, Without Covid 19 impact, 2021-2031 (US$ Bn, AGR %)
Table 106 Other applications market forecast, V Shaped recovery, 2021-2031 (US$ Bn, AGR %)
Table 107 Other applications market forecast, U Shaped recovery, 2021-2031 (US$ Bn, AGR %)
Table 108 Other applications market forecast, L Shaped recovery, 2021-2031 (US$ Bn, AGR %)
Table 109 Other applications market forecast, W Shaped recovery, 2021-2031 (US$ Bn, AGR %)
Table 110 Other applications market forecast, Without Covid 19 impact Shaped recovery, 2021-2031 (US$ Bn, AGR %)
Table 111 Global Caps and Closures Market Forecast by Distribution Channel, 2021-2031 (US$ Bn, AGR %, CAGR %)
Table 112 Global Caps and Closures Market CAGR Forecast by Distribution Channel, (2021, 2026, 2031)
Table 113 Online distribution channel market forecast, V Shaped recovery, 2021-2031 (US$ Bn, AGR %)
Table 114 Online distribution channel market forecast, U Shaped recovery, 2021-2031 (US$ Bn, AGR %)
Table 115 Online distribution channel market forecast, L Shaped recovery, 2021-2031 (US$ Bn, AGR %)
Table 116 Online distribution channel market forecast, W Shaped recovery, 2021-2031 (US$ Bn, AGR %)
Table 117 Online distribution channel market forecast, Without Covid 19, 2021-2031 (US$ Bn, AGR %)
Table 118 Offline distribution channel market forecast, V Shaped recovery, 2021-2031 (US$ Bn, AGR %)
Table 119 Offline distribution channel market forecast, U Shaped recovery, 2021-2031 (US$ Bn, AGR %)
Table 120 Offline distribution channel market forecast, L Shaped recovery, 2021-2031 (US$ Bn, AGR %)
Table 121 Offline distribution channel market forecast, W Shaped recovery, 2021-2031 (US$ Bn, AGR %)
Table 122 Offline distribution channel market forecast, Without Covid 19 impact, 2021-2031 (US$ Bn, AGR %)
Table 123 Global Caps and Closures Market Forecast by Region, 2021-2031 (US$ Bn, AGR %)
Table 124 Global Caps and Closures Market CAGR Forecast by Region, (2021, 2026, 2031)
Table 125 North America market forecast, V Shape Recovery, 2021-2031 (US$ Bn, AGR %)
Table 126 North America market forecast, U shape recovery, 2021-2031 (US$ Bn, AGR %)
Table 127 North America market forecast, L shaped recovery, 2021-2031 (US$ Bn, AGR %)
Table 128 North America market forecast, W shaped recovery, 2021-2031 (US$ Bn, AGR %)
Table 129 North America market forecast, Without Covid 19 Impact, 2021-2031 (US$ Bn, AGR %)
Table 130 North America Caps and Closures Market Forecast by Product, 2021-2031 (US$ Bn, AGR %, CAGR %)
Table 131 North America Caps and Closures Market CAGR Forecast by Product, (2021, 2026, 2031)
Table 132 North America Caps and Closures Market Forecast by Application, 2021-2031 (US$ Bn, AGR %, CAGR %)
Table 133 North America Caps and Closures Market CAGR Forecast by Application, (2021, 2026, 2031)
Table 134 North America Caps and Closures Market Forecast by Distribution Channel, 2021-2031 (US$ Bn, AGR %, CAGR %)
Table 135 North America Caps and Closures Market CAGR by Distribution Channel, (2021, 2026, 2031)
Table 136 North America Caps and Closures Market Forecast by Country, 2021-2031 (US$ Bn, AGR %, CAGR %)
Table 137 North America Caps and Closures Market CAGR by Country, (2021, 2026, 2031)
Table 138 U.S. market forecast, V shaped recovery, 2021-2031 (US$ Bn, AGR %)
Table 139 U.S. market forecast, U shaped recovery, 2021-2031 (US$ Bn, AGR %)
Table 140 U.S. market forecast, L shaped recovery, 2021-2031 (US$ Bn, AGR %)
Table 141 U.S. market forecast, W shaped recovery, 2021-2031 (US$ Bn, AGR %)
Table 142 U.S. market forecast, Without Covid 19 impact, 2021-2031 (US$ Bn, AGR %)
Table 143 U.S. Caps and Closures Market Forecast by Product, 2021-2031 (US$ Bn, AGR %, CAGR %)
Table 144 U.S. Caps and Closures Market CAGR Forecast by Product, (2021, 2026, 2031)
Table 145 U.S. Caps and Closures Market Forecast by Application, 2021-2031 (US$ Bn, AGR %, CAGR %)
Table 146 U.S. Caps and Closures Market CAGR Forecast by Application, (2021, 2026, 2031)
Table 147 U.S. Caps and Closures Market Forecast by Distribution Channel, 2021-2031 (US$ Bn, AGR %, CAGR %)
Table 148 U.S. Caps and Closures Market CAGR by Distribution Channel, (2021, 2026, 2031)
Table 149 Rest of North America market forecast, V shaped recovery, 2021-2031 (US$ Bn, AGR %)
Table 150 Rest of North America market forecast, U shaped recovery, 2021-2031 (US$ Bn, AGR %)
Table 151 Rest of North America market forecast, L shaped recovery, 2021-2031 (US$ Bn, AGR %)
Table 152 Rest of North America market forecast, W shaped recovery, 2021-2031 (US$ Bn, AGR %)
Table 153 Rest of North America market forecast, Without Covid 19 impact, 2021-2031 (US$ Bn, AGR %)
Table 154 Rest of North America Caps and Closures Market Forecast by Product, 2021-2031 (US$ Bn, AGR %, CAGR %)
Table 155 Rest of North America Caps and Closures Market CAGR Forecast by Product, (2021, 2026, 2031)
Table 156 Rest of North America Caps and Closures Market Forecast by Application, 2021-2031 (US$ Bn, AGR %, CAGR %)
Table 157 Rest of North America Caps and Closures Market CAGR Forecast by Application, (2021, 2026, 2031)
Table 158 Rest of North America Caps and Closures Market Forecast by Distribution Channel, 2021-2031 (US$ Bn, AGR %, CAGR %)
Table 159 Rest of North America Caps and Closures Market CAGR by Distribution Channel, (2021, 2026, 2031)
Table 160 Europe market forecast, V shaped recovery, 2021-2031 (US$ Bn, AGR %)
Table 161 Europe market forecast, U shaped recovery, 2021-2031 (US$ Bn, AGR %)
Table 162 Europe market forecast, L shaped recovery, 2021-2031 (US$ Bn, AGR %)
Table 163 Europe market forecast, W shaped recovery, 2021-2031 (US$ Bn, AGR %)
Table 164 Europe market forecast, Without Covid 19 impact, 2021-2031 (US$ Bn, AGR %)
Table 165 Europe Caps and Closures Market Forecast by Product, 2021-2031 (US$ Bn, AGR %, CAGR %)
Table 166 Europe Caps and Closures Market CAGR Forecast by Product, (2021, 2026, 2031)
Table 167 Europe Caps and Closures Market Forecast by Application, 2021-2031 (US$ Bn, AGR %, CAGR %)
Table 168 Europe Caps and Closures Market CAGR Forecast by Application, (2021, 2026, 2031)
Table 169 Europe Caps and Closures Market Forecast by Distribution Channel, 2021-2031 (US$ Bn, AGR %, CAGR %)
Table 170 Europe Caps and Closures Market CAGR by Distribution Channel, (2021, 2026, 2031)
Table 171 Europe Caps and Closures Market Forecast by Country, 2021-2031 (US$ Bn, AGR %, CAGR %)
Table 172 Europe Caps and Closures Market CAGR by Country, (2021, 2026, 2031)
Table 173 Germany market forecast, V shaped recovery, 2021-2031 (US$ Bn, AGR %)
Table 174 Germany market forecast, U shaped recovery, 2021-2031 (US$ Bn, AGR %)
Table 175 Germany market forecast, L shaped recovery, 2021-2031 (US$ Bn, AGR %)
Table 176 Germany market forecast, W shaped recovery, 2021-2031 (US$ Bn, AGR %)
Table 177 Germany market forecast, Without Covid 19 impact, 2021-2031 (US$ Bn, AGR %)
Table 178 Germany Caps and Closures Market Forecast by Product, 2021-2031 (US$ Bn, AGR %, CAGR %)
Table 179 Germany Caps and Closures Market CAGR Forecast by Product, (2021, 2026, 2031)
Table 180 Germany Caps and Closures Market Forecast by Application, 2021-2031 (US$ Bn, AGR %, CAGR %)
Table 181 Germany Caps and Closures Market CAGR Forecast by Application, (2021, 2026, 2031)
Table 182 Germany Caps and Closures Market Forecast by Distribution Channel, 2021-2031 (US$ Bn, AGR %, CAGR %)
Table 183 Germany Caps and Closures Market CAGR by Distribution Channel, (2021, 2026, 2031)
Table 184 U.K. market forecast, V shaped recovery, 2021-2031 (US$ Bn, AGR %)
Table 185 U.K. market forecast, U shaped recovery, 2021-2031 (US$ Bn, AGR %)
Table 186 U.K. market forecast, L shaped recovery, 2021-2031 (US$ Bn, AGR %)
Table 187 U.K. market forecast, W shaped recovery, 2021-2031 (US$ Bn, AGR %)
Table 188 U.K. market forecast, Without Covid 19 impact, 2021-2031 (US$ Bn, AGR %)
Table 189 U.K. Caps and Closures Market Forecast by Product, 2021-2031 (US$ Bn, AGR %, CAGR %)
Table 190 U.K. Caps and Closures Market CAGR Forecast by Product, (2021, 2026, 2031)
Table 191 U.K. Caps and Closures Market Forecast by Application, 2021-2031 (US$ Bn, AGR %, CAGR %)
Table 192 U.K. Caps and Closures Market CAGR Forecast by Application, (2021, 2026, 2031)
Table 193 U.K. Caps and Closures Market Forecast by Distribution Channel, 2021-2031 (US$ Bn, AGR %, CAGR %)
Table 194 U.K. Caps and Closures Market CAGR by Distribution Channel, (2021, 2026, 2031)
Table 195 Rest of Europe market forecast, V shaped recovery, 2021-2031 (US$ Bn, AGR %)
Table 196 Rest of Europe market forecast, U shaped recovery, 2021-2031 (US$ Bn, AGR %)
Table 197 Rest of Europe market forecast, L shaped recovery, 2021-2031 (US$ Bn, AGR %)
Table 198 Rest of Europe market forecast, W shaped recovery, 2021-2031 (US$ Bn, AGR %)
Table 199 Rest of Europe market forecast, Without Covid 19 impact, 2021-2031 (US$ Bn, AGR %)
Table 200 Rest of Europe Caps and Closures Market Forecast by Product, 2021-2031 (US$ Bn, AGR %, CAGR %)
Table 201 Rest of Europe Caps and Closures Market CAGR Forecast by Product, (2021, 2026, 2031)
Table 202 Rest of Europe Caps and Closures Market Forecast by Application, 2021-2031 (US$ Bn, AGR %, CAGR %)
Table 203 Rest of Europe Caps and Closures Market CAGR Forecast by Application, (2021, 2026, 2031)
Table 204 Rest of Europe Caps and Closures Market Forecast by Distribution Channel, 2021-2031 (US$ Bn, AGR %, CAGR %)
Table 205 Rest of Europe Caps and Closures Market CAGR by Distribution Channel, (2021, 2026, 2031)
Table 206 Asia Pacific forecast, V shaped recovery, 2021-2031 (US$ Bn, AGR %)
Table 207 Asia Pacific forecast, U shaped recovery, 2021-2031 (US$ Bn, AGR %)
Table 208 Asia Pacific forecast, L shaped recovery, 2021-2031 (US$ Bn, AGR %)
Table 209 Asia Pacific forecast, W shaped recovery, 2021-2031 (US$ Bn, AGR %)
Table 210 Asia Pacific forecast, Without Covid 19 impact, 2021-2031 (US$ Bn, AGR %)
Table 211 Asia Pacific Caps and Closures Market Forecast by Product, 2021-2031 (US$ Bn, AGR %, CAGR %)
Table 212 Asia Pacific Caps and Closures Market CAGR Forecast by Product, (2021, 2026, 2031)
Table 213 Asia Pacific Caps and Closures Market Forecast by Application, 2021-2031 (US$ Bn, AGR %, CAGR %)
Table 214 Asia Pacific Caps and Closures Market CAGR Forecast by Application, (2021, 2026, 2031)
Table 215 Asia Pacific Caps and Closures Market Forecast by Distribution Channel, 2021-2031 (US$ Bn, AGR %, CAGR %)
Table 216 Asia Pacific Caps and Closures Market CAGR by Distribution Channel, (2021, 2026, 2031)
Table 217 Asia Pacific Caps and Closures Market Forecast by Country, 2021-2031 (US$ Bn, AGR %, CAGR %)
Table 218 Asia Pacific Caps and Closures Market CAGR by Country, (2021, 2026, 2031)
Table 219 China forecast, V shaped recovery, 2021-2031 (US$ Bn, AGR %)
Table 220 China forecast, U shaped recovery, 2021-2031 (US$ Bn, AGR %)
Table 221 China forecast, L shaped recovery, 2021-2031 (US$ Bn, AGR %)
Table 222 China forecast, W shaped recovery, 2021-2031 (US$ Bn, AGR %)
Table 223 China forecast, Without Covid 19 impact, 2021-2031 (US$ Bn, AGR %)
Table 224 China Caps and Closures Market Forecast by Product, 2021-2031 (US$ Bn, AGR %, CAGR %)
Table 225 China Caps and Closures Market CAGR Forecast by Product, (2021, 2026, 2031)
Table 226 China Caps and Closures Market Forecast by Application, 2021-2031 (US$ Bn, AGR %, CAGR %)
Table 227 China Caps and Closures Market CAGR Forecast by Application, (2021, 2026, 2031)
Table 228 China Caps and Closures Market Forecast by Distribution Channel, 2021-2031 (US$ Bn, AGR %, CAGR %)
Table 229 China Caps and Closures Market CAGR by Distribution Channel, (2021, 2026, 2031)
Table 230 India forecast, V shaped recovery, 2021-2031 (US$ Bn, AGR %)
Table 231 India forecast, U shaped recovery, 2021-2031 (US$ Bn, AGR %)
Table 232 India forecast, L shaped recovery, 2021-2031 (US$ Bn, AGR %)
Table 233 India forecast, W shaped recovery, 2021-2031 (US$ Bn, AGR %)
Table 234 India forecast, Without Covid 19 impact, 2021-2031 (US$ Bn, AGR %)
Table 235 India Caps and Closures Market Forecast by Product, 2021-2031 (US$ Bn, AGR %, CAGR %)
Table 236 India Caps and Closures Market CAGR Forecast by Product, (2021, 2026, 2031)
Table 237 India Caps and Closures Market Forecast by Application, 2021-2031 (US$ Bn, AGR %, CAGR %)
Table 238 India Caps and Closures Market CAGR Forecast by Application, (2021, 2026, 2031)
Table 239 India Caps and Closures Market Forecast by Distribution Channel, 2021-2031 (US$ Bn, AGR %, CAGR %)
Table 240 India Caps and Closures Market CAGR by Distribution Channel, (2021, 2026, 2031)
Table 241 Rest of Asia Pacific forecast, V shaped recovery, 2021-2031 (US$ Bn, AGR %)
Table 242 Rest of Asia Pacific forecast, U shaped recovery, 2021-2031 (US$ Bn, AGR %)
Table 243 Rest of Asia Pacific forecast, L shaped recovery, 2021-2031 (US$ Bn, AGR %)
Table 244 Rest of Asia Pacific forecast, W shaped recovery, 2021-2031 (US$ Bn, AGR %)
Table 245 Rest of Asia Pacific forecast, Without Covid 19 impact, 2021-2031 (US$ Bn, AGR %)
Table 246 Rest of Asia Pacific Caps and Closures Market Forecast by Product, 2021-2031 (US$ Bn, AGR %, CAGR %)
Table 247 Rest of Asia Pacific Caps and Closures Market CAGR Forecast by Product, (2021, 2026, 2031)
Table 248 Rest of Asia Pacific Caps and Closures Market Forecast by Application, 2021-2031 (US$ Bn, AGR %, CAGR %)
Table 249 Rest of Asia Pacific Caps and Closures Market CAGR Forecast by Application, (2021, 2026, 2031)
Table 250 Rest of Asia Pacific Caps and Closures Market Forecast by Distribution Channel, 2021-2031 (US$ Bn, AGR %, CAGR %)
Table 251 Rest of Asia Pacific Caps and Closures Market CAGR by Distribution Channel, (2021, 2026, 2031)
Table 252 Rest of The World forecast, V shaped recovery, 2021-2031 (US$ Bn, AGR %)
Table 253 Rest of The World forecast, U shaped recovery, 2021-2031 (US$ Bn, AGR %)
Table 254 Rest of The World forecast, L shaped recovery, 2021-2031 (US$ Bn, AGR %)
Table 255 Rest of The World forecast, W shaped recovery, 2021-2031 (US$ Bn, AGR %)
Table 256 Rest of The World forecast, Without Covid 19 impact, 2021-2031 (US$ Bn, AGR %)
Table 257 Rest of The World Caps and Closures Market Forecast by Product, 2021-2031 (US$ Bn, AGR %, CAGR %)
Table 258 Rest of The World Caps and Closures Market CAGR Forecast by Product, (2021, 2026, 2031)
Table 259 Rest of The World Caps and Closures Market Forecast by Application, 2021-2031 (US$ Bn, AGR %, CAGR %)
Table 260 Rest of The World Caps and Closures Market CAGR Forecast by Application, (2021, 2026, 2031)
Table 261 Rest of The World Caps and Closures Market Forecast by Distribution Channel, 2021-2031 (US$ Bn, AGR %, CAGR %)
Table 262 Rest of The World Caps and Closures Market CAGR by Distribution Channel, (2021, 2026, 2031)
Table 263 Leading Caps & Closures Companies 2020
Table 264 Amcor Ltd. Profile 2019 (CEO, Parent Company Sales US$m, Net Income, Business Segment in the Market, HQ, Founded, Website)
Table 265 Amcor Ltd. Total Company Sales 2015-2019 (US$ million, AGR %)
Table 266 Amcor Ltd. Net Income 2015-2019 (US$ million, AGR %)
Table 267 Amcor Ltd. Key Developments 2018-2020 (Date, Strategy, Details)
Table 268 Amcor Ltd. Caps & Closures Market Products/Services (Segment of Business, Product, Specification / Features)
Table 269 Amcor Ltd. SWOT Analysis 2020
Table 270 AptarGroup, Inc. Profile 2019 (CEO, Parent Company Sales US$m, Net Income, Business Segment in the Market, HQ, Founded, Website)
Table 271 AptarGroup, Inc. Total Company Sales 2015-2019 (US$ million, AGR %)
Table 272 AptarGroup, Inc. Net Income 2015-2019 (US$ million, AGR %)
Table 273 AptarGroup, Inc. Key Developments 2017-2020 (Date, Strategy, Details)
Table 274 AptarGroup, Inc. Caps & Closures Market Products/Services (Segment of Business, Product, Specification / Features)
Table 275 AptarGroup, Inc. SWOT Analysis 2020
Table 276 Ball Corporation Profile 2019 (CEO, Global Revenue (US$ Mn), Net Income, Business Segment in the Market, HQ, Founded, Website)
Table 277 Ball Corporation Total Company Sales 2015-2019 (US$ million, AGR %)
Table 278 Ball Corporation Net Income 2015-2019 (US$ million, AGR %)
Table 279 Ball Corporation Key Developments 2017-2020 (Date, Strategy, Details)
Table 280 Ball Corporation Caps & Closures Market Products/Services (Segment of Business, Product, Specification / Features)
Table 281 Ball Corporation SWOT Analysis 2020
Table 282 BASF SE Company Profile 2019 (CEO, Global Revenue (US$ Mn), Net Income, Business Segment in the Market, HQ, Founded, Website)
Table 283 BASF SE Company Total Company Sales 2015-2019 (US$ million, AGR %)
Table 284 BASF SE Company Net Income 2015-2019 (US$ million, AGR %)
Table 285 BASF SE Company Key Developments 2018-2020 (Date, Strategy, Details)
Table 286 BASF SE Company Caps & Closures Market Products/Services (Segment of Business, Product, Specification / Features)
Table 287 BASF SE Company SWOT Analysis 2020
Table 288 Crown Holdings, Inc. Profile 2019 (CEO, Global Revenue (US$ Mn), Net Income, Business Segment in the Market, HQ, Founded, Website)
Table 289 Crown Holdings, Inc. Total Company Sales 2015-2019 (US$ million, AGR %)
Table 290 Crown Holdings, Inc. Net Income 2015-2019 (US$ million, AGR %)
Table 291 Crown Holdings, Inc. Key Developments 2017-2020 (Date, Strategy, Details)
Table 292 Crown Holdings, Inc. Caps & Closures Market Products/Services (Segment of Business, Product, Specification / Features)
Table 293 Crown Holdings, Inc. SWOT Analysis 2020
Table 294 DS Smith Plc Profile 2019 (CEO, Global Revenue (US$ Mn), Net Income, Business Segment in the Market, HQ, Founded, Website)
Table 295 DS Smith Plc Total Company Sales 2015-2019 (US$ million, AGR %)
Table 296 DS Smith Plc Net Income 2015-2019 (US$ million, AGR %)
Table 297 DS Smith Plc Key Developments 2018-2020 (Date, Strategy, Details)
Table 298 DS Smith Plc Caps & Closures Market Products/Services (Segment of Business, Product, Specification / Features)
Table 299 DS Smith Plc SWOT Analysis 2020
Table 300 Sonoco Products Co. Profile 2019 (CEO, Global Revenue (US$ Mn), Net Income, Business Segment in the Market, HQ, Founded, Website)
Table 301 Sonoco Products Co. Total Company Sales 2015-2019 (US$ million, AGR %)
Table 302 Sonoco Products Co. Net Income 2015-2019 (US$ million, AGR %)
Table 303 Sonoco Products Co. Key Developments 2018-2020 (Date, Strategy, Details)
Table 304 Sonoco Products Co. Caps & Closures Market Products/Services (Segment of Business, Product, Specification / Features)
Table 305 Sonoco Products Co. SWOT Analysis 2020
Table 306 Tetra Laval Profile 2019 (CEO, Global Revenue (US$ Mn), Net Income, Business Segment in the Market, HQ, Founded, Website)
Table 307 Tetra Laval Total Company Sales 2015-2019 (US$ million, AGR %)
Table 308 Tetra Laval Key Developments 2018-2020 (Date, Strategy, Details)
Table 309 Tetra Laval Caps & Closures Market Products/Services (Segment of Business, Product, Specification / Features)
Table 310 Tetra Laval SWOT Analysis 2020
Table 311 WestRock Company Profile 2019 (CEO, Global Revenue (US$ Mn), Net Income, Business Segment in the Market, HQ, Founded, Website)
Table 312 WestRock Company Total Company Sales 2015-2019 (US$ million, AGR %)
Table 313 WestRock Company Net Income 2015-2019 (US$ million, AGR %)
Table 314 WestRock Company Key Developments 2018-2020 (Date, Strategy, Details)
Table 315 WestRock Company Caps & Closures Market Products/Services (Segment of Business, Product, Specification / Features)
Table 316 WestRock Company SWOT Analysis 2020
Table 317 WS Packaging Group, Inc. Profile 2019 (CEO, Global Revenue (US$ Mn), Net Income, Business Segment in the Market, HQ, Founded, Website)
Table 318 WS Packaging Group, Inc. Key Developments 2018-2020 (Date, Strategy, Details)
Table 319 WS Packaging Group, Inc. Caps & Closures Market Products/Services (Segment of Business, Product, Specification / Features)
Table 320 WS Packaging Group, Inc. SWOT Analysis 2020
Table 321 Berry Global Inc. Profile 2019 (CEO, Global Revenue (US$ Mn), Net Income, Business Segment in the Market, HQ, Founded, Website)
Table 322 Berry Global Inc. Total Company Sales 2015-2019 (US$ million, AGR %)
Table 323 Berry Global Inc. Net Income 2015-2019 (US$ million, AGR %)
Table 324 Berry Global Inc. Key Developments 2018-2020 (Date, Strategy, Details)
Table 325 Berry Global Inc. Caps & Closures Market Products/Services (Segment of Business, Product, Specification / Features)
Table 326 Berry Global Inc. SWOT Analysis 2020
Table 327 Smurfit Kappa Group PLC Profile 2019 (CEO, Global Revenue (US$ Mn), Net Income, Business Segment in the Market, HQ, Founded, Website)
Table 328 Smurfit Kappa Group PLC Total Company Sales 2015-2019 (US$ million, AGR %)
Table 329 Smurfit Kappa Group PLC Net Income 2015-2019 (US$ million, AGR %)
Table 330 Smurfit Kappa Group PLC Key Developments 2018-2020 (Date, Strategy, Details)
Table 331 Smurfit Kappa Group PLC Caps & Closures Market Products/Services (Segment of Business, Product, Specification / Features)
Table 332 Smurfit Kappa Group PLC SWOT Analysis 2020
Table 333 Silgan Holdings Inc. Profile 2019 (CEO, Global Revenue (US$ Mn), Net Income, Business Segment in the Market, HQ, Founded, Website)
Table 334 Silgan Holdings Inc. Total Company Sales 2015-2019 (US$ million, AGR %)
Table 335 Silgan Holdings Inc. Net Income 2015-2019 (US$ million, AGR %)
Table 336 Silgan Holdings Inc. Key Developments 2018-2020 (Date, Strategy, Details)
Table 337 Silgan Holdings Inc. Caps & Closures Market Products/Services (Segment of Business, Product, Specification / Features)
Table 338 Silgan Holdings Inc. SWOT Analysis 2020
Table 339 Intertape Polymer Group Inc. Profile 2019 (CEO, Global Revenue (US$ Mn), Net Income, Business Segment in the Market, HQ, Founded, Website)
Table 340 Intertape Polymer Group Inc. Total Company Sales 2015-2019 (US$ million, AGR %)
Table 341 Intertape Polymer Group Inc. Net Income 2015-2019 (US$ million, AGR %)
Table 342 Intertape Polymer Group Inc. Key Developments 2018-2020 (Date, Strategy, Details)
Table 343 Intertape Polymer Group Inc. Caps & Closures Market Products/Services (Segment of Business, Product, Specification / Features)
Table 344 Intertape Polymer Group Inc. SWOT Analysis 2020
Table 345 BRAMBLES LIMITED Company Profile 2019 (CEO, Global Revenue (US$ Mn), Net Income, Business Segment in the Market, HQ, Founded, Website)
Table 346 BRAMBLES LIMITED Company Total Company Sales 2015-2019 (US$ million, AGR %)
Table 347 BRAMBLES LIMITED Company Net Income 2015-2019 (US$ million, AGR %)
Table 348 BRAMBLES LIMITED Company Key Developments 2018-2020 (Date, Strategy, Details)
Table 349 BRAMBLES LIMITED Company Caps & Closures Market Products/Services (Segment of Business, Product, Specification / Features)
Table 350 BRAMBLES LIMITED Company SWOT Analysis 2020
LIST OF FIGURES
Figure 1 Global Caps and Closures Market Segmentation
Figure 2 Global Caps and Closures Market Forecast, 2021-2031 (US$ Bn, AGR %), V Shaped Recovery
Figure 3 Global Caps and Closures Market Forecast, 2021-2031 (US$ Bn, AGR %), U Shaped Recovery
Figure 4 Global Caps and Closures Market Forecast, 2021-2031 (US$ Bn, AGR %), L Shaped Recovery
Figure 5 Global Caps and Closures Market Forecast, 2021-2031 (US$ Bn, AGR %), W Shaped Recovery
Figure 6 Global Caps and Closures Market Forecast, 2021-2031 (US$ Bn, AGR %), Without Covid 19 Impact
Figure 7 Global Caps and Closures Market: Market Driver
Figure 8 Global Caps and Closures Market: SWOT Analysis
Figure 9 Porter’s 5 Force Analysis: Global Caps and Closures Market: 2021-2031
Figure 10 Global Caps and Closures Market Forecast by Product, 2021-2031 (US$ Bn, AGR %)
Figure 11 Global Caps and Closures Market Share Forecast by Product, 2021, 2026, 2031 (%)
Figure 12 Global Caps and Closures Market Forecast by Plastic Material, 2021-2031 (US$ Bn, AGR %), V Shaped Recovery
Figure 13 Global Caps and Closures Market Forecast by Plastic Product, 2021-2031 (US$ Bn, AGR %), U Shaped Recovery
Figure 14 Global Caps and Closures Market Forecast by Plastic Product, 2021-2031 (US$ Bn, AGR %), L Shaped Recovery
Figure 15 Global Caps and Closures Market Forecast by Plastic Product, 2021-2031 (US$ Bn, AGR %), W Shaped Recovery
Figure 16 Global Caps and Closures Market Forecast by Plastic Product, 2021-2031 (US$ Bn, AGR %), Without Covid 19
Figure 17 Screw-On Caps and Closures Market, 2021-2031 (US$ Bn, AGR %), V Shaped Recovery
Figure 18 Screw-On Caps and Closures Market, 2021-2031 (US$ Bn, AGR %), U Shaped Recovery
Figure 19 Screw-On Caps and Closures Market, 2021-2031 (US$ Bn, AGR %), L Shaped Recovery
Figure 20 Screw-On Caps and Closures Market, 2021-2031 (US$ Bn, AGR %), W Shaped Recovery
Figure 21 Screw-On Caps and Closures Market, 2021-2031 (US$ Bn, AGR %), Without Covid 19
Figure 22 Dispensing Caps and Closures Market, 2021-2031 (US$ Bn, AGR %), V Shaped Recovery
Figure 23 Dispensing Caps and Closures Market, 2021-2031 (US$ Bn, AGR %), U Shaped Recovery
Figure 24 Dispensing Caps and Closures Market, 2021-2031 (US$ Bn, AGR %), L Shaped Recovery
Figure 25 Dispensing Caps and Closures Market, 2021-2031 (US$ Bn, AGR %), W Shaped Recovery
Figure 26 Dispensing Caps and Closures Market, 2021-2031 (US$ Bn, AGR %), Without Covid 19
Figure 27 Liquid Carton Closures Caps and Closures Market, 2021-2031 (US$ Bn, AGR %), V Shaped Recovery
Figure 28 Liquid Carton Closures Caps and Closures Market, 2021-2031 (US$ Bn, AGR %), U Shaped Recovery
Figure 29 Liquid Carton Closures Caps and Closures Market, 2021-2031 (US$ Bn, AGR %), L Shaped Recovery
Figure 30 Liquid Carton Closures Caps and Closures Market, 2021-2031 (US$ Bn, AGR %), W Shaped Recovery
Figure 31 Liquid Carton Closures Caps and Closures Market, 2021-2031 (US$ Bn, AGR %), Without Covid 19
Figure 32 Plastic Lotion Pumps Caps and Closures Market, 2021-2031 (US$ Bn, AGR %), V Shaped Recovery
Figure 33 Plastic Lotion Pumps Caps and Closures Market, 2021-2031 (US$ Bn, AGR %), U Shaped Recovery
Figure 34 Plastic Lotion Pumps Caps and Closures Market, 2021-2031 (US$ Bn, AGR %), L Shaped Recovery
Figure 35 Plastic Lotion Pumps Caps and Closures Market, 2021-2031 (US$ Bn, AGR %), W Shaped Recovery
Figure 36 Plastic Lotion Pumps Caps and Closures Market, 2021-2031 (US$ Bn, AGR %), Without Covid 19
Figure 37 Plastic Aerosol Sprays Caps and Closures Market, 2021-2031 (US$ Bn, AGR %), V Shaped Recovery
Figure 38 Plastic Aerosol Sprays Caps and Closures Market, 2021-2031 (US$ Bn, AGR %), U Shaped Recovery
Figure 39 Plastic Aerosol Sprays Caps and Closures Market, 2021-2031 (US$ Bn, AGR %), L Shaped Recovery
Figure 40 Plastic Aerosol Sprays Caps and Closures Market, 2021-2031 (US$ Bn, AGR %), W Shaped Recovery
Figure 41 Plastic Aerosol Sprays Caps and Closures Market, 2021-2031 (US$ Bn, AGR %), Without Covid 19
Figure 42 Global Caps and Closures Market Forecast by Metal Product, 2021-2031 (US$ Bn, AGR %), V Shaped Recovery
Figure 43 Global Caps and Closures Market Forecast by Metal Product, 2021-2031 (US$ Bn, AGR %), U Shaped Recovery
Figure 44 Global Caps and Closures Market Forecast by Metal Product, 2021-2031 (US$ Bn, AGR %), L Shaped Recovery
Figure 45 Global Caps and Closures Market Forecast by Metal Product, 2021-2031 (US$ Bn, AGR %), W Shaped Recovery
Figure 46 Global Caps and Closures Market Forecast by Metal Product, 2021-2031 (US$ Bn, AGR %), Without Covid 19
Figure 47 Roll on Pilfer Proof Caps and Closures Market, 2021-2031 (US$ Bn, AGR %), V Shaped Recovery
Figure 48 Roll on Pilfer Proof Caps and Closures Market, 2021-2031 (US$ Bn, AGR %), U Shaped Recovery
Figure 49 Roll on Pilfer Proof Caps and Closures Market, 2021-2031 (US$ Bn, AGR %), L Shaped Recovery
Figure 50 Roll on Pilfer Proof Caps and Closures Market, 2021-2031 (US$ Bn, AGR %), W Shaped Recovery
Figure 51 Roll on Pilfer Proof Caps and Closures Market, 2021-2031 (US$ Bn, AGR %), Without Covid 19
Figure 52 Easy Open Can Ends Caps and Closures Market, 2021-2031 (US$ Bn, AGR %), V Shaped Recovery
Figure 53 Easy Open Can Ends Caps and Closures Market, 2021-2031 (US$ Bn, AGR %), U Shaped Recovery
Figure 54 Easy Open Can Ends Caps and Closures Market, 2021-2031 (US$ Bn, AGR %), L Shaped Recovery
Figure 55 Easy Open Can Ends Caps and Closures Market, 2021-2031 (US$ Bn, AGR %), W Shaped Recovery
Figure 56 Easy Open Can Ends Caps and Closures Market, 2021-2031 (US$ Bn, AGR %), Without Covid 19
Figure 57 Non-Refillable Closures Caps and Closures Market, 2021-2031 (US$ Bn, AGR %), V Shaped Recovery
Figure 58 Non-Refillable Closures Caps and Closures Market, 2021-2031 (US$ Bn, AGR %), U Shaped Recovery
Figure 59 Non-Refillable Closures Caps and Closures Market, 2021-2031 (US$ Bn, AGR %), L Shaped Recovery
Figure 60 Non-Refillable Closures Caps and Closures Market, 2021-2031 (US$ Bn, AGR %), W Shaped Recovery
Figure 61 Non-Refillable Closures Caps and Closures Market, 2021-2031 (US$ Bn, AGR %), Without Covid 19
Figure 62 Crown Caps and Closures Market, 2021-2031 (US$ Bn, AGR %), V Shaped Recovery
Figure 63 Crown Caps and Closures Market, 2021-2031 (US$ Bn, AGR %), U Shaped Recovery
Figure 64 Crown Caps and Closures Market, 2021-2031 (US$ Bn, AGR %), L Shaped Recovery
Figure 65 Crown Caps and Closures Market, 2021-2031 (US$ Bn, AGR %), W Shaped Recovery
Figure 66 Crown Caps and Closures Market, 2021-2031 (US$ Bn, AGR %), Without Covid 19
Figure 67 Metal Lug Closures Caps and Closures Market, 2021-2031 (US$ Bn, AGR %), V Shaped Recovery
Figure 68 Metal Lug Closures Caps and Closures Market, 2021-2031 (US$ Bn, AGR %), U Shaped Recovery
Figure 69 Metal Lug Closures Caps and Closures Market, 2021-2031 (US$ Bn, AGR %), L Shaped Recovery
Figure 70 Metal Lug Closures Caps and Closures Market, 2021-2031 (US$ Bn, AGR %), W Shaped Recovery
Figure 71 Metal Lug Closures Caps and Closures Market, 2021-2031 (US$ Bn, AGR %), Without Covid 19
Figure 72 Global Caps and Closures Market Forecast by Corks Product, 2021-2031 (US$ Bn, AGR %), V Shaped Recovery
Figure 73 Global Caps and Closures Market Forecast by Corks Product, 2021-2031 (US$ Bn, AGR %), U Shaped Recovery
Figure 74 Global Caps and Closures Market Forecast by Corks Product, 2021-2031 (US$ Bn, AGR %), L Shaped Recovery
Figure 75 Global Caps and Closures Market Forecast by Corks Product, 2021-2031 (US$ Bn, AGR %), W Shaped Recovery
Figure 76 Global Caps and Closures Market Forecast by Corks Product, 2021-2031 (US$ Bn, AGR %), Without Covid 19
Figure 77 Global Caps and Closures Market Forecast by Rubber Stoppers Product, 2021-2031 (US$ Bn, AGR %), V Shaped Recovery
Figure 78 Global Caps and Closures Market Forecast by Rubber Stoppers Product, 2021-2031 (US$ Bn, AGR %), U Shaped Recovery
Figure 79 Global Caps and Closures Market Forecast by Rubber Stoppers Product, 2021-2031 (US$ Bn, AGR %), L Shaped Recovery
Figure 80 Global Caps and Closures Market Forecast by Rubber Stoppers Product, 2021-2031 (US$ Bn, AGR %), W Shaped Recovery
Figure 81 Global Caps and Closures Market Forecast by Rubber Stoppers Product, 2021-2031 (US$ Bn, AGR %), Without Covid 19
Figure 82 Global Caps and Closures Market Forecast by Glass Stoppers Product, 2021-2031 (US$ Bn, AGR %), V Shaped Recovery
Figure 83 Global Caps and Closures Market Forecast by Glass Stoppers Product, 2021-2031 (US$ Bn, AGR %), U Shaped Recovery
Figure 84 Global Caps and Closures Market Forecast by Glass Stoppers Product, 2021-2031 (US$ Bn, AGR %), L Shaped Recovery
Figure 85 Global Caps and Closures Market Forecast by Glass Stoppers Product, 2021-2031 (US$ Bn, AGR %), W Shaped Recovery
Figure 86 Global Caps and Closures Market Forecast by Glass Stoppers Product, 2021-2031 (US$ Bn, AGR %), Without Covid 19
Figure 87 Global Caps and Closures Market Forecast by Other Products, 2021-2031 (US$ Bn, AGR %), V Shaped Recovery
Figure 88 Global Caps and Closures Market Forecast by Other Products, 2021-2031 (US$ Bn, AGR %), U Shaped Recovery
Figure 89 Global Caps and Closures Market Forecast by Other Products, 2021-2031 (US$ Bn, AGR %), L Shaped Recovery
Figure 90 Global Caps and Closures Market Forecast by Other Products, 2021-2031 (US$ Bn, AGR %), W Shaped Recovery
Figure 91 Global Caps and Closures Market Forecast by Other Products, 2021-2031 (US$ Bn, AGR %), Without Covid 19
Figure 92 Global Caps and Closures Market Forecast by Application, 2021-2031 (US$ Bn, AGR %)
Figure 93 Global Caps and Closures Market Share Forecast by Application, 2021, 2026, 2031 (%)
Figure 94 Global Caps and Closures Market Forecast by Alcoholic Beverages, 2021-2031 (US$ Bn, AGR %), V Shaped Recovery
Figure 95 Global Caps and Closures Market Forecast by Alcoholic Beverages, 2021-2031 (US$ Bn, AGR %), U Shaped Recovery
Figure 96 Global Caps and Closures Market Forecast by Alcoholic Beverages, 2021-2031 (US$ Bn, AGR %), L Shaped Recovery
Figure 97 Global Caps and Closures Market Forecast by Alcoholic Beverages, 2021-2031 (US$ Bn, AGR %), W Shaped Recovery
Figure 98 Global Caps and Closures Market Forecast by Alcoholic Beverages, 2021-2031 (US$ Bn, AGR %), Without Covid 19
Figure 99 Global Caps and Closures Market Forecast by Non-Alcoholic Beverages, 2021-2031 (US$ Bn, AGR %), V Shaped Recovery
Figure 100 Global Caps and Closures Market Forecast by Non-Alcoholic Beverages, 2021-2031 (US$ Bn, AGR %), U Shaped Recovery
Figure 101 Global Caps and Closures Market Forecast by Non-Alcoholic Beverages, 2021-2031 (US$ Bn, AGR %), L Shaped Recovery
Figure 102 Global Caps and Closures Market Forecast by Non-Alcoholic Beverages, 2021-2031 (US$ Bn, AGR %), W Shaped Recovery
Figure 103 Global Caps and Closures Market Forecast by Non-Alcoholic Beverages, 2021-2031 (US$ Bn, AGR %), Without Covid 19
Figure 104 Global Caps and Closures Market Forecast by Food, 2021-2031 (US$ Bn, AGR %), V Shaped Recovery
Figure 105 Global Caps and Closures Market Forecast by Food, 2021-2031 (US$ Bn, AGR %), U Shaped Recovery
Figure 106 Global Caps and Closures Market Forecast by Food, 2021-2031 (US$ Bn, AGR %), L Shaped Recovery
Figure 107 Global Caps and Closures Market Forecast by Food, 2021-2031 (US$ Bn, AGR %), W Shaped Recovery
Figure 108 Global Caps and Closures Market Forecast by Food, 2021-2031 (US$ Bn, AGR %), Without Covid 19
Figure 109 Global Caps and Closures Market Forecast by Healthcare, 2021-2031 (US$ Bn, AGR %), V Shaped Recovery
Figure 110 Global Caps and Closures Market Forecast by Healthcare, 2021-2031 (US$ Bn, AGR %), U Shaped Recovery
Figure 111 Global Caps and Closures Market Forecast by Healthcare, 2021-2031 (US$ Bn, AGR %), L Shaped Recovery
Figure 112 Global Caps and Closures Market Forecast by Healthcare, 2021-2031 (US$ Bn, AGR %), W Shaped Recovery
Figure 113 Global Caps and Closures Market Forecast by Healthcare, 2021-2031 (US$ Bn, AGR %), Without Covid 19
Figure 114 Global Caps and Closures Market Forecast by Other Applications, 2021-2031 (US$ Bn, AGR %), V Shaped Recovery
Figure 115 Global Caps and Closures Market Forecast by Other Applications, 2021-2031 (US$ Bn, AGR %), U Shaped Recovery
Figure 116 Global Caps and Closures Market Forecast by Other Applications, 2021-2031 (US$ Bn, AGR %), L Shaped Recovery
Figure 117 Global Caps and Closures Market Forecast by Other Applications, 2021-2031 (US$ Bn, AGR %), W Shaped Recovery
Figure 118 Global Caps and Closures Market Forecast by Other Applications, 2021-2031 (US$ Bn, AGR %), Without Covid 19
Figure 119 Global Caps and Closures Market Forecast by Distribution Channel, 2021-2031 (US$ Bn, AGR %)
Figure 120 Global Caps and Closures Market Share Forecast by Distribution Channel, 2020, 2025, 2030 (%)
Figure 121 Global Caps and Closures Market Forecast by Online, 2021-2031 (US$ Bn, AGR %), V Shaped Recovery
Figure 122 Global Caps and Closures Market Forecast by Online, 2021-2031 (US$ Bn, AGR %), U Shaped Recovery
Figure 123 Global Caps and Closures Market Forecast by Online, 2021-2031 (US$ Bn, AGR %), L Shaped Recovery
Figure 124 Global Caps and Closures Market Forecast by Online, 2021-2031 (US$ Bn, AGR %), W Shaped Recovery
Figure 125 Global Caps and Closures Market Forecast by Online, 2021-2031 (US$ Bn, AGR %), Without Covid 19
Figure 126 Global Caps and Closures Market Forecast by Offline, 2021-2031 (US$ Bn, AGR %), V Shaped Recovery
Figure 127 Global Caps and Closures Market Forecast by Offline, 2021-2031 (US$ Bn, AGR %), U Shaped Recovery
Figure 128 Global Caps and Closures Market Forecast by Offline, 2021-2031 (US$ Bn, AGR %), L Shaped Recovery
Figure 129 Global Caps and Closures Market Forecast by Offline, 2021-2031 (US$ Bn, AGR %), W Shaped Recovery
Figure 130 Global Caps and Closures Market Forecast by Offline, 2021-2031 (US$ Bn, AGR %), Without Covid 19
Figure 131 Global Caps and Closures Market Forecast by Region, 2021-2031 (US$ Bn, AGR %)
Figure 132 Global Caps and Closures Market Share Forecast by Region, 2020, 2025, 2030 (%)
Figure 133 North America Caps and Closures Market, 2021-2031 (US$ Bn, AGR %), V Shaped Recovery
Figure 134 North America Caps and Closures Market, 2021-2031 (US$ Bn, AGR %), U Shaped Recovery
Figure 135 North America Caps and Closures Market, 2021-2031 (US$ Bn, AGR %), L Shaped Recovery
Figure 136 North America Caps and Closures Market, 2021-2031 (US$ Bn, AGR %), W Shaped Recovery
Figure 137 North America Caps and Closures Market, 2021-2031 (US$ Bn, AGR %), Without Covid 19
Figure 138 North America Caps and Closures Market Forecast by Product, 2021-2031 (US$ Bn, AGR %)
Figure 139 North America Caps and Closures Market Share Forecast by Product, 2021, 2026, 2031 (%)
Figure 140 Global Caps and Closures Market Forecast by Application, 2021-2031 (US$ Bn, AGR %)
Figure 141 Global Caps and Closures Market Share Forecast by Application, 2021, 2026, 2031 (%)
Figure 142 North America Caps and Closures Market Forecast by Distribution Channel, 2021-2031 (US$ Bn, AGR %)
Figure 143 North America Caps and Closures Market Share Forecast by Distribution Channel, 2020, 2025, 2030 (%)
Figure 144 North America Caps and Closures Market Forecast by Country, 2021-2031 (US$ Bn, AGR %)
Figure 145 North America Caps and Closures Market Share Forecast by Country, 2020, 2025, 2030 (%)
Figure 146 U.S. Caps and Closures Market, 2021-2031 (US$ Bn, AGR %), V Shaped Recovery
Figure 147 U.S. Caps and Closures Market, 2021-2031 (US$ Bn, AGR %), U Shaped Recovery
Figure 148 U.S. Caps and Closures Market, 2021-2031 (US$ Bn, AGR %), L Shaped Recovery
Figure 149 U.S. Caps and Closures Market, 2021-2031 (US$ Bn, AGR %), W Shaped Recovery
Figure 150 U.S. Caps and Closures Market, 2021-2031 (US$ Bn, AGR %), Without Covid 19
Figure 151 U.S. Caps and Closures Market Forecast by Product, 2021-2031 (US$ Bn, AGR %)
Figure 152 U.S. Caps and Closures Market Share Forecast by Product, 2021, 2026, 2031 (%)
Figure 153 U.S. Caps and Closures Market Forecast by Application, 2021-2031 (US$ Bn, AGR %)
Figure 154 U.S. Caps and Closures Market Share Forecast by Application, 2021, 2026, 2031 (%)
Figure 155 U.S. Caps and Closures Market Forecast by Distribution Channel, 2021-2031 (US$ Bn, AGR %)
Figure 156 U.S. Caps and Closures Market Share Forecast by Distribution Channel, 2020, 2025, 2030 (%)
Figure 157 Rest of North America Caps and Closures Market, 2021-2031 (US$ Bn, AGR %), V Shaped Recovery
Figure 158 Rest of North America Caps and Closures Market, 2021-2031 (US$ Bn, AGR %), U Shaped Recovery
Figure 159 Rest of North America Caps and Closures Market, 2021-2031 (US$ Bn, AGR %), L Shaped Recovery
Figure 160 Rest of North America Caps and Closures Market, 2021-2031 (US$ Bn, AGR %), W Shaped Recovery
Figure 161 Rest of North America Caps and Closures Market, 2021-2031 (US$ Bn, AGR %), Without Covid 19
Figure 162 Rest of U.S. Caps and Closures Market Forecast by Product, 2021-2031 (US$ Bn, AGR %)
Figure 163 Rest of U.S. Caps and Closures Market Share Forecast by Product, 2021, 2026, 2031 (%)
Figure 164 Rest of North America Caps and Closures Market Forecast by Application, 2021-2031 (US$ Bn, AGR %)
Figure 165 Rest of North America Caps and Closures Market Share Forecast by Application, 2021, 2026, 2031 (%)
Figure 166 Rest of North America Caps and Closures Market Forecast by Distribution Channel, 2021-2031 (US$ Bn, AGR %)
Figure 167 Rest of North America Caps and Closures Market Share Forecast by Distribution Channel, 2020, 2025, 2030 (%)
Figure 168 Europe Caps and Closures Market, 2021-2031 (US$ Bn, AGR %), V Shaped Recovery
Figure 169 Europe Caps and Closures Market, 2021-2031 (US$ Bn, AGR %), U Shaped Recovery
Figure 170 Europe Caps and Closures Market, 2021-2031 (US$ Bn, AGR %), L Shaped Recovery
Figure 171 Europe Caps and Closures Market, 2021-2031 (US$ Bn, AGR %), W Shaped Recovery
Figure 172 Europe Caps and Closures Market, 2021-2031 (US$ Bn, AGR %), Without Covid 19
Figure 173 Europe Caps and Closures Market Forecast by Product, 2021-2031 (US$ Bn, AGR %)
Figure 174 Europe Caps and Closures Market Share Forecast by Product, 2021, 2026, 2031 (%)
Figure 175 Europe Caps and Closures Market Forecast by Application, 2021-2031 (US$ Bn, AGR %)
Figure 176 Europe Caps and Closures Market Share Forecast by Application, 2021, 2026, 2031 (%)
Figure 177 Europe Caps and Closures Market Forecast by Distribution Channel, 2021-2031 (US$ Bn, AGR %)
Figure 178 Europe Caps and Closures Market Share Forecast by Distribution Channel, 2020, 2025, 2030 (%)
Figure 179 Europe Caps and Closures Market Forecast by Country, 2021-2031 (US$ Bn, AGR %)
Figure 180 Europe Caps and Closures Market Share Forecast by Country, 2020, 2025, 2030 (%)
Figure 181 Germany Caps and Closures Market, 2021-2031 (US$ Bn, AGR %), V Shaped Recovery
Figure 182 Germany Caps and Closures Market, 2021-2031 (US$ Bn, AGR %), U Shaped Recovery
Figure 183 Germany Caps and Closures Market, 2021-2031 (US$ Bn, AGR %), L Shaped Recovery
Figure 184 Germany Caps and Closures Market, 2021-2031 (US$ Bn, AGR %), W Shaped Recovery
Figure 185 Germany Caps and Closures Market, 2021-2031 (US$ Bn, AGR %), Without Covid 19
Figure 186 Germany Caps and Closures Market Forecast by Product, 2021-2031 (US$ Bn, AGR %)
Figure 187 Germany Caps and Closures Market Share Forecast by Product, 2021, 2026, 2031 (%)
Figure 188 Germany Caps and Closures Market Forecast by Application, 2021-2031 (US$ Bn, AGR %)
Figure 189 Germany Caps and Closures Market Share Forecast by Application, 2021, 2026, 2031 (%)
Figure 190 Germany Caps and Closures Market Forecast by Distribution Channel, 2021-2031 (US$ Bn, AGR %)
Figure 191 Germany Caps and Closures Market Share Forecast by Distribution Channel, 2020, 2025, 2030 (%)
Figure 192 U.K. Caps and Closures Market, 2021-2031 (US$ Bn, AGR %), V Shaped Recovery
Figure 193 U.K. Caps and Closures Market, 2021-2031 (US$ Bn, AGR %), U Shaped Recovery
Figure 194 U.K. Caps and Closures Market, 2021-2031 (US$ Bn, AGR %), L Shaped Recovery
Figure 195 U.K. Caps and Closures Market, 2021-2031 (US$ Bn, AGR %), W Shaped Recovery
Figure 196 U.K. Caps and Closures Market, 2021-2031 (US$ Bn, AGR %), Without Covid 19
Figure 197 U.K. Caps and Closures Market Forecast by Product, 2021-2031 (US$ Bn, AGR %)
Figure 198 U.K. Caps and Closures Market Share Forecast by Product, 2021, 2026, 2031 (%)
Figure 199 U.K. Caps and Closures Market Forecast by Application, 2021-2031 (US$ Bn, AGR %)
Figure 200 U.K. Caps and Closures Market Share Forecast by Application, 2021, 2026, 2031 (%)
Figure 201 U.K. Caps and Closures Market Forecast by Distribution Channel, 2021-2031 (US$ Bn, AGR %)
Figure 202 U.K. Caps and Closures Market Share Forecast by Distribution Channel, 2020, 2025, 2030 (%)
Figure 203 Rest of Europe Caps and Closures Market, 2021-2031 (US$ Bn, AGR %), V Shaped Recovery
Figure 204 Rest of Europe Caps and Closures Market, 2021-2031 (US$ Bn, AGR %), U Shaped Recovery
Figure 205 Rest of Europe Caps and Closures Market, 2021-2031 (US$ Bn, AGR %), L Shaped Recovery
Figure 206 Rest of Europe Caps and Closures Market, 2021-2031 (US$ Bn, AGR %), W Shaped Recovery
Figure 207 Rest of Europe Caps and Closures Market, 2021-2031 (US$ Bn, AGR %), Without Covid 19
Figure 208 Rest of Europe Caps and Closures Market Forecast by Product, 2021-2031 (US$ Bn, AGR %)
Figure 209 Rest of Europe Caps and Closures Market Share Forecast by Product, 2021, 2026, 2031 (%)
Figure 210 Rest of Europe Caps and Closures Market Forecast by Application, 2021-2031 (US$ Bn, AGR %)
Figure 211 Rest of Europe Caps and Closures Market Share Forecast by Application, 2021, 2026, 2031 (%)
Figure 212 Rest of Europe Caps and Closures Market Forecast by Distribution Channel, 2021-2031 (US$ Bn, AGR %)
Figure 213 Rest of Europe Caps and Closures Market Share Forecast by Distribution Channel, 2020, 2025, 2030 (%)
Figure 214 Asia Pacific Caps and Closures Market, 2021-2031 (US$ Bn, AGR %), V Shaped Recovery
Figure 215 Asia Pacific Caps and Closures Market, 2021-2031 (US$ Bn, AGR %), U Shaped Recovery
Figure 216 Asia Pacific Caps and Closures Market, 2021-2031 (US$ Bn, AGR %), L Shaped Recovery
Figure 217 Asia Pacific Caps and Closures Market, 2021-2031 (US$ Bn, AGR %), W Shaped Recovery
Figure 218 Asia Pacific Caps and Closures Market, 2021-2031 (US$ Bn, AGR %), Without Covid 19
Figure 219 Asia Pacific Caps and Closures Market Forecast by Product, 2021-2031 (US$ Bn, AGR %)
Figure 220 Asia Pacific Caps and Closures Market Share Forecast by Product, 2021, 2026, 2031 (%)
Figure 221 Asia Pacific Caps and Closures Market Forecast by Application, 2021-2031 (US$ Bn, AGR %)
Figure 222 Asia Pacific Caps and Closures Market Share Forecast by Application, 2021, 2026, 2031 (%)
Figure 223 Asia Pacific Caps and Closures Market Forecast by Distribution Channel, 2021-2031 (US$ Bn, AGR %)
Figure 224 Asia Pacific Caps and Closures Market Share Forecast by Distribution Channel, 2020, 2025, 2030 (%)
Figure 225 Asia Pacific Caps and Closures Market Forecast by Country, 2021-2031 (US$ Bn, AGR %)
Figure 226 Asia Pacific Caps and Closures Market Share Forecast by Country, 2020, 2025, 2030 (%)
Figure 227 China Caps and Closures Market, 2021-2031 (US$ Bn, AGR %), V Shaped Recovery
Figure 228 China Caps and Closures Market, 2021-2031 (US$ Bn, AGR %), U Shaped Recovery
Figure 229 China Caps and Closures Market, 2021-2031 (US$ Bn, AGR %), L Shaped Recovery
Figure 230 China Caps and Closures Market, 2021-2031 (US$ Bn, AGR %), W Shaped Recovery
Figure 231 China Caps and Closures Market, 2021-2031 (US$ Bn, AGR %), Without Covid 19
Figure 232 China Caps and Closures Market Forecast by Product, 2021-2031 (US$ Bn, AGR %)
Figure 233 China Caps and Closures Market Share Forecast by Product, 2021, 2026, 2031 (%)
Figure 234 China Caps and Closures Market Forecast by Application, 2021-2031 (US$ Bn, AGR %)
Figure 235 China Caps and Closures Market Share Forecast by Application, 2021, 2026, 2031 (%)
Figure 236 China Caps and Closures Market Forecast by Distribution Channel, 2021-2031 (US$ Bn, AGR %)
Figure 237 China Caps and Closures Market Share Forecast by Distribution Channel, 2020, 2025, 2030 (%)
Figure 238 India Caps and Closures Market, 2021-2031 (US$ Bn, AGR %), V Shaped Recovery
Figure 239 India Caps and Closures Market, 2021-2031 (US$ Bn, AGR %), U Shaped Recovery
Figure 240 India Caps and Closures Market, 2021-2031 (US$ Bn, AGR %), L Shaped Recovery
Figure 241 India Caps and Closures Market, 2021-2031 (US$ Bn, AGR %), W Shaped Recovery
Figure 242 India Caps and Closures Market, 2021-2031 (US$ Bn, AGR %), Without Covid 19
Figure 243 India Caps and Closures Market Forecast by Product, 2021-2031 (US$ Bn, AGR %)
Figure 244 India Caps and Closures Market Share Forecast by Product, 2021, 2026, 2031 (%)
Figure 245 India Caps and Closures Market Forecast by Application, 2021-2031 (US$ Bn, AGR %)
Figure 246 India Caps and Closures Market Share Forecast by Application, 2021, 2026, 2031 (%)
Figure 247 India Caps and Closures Market Forecast by Distribution Channel, 2021-2031 (US$ Bn, AGR %)
Figure 248 India Caps and Closures Market Share Forecast by Distribution Channel, 2020, 2025, 2030 (%)
Figure 249 Rest of Asia Pacific Caps and Closures Market, 2021-2031 (US$ Bn, AGR %), V Shaped Recovery
Figure 250 Rest of Asia Pacific Caps and Closures Market, 2021-2031 (US$ Bn, AGR %), U Shaped Recovery
Figure 251 Rest of Asia Pacific Caps and Closures Market, 2021-2031 (US$ Bn, AGR %), L Shaped Recovery
Figure 252 Rest of Asia Pacific Caps and Closures Market, 2021-2031 (US$ Bn, AGR %), W Shaped Recovery
Figure 253 Rest of Asia Pacific Caps and Closures Market, 2021-2031 (US$ Bn, AGR %), Without Covid 19
Figure 254 Rest of Asia Pacific Caps and Closures Market Forecast by Product, 2021-2031 (US$ Bn, AGR %)
Figure 255 Rest of Asia Pacific Caps and Closures Market Share Forecast by Product, 2021, 2026, 2031 (%)
Figure 256 Rest of Asia Pacific Caps and Closures Market Forecast by Application, 2021-2031 (US$ Bn, AGR %)
Figure 257 Rest of Asia Pacific Caps and Closures Market Share Forecast by Application, 2021, 2026, 2031 (%)
Figure 258 Rest of Asia Pacific Caps and Closures Market Forecast by Distribution Channel, 2021-2031 (US$ Bn, AGR %)
Figure 259 Rest of Asia Pacific Caps and Closures Market Share Forecast by Distribution Channel, 2020, 2025, 2030 (%)
Figure 260 Rest of The World Caps and Closures Market, 2021-2031 (US$ Bn, AGR %), V Shaped Recovery
Figure 261 Rest of The World Caps and Closures Market, 2021-2031 (US$ Bn, AGR %), U Shaped Recovery
Figure 262 Rest of The World Caps and Closures Market, 2021-2031 (US$ Bn, AGR %), L Shaped Recovery
Figure 263 Rest of The World Caps and Closures Market, 2021-2031 (US$ Bn, AGR %), W Shaped Recovery
Figure 264 Rest of The World Caps and Closures Market, 2021-2031 (US$ Bn, AGR %), Without Covid 19
Figure 265 Rest of The World Caps and Closures Market Forecast by Product, 2021-2031 (US$ Bn, AGR %)
Figure 266 Rest of The World Caps and Closures Market Share Forecast by Product, 2021, 2026, 2031 (%)
Figure 267 Rest of The World Caps and Closures Market Forecast by Application, 2021-2031 (US$ Bn, AGR %)
Figure 268 Rest of The World Caps and Closures Market Share Forecast by Application, 2021, 2026, 2031 (%)
Figure 269 Rest of The World Caps and Closures Market Forecast by Distribution Channel, 2021-2031 (US$ Bn, AGR %)
Figure 270 Rest of The World Caps and Closures Market Share Forecast by Distribution Channel, 2020, 2025, 2030 (%)
Figure 271 Amcor Ltd. Total Company Sales 2015-2019 (US$ million, AGR %)
Figure 272 Amcor Ltd. Net Income 2015-2019 (US$ million, AGR %)
Figure 273 AptarGroup, Inc. Total Company Sales 2015-2019 (US$ million, AGR %)
Figure 274 AptarGroup, Inc. Net Income 2015-2019 (US$ million, AGR %)
Figure 275 Ball Corporation Total Company Sales 2015-2019 (US$ million, AGR %)
Figure 276 Ball Corporation Net Income 2015-2019 (US$ million, AGR %)
Figure 277 BASF SE Company Total Company Sales 2015-2019 (US$ million, AGR %)
Figure 278 BASF SE Company Net Income 2015-2019 (US$ million, AGR %)
Figure 279 Crown Holdings, Inc. Total Company Sales 2015-2019 (US$ million, AGR %)
Figure 280 Crown Holdings, Inc. Net Income 2015-2019 (US$ million, AGR %)
Figure 281 DS Smith Plc Total Company Sales 2015-2019 (US$ million, AGR %)
Figure 282 DS Smith Plc Net Income 2015-2019 (US$ million, AGR %)
Figure 283 Sonoco Products Co. Total Company Sales 2015-2019 (US$ million, AGR %)
Figure 284 Sonoco Products Co. Net Income 2015-2019 (US$ million, AGR %)
Figure 285 Tetra Laval Total Company Sales 2015-2019 (US$ million, AGR %)
Figure 286 WestRock Company Total Company Sales 2015-2019 (US$ million, AGR %)
Figure 287 WestRock Company Net Income 2015-2019 (US$ million, AGR %)
Figure 288 Berry Global Inc. Total Company Sales 2015-2019 (US$ million, AGR %)
Figure 289 Berry Global Inc. Net Income 2015-2019 (US$ million, AGR %)
Figure 290 Smurfit Kappa Group PLC Total Company Sales 2015-2019 (US$ million, AGR %)
Figure 291 Smurfit Kappa Group PLC Net Income 2015-2019 (US$ million, AGR %)
Figure 292 Silgan Holdings Inc. Total Company Sales 2015-2019 (US$ million, AGR %)
Figure 293 Silgan Holdings Inc. Net Income 2015-2019 (US$ million, AGR %)
Figure 294 Intertape Polymer Group Inc. Total Company Sales 2015-2019 (US$ million, AGR %)
Figure 295 Intertape Polymer Group Inc. Net Income 2015-2019 (US$ million, AGR %)
Figure 296 BRAMBLES LIMITED Company Total Company Sales 2015-2019 (US$ million, AGR %)
Figure 297 BRAMBLES LIMITED Company Net Income 2015-2019 (US$ million, AGR %)
Companies Profiled in the Report:
Amcor Ltd.
AptarGroup Inc.
Ball Corporation
BASF SE
Berry Global Inc.
Brambles Limited
Crow Holdings Inc.
DS Smith Plc (machines)
Intertape Polymer Group Inc.
Silgan Holdings Inc.
Smurfit Kappa Group PLC
Sonoco Product Co.
Tetra Laval
WestRock Company
WS Packaging Group, Inc.
List of Companies Mentioned in the Report:
AB Container, Inc.
Abtec, Inc.
Advantech Plastics, LLC
Amcor Ltd.
AptarGroup Inc.
ARCHANA AMPOULES PVT.LTD.
Associated Bag
Autronic Plastics, Inc.
Ball Corporation
BASF SE
Bermar Associates, Inc.
Berry Global Inc.
Brambles Limited
Caplugs
CLASSIC CROWNS & CLOSURES
Classic Packaging Corp.
CPC (Colder Products Company)
Crow Holdings Inc.
CRYSTAL PLASTICS
Dash Packaging Inc.
DS Smith Plc (machines)
Enercon
Ferragamo Packaging
Illing Company
Illing Company, Inc.
Intertape Polymer Group Inc.
Leech Industries, Inc.
MEDIA MANOEUVRE
METAL CLOSURES PVT.LTD.
MJS Packaging
MJS Packaging
MOCAP LLC
Mold-Rite Plastics
Pacific Bridge Packaging, Inc.
PLASTIC EXPORT ZUNDERT(I) PVT. LTD.
Polymer Molding, Inc.
Poppelmann Plastics USA
RISHIRAJ INDUSTRIES
RUDA CONTAINERS
S.K.INDUSTRIES.
SAMIKSHA PACKAGING
SHREE SAMARTH POPLYPLAST INDUSTRY
Silgan Holdings Inc.
Smurfit Kappa Group PLC
Sonoco Product Co.
Tetra Laval
The Rodon Group
VARSA PLASTIC IND.PVT.LTD.
WestRock Company
WS Packaging Group, Inc.
List of Organizations Mentioned in the Report:
Association for Packaging and Processing Technologies
Association of Industrial Metallizers, Coaters and Laminators
Association of Visual Packaging Manufacturers
Contract Manufacturing and Packaging Association
Corrugated Packaging Alliance
Envelope Manufacturers Association
EPS Industry Alliance
Fibre Box Association
Flexible Packaging Association
Flexographic Technical Association
Foil Stamping and Embossing Association
Foodservice & Packaging Institute
Glass Packaging Institute
Gravure Association of the Americas
Healthcare Compliance Packaging Council
Institute of Packaging Professionals
International Molded Fiber Association
Material Handling Industry of America
National Institute of Packaging, Handling & Logistics Engineers
The Independent Packaging Association
Download sample pages
Complete the form below to download your free sample pages for Caps & Closures Market Report 2021-2031Related reports
-
Active, Smart and Intelligent Packaging Market Report 2020-2030
Active, Smart And Intelligent Packaging market is projected to reach US$23.76 billion in 2020.
...Full DetailsPublished: 18 March 2020 -

Thin Wall Packaging Market Report 2021-2031
The market growth is attributed to the rising economic development, and consequent rise in consumer spending across emerging economies such...Full DetailsPublished: 17 December 2020 -

Luxury Packaging Market Forecast 2020-2030
The increase in packaging innovations is another major factor anticipated to drive the market growth in years to come.
...Full DetailsPublished: 01 May 2020 -

Recycled Polyethylene Terephthalate (rPET) Market Report 2021-2031
Affordability, longevity, lightweight, low or no maintenance, eco-friendly, resistant to corrosion, termite and bug resistance, good weather ability, and versatility...Full DetailsPublished: 04 May 2021 -
E-Commerce Packaging Market Report 2020-2030
Our 300+ page report provides 400+ tables and charts/graphs. Read on to discover the most lucrative areas in the industry...
Full DetailsPublished: 30 June 2020 -

Packaging Automation Market Report 2020-2030
Packaging Automation Market is Driven by the increasing adoption of robotic technologies such as robotic process automation and automated conveyors.
...Full DetailsPublished: 27 July 2020 -

Thermoformed Plastic Packaging Market Report 2020-2030
Thermoforming is a manufacturing process in which paperboard, plastic, or aluminium sheets are heated to a temperature such that the...
Full DetailsPublished: 02 March 2020 -
Sustainable Plastics Market Report 2020-2030
Our report reveals the technologies and companies which hold the greatest potential. In particular, exploring and analysing the activities of...Full DetailsPublished: 16 September 2020 -

Labeling Adhesives in Frozen Food Market Report 2020-2030
Due to the rising environmental concerns, the companies are developing bio-based hot melt adhesives to replace chemical based ones. In...Full DetailsPublished: 07 October 2020 -

Next-Generation Products in Tobacco Market Report 2020-2030
Visiongain assesses that the next generation products in tobacco industry market will generate revenues of $15.4bn in 2020 and there...
Full DetailsPublished: 06 May 2020
Download sample pages
Complete the form below to download your free sample pages for Caps & Closures Market Report 2021-2031Do you have any custom requirements we can help you with?
Any specific country, geo region, market segment or specific company information?
Email us today, we can discuss your needs and see how we can help: jamie.roberts@visiongain.com
Would you like a free report overview of the report of your choice?
If so, please drop an email to Jamie Roberts stating your chosen report title to jamie.robertsvisiongain.com
Visiongain packaging related reports are compiled using a broad and rich mixture of both primary and secondary information to produce an overall industry outlook. In order to provide our clients with the best product possible product, visiongain analysts reach out to market-leading vendors and industry experts but also review a wealth of financial data and product information from a vast range of sources. To find out more about our reports methodology, please email jamie.roberts@visiongain.com
Would you like to get the latest Visiongain packaging reports catalogue?
What are the dynamic growth sectors? where are the regional business opportunities?
Which technologies will prevail and who are the leading companies succeeding in these sectors and why?
If you want definitive answers to business critical questions, discover Visiongain’s full range of business intelligence reports.
If so, please email Jamie Roberts on jamie.roberts@visiongain.com or call her today on +44 207 336 6100
Adhesive & Sealant Council
Alliance of Foam Packaging Recyclers
American Bakers Association
American Chemistry Council
American Forest & Paper Association
American Frozen Food Institute
American Institute of Food Distributors
American Iron and Steel Institute
American Management Association
American National Standards Institute
American Plastics Council (APC)
American Society for Testing and Materials
Association for Suppliers of Printing, Publishing
AICC, The Independent Packaging Association
Association of Industrial Metallizers, Coaters and Laminators (AIMCAL)
Automated Identification Manufacturer
Automated Imaging Association
Can Manufacturers Institute
Chocolate Manufacturers Association of the U.S.A.
Consumer Healthcare Products Association
Contract Manufacturing and Packaging Association
Converting Equipment Manufacturers Association
Corrugated Packaging Council
Drug, Chemical & Allied Trade Association
Envelope Manufacturers Association
Fibre Box Association
Flexible Packaging Association
Flexographic Technical AssociationFlexographic Technical Association
Foil Stamping and Embossing Association
Food and Drug Law Institute
Food Institute
Food Marketing Institute
Food Processing Machinery & Supplies Association
Foodservice & Packaging Institute
Glass Packaging Institute
Graphic Arts Technical Foundation
Gravure Association of America
Grocery Manufacturers of America
Healthcare Compliance Packaging Council
High Definition Flexo Consortium
Institute of Food Technologists
Institute of Packaging Professionals
International Association of Food Industry Suppliers
International Bottled Water Association
International Dairy Foods Association
International Foodservice Manufacturers Association
International Safe Transit Association
Label Printing Industries of America
Material Handling Industry of America
National Association of Container Distributors
National Association of Manufacturers
National Chicken Council
National Coil Coating Association
National Confectioners Association of the U.S.A.
National Freight Claim & Security
National Institute of Packaging, Handling & Logistics Engineers
National Paper Trade Association
National Wooden Pallet & Container
Open Modular Architecture Controls (OMAC) Packaging Workgroup
Packaging Association of Canada
Paperboard Packaging Council
Petroleum Packaging Council
Pharmaceutical Research and Manufacturers of America
PMMI: The Association for Packaging and Processing Technologies
Polystyrene Packaging Council
Pressure Sensitive Tape Council
Printing Industries of America
Processing and Packaging Machinery Association (PPMA)
Produce Marketing Association, Inc.
Research & Development Associates for Military Food & Packaging Systems
Robotic Industries Association (RIA)
Snack Food Association
Soap & Detergent Association
Society of Glass and Ceramic Decorators
Society of Manufacturing Engineers
Society of Plastics Engineers (SPE)
Society of the Plastics Industry (SPI)
Steel Recycling Institute
Steel Shipping Containers Institute
Tag and Label Manufacturers Institute
Technical Association of the Pulp & Paper Industry
The Aluminum Association
Transportation Consumer Protection Council
Transportation Loss Prevention & Security Association
Tube Council of North America
Uniform Code Council, Inc.
Western Packaging Association (WPA)
World Packaging Organisation
Latest Packaging news
Visiongain Publishes Caps & Closures Market Report 2024-2034
The global caps & closures market was valued at US$80.8 billion in 2023 and is projected to grow at a CAGR of 9% during the forecast period 2024-2034.
22 February 2024
Visiongain Publishes Flexible (Converted) Plastic Packaging Market Report 2024-2034
The global Flexible (Converted) Plastic Packaging market was valued at US$157.3 billion in 2023 and is projected to grow at a CAGR of 5.4% during the forecast period 2024-2034.
04 January 2024
Visiongain Publishes Beverage Packaging Market Report 2023-2033
The global Beverage Packaging market was valued at US$144.3 billion in 2022 and is projected to grow at a CAGR of 4.6% during the forecast period 2023-2033.
28 September 2023
Visiongain Publishes Cosmetics Packaging Market Report 2023-2033
The global Cosmetics Packaging market is projected to grow at a CAGR of 4.3% by 2033
21 July 2023


