1. Report Overview
1.1 Global NGP Overview
1.1.1 Types and models
1.1.2 Flavours
1.1.3 Claims Made About E-Cigarettes
1.2 Global Next-Generation Products in the Tobacco Industry Market Segmentation
1.3 Market Definition
1.4 How This Report Delivers
1.5 Key Questions Answered By This Analytical Report Include:
1.6 Why You Should Read This Report?
1.7 Methodology
1.8 Frequently Asked Questions (FAQ)
1.9 Associated Visiongain Reports
2. Introduction to Next-Generation Products in Tobacco Industry
2.1 Overview of Nicotine in E-Cigarette Aerosol and Nicotine Delivery
2.1.1 Nicotine Delivery from E-Cigarettes to the User
2.1.2 Nicotine Levels in E-cigarette Aerosol
2.1.3 Other Means of Exposure to Nicotine from E-Liquids
2.2 E-Liquid Components and Characteristics
2.2.1 Flavours
2.2.2 Sweeteners
2.2.3 pH
2.2.4 E-liquid Base Constituents: Propylene Glycol (PG) and Vegetable Glycerin (VG)
2.2.5 Alcohol
2.2.6 Nicotyrine
2.3 User Awareness of Nicotine Levels
2.3.1 Accuracy of E-Liquid and E-Cigarette Nicotine Labels
2.3.2 Nicotine as a Motivating Factor for use
2.4 E-Cigarette Hardware Characteristics and Settings
2.4.1 E-Cigarette Generations, Models/Types
2.4.2 Effects of Generation/Model/Type on Aerosol and Nicotine Delivery
2.4.3 User Perception of Model/Type Effects on Smoking Cessation and Alleviation of Smoking Urges
2.5 Airflow and Activation Method (Button-activated vs. Airflow-activated)
2.5.1 Power/Heat
2.6 E-Cigarette Use Patterns
2.6.1 Puff Topography and Level of E-Cigarette Experience
3. Global Next-Generation Products in Tobacco Market
3.1 Global Next-Generation Products in the Tobacco Market Forecast 2020-2030
3.1.1 Global Market Size in Terms of Value
3.1.2 Global Market Size in Terms of Number of Users (Smokers)
3.1.3 Global Market Size by Region in Terms of Value
3.1.4 Global Market Size by Region in Terms of Number of Users
4. Global Market Dynamics
4.1 Effect of Next-Generation Products on the Tobacco Market
4.2 Tobacco and Advertising Regulations
4.3 Plain Packaging of Tobacco Products
4.4 Drivers and Restraints
4.4.1 Changing Consumer Preferences Towards Less Harmful Tobacco Products
4.4.2 Increasing Investment by Key Players
4.4.3 Launch of New Next-Generation Products
4.4.4 Stringent Government Regulations
4.5 Awareness Programs
4.5.1 According to the World Health Organisation (WHO)
4.5.2 WHO encourages governments worldwide to protect people from the harms of tobacco Measures include:
4.6 Threat of New Entrants
4.7 Opportunity
4.8 Marketing Strategies
4.8.1 Priced To Sell
4.8.2 Location Is Everything
4.8.3 The Value Of Store Assessments
4.9 Importance of Flavours in NGP Tobacco Market
4.9.1 Youth and Young Adult Perceptions of Flavoured Products
4.9.2 Marketing of Flavoured Tobacco Products
4.9.3 Menthol
5. Next-Generation Products in the Tobacco Market Forecast by Device Type 2020-2030
5.1 Global Market Size by Device Type
5.2 Global Market Share by Device Type
5.3 E-Cigarette Market
5.3.1 Overview
5.3.2 Global E-Cigarette Market by Value
5.3.3 Global E-Cigarette Market by Region
5.4 Vaps Market
5.4.1 Overview
5.4.2 Global Vaps Market by Value
5.4.3 Global Vaps Market by Region
5.5 Mods Market
5.5.1 Overview
5.5.2 Global Mods Market by Value
5.5.3 Global Mods Market by Region
5.6 e-Hookahs Market
5.6.1 Overview
5.6.2 Global e-Hookahs Market by Value
5.6.3 Global e-Hookahs Market by Region
5.7 Pens Market
5.7.1 Overview
5.7.2 Global Pens Market by Value
5.7.3 Global Pens Market by Region
5.8 Other Device Market
5.8.1 Overview
5.8.2 Global Other Device Market by Value
5.8.3 Global Other Device Market by Region
6. Next-Generation Products in the Tobacco Market Forecast by Component 2020-2030
6.1 Global NGP Market Size by Component
6.2 Global NGP Market Share by Component
6.3 Atomizer Market
6.3.1 Overview
6.3.2 Global Atomizer Market by Value
6.3.3 Global Atomizer Market by Region
6.4 Vape Mod Market
6.4.1 Overview
6.4.2 Global Vape Mod Market by Value
6.4.3 Global Vape Mod Market by Region
6.5 Cartomizer Market
6.5.1 Overview
6.5.2 Global Cartomizer Market by Value
6.5.3 Global Cartomizer Market by Region
6.6 E-liquid Market
6.6.1 Overview
6.6.2 Global E-liquid Market by Value
6.6.3 Global E-liquid Market by Region
6.7 Battery Market
6.7.1 Overview
6.7.2 Global Battery Market by Value
6.7.3 Global Battery Market by Region
6.8 Other Component Market
6.8.1 Overview
6.8.2 Global Other Component Market by Value
6.8.3 Global Other Component Market by Region
7. Next-Generation Products in the Tobacco Market Forecast by System 2020-2030
7.1 Global NGP Market Size by System
7.2 Global NGP Market Share by System
7.3 Open Vaping System Market
7.3.1 Overview
7.3.2 Global Open Vaping System Market by Value
7.3.3 Global Open Vaping System Market by Region
7.4 Closed Vaping System Market
7.4.1 Overview
7.4.2 Global Closed Vaping System Market by Value
7.4.3 Global Closed Vaping System Market by Region
7.5 Semi-Closed Vaping System Market
7.5.1 Overview
7.5.2 Global Semi-Closed Vaping System Market by Value
7.5.3 Global Semi-Closed Vaping System Market by Region
7.6 Other Vaping System Market
7. 6.1 Overview
7. 6.2 Global Other Vaping System Market by Value
7. 6.3 Global Other Vaping System Market by Region
8. Next-Generation Products in the Tobacco Market Forecast by Product Type 2020-2030
8.1 Global NGP Market Size by Product Type
8.2 Global NGP Market Share by Product Type
8.3 Tobacco Heating Products Market
8.3.1 Overview
8.3.1 Global Tobacco Heating Products Market by Value
8.3.2 Global Tobacco Heating Products Market by Region
8.4 Vapour Products Market
8.4.1 Overview
8.4.1 Global Vapour Products Market by Value
8.4.2 Global Vapour Products Market by Region
8.5 Snus Products Market
8.5.1 Overview
8.5.1 Global Snus Products Market by Value
8.5.2 Global Snus Products Market by Region
8.6 Other Product Type Market
8.6.1 Overview
8.6.1 Global Other Product Type Market by Value
8.6.2 Global Other Product Type Market by Region
9. Next-Generation Products in the Tobacco Market Forecast by Age Group 2020-2030
9.1 Global NGP Market Size by Age Group
9.2 Global NGP Market Share by Age Group
9.3 18-30 Age Market
9.3.1 Overview
9.3.1 Global 18-30 Age Market by Value
9.3.2 Global 18-30 Age Market by Region
9.4 31-44 Age Market
9.4.1 Overview
9.4.1 Global 31-44 Age Market by Value
9.4.2 Global 31-44 Age Market by Region
9.5 Market
9.5.1 Overview
9.5.1 Global 45-60 Age Market by Value
9.5.2 Global 45-60 Age Market by Region
9.6 61&Above Age Market
9.6.1 Overview
9.6.1 Global 61&Above Age Market by Value
9.6.2 Global 61&Above Age Market by Region
10. Next-Generation Products in the Tobacco Market Forecast by Distribution Channel 2020-2030
10.1 Global Market Size by Distribution Channel
10.2 Global Market Share by Distribution Channel
10.3 Online Buying Market
10.3.1 Overview
10.3.1 Global Online Buying Market by Value
10.3.2 Global Online Buying Market by Region
10.4 Retail Stores Market
10.4.1 Overview
10.4.1 Global Retail Stores Market by Value
10.4.2 Global Retail Stores Market by Region
10.5 Convenience Store Market
10.5.1 Overview
10.5.1 Global Convenience Store Market by Value
10.5.2 Global Convenience Store Market by Region
10.6 Drug Store Market
10.6.1 Overview
10.6.1 Global Drug Store Market by Value
10.6.2 Global Drug Store Market by Region
10.7 Newsstand Market
10.7.1 Overview
10.7.1 Global Newsstand Market by Value
10.7.2 Global Newsstand Market by Region
10.8 Tobacconist Store Market
10.8.1 Overview
10.8.1 Global Tobacconist Store Market by Value
10.8.2 Global Tobacconist Store Market by Region
10.9 Specialty E-cigarette Store Market
10.9.1 Overview
10.9.1 Global Specialty E-cigarette Store Market by Value
10.9.2 Global Specialty E-cigarette Store Market by Region
10.10 Other Distribution Channel Market
10.10.1 Overview
10.10.1 Global Other Distribution Channel Market by Value
10.10.2 Global Other Distribution Channel Market by Region
11. North America Next-Generation Products in the Tobacco Market
11.1 Overview
11.2 North America NGP Market Size by Value
11.3 North America NGP Market Size by Number of User
11.4 North America NGP Market Share by Country
11.5 North America NGP Market Size by Country
11.6 North America NGP Market Size by Device Type
11.7 North America NGP Market Size by Component
11.8 North America NGP Market Size by System
11.9 North America NGP Market Size by Product Type
11.10 North America NGP Market Size by Age Group
11.11 North America NGP Market Size by Distribution Channel
12. Europe Next-Generation Products in the Tobacco Market
12.1 Overview
12.2 Europe NGP Market Size by Value
12.3 Europe NGP Market Size by Number of User
12.4 Europe NGP Market Share by Country
12.5 Europe NGP Market Size by Country
12.6 Europe NGP Market Size by Device Type
12.7 Europe NGP Market Size by Component
12.8 Europe NGP Market Size by System
12.9 Europe NGP Market Size by Product Type
12.10 Europe NGP Market Size by Age Group
12.11 Europe NGP Market Size by Distribution Channel
13. Asia-Pacific Next-Generation Products in the Tobacco Market
13.1 Overview
13.2 Asia-Pacific NGP Market Size by Value
13.3 Asia-Pacific NGP Market Size by Number of User
13.4 Asia-Pacific NGP Market Share by Country
13.5 Asia-Pacific NGP Market Size by Country
13.6 Asia-Pacific NGP Market Size by Device Type
13.7 Asia-Pacific NGP Market Size by Component
13.8 Asia-Pacific NGP Market Size by System
13.9 Asia-Pacific NGP Market Size by Product Type
13.10 Asia-Pacific NGP Market Size by Age Group
13.11 Asia-Pacific NGP Market Size by Distribution Channel
14. Middle East & Africa Next-Generation Products in the Tobacco Market
14.1 Overview
14.2 Middle East & Africa NGP Market Size by Value
14.3 Middle East & Africa NGP Market Size by Number of User
14.4 Middle East & Africa NGP Market Share by Country
14.5 Middle East & Africa NGP Market Size by Country
14.6 Middle East & Africa NGP Market Size by Device Type
14.7 Middle East & Africa NGP Market Size by Component
14.8 Middle East & Africa NGP Market Size by System
14.9 Middle East & Africa NGP Market Size by Product Type
14.10 Middle East & Africa NGP Market Size by Age Group
14.11 Middle East & Africa NGP Market Size by Distribution Channel
15. Latin America Next-Generation Products in the Tobacco Market
15.1 Overview
15.2 Latin America NGP Market Size by Value
15.3 Latin America NGP Market Size by Number of User
15.4 Latin America NGP Market Share by Country
15.5 Latin America NGP Market Size by Country
15.6 Latin America NGP Market Size by Device Type
15.7 Latin America NGP Market Size by Component
15.8 Latin America NGP Market Size by System
15.9 Latin America NGP Market Size by Product Type
15.10 Latin America NGP Market Size by Age Group
15.11 Latin America NGP Market Size by Distribution Channel
16. Global Next Generation Products Mapping and Analysis
16.1 What To Look For In An E-Cigarette?
16.1.1 Vapor Quality
16.1.2 Ease of Use
16.1.3 Refill and Delivery System
16.1.4 Size/battery life
16.1.5 Flavors
16.1.6 Appearance
16.2 Smok Pozz X
16.2.1 Variable Wattage Up to 40 W
16.2.2 Performance – 0.6 Ohm Coil
16.2.3 Ease of Use
16.2.4 Comfort and Portability
16.3 Voopoo Drag Mini Platinum
16.3.1 Variable Wattage Up to 117 W
16.3.2 Performance – VW Mode
16.3.3 Performance – TC Mode
16.3.4 Ease of Use
16.4 Smok A-Priv
16.4.1 Performance – VW Mode
16.4.2 Performance – TC Mode
16.4.3 Comfort and Portability
16.5 Smok D-Barrel
16.5.1 Variable Wattage Up to 225 W
16.5.2 Performance – VW Mode
16.5.3 Performance – TC Mode
16.5.4 Comfort and Portability
16.6 Voopoo Drag 2
16.6.1 Performance – VW Mode and Fit Mode
16.6.2 Performance – TC mode
16.6.3 Changing Modes and Navigation
16.6.4 Ease of Use
16.6.5 Comfort and Portability
16.7 Smok RPM 40
16.7.1 Performance – RPM Pod
16.7.2 Performance – Nord Pod
16.7.3 Ease of Use
16.7.4 Comfort and Portability
16.8 Nu-X CBD Disposables
16.8.1 Vapor Production
16.8.2 Build Quality
16.9 Smoozie E-Juice
16.9.1 Strawberries Gone Wild – Rating 4.5/5
16.9.2 Awesome Apple Sour – Rating 3.5/5
16.9.3 Ki-Berry Pear Sour Ice – Rating 4.5/5
16.10 Urbul
16.10.1 Vapor Production and Dosing
16.10.2 Responsiveness
16.10.3 Flavour
16.11 Lost Vape Orion DNA Go
16.11.1 Performance – Vapor Production
16.11.2 Performance – Flavour
16.11.3 Comfort and Portability
17. SWOT Analysis of Global NGP Tobacco Market
17.1 Strengths
17.1.1 Consumer proposition
17.1.2 Awareness and interest
17.1.3 Rapid adoption
17.1.4 Improving products
17.1.5 Falling costs
17.1.6 Vocal Consumers
17.1.7 Category loyalty
17.1.8 Ease of Manufacturing and Sales
17.2 Weaknesses
17.2.1 Product Experience
17.2.2 Consumer Confusion
17.2.3 Policy-Maker/Thought Leader Confusion and Opposition
17.2.4 Linkages with Tobacco
17.2.5 Unreliable operators
17.2.6 Disorganised industry
17.2.7 Price Competition
17.2.8 Market Variations
17.3 Opportunities
17.3.2 Educate and Build Support
17.3.3 Develop Retail and Distribution
17.3.4 Raise the Ante
17.3.5 Medical regulation
17.3.6 Emerging markets
17.4 Threats
17.4.1 E-cig-Specific Regulation
17.4.2 Tobacco Control
17.4.3 Fear of Health Risks
17.4.4 Actual Health Risks
17.4.5 Alternative Technologies
17.4.6 Pharma
17.4.7 Taxation
18. Leading Company Profiles
18.1. British American Tobacco
Source: Visiongain, 2020
18.1.1 Business Overview
18.1.2 British American Financial
18.1.3 British American Tobacco Selected Recent Acquisitions, Contracts, and New Product Launches 2015-2020
18.1.4 British American Tobacco Analysis
18.1.5 British American Tobacco company Primary Market Competitors 2020
18.2 Imperial Brands PLC
18.2.1 Company Overview
18.2.2 Imperial Brands PLC Total Company Financials
18.2.3 Imperial Recent Developments
18.2.4 Imperial Brands PLC Analysis
18.2.5 Primary Market Competitors 2020
18.3 Japan Tobacco Inc.
18.3.1 Japan Tobacco Financial
18.3.2 Japan Tobacco Inc. Analysis
18.3.3 Japan Tobacco Inc. Strategies co Inc. Strategies
18.3.4 Japan Tobacco Inc. Risk Factors
18.3.5 Company Primary Competitors
18.4 JUUL Labs, Inc.
18.4.1 JUUL Recent Developments
18.4.2 JUUL Labs, Inc. Analysis
18.4.3 JUUL Labs, Inc. Key highlights
18.5 KT&G Corporation
18.5.1 KT&G Corporation Financials
18.5.2 KT&G Corporation Selected Recent Acquisitions, Contracts, and New Product Launches 2015-2020
18.5.3 KT&G Corporation Analysis
18.5.4 KT&G Corporation Primary Market Competitors 2020
18.6 Philip Morris International
18.6.1 Philip Morris International financial
18.6.2 Philip Morris International Selected Recent Acquisitions, Contracts, and New Product Launches 2015-2020
18.6.3 Philip Morris International Analysis
18.6.4 Philip Morris International Primary Market Competitors 2020
18.7 Reynolds American Inc.
18.7.1 Reynolds American Inc Selected Recent Acquisitions, Contracts, and New Product Launches 2015-2020
18.7.2 Reynolds American Inc. Analysis
18.7.3 Reynolds American Inc Primary Market Competitors 2020
18.8 Swedish Match AB
18.8.1 Swedish Match AB financial 2015-2019
18.8.2 Swedish Match AB Selected Recent Acquisitions, Contracts, and New Product Launches 2015-2020
18.8.3 Swedish Match AB Primary Market Competitors 2020
18.9 Turning Point Brands, Inc.
18.9.1 Turning Point Brands, Inc financial 2015-2019
18.9.2 Turning Point Brands, Inc.Selected Recent Acquisitions, Contracts, and New Product Launches 2015-2020
18.9.3 Turning Point Brands, Inc. Analysis
18.9.4 Turning Point Brands, Inc. Primary Market Competitors 2020
18.10 Universal Corporation
18.10.1 Universal Corporation Financials 2015-2019
18.10.2 Universal Corporation Selected Recent Acquisitions, Contracts, and New Product Launches 2015-2020
18.10.3 Universal Corporation Analysis
18.10.4 Universal Corporation Primary Market Competitors 2020
18.11 Eastern Company SAE
18.11.1 Business Overview
18.11.2 Eastern Company SAE Company Financials
18.11.3 Eastern Company SAESelected Recent Acquisitions, Contracts, and New Product Launches 2015-2020
18.11.4 Eastern Company SAE Primary Market Competitors 2020
18.12 Gudang Garam Tbk
18.12.1 Business Overview
18.12.2 GudangGaramTbkCompany Financials
18.12.3 Gudang GaramTbk Primary Market Competitors 2020
18.13 India Tobacco Company Limited (ITC)
18.13.1 Business Overview
18.13.2 Indian Tobacco Company (ITC)Company Financials
18.13.3 India Tobacco Company Limited (ITC)Selected Recent Acquisitions, Contracts, and New Product Launches 2015-2020
18.13.4 India Tobacco Company Limited (ITC) Primary Market Competitors 2020
18.14 Altria Group Inc
18.14.1 Altria Group Inc Financials
18.14.2 Altria Group, Inc. Selected Recent Acquisitions, Contracts, and New Product Launches 2015-2020
18.14.3 Altria Group Inc Primary Market Competitors 2020
18.15 Vector Group Ltd
18.15.1 Vector group ltd Company Financials
Source:Visiongain 2020,
18.15.2 Vector Group Ltd 2020Selected Recent Acquisitions, Contracts, and New Product
Launches 2015-2020
18.15.3 Vector Group Ltd Primary Market Competitors 2020
19. Global Patent Analysis of NGP Tobacco
20. Conclusion
20.1 Patterns of E-Cigarette Use Among U.S. Youth and Young Adults
20.2 Health Effects of E-Cigarette Use Among U.S. Youth and Young Adults
20.3 Activities of the E-Cigarette Companies
20.4 E-Cigarette Policy and Practice Implications
21. Glossary
Associated Visiongain Reports
Visiongain Report Sales Order Form
Appendix A
About Visiongain
Appendix B
Visiongain Report Evaluation Form
List of Tables
Table 2.1 Overview of potential mechanisms influencing nicotine delivery from E-cigarettes.
Table 2.2 Overview of Products in the Market
Table 3.1 Global Next-Generation Products in the Tobacco Market by Value, 2020-2030 (USD Bn, AGR (%), CAGR(%))
Table 3.2 Global Next-Generation Products in the Tobacco Market by Number of Users, 2020-2030 (Mn Users, AGR (%), CAGR(%))
Table 3.3 Global Next-Generation Products in the Tobacco Market by Region, 2020-2030 (USD Bn, AGR (%), CAGR(%))
Table 3.4 Global Next-Generation Products in the Tobacco Market by Number of Users by Region, 2020-2030 (Mn Users, AGR (%), CAGR(%))
Table 5.1 Global Next-Generation Products in the Tobacco Market by Device Type, 2020-2030 (USD Bn, AGR (%), CAGR(%))
Table 5.2 Global e-Cigarettes Next-Generation Products in the Tobacco Market by Value, 2020-2030 (USD Bn, AGR (%), CAGR(%))
Table 5.3 Global e-Cigarettes Next-Generation Products in the Tobacco Market by Region, 2020-2030 (USD Bn, AGR (%), CAGR(%))
Table 5.4 Global Vaps Next-Generation Products in the Tobacco Market by Value, 2020-2030 (USD Bn, AGR (%), CAGR(%))
Table 5.5 Global Vaps Next-Generation Products in the Tobacco Market by Region, 2020-2030 (USD Bn, AGR (%), CAGR(%))
Table 5.6 Global Mods Next-Generation Products in the Tobacco Market by Value, 2020-2030 (USD Bn, AGR (%), CAGR(%))
Table 5.7 Global Mods Next-Generation Products in the Tobacco Market by Region, 2020-2030 (USD Bn, AGR (%), CAGR(%))
Table 5.8 Global e-Hookahs Next-Generation Products in the Tobacco Market by Value, 2020-2030 (USD Bn, AGR (%), CAGR(%))
Table 5.9 Global e-Hookahs Next-Generation Products in the Tobacco Market by Region, 2020-2030 (USD Bn, AGR (%), CAGR(%))
Table 5.10 Global Pens Next-Generation Products in the Tobacco Market by Value, 2020-2030 (USD Bn, AGR (%), CAGR(%))
Table 5.11 Global Pens Next-Generation Products in the Tobacco Market by Region, 2020-2030 (USD Bn, AGR (%), CAGR(%))
Table 5.12 Global Other Device Type Next-Generation Products in the Tobacco Market by Value, 2020-2030 (USD Bn, AGR (%), CAGR(%))
Table 5.13 Global Other Device Type Next-Generation Products in the Tobacco Market by Region, 2020-2030 (USD Bn, AGR (%), CAGR(%))
Table 6.1 Global Next-Generation Products in the Tobacco Market by Component, 2020-2030 (USD Bn, AGR (%), CAGR(%))
Table 6.2 Global Atomizer Next-Generation Products in the Tobacco Market by Value, 2020-2030 (USD Bn, AGR (%), CAGR(%))
Table 6.3 Global Atomizer Next-Generation Products in the Tobacco Market by Region, 2020-2030 (USD Bn, AGR (%), CAGR(%))
Table 6.4 Global Vape Mod Next-Generation Products in the Tobacco Market by Value, 2020-2030 (USD Bn, AGR (%), CAGR(%))
Table 6.5 Global Vape Mod Next-Generation Products in the Tobacco Market by Region, 2020-2030 (USD Bn, AGR (%), CAGR(%))
Table 6.6 Global Cartomizer Next-Generation Products in the Tobacco Market by Value, 2020-2030 (USD Bn, AGR (%), CAGR(%))
Table 6.7 Global Cartomizer Next-Generation Products in the Tobacco Market by Region, 2020-2030 (USD Bn, AGR (%), CAGR(%))
Table 6.8 Global E-liquid Next-Generation Products in the Tobacco Market by Value, 2020-2030 (USD Bn, AGR (%), CAGR(%))
Table 6.9 Global E-liquid Next-Generation Products in the Tobacco Market by Region, 2020-2030 (USD Bn, AGR (%), CAGR(%))
Table 6.10 Global Battery Next-Generation Products in the Tobacco Market by Value, 2020-2030 (USD Bn, AGR (%), CAGR(%))
Table 6.11 Global Battery Next-Generation Products in the Tobacco Market by Region, 2020-2030 (USD Bn, AGR (%), CAGR(%))
Table 6.12 Global Other Component Next-Generation Products in the Tobacco Market by Value, 2020-2030 (USD Bn, AGR (%), CAGR(%))
Table 6.13 Global Other Component Next-Generation Products in the Tobacco Market by Region, 2020-2030 (USD Bn, AGR (%), CAGR(%))
Table 7.1 Global Next-Generation Products in the Tobacco Market by System, 2020-2030 (USD Bn, AGR (%), CAGR(%))
Table 7.2 Global Open Vaping System Next-Generation Products in the Tobacco Market by Value, 2020-2030 (USD Bn, AGR (%), CAGR(%))
Table 7.3 Global Open Vaping System Next-Generation Products in the Tobacco Market by Region, 2020-2030 (USD Bn, AGR (%), CAGR(%))
Table 7.4 Global Closed Vaping System Next-Generation Products in the Tobacco Market by Value, 2020-2030 (USD Bn, AGR (%), CAGR(%))
Table 7.5 Global Closed Vaping System Next-Generation Products in the Tobacco Market by Region, 2020-2030 (USD Bn, AGR (%), CAGR(%))
Table 7.6 Global Semi-Closed Vaping System Next-Generation Products in the Tobacco Market by Value, 2020-2030 (USD Bn, AGR (%), CAGR(%))
Table 7.7 Global Semi-Closed Vaping System Next-Generation Products in the Tobacco Market by Region, 2020-2030 (USD Bn, AGR (%), CAGR(%))
Table 7.8 Global Other Vaping System Next-Generation Products in the Tobacco Market by Value, 2020-2030 (USD Bn, AGR (%), CAGR(%))
Table 7.9 Global Other Vaping System Next-Generation Products in the Tobacco Market by Region, 2020-2030 (USD Bn, AGR (%), CAGR(%))
Table 8.1 Global Next-Generation Products in the Tobacco Market by Product Type, 2020-2030 (USD Bn, AGR (%), CAGR(%))
Table 8.2 Global Tobacco Heating Products Next-Generation Products in the Tobacco Market by Value, 2020-2030 (USD Bn, AGR (%), CAGR(%))
Table 8.3 Global Tobacco Heating Products Next-Generation Products in the Tobacco Market by Region, 2020-2030 (USD Bn, AGR (%), CAGR(%))
Table 8.4 Global Vapour Products Next-Generation Products in the Tobacco Market by Value, 2020-2030 (USD Bn, AGR (%), CAGR(%))
Table 8.5 Global Vapour Products Next-Generation Products in the Tobacco Market by Region, 2020-2030 (USD Bn, AGR (%), CAGR(%))
Table 8.6 Global Snus Products Next-Generation Products in the Tobacco Market by Value, 2020-2030 (USD Bn, AGR (%), CAGR(%))
Table 8.7 Global Snus Products Next-Generation Products in the Tobacco Market by Region, 2020-2030 (USD Bn, AGR (%), CAGR(%))
Table 8.8 Global Other Product Type Next-Generation Products in the Tobacco Market by Value, 2020-2030 (USD Bn, AGR (%), CAGR(%))
Table 8.9 Global Other Product Type Next-Generation Products in the Tobacco Market by Region, 2020-2030 (USD Bn, AGR (%), CAGR(%))
Table 9.1 Global Next-Generation Products in the Tobacco Market by Age Group, 2020-2030 (USD Bn, AGR (%), CAGR(%))
Table 9.2 Global 18-30 Age Next-Generation Products in the Tobacco Market by Value, 2020-2030 (USD Bn, AGR (%), CAGR(%))
Table 9.3 Global 18-30 Age Next-Generation Products in the Tobacco Market by Region, 2020-2030 (USD Bn, AGR (%), CAGR(%))
Table 9.4 Global 31-44 Age Next-Generation Products in the Tobacco Market by Value, 2020-2030 (USD Bn, AGR (%), CAGR(%))
Table 9.5 Global 31-44 Age Next-Generation Products in the Tobacco Market by Region, 2020-2030 (USD Bn, AGR (%), CAGR(%))
Table 9.6 Global 45-60 Age Next-Generation Products in the Tobacco Market by Value, 2020-2030 (USD Bn, AGR (%), CAGR(%))
Table 9.7 Global 45-60 Age Next-Generation Products in the Tobacco Market by Region, 2020-2030 (USD Bn, AGR (%), CAGR(%))
Table 9.8 Global 61&Above Age Next-Generation Products in the Tobacco Market by Value, 2020-2030 (USD Bn, AGR (%), CAGR(%))
Table 9.9 Global 61&Above Age Next-Generation Products in the Tobacco Market by Region, 2020-2030 (USD Bn, AGR (%), CAGR(%))
Table 10.1 Global Next-Generation Products in the Tobacco Market by Distribution Channel, 2020-2030 (USD Bn, AGR (%), CAGR(%))
Table 10.2 Global Online Buying Next-Generation Products in the Tobacco Market by Value, 2020-2030 (USD Bn, AGR (%), CAGR(%))
Table 10.3 Global Online Buying Next-Generation Products in the Tobacco Market by Region, 2020-2030 (USD Bn, AGR (%), CAGR(%))
Table 10.4 Global Retail Stores Next-Generation Products in the Tobacco Market by Value, 2020-2030 (USD Bn, AGR (%), CAGR(%))
Table 10.5 Global Retail Stores Next-Generation Products in the Tobacco Market by Region, 2020-2030 (USD Bn, AGR (%), CAGR(%))
Table 10.6 Global Convenience Store Next-Generation Products in the Tobacco Market by Value, 2020-2030 (USD Bn, AGR (%), CAGR(%))
Table 10.7 Global Convenience Store Next-Generation Products in the Tobacco Market by Region, 2020-2030 (USD Bn, AGR (%), CAGR(%))
Table 10.8 Global Drug Store Next-Generation Products in the Tobacco Market by Value, 2020-2030 (USD Bn, AGR (%), CAGR(%))
Table 10.9 Global Drug Store Next-Generation Products in the Tobacco Market by Region, 2020-2030 (USD Bn, AGR (%), CAGR(%))
Table 10.10 Global Newsstand Next-Generation Products in the Tobacco Market by Value, 2020-2030 (USD Bn, AGR (%), CAGR(%))
Table 10.11 Global Newsstand Next-Generation Products in the Tobacco Market by Region, 2020-2030 (USD Bn, AGR (%), CAGR(%))
Table 10.12 Global Tobacconist Store Next-Generation Products in the Tobacco Market by Value, 2020-2030 (USD Bn, AGR (%), CAGR(%))
Table 10.13 Global Tobacconist Store Next-Generation Products in the Tobacco Market by Region, 2020-2030 (USD Bn, AGR (%), CAGR(%))
Table 10.14 Global Specialty E-cigarette Store Next-Generation Products in the Tobacco Market by Value, 2020-2030 (USD Bn, AGR (%), CAGR(%))
Table 10.15 Global Specialty E-cigarette Store Next-Generation Products in the Tobacco Market by Region, 2020-2030 (USD Bn, AGR (%), CAGR(%))
Table 10.16 Global Other Distribution Channel Next-Generation Products in the Tobacco Market by Value, 2020-2030 (USD Bn, AGR (%), CAGR(%))
Table 10.17 Global Other Distribution Channel Next-Generation Products in the Tobacco Market by Region, 2020-2030 (USD Bn, AGR (%), CAGR(%))
Table 11.1 North America Next-Generation Products in the Tobacco Market by Value, 2020-2030 (USD Bn, AGR (%), CAGR(%))
Table 11.2 North America Next-Generation Products in the Tobacco Market by Number of User, 2020-2030 (Mn, AGR (%), CAGR(%))
Table 11.3 North America Next-Generation Products in the Tobacco Market by Country, 2020-2030 (USD Bn, AGR (%), CAGR(%))
Table 11.4 North America Next-Generation Products in the Tobacco Market by Device Type, 2020-2030 (USD Bn, AGR (%), CAGR(%))
Table 11.5 North America Next-Generation Products in the Tobacco Market by Component, 2020-2030 (USD Bn, AGR (%), CAGR(%))
Table 11.6 North America Next-Generation Products in the Tobacco Market by System, 2020-2030 (USD Bn, AGR (%), CAGR(%))
Table 11.7 North America Next-Generation Products in the Tobacco Market by Product Type, 2020-2030 (USD Bn, AGR (%), CAGR(%))
Table 11.8 North America Next-Generation Products in the Tobacco Market by Age Group, 2020-2030 (USD Bn, AGR (%), CAGR(%))
Table 11.9 North America Next-Generation Products in the Tobacco Market by Distribution Channel, 2020-2030 (USD Bn, AGR (%), CAGR(%))
Table 12.1 Europe Next-Generation Products in the Tobacco Market by Value, 2020-2030 (USD Bn, AGR (%), CAGR(%))
Table 12.2 Europe Next-Generation Products in the Tobacco Market by Number of User, 2020-2030 (Million, AGR (%), CAGR(%))
Table 12.3 Europe Next-Generation Products in the Tobacco Market by Country, 2020-2030 (USD Bn, AGR (%), CAGR(%))
Table 12.4 Europe Next-Generation Products in the Tobacco Market by Device Type, 2020-2030 (USD Bn, AGR (%), CAGR(%))
Table 12.5 Europe Next-Generation Products in the Tobacco Market by Component, 2020-2030 (USD Bn, AGR (%), CAGR(%))
Table 12.6 Europe Next-Generation Products in the Tobacco Market by System, 2020-2030 (USD Bn, AGR (%), CAGR(%))
Table 12.7 Europe Next-Generation Products in the Tobacco Market by Product Type, 2020-2030 (USD Bn, AGR (%), CAGR(%))
Table 12.8 Europe Next-Generation Products in the Tobacco Market by Age Group, 2020-2030 (USD Bn, AGR (%), CAGR(%))
Table 12.9 Europe Next-Generation Products in the Tobacco Market by Distribution Channel, 2020-2030 (USD Bn, AGR (%), CAGR(%))
Table 13.1 Asia-Pacific Next-Generation Products in the Tobacco Market by Value, 2020-2030 (USD Bn, AGR (%), CAGR(%))
Table 13.2 Asia-Pacific Next-Generation Products in the Tobacco Market by Number of User, 2020-2030 (Million, AGR (%), CAGR(%))
Table 13.3 Asia-Pacific Next-Generation Products in the Tobacco Market by Country, 2020-2030 (USD Bn, AGR (%), CAGR(%))
Table 13.4 Asia-Pacific Next-Generation Products in the Tobacco Market by Device Type, 2020-2030 (USD Bn, AGR (%), CAGR(%))
Table 13.5 Asia-Pacific Next-Generation Products in the Tobacco Market by Component, 2020-2030 (USD Bn, AGR (%), CAGR(%))
Table 13.6 Asia-Pacific Next-Generation Products in the Tobacco Market by System, 2020-2030 (USD Bn, AGR (%), CAGR(%))
Table 13.7 Asia-Pacific Next-Generation Products in the Tobacco Market by Product Type, 2020-2030 (USD Bn, AGR (%), CAGR(%))
Table 13.8 Asia-Pacific Next-Generation Products in the Tobacco Market by Age Group, 2020-2030 (USD Bn, AGR (%), CAGR(%))
Table 13.9 Asia-Pacific Next-Generation Products in the Tobacco Market by Distribution Channel, 2020-2030 (USD Bn, AGR (%), CAGR(%))
Table 14.1 Middle East & Africa Next-Generation Products in the Tobacco Market by Value, 2020-2030 (USD Bn, AGR (%), CAGR(%))
Table 14.2 Middle East & Africa Next-Generation Products in the Tobacco Market by Number of User, 2020-2030 (Million, AGR (%), CAGR(%))
Table 14.3 Middle East & Africa Next-Generation Products in the Tobacco Market by Country, 2020-2030 (USD Bn, AGR (%), CAGR(%))
Table 14.4 Middle East & Africa Next-Generation Products in the Tobacco Market by Device Type, 2020-2030 (USD Bn, AGR (%), CAGR(%))
Table 14.5 Middle East & Africa Next-Generation Products in the Tobacco Market by Component, 2020-2030 (USD Bn, AGR (%), CAGR(%))
Table 14.6 Middle East & Africa Next-Generation Products in the Tobacco Market by System, 2020-2030 (USD Bn, AGR (%), CAGR(%))
Table 14.7 Middle East & Africa Next-Generation Products in the Tobacco Market by Product Type, 2020-2030 (USD Bn, AGR (%), CAGR(%))
Table 14.8 Middle East & Africa Next-Generation Products in the Tobacco Market by Age Group, 2020-2030 (USD Bn, AGR (%), CAGR(%))
Table 14.9 Middle East & Africa Next-Generation Products in the Tobacco Market by Distribution Channel, 2020-2030 (USD Bn, AGR (%), CAGR(%))
Table 15.1 Latin America Next-Generation Products in the Tobacco Market by Value, 2020-2030 (USD Bn, AGR (%), CAGR(%))
Table 15.2 Latin America Next-Generation Products in the Tobacco Market by Value, 2020-2030 (USD Bn, AGR (%), CAGR(%))
Table 15.3 Latin America Next-Generation Products in the Tobacco Market by Country, 2020-2030 (USD Bn, AGR (%), CAGR(%))
Table 15.4 Latin America Next-Generation Products in the Tobacco Market by Device Type, 2020-2030 (USD Bn, AGR (%), CAGR(%))
Table 15.5 Latin America Next-Generation Products in the Tobacco Market by Component, 2020-2030 (USD Bn, AGR (%), CAGR(%))
Table 15.6 Latin America Next-Generation Products in the Tobacco Market by System, 2020-2030 (USD Bn, AGR (%), CAGR(%))
Table 15.7 Latin America Next-Generation Products in the Tobacco Market by Product Type, 2020-2030 (USD Bn, AGR (%), CAGR(%))
Table 15.8 Latin America Next-Generation Products in the Tobacco Market by Age Group, 2020-2030 (USD Bn, AGR (%), CAGR(%))
Table 15.9 Latin America Next-Generation Products in the Tobacco Market by Distribution Channel, 2020-2030 (USD Bn, AGR (%), CAGR(%))
Table 16.1 Product Pros, Cons, and Review
Table 16.2 Product Pros, Cons, and Review
Table 16.3 Product Pros, Cons, and Review
Table 16.4 Product Pros, Cons, and Review
Table 16.5 Product Pros, Cons, and Review
Table 16.6 Product Pros, Cons, and Review
Table 16.7 Product Pros, Cons, and Review
Table 16.8 Product Pros, Cons, and Review
Table 16.9 Product Pros, Cons, and Review
Table 16.10 Product Pros, Cons, and Review
Table 18.1 British American Tobacco Overview 2019 (Total Revenue ($m), Ticker, HQ, IR Contact, Website)
Table 18.2 British American Tobacco Total Company Sales 2015-2019(US$m, AGR%)
Table 18.3 British American Tobacco Total Operating Income 2015-2019(US$m)
Table 18.4 British American Tobacco Net Income 2015-2019(US$m)
Table 18.5 British American Tobacco EBIDTA 2015-2019(US$m)
Table 18.6 British American Selected Recent Acquisitions, Contracts, and New Product Launches 2015-2019 (Date, Development Type)
Table 18.7 Imperial Brands PLC Overview 2019 (Total Revenue ($m), Ticker, HQ, IR Contact, Website)
Table 18.8 Imperial Brands PLC Total Company Sales 2015-2019 (US$m, AGR%)
Table 18.9 Imperial Brands PLC Total Operating Income 2015-2019 (US$m)
Table 18.10 Imperial Brands PLC Net Income 2015-2019 (US$m)
Table 18.11 Imperial Brands PLC EBIDTA 2015-2019(US$m)
Table 18.12 Imperial Brand Selected Recent Acquisitions, Contracts, and New Product Launches 2015-2020 (Date, Development Type, Details)
Table 18.13 Japan Tobacco Inc. Overview 2019 (Total Revenue ($Bn), Ticker, HQ, IR Contact, Website)
Table 18.14 Japan Tobacco Inc.Total Company Sales 2015-2019 (US$m, AGR%)
Table 18.15 Japan Tobacco Inc. Total Operating Income 2015-2019(US$m)
Table 18.16 Japan Tobacco Inc. Net Income 2015-2019(US$m)
Table 18.17 Japan Tobacco Inc. EBIDTA 2015-2019(US$m)
Table 18.18 Company Name Selected Recent Acquisitions, Contracts, and New Product Launches 2015-2020 (Date, Development Type, Details)
Table 18.19 KT&G Corporation Overview 2018 (Total Revenue ($m), Ticker, HQ, IR Contact, Website)
Table 18.20 Company Name Total Company Sales 2015-2019(US$m, AGR%)
Table 18.21 KT&G Corporation. Total Operating Income 2015-2019(US$m)
Table 18.22 KT&G Corporation Net Income 2015-2019(US$m)
Table 18.23 KT&G Corporation EBIDTA 2015-2019(US$m)
Table 18.24 KT&G Corporation Selected Recent Acquisitions, Contracts, and New Product Launches 2015-2020 (Date, Development Type, Details)
Table 18.25 Philip Morris International Overview 2019 (Total Revenue ($m), Ticker, HQ, IR Contact, Website)
Table 18.26 Philip Morris International Total sales 2015-2019 (US$m, AGR%)
Table 18.27 Philip Morris International Total Operating Income 2015-2019 (US$m)
Table 18.28 Philip Morris International Net Income 2015-2019(US$m)
Table 18.29 Philip Morris International EBIDTA 2015-2019(US$m)
Table 18.30 Company Name Selected Recent Acquisitions, Contracts, and New Product Launches 2015-2020 (Date, Development Type, Details)
Table 18.31 Reynolds American Inc. Overview 2016 (Total Revenue ($m), Ticker, HQ, IR Contact, Website)
Table 18.32 Company Name Selected Recent Acquisitions, Contracts, and New Product Launches 2015-2020 (Date, Development Type, Details)
Table 18.33 Swedish Match AB Overview 2018 (Total Revenue ($m), Ticker, HQ, IR Contact, Website)
Table 18.34 Swedish Match AB Total Company Sales 2015-2019(US$m, AGR%)
Table 18.35 Swedish Match AB Total Operating Income 2015-2019(US$m)
Table 18.36 Swedish Match AB Net Income 2015-2019(US$m)
Table 18.37 Swedish Match AB EBIDTA 2015-2019(US$m)
Table 18.38 Swedish Match AB Net Selected Recent Acquisitions, Contracts, and New Product Launches 2015-2020 (Date, Development Type, Details)
Table 18.39 Turning Point Brands, Inc. Overview 2019 (Total Revenue ($Mn), Ticker, HQ, IR Contact, Website)
Table 18.40 Turning Point Brands, Inc Total Company Sales 2015-2019(US$m, AGR%)
Table 18.41 Turning Point Brands, Inc. Total Operating Income 2015-2019(US$m)
Table 18.42 Turning Point Brands, Inc. Net income 2015-2019(US$m)
Table 18.43 Turning Point Brands, Inc. EBIDTA 2015-2019(US$m)
Table 18.44 Turning Point Brands, Inc.Selected Recent Acquisitions, Contracts, and New Product Launches 2015-2020 (Date, Development Type, Details)
Table 18.45 Universal Corporation Overview 2019 (Total Revenue ($m), Ticker, HQ, IR Contact, Website)
Table 18.46 Universal Corporation Total Company Sales 2015-2019(US$m, AGR%)
Table 18.47 Universal Corporation Total Operating Income 2015-2019(US$m)
Table 18.48 Universal Corporation Net Income 2015-2019(US$m)
Table 18.49 Universal Corporation EBIDTA 2015-2019(US$m)
Table 18.50 Universal Corporation Selected Recent Acquisitions, Contracts, and New Product Launches 2015-2020 (Date, Development Type, Details)
Table 18.51 Eastern Company SAE Profile 2020 (CEO, Total Company Sales US$bn, Net Income US$m, HQ, Founded, No. of Employees, Ticker, Website)
Table 18.52 Eastern Company SAE Total Company Sales 2015-2019 (US$m, AGR%)
Table 18.53 Eastern Company SAE Total Operating Income 2015-2019(US$m)
Table 18.54 Eastern Company SAE Total Net Income 2015-2019 (US$m, AGR%)
Table 18.55 Eastern Company SAE Total EBITDA 2015-2019 (US$m, AGR%)
Table 18.56 Eastern Company SAE Selected Recent Acquisitions, Contracts, New Product Launches, Others (Date, Development Type, Details)
Table 18.57 GudangGaramTbk Profile 2020 (CEO, Total Company Sales US$bn, Net Income US$m, HQ, Founded, No. of Employees, Ticker, Website)
Table 18.58 GudangGaramTbk Total Company Sales 2015-2019 (US$m, AGR%)
Table 18.59 GudangGaramTbkTotal Operating Income 2015-2019(US$m)
Table 18.60 GudangGaramTbkTotal Net Income 2015-2019 (US$m, AGR%)
Table 18.61 GudangGaramTbkTotal EBITDA 2015-2019 (US$m, AGR%)
Table 18.62 India Tobacco Company Limited Profile 2020 (CEO, Total Company Sales US$bn, Net Income US$m, HQ, Founded, No. of Employees, Ticker, Website)
Table 18.63 Indian Tobacco Company (ITC)Total Company Sales 2015-2019 (US$m, AGR%)
Table 18.64 Indian Tobacco Company (ITC) Total Operating Income 2015-2019(US$m)
Table 18.65 Indian Tobacco Company (ITC) Total Net Income 2015-2019 (US$m, AGR%)
Table 18.66 Indian Tobacco Company (ITC) Total EBITDA 2015-2019 (US$m, AGR%)
Table 18.67 Indian Tobacco Company (ITC) Selected Recent Acquisitions, Contracts, New Product Launches, Others (Date, Development Type, Details)
Table 18.68 Altria Group Inc Overview 2019 (Total Revenue ($m), Ticker, HQ, IR Contact, Website)
Table 18.69 Altria Group Inc Total Company Sales 2015-2019 (US$m, AGR%)
Table 18.70 Altria Group Inc Total Operating Income 2015-2019(US$m)
Table 18.71 Altria group company Total Net Income 2015-2019 (US$m, AGR%)
Table 18.72 Altria Group Company Total EBITDA 2015-2019 (US$m, AGR%)
Table 18.73 Altria group Inc Selected Recent Acquisitions, Contracts, and New Product Launches 2015-2020 (Date, Development Type, Details)
Table 18.74 Vector Group Ltd Overview 2019 (Total Revenue ($m), Ticker, HQ, IR Contact, Website)
Table 18.75 Vector Group Ltd Total Operating Income 2015-2019(US$m)
Table 18.76 Vector Group Ltd Total Operating Income 2015-2019(US$m)
Table 18.77 Vector Group Ltd Net Income 2015-2019(US$m)
Table 18.78 Vector Group Ltd Net Income 2015-2019(US$m)
Table 18.79 Company Name Selected Recent Acquisitions, Contracts, and New Product Launches 2015-2020 (Date, Development Type, Details)
Table 19.1 Global Patent Applications from 2010- 2020
List of Figures
Figure 1.1 Global Next-Generation Products in Tobacco Industry Market Segmentation 2020
Figure 3.1 Global Next-Generation Products in the Tobacco Market by Value, 2020-2030 (USD Bn, AGR (%), CAGR(%))
Figure 3.2 Global Next-Generation Products in the Tobacco Market by Number of Users, 2020-2030 (Mn Users, AGR (%), CAGR(%))
Figure 3.3 Global Next-Generation Products in the Tobacco Market by Region, 2020-2030 (USD Bn, AGR (%), CAGR(%))
Figure 3.4 Global Next-Generation Products in the Tobacco Market by Number of Users by Region, 2020-2030 (Mn Users, AGR (%), CAGR(%))
Figure 4.1
Figure 5.1 Global Next-Generation Products in the Tobacco Market by Device Type, 2020-2030 (USD Bn, AGR (%), CAGR(%))
Figure 5.2 Global Next-Generation Products in the Tobacco Market Share by Device Type Forecast 2020, 2025, 2030 (%)
Figure 5.3 Global e-Cigarettes Next-Generation Products in the Tobacco Market by Value, 2020-2030 (USD Bn, AGR (%), CAGR(%))
Figure 5.4 Global e-Cigarettes Next-Generation Products in the Tobacco Market by Region, 2020-2030 (USD Bn, AGR (%), CAGR(%))
Figure 5.5 Global Vaps Next-Generation Products in the Tobacco Market by Value, 2020-2030 (USD Bn, AGR (%), CAGR(%))
Figure 5.6 Global Vaps Next-Generation Products in the Tobacco Market by Region, 2020-2030 (USD Bn, AGR (%), CAGR(%))
Figure 5.7 Global Mods Next-Generation Products in the Tobacco Market by Value, 2020-2030 (USD Bn, AGR (%), CAGR(%))
Figure 5.8 Global Mods Next-Generation Products in the Tobacco Market by Region, 2020-2030 (USD Bn, AGR (%), CAGR(%))
Figure 5.9 Global e-Hookahs Next-Generation Products in the Tobacco Market by Value, 2020-2030 (USD Bn, AGR (%), CAGR(%))
Figure 5.10 Global e-Hookahs Next-Generation Products in the Tobacco Market by Region, 2020-2030 (USD Bn, AGR (%), CAGR(%))
Figure 5.11 Global Pens Next-Generation Products in the Tobacco Market by Value, 2020-2030 (USD Bn, AGR (%), CAGR(%))
Figure 5.12 Global Pens Next-Generation Products in the Tobacco Market by Region, 2020-2030 (USD Bn, AGR (%), CAGR(%))
Figure 5.13 Global Other Device Type Next-Generation Products in the Tobacco Market by Value, 2020-2030 (USD Bn, AGR (%), CAGR(%))
Figure 5.14 Global Other Device Type Next-Generation Products in the Tobacco Market by Region, 2020-2030 (USD Bn, AGR (%), CAGR(%))
Figure 6.1 Global Next-Generation Products in the Tobacco Market by Component, 2020-2030 (USD Bn, AGR (%), CAGR(%))
Figure 6.2 Global Next-Generation Products in the Tobacco Market Share by Component Forecast 2020, 2025, 2030 (%)
Figure 6.3 Global Atomizer Next-Generation Products in the Tobacco Market by Value, 2020-2030 (USD Bn, AGR (%), CAGR(%))
Figure 6.4 Global Atomizer Next-Generation Products in the Tobacco Market by Region, 2020-2030 (USD Bn, AGR (%), CAGR(%))
Figure 6.5 Global Vape Mod Next-Generation Products in the Tobacco Market by Value, 2020-2030 (USD Bn, AGR (%), CAGR(%))
Figure 6.6 Global Vape Mod Next-Generation Products in the Tobacco Market by Region, 2020-2030 (USD Bn, AGR (%), CAGR(%))
Figure 6.7 Global Cartomizer Next-Generation Products in the Tobacco Market by Value, 2020-2030 (USD Bn, AGR (%), CAGR(%))
Figure 6.8 Global Cartomizer Next-Generation Products in the Tobacco Market by Region, 2020-2030 (USD Bn, AGR (%), CAGR(%))
Figure 6.9 Global E-liquid Next-Generation Products in the Tobacco Market by Value, 2020-2030 (USD Bn, AGR (%), CAGR(%))
Figure 6.10 Global E-liquid Next-Generation Products in the Tobacco Market by Region, 2020-2030 (USD Bn, AGR (%), CAGR(%))
Figure 6.11 Global Battery Next-Generation Products in the Tobacco Market by Value, 2020-2030 (USD Bn, AGR (%), CAGR(%))
Figure 6.12 Global Battery Next-Generation Products in the Tobacco Market by Region, 2020-2030 (USD Bn, AGR (%), CAGR(%))
Figure 6.13 Global Other Component Next-Generation Products in the Tobacco Market by Value, 2020-2030 (USD Bn, AGR (%), CAGR(%))
Figure 6.14 Global Other Component Next-Generation Products in the Tobacco Market by Region, 2020-2030 (USD Bn, AGR (%), CAGR(%))
Figure 7.1 Global Next-Generation Products in the Tobacco Market by System, 2020-2030 (USD Bn, AGR (%), CAGR(%))
Figure 7.2 Global Next-Generation Products in the Tobacco Market Share by System Forecast 2020, 2025, 2030 (%)
Figure 7.3 Global Open Vaping System Next-Generation Products in the Tobacco Market by Value, 2020-2030 (USD Bn, AGR (%), CAGR(%))
Figure 7.4 Global Open Vaping System Next-Generation Products in the Tobacco Market by Region, 2020-2030 (USD Bn, AGR (%), CAGR(%))
Figure 7.5 Global Closed Vaping System Next-Generation Products in the Tobacco Market by Value, 2020-2030 (USD Bn, AGR (%), CAGR(%))
Figure 7.6 Global Closed Vaping System Next-Generation Products in the Tobacco Market by Region, 2020-2030 (USD Bn, AGR (%), CAGR(%))
Figure 7.7 Global Semi-Closed Vaping System Next-Generation Products in the Tobacco Market by Value, 2020-2030 (USD Bn, AGR (%), CAGR(%))
Figure 7.8 Global Semi-Closed Vaping System Next-Generation Products in the Tobacco Market by Region, 2020-2030 (USD Bn, AGR (%), CAGR(%))
Figure 7.9 Global Other Vaping System Next-Generation Products in the Tobacco Market by Value, 2020-2030 (USD Bn, AGR (%), CAGR(%))
Figure 7.10 Global Other Vaping System Next-Generation Products in the Tobacco Market by Region, 2020-2030 (USD Bn, AGR (%), CAGR(%))
Figure 8.1 Global Next-Generation Products in the Tobacco Market by Product Type, 2020-2030 (USD Bn, AGR (%), CAGR(%))
Figure 8.2 Global Next-Generation Products in the Tobacco Market Share by Product Type Forecast 2020, 2025, 2030 (%)
Figure 8.3 Global Tobacco Heating Products Next-Generation Products in the Tobacco Market by Value, 2020-2030 (USD Bn, AGR (%), CAGR(%))
Figure 8.4 Global Tobacco Heating Products Next-Generation Products in the Tobacco Market by Region, 2020-2030 (USD Bn, AGR (%), CAGR(%))
Figure 8.5 Global Vapour Products Next-Generation Products in the Tobacco Market by Value, 2020-2030 (USD Bn, AGR (%), CAGR(%))
Figure 8.6 Global Vapour Products Next-Generation Products in the Tobacco Market by Region, 2020-2030 (USD Bn, AGR (%), CAGR(%))
Figure 8.7 Global Snus Products Next-Generation Products in the Tobacco Market by Value, 2020-2030 (USD Bn, AGR (%), CAGR(%))
Figure 8.8 Global Snus Products Next-Generation Products in the Tobacco Market by Region, 2020-2030 (USD Bn, AGR (%), CAGR(%))
Figure 8.9 Global Other Product Type Next-Generation Products in the Tobacco Market by Value, 2020-2030 (USD Bn, AGR (%), CAGR(%))
Figure 8.10 Global Other Product Type Next-Generation Products in the Tobacco Market by Region, 2020-2030 (USD Bn, AGR (%), CAGR(%))
Figure 9.1 Global Next-Generation Products in the Tobacco Market by Age Group, 2020-2030 (USD Bn, AGR (%), CAGR(%))
Figure 9.2 Global Next-Generation Products in the Tobacco Market Share by Age Group Forecast 2020, 2025, 2030 (%)
Figure 9.3 Global 18-30 Age Next-Generation Products in the Tobacco Market by Value, 2020-2030 (USD Bn, AGR (%), CAGR(%))
Figure 9.4 Global 18-30 Age Next-Generation Products in the Tobacco Market by Region, 2020-2030 (USD Bn, AGR (%), CAGR(%))
Figure 9.5 Global 31-44 Age Next-Generation Products in the Tobacco Market by Value, 2020-2030 (USD Bn, AGR (%), CAGR(%))
Figure 9.6 Global 31-44 Age Next-Generation Products in the Tobacco Market by Region, 2020-2030 (USD Bn, AGR (%), CAGR(%))
Figure 9.7 Global 45-60 Age Next-Generation Products in the Tobacco Market by Value, 2020-2030 (USD Bn, AGR (%), CAGR(%))
Figure 9.8 Global 45-60 Age Next-Generation Products in the Tobacco Market by Region, 2020-2030 (USD Bn, AGR (%), CAGR(%))
Figure 9.9 Global 61&Above Age Next-Generation Products in the Tobacco Market by Value, 2020-2030 (USD Bn, AGR (%), CAGR(%))
Figure 9.10 Global 61&Above Age Next-Generation Products in the Tobacco Market by Region, 2020-2030 (USD Bn, AGR (%), CAGR(%))
Figure 10.1 Global Next-Generation Products in the Tobacco Market by Distribution Channel, 2020-2030 (USD Bn, AGR (%), CAGR(%))
Figure 10.2 Global Next-Generation Products in the Tobacco Market Share by Distribution Channel Forecast 2020, 2025, 2030 (%)
Figure 10.3 Global Online Buying Next-Generation Products in the Tobacco Market by Value, 2020-2030 (USD Bn, AGR (%), CAGR(%))
Figure 10.4 Global Online Buying Next-Generation Products in the Tobacco Market by Region, 2020-2030 (USD Bn, AGR (%), CAGR(%))
Figure 10.5 Global Retail Stores Next-Generation Products in the Tobacco Market by Value, 2020-2030 (USD Bn, AGR (%), CAGR(%))
Figure 10.6 Global Retail Stores Next-Generation Products in the Tobacco Market by Region, 2020-2030 (USD Bn, AGR (%), CAGR(%))
Figure 10.7 Global Convenience Store Next-Generation Products in the Tobacco Market by Value, 2020-2030 (USD Bn, AGR (%), CAGR(%))
Figure 10.8 Global Convenience Store Next-Generation Products in the Tobacco Market by Region, 2020-2030 (USD Bn, AGR (%), CAGR(%))
Figure 10.9 Global Drug Store Next-Generation Products in the Tobacco Market by Value, 2020-2030 (USD Bn, AGR (%), CAGR(%))
Figure 10.10 Global Drug Store Next-Generation Products in the Tobacco Market by Region, 2020-2030 (USD Bn, AGR (%), CAGR(%))
Figure 10.11 Global Newsstand Next-Generation Products in the Tobacco Market by Value, 2020-2030 (USD Bn, AGR (%), CAGR(%))
Figure 10.12 Global Newsstand Next-Generation Products in the Tobacco Market by Region, 2020-2030 (USD Bn, AGR (%), CAGR(%))
Figure 10.13 Global Tobacconist Store Next-Generation Products in the Tobacco Market by Value, 2020-2030 (USD Bn, AGR (%), CAGR(%))
Figure 10.14 Global Tobacconist Store Next-Generation Products in the Tobacco Market by Region, 2020-2030 (USD Bn, AGR (%), CAGR(%))
Figure 10.15 Global Specialty E-cigarette Store Next-Generation Products in the Tobacco Market by Value, 2020-2030 (USD Bn, AGR (%), CAGR(%))
Figure 10.16 Global Specialty E-cigarette Store Next-Generation Products in the Tobacco Market by Region, 2020-2030 (USD Bn, AGR (%), CAGR(%))
Figure 10.17 Global Other Distribution Channel Next-Generation Products in the Tobacco Market by Value, 2020-2030 (USD Bn, AGR (%), CAGR(%))
Figure 10.18 Global Other Distribution Channel Next-Generation Products in the Tobacco Market by Region, 2020-2030 (USD Bn, AGR (%), CAGR(%))
Figure 11.1 North America Next-Generation Products in the Tobacco Market by Value, 2020-2030 (USD Bn, AGR (%), CAGR(%))
Figure 11.2 North America Next-Generation Products in the Tobacco Market by Number of User, 2020-2030 (Mn, AGR (%), CAGR(%))
Figure 11.3 North America Next-Generation Products in the Tobacco Market Share by Country Forecast 2020, 2025, 2030 (%)
Figure 11.4 North America Next-Generation Products in the Tobacco Market by Country, 2020-2030 (USD Bn, AGR (%), CAGR(%))
Figure 11.5 North America Next-Generation Products in the Tobacco Market by Device Type, 2020-2030 (USD Bn, AGR (%), CAGR(%))
Figure 11.6 North America Next-Generation Products in the Tobacco Market by Component, 2020-2030 (USD Bn, AGR (%), CAGR(%))
Figure 11.7 North America Next-Generation Products in the Tobacco Market by System, 2020-2030 (USD Bn, AGR (%), CAGR(%))
Figure 11.8 North America Next-Generation Products in the Tobacco Market by Product Type, 2020-2030 (USD Bn, AGR (%), CAGR(%))
Figure 11.9 North America Next-Generation Products in the Tobacco Market by Age Group, 2020-2030 (USD Bn, AGR (%), CAGR(%))
Figure 11.10 North America Next-Generation Products in the Tobacco Market by Distribution Channel, 2020-2030 (USD Bn, AGR (%), CAGR(%))
Figure 12.1 Europe Next-Generation Products in the Tobacco Market by Value, 2020-2030 (USD Bn, AGR (%), CAGR(%))
Figure 12.2 Europe Next-Generation Products in the Tobacco Market by Number of User, 2020-2030 (Million, AGR (%), CAGR(%))
Figure 12.3 Europe Next-Generation Products in the Tobacco Market Share by Country Forecast 2020, 2025, 2030 (%)
Figure 12.4 Europe Next-Generation Products in the Tobacco Market by Country, 2020-2030 (USD Bn, AGR (%), CAGR(%))
Figure 12.5 Europe Next-Generation Products in the Tobacco Market by Device Type, 2020-2030 (USD Bn, AGR (%), CAGR(%))
Figure 12.6 Europe Next-Generation Products in the Tobacco Market by Component, 2020-2030 (USD Bn, AGR (%), CAGR(%))
Figure 12.7 Europe Next-Generation Products in the Tobacco Market by System, 2020-2030 (USD Bn, AGR (%), CAGR(%))
Figure 12.8 Europe Next-Generation Products in the Tobacco Market by Product Type, 2020-2030 (USD Bn, AGR (%), CAGR(%))
Figure 12.9 Europe Next-Generation Products in the Tobacco Market by Age Group, 2020-2030 (USD Bn, AGR (%), CAGR(%))
Figure 12.10 Europe Next-Generation Products in the Tobacco Market by Distribution Channel, 2020-2030 (USD Bn, AGR (%), CAGR(%))
Figure 13.1 Asia-Pacific Next-Generation Products in the Tobacco Market by Value, 2020-2030 (USD Bn, AGR (%), CAGR(%))
Figure 13.2 Asia-Pacific Next-Generation Products in the Tobacco Market by Number of User, 2020-2030 (Million, AGR (%), CAGR(%))
Figure 13.3 Asia-Pacific Next-Generation Products in the Tobacco Market Share by Country Forecast 2020, 2025, 2030 (%)
Figure 13.4 Asia-Pacific Next-Generation Products in the Tobacco Market by Country, 2020-2030 (USD Bn, AGR (%), CAGR(%))
Figure 13.5 Asia-Pacific Next-Generation Products in the Tobacco Market by Device Type, 2020-2030 (USD Bn, AGR (%), CAGR(%))
Figure 13.6 Asia-Pacific Next-Generation Products in the Tobacco Market by Component, 2020-2030 (USD Bn, AGR (%), CAGR(%))
Figure 13.7 Asia-Pacific Next-Generation Products in the Tobacco Market by System, 2020-2030 (USD Bn, AGR (%), CAGR(%))
Figure 13.8 Asia-Pacific Next-Generation Products in the Tobacco Market by Product Type, 2020-2030 (USD Bn, AGR (%), CAGR(%))
Figure 13.9 Asia-Pacific Next-Generation Products in the Tobacco Market by Age Group, 2020-2030 (USD Bn, AGR (%), CAGR(%))
Figure 13.10 Asia-Pacific Next-Generation Products in the Tobacco Market by Distribution Channel, 2020-2030 (USD Bn, AGR (%), CAGR(%))
Figure 14.1 Middle East & Africa Next-Generation Products in the Tobacco Market by Value, 2020-2030 (USD Bn, AGR (%), CAGR(%))
Figure 14.2 Middle East & Africa Next-Generation Products in the Tobacco Market by Number of User, 2020-2030 (Million, AGR (%), CAGR(%))
Figure 14.3 Middle East & Africa Next-Generation Products in the Tobacco Market Share by Country Forecast 2020, 2025, 2030 (%)
Figure 14.4 Middle East & Africa Next-Generation Products in the Tobacco Market by Country, 2020-2030 (USD Bn, AGR (%), CAGR(%))
Figure 14.5 Middle East & Africa Next-Generation Products in the Tobacco Market by Device Type, 2020-2030 (USD Bn, AGR (%), CAGR(%))
Figure 14.6 Middle East & Africa Next-Generation Products in the Tobacco Market by Component, 2020-2030 (USD Bn, AGR (%), CAGR(%))
Figure 14.7 Middle East & Africa Next-Generation Products in the Tobacco Market by System, 2020-2030 (USD Bn, AGR (%), CAGR(%))
Figure 14.8 Middle East & Africa Next-Generation Products in the Tobacco Market by Product Type, 2020-2030 (USD Bn, AGR (%), CAGR(%))
Figure 14.9 Middle East & Africa Next-Generation Products in the Tobacco Market by Age Group, 2020-2030 (USD Bn, AGR (%), CAGR(%))
Figure 14.10 Middle East & Africa Next-Generation Products in the Tobacco Market by Distribution Channel, 2020-2030 (USD Bn, AGR (%), CAGR(%))
Figure 15.1 Latin America Next-Generation Products in the Tobacco Market by Value, 2020-2030 (USD Bn, AGR (%), CAGR(%))
Figure 15.2 Latin America Next-Generation Products in the Tobacco Market by Number of User, 2020-2030 (USD Bn, AGR (%), CAGR(%))
Figure 15.3 Latin America Next-Generation Products in the Tobacco Market Share by Country Forecast 2020, 2025, 2030 (%)
Figure 15.4 Latin America Next-Generation Products in the Tobacco Market by Country, 2020-2030 (USD Bn, AGR (%), CAGR(%))
Figure 15.5 Latin America Next-Generation Products in the Tobacco Market by Device Type, 2020-2030 (USD Bn, AGR (%), CAGR(%))
Figure 15.6 Latin America Next-Generation Products in the Tobacco Market by Component, 2020-2030 (USD Bn, AGR (%), CAGR(%))
Figure 15.7 Latin America Next-Generation Products in the Tobacco Market by System, 2020-2030 (USD Bn, AGR (%), CAGR(%))
Figure 15.8 Latin America Next-Generation Products in the Tobacco Market by Product Type, 2020-2030 (USD Bn, AGR (%), CAGR(%))
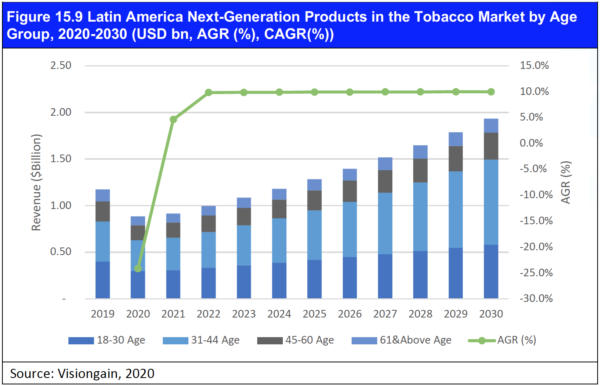
Figure 15.9 Latin America Next-Generation Products in the Tobacco Market by Age Group, 2020-2030 (USD Bn, AGR (%), CAGR(%))
Figure 15.10 Latin America Next-Generation Products in the Tobacco Market by Distribution Channel, 2020-2030 (USD Bn, AGR (%), CAGR(%))
Figure 16.1 Product Image
Figure 16.2 Product Image
Figure 16.3 Product Image
Figure 16.4 Product Image
Figure 16.5 Product Image
Figure 16.6 Product Image
Figure 16.7 Product Image
Figure 16.8 Product Image
Figure 16.9 Product Image
Figure 16.10 Product Image
Figure 17.1 SWOT Analysis of NGP in Tobacco Market
Figure 18.1 British American Tobacco Total Company Sales 2015-2019(US$m, AGR%)
Figure 18.2 British American Tobacco Total Company Operating Income 2015-2019(US$m, AGR%)
Figure 18.3 British American Tobacco Total Company Net Income 2015-2019(US$m, AGR%)
Figure 18.4 British American Tobacco Total Company EBITDA 2015-2019(US$m, AGR%)
Figure 18.5 British American Tobacco Primary Market Competitors 2020
Figure 18.6 Imperial Brands PLC Total Company Sales 2015-2019 (US$m, AGR%)
Figure 18.7 Imperial Brands PLC Total Company Sales 2015-2019 (US$m, AGR%)
Figure 18.8 Imperial Brands PLC Total Company Sales 2015-2019 (US$m, AGR%)
Figure 18.9 Imperial Brands PLC Total Company Sales 2015-2019 (US$m, AGR%)
Figure 18.10 Imperial Brand Inc. Primary Market Competitors 2020
Figure 18.11 Japan Tobacco Inc. Total Company Sales 2015-2019 (US$m, AGR%)
Figure 18.12 Japan Tobacco Inc. Total Company Sales 2014-2018 (US$m, AGR%)
Figure 18.13 Japan Tobacco Inc. Total Company Sales 2015-2019 (US$m, AGR%)
Figure 18.14 Japan Tobacco Inc. Total Company Sales 2015-2019 (US$m, AGR%)
Figure 18.15 Primary Market Competitors 2020
Figure 18.16 Company Name Total Company Sales 2015-2019 (US$m, AGR%)
Figure 18.17 KT&G Corporation Total Operating Income 2015-2019 (US$m, AGR%)
Figure 18.18 KT&G Corporation Total Net Income 2015-2019 (US$m, AGR%)
Figure 18.19 KT&G Corporation EBIDTA 2015-2019 (US$m) (US$m, AGR%)
Figure 18.20 Company Name, Inc. Primary Market Competitors 2020
Figure 18.21 Philip Morris International Total Company Sales 2015-2019 (US$m, AGR%)
Figure 18.22 Philip Morris International Total operating income 2015-2019 (US$m, AGR%)
Figure 18.23 Philip Morris International Net Income 2015-2019 (US$m, AGR%)
Figure 18.24 Philip Morris International EBIDTA 2015-2019 (US$m, AGR%)
Figure 18.25 Philip Morris International Primary Market Competitors 2020
Figure 18.26 Reynolds American Inc. Primary Market Competitors 2020
Figure 18.27 Swedish Match AB Total Company Sales 2015-2019 (US$m, AGR%)
Figure 18.28 Swedish Match AB Total Operating Income 2015-2019 (US$m, AGR%)
Figure 18.29 Swedish Match AB Net Income 2015-2019 (US$m, AGR%)
Figure 18.30 Swedish Match AB EBIDTA 2015-2019 (US$m, AGR%)
Figure 18.31 Swedish Match Inc Primary Market Competitors 2020
Figure 18.32 Turning Point Brands, Inc Total Company Sales 2015-2019 (US$m, AGR%)
Figure 18.33 Turning Point Brands, Inc. Total Operating Income 2015-2019(US$m)
Figure 18.34 Turning Point Brands, Inc. Net income 2015-2019(US$m)
Figure 18.35 Turning Point Brands, Inc. EBIDTA 2015-2019(US$m)
Figure 18.36 Turning Point Brands, Inc. Primary Market Competitors 2020
Figure 18.37 Universal Corporation Total Company Sales 2015-2019 (US$m, AGR%)
Figure 18.38 Universal Corporation Total Operating Income 2015-2019 (US$m, AGR%)
Figure 18.39 Universal Corporation Net Income 2015-2019 (US$m, AGR%)
Figure 18.40 Universal Corporation EBIDTA 2015-2019 (US$m, AGR%)
Figure 18.41 Universal Corporation Primary Market Competitors 2020
Figure 18.42 Eastern Company SAE Total Company Sales 2015-2019 (US$m, AGR%)
Figure 18.43 Eastern Company SAE Total Operating Income 2015-2019 (US$m)
Figure 18.44 Eastern Company SAE Total Net Income 2015-2019 (US$m, AGR%)
Figure 18.45 Eastern Company SAE Total EBITDA 2015-2019 (US$m, AGR%)
Figure 18.46 Eastern Company SAE Primary Market Competitors 2020
Figure 18.47 GudangGaramTbk Total Company Sales 2015-2019 (US$m, AGR%)
Figure 18.48 GudangGaramTbkTotal Operating Income 2015-2019 (US$m)
Figure 18.49 GudangGaramTbkTotal Net Income 2015-2019 (US$m, AGR%)
Figure 18.50 GudangGaramTbkTotal EBITDA 2015-2019 (US$m, AGR%)
Figure 18.51 Gudang GaramTbk. Primary Market Competitors 2020
Figure 18.52 Indian Tobacco Company (ITC)Total Company Sales 2015-2019 (US$m, AGR%)
Figure 18.53 Indian Tobacco Company (ITC) Total Operating Income 2015-2019 (US$m)
Figure 18.54 Indian Tobacco Company (ITC) Total Net Income 2015-2019 (US$m, AGR%)
Figure 18.55 Indian Tobacco Company (ITC) Total EBITDA 2015-2019 (US$m, AGR%)
Figure 18.56 Indian Tobacco Company (ITC) Primary Market Competitors 2020
Figure 18.57 Altria Group IncTotal Company Sales 2015-2019 (US$m, AGR%)
Figure 18.58 Altria Group Inc Total Operating Income 2015-2019 (US$m)
Figure 18.59 Altria Group Inc Total Net Income 2015-2019 (US$m, AGR%)
Figure 18.60 Altria group company Total EBITDA 2015-2019 (US$m, AGR%)
Figure 18.61 Indian Tobacco Company (ITC) Primary Market Competitors 2020
Figure 18.62 vector group ltd Company Sales 2015-2019 (US$m, AGR%)
Figure 18.63 Source : Vector Group Ltd Total Operating Income 2015-2019 (US$m)
Figure 18.64 Vector Group Ltd 2020 Total Net Income 2015-2019 (US$m, AGR%)
Figure 18.65 Vector Group Ltd EBITDA 2015-2019 (US$m, AGR%)
Figure 18.66 Vector Group Ltd Primary Market Competitors 2020