Industries > Packaging > Active, Smart and Intelligent Packaging Market Report 2020-2030
Active, Smart and Intelligent Packaging Market Report 2020-2030
Forecasts by Type (Active and Intelligent), by Application (Food, Beverage, Healthcare, Cosmetics and Others) PLUS Profiles of Leading Companies and Regional and Leading National Market Analysis
Market Drivers:
• Increasing Shelf Life
• Enhanced Safety and Security Features
• Expanding Supply Chain
• Research and Development
• Anti-Theft Functionality
Market Restraint/Challenges:
• High Cost
• Lack of Awareness
• Food Safety Concerns
Market Opportunities:
• Consumer Engagement
• Wastage Reduction
SWOT Analysis
Porter’s Five Force Analysis
PEST Analysis
Active, Smart and Intelligent Packaging Market Segmentation 2020-2030:
Active, Smart and Intelligent Packaging Market is segmented on the basis of type, application, and regional breakdown.
Type
• Active
• Smart and Intelligent
Application
• Foods
• Beverages
• Healthcare
• Cosmetics
• Others
Regional Breakdown (Revenue in USD Billion, Market Share (%), Annual Growth Rate, CAGR)
Focused regional forecasts and analysis explore the future opportunities:
• North America
– U.S.
– Canada
• Europe
– Germany
– U.K.
– France
– Italy
– Russia
– Spain
– Turkey
– Rest of Europe
• Asia-Pacific
– Japan
– China
– India
– Australia
– South Korea
– Indonesia
– Rest of Asia Pacific
• Latin America
– Brazil
– Mexico
– Rest of Latin America
• Middle East and Africa
Competitive Analysis
Prominent manufacturers operating in this market include:
• Amcor
• AptarGroup, Inc.
• Ball Corporation
• BASF SE
• Crown Holdings, Inc.
• DS Smith Plc
• Graphic Packaging Holding Co.
• Sonoco Products Co
• Tetra Laval
• West Rock Company
• Ampacet Corporation
• Coveris
• Innovia Films
• Klöckner Pentaplast
• Competitive landscape reporting: market leaders and key players, company financials, product portfolio, recent developments
• These companies have undertaken strategies, such as M&A and expansion of distribution channels to increase their product offerings and strengthen the global reach
• Mergers, acquisitions, new product launches, recent developments, collaborations, strategy analysis
Buy our report today Active, Smart and Intelligent Packaging Market Report 2020-2030: Forecasts by Type (Active and Intelligent), by Application (Food, Beverage, Healthcare, Cosmetics and Others) PLUS Profiles of Leading Companies and Regional and Leading National Market Analysis. Avoid missing out by staying informed – order our report now.
Visiongain is a trading partner with the US Federal Government
CCR Ref number: KD4R6
Do you have any custom requirements we can help you with? Any need for specific country, geo region, market segment or specific company information? Contact us today, we can discuss your needs and see how we can help: sara.peerun@visiongain.com
1. Global Active, Smart and Intelligent Packaging Market Overview
1.1. Report Overview
1.2. Global Active, Smart and Intelligent Packaging Market Overview
1.3. Global Active, Smart and Intelligent Packaging Market Segmentation
1.4. Why You Should Read This Report
1.5. How This Report Delivers
1.6. Key Questions Answered by This Analytical Report Include
1.7. Who is This Report For?
1.8. Methodology
1.8.1. Secondary Research
1.8.2. Market Evaluation & Forecasting Methodology
1.9. Frequently Asked Questions (FAQ)
1.10. Associated Visiongain Reports
1.11. About Visiongain
2. Introduction to the Active, Smart and Intelligent Packaging Market
2.1. Global Active, Smart and Intelligent Packaging Market Structure
2.2. Active, Smart and Intelligent Packaging Market Definition
2.3. Active, Smart and Intelligent Packaging Market Supply Chain
3. Global Active, Smart and Intelligent Packaging Market 2020-2030
3.1. Global Active, Smart and Intelligent Packaging Market Forecast 2020-2030
3.2. Global Active, Smart and Intelligent Packaging Market Analysis
3.3. Drivers
3.3.1. Multifunction Sensors
3.3.2. Anti-Theft Functionality
3.3.3. Research and Development
3.3.4. Expanding Supply Chain
3.3.5. Increasing Shelf Life
3.3.6. Enhanced Safety and Security Features
3.4. Restraints
3.4.1. High Cost and Lack of Awareness
3.4.2. Food Safety Concerns
3.4.3. Disposal Related Concerns
3.4.4. Implementation of Plain packaging
3.5. 3.5. Opportunities
3.5.1. Wastage Reduction
3.5.2. Consumer Engagement
3.5.3. Ability to Create Value for Companies
3.6. 3.6. Challenges
3.6.1. Commercial Challenges
3.6.2. Technology & Legal Challenges
3.6.3. Packaging is Not Given Primary Attention
3.7. 3.7. SWOT Analysis
3.7.1. Strengths
3.7.2. Weaknesses
3.7.3. Opportunities
3.7.4. Threats
3.8. PEST Analysis
3.8.1. Political
3.8.2. Economical
3.8.3. Social
3.8.4. Technological
3.9. Porter’s Fiver Forces Analysis
3.9.1. Degree of Competition
3.9.2. Supplier Power
3.9.3. Buyer Power
3.9.4. Threat of Substitutes
3.9.5. Threat of New Entrants
4. Global Active, Smart and Intelligent Packaging Market Forecast by Type 2020-2030
4.1. Global Active, Smart and Intelligent Packaging Market Forecast by Active Packaging Segment 2020-2030
4.2. Global Active, Smart and Intelligent Packaging Market Forecast by Intelligent Packaging Segment 2020-2030
5. Global Active, Smart and Intelligent Packaging Market Forecast by Application 2020-2030
5.1. Global Active, Smart and Intelligent Packaging Market Forecast by Food Segment 2020-2030
5.2. Global Active, Smart and Intelligent Packaging Market Forecast by Beverage Segment 2020-2030
5.3. Global Active, Smart and Intelligent Packaging Market Forecast by Healthcare Segment 2020-2030
5.4. Global Active, Smart and Intelligent Packaging Market Forecast by Cosmetics Segment 2020-2030
5.5. Global Active, Smart and Intelligent Packaging Market Forecast by Others Segment 2020-2030
6. Leading Regional Active, Smart and Intelligent Packaging Market Forecasts 2020-2030
6.1. North American Active, Smart and Intelligent Packaging Market Forecast by Type 2020-2030
6.1.1. North America Active, Smart and Intelligent Packaging Market by Application
6.1.2. North America Active, Smart and Intelligent Packaging Market by Country
6.1.3. North American Active, Smart and Intelligent Packaging Market Analysis
6.2. Asia Pacific Active, Smart and Intelligent Packaging Market Forecast 2020-2030
6.2.1. Asia-Pacific Active, Smart and Intelligent Packaging Market by Application
6.2.2. Asia Pacific Active, Smart and Intelligent Packaging Market by Country
6.2.3. Asia Pacific Active, Smart and Intelligent Packaging Market Analysis
6.3. Europe Active, Smart and Intelligent Packaging Market Forecast 2020-2030
6.3.1. Europe Active, Smart and Intelligent Packaging Market by Application
6.3.2. Europe Active, Smart and Intelligent Packaging Market by Country
6.3.3. European Active, Smart and Intelligent Packaging Market Analysis
6.4. 6.4 Latin American Active, Smart and Intelligent Packaging Market Forecast 2020-2030
6.4.1. Latin America Active, Smart and Intelligent Packaging Market by Application
6.4.2. Latin America Active, Smart and Intelligent Packaging Market by Country
6.5. MEA Active, Smart and Intelligent Packaging Market Forecast by Type 2020-2030
6.5.1. MEA Active, Smart and Intelligent Packaging Market by Application
6.5.2. MEA Active, Smart and Intelligent Packaging Analysis
7. Leading Regional Active, Smart and Intelligent Packaging Market Forecasts 2020-2030
7.1. Active, Smart and Intelligent Packaging Companies 2020
7.2. Amcor Ltd.
7.2.1. Amcor Ltd. Active, Smart and Intelligent Packaging Selected Recent Key Developments 2015-2020
7.2.2. Amcor Ltd. Sales 2015-2019
7.2.3. Amcor Ltd. Business Divisions
7.2.4. Amcor Ltd. Active, Smart and Intelligent Packaging Market Products / Services
7.2.5. Amcor Ltd. Overview
7.2.6. Amcor Ltd. SWOT Analysis
7.3. AptarGroup, Inc.
7.3.1. AptarGroup, Inc. Key Developments 2015-2020
7.3.2. AptarGroup, Inc. Sales 2015-2019
7.3.3. AptarGroup, Inc. Organisational Structure
7.3.4. AptarGroup, Inc. Active, Smart and Intelligent Packaging Market Products / Services
7.3.5. AptarGroup, Inc. Overview
7.3.6. AptarGroup, Inc. SWOT Analysis
7.4. Ball Corporation
7.4.1. Ball Corporation Active, Smart and Intelligent Packaging Key Developments 2015-2020
7.4.2. Ball Corporation Sales 2015-2019
7.4.3. Ball Corporation Organisational Structure
7.4.4. Ball Corporation Active, Smart and Intelligent Packaging Market Products / Services
7.4.5. Ball Corporation Overview
7.4.6. Ball Corporation Corporate Facilities
7.4.7. Ball Corporation SWOT Analysis
7.5. BASF SE Company
7.5.1. BASF SE Company Key Strategies
7.5.2. BASF SE Company Sales 2015-2018
7.5.3. BASF SE Organisational Structure
7.5.4. BASF SE Company Active, Smart and Intelligent Packaging Products / Services
7.5.5. BASF SE Company Overview
7.5.6. BASF SE SWOT Analysis
7.6. Crown Holdings, Inc.
7.6.1. Crown Holdings, Inc. Active, Smart and Intelligent Packaging Key Developments 2015-2020
7.6.2. Crown Holdings, Inc. Sales 2015-2019
7.6.3. Crown Holdings, Inc. Company Structure
7.6.4. Crown Holdings, Inc. Active, Smart and Intelligent Packaging Market Products / Services
7.6.5. Crown Holdings, Inc. Overview
7.6.6. Crown Holdings, Inc. SWOT Analysis
7.7. DS Smith Plc.
7.7.1. DS Smith Plc. Key Developments 2015-2019
7.7.2. DS Smith Plc. Sales 2015-2018
7.7.3. DS Smith Plc. Business Sectors
7.7.4. DS Smith Plc. Active, Smart and Intelligent Packaging Market Products / Services
7.7.5. DS Smith Plc. Overview
7.7.6. DS Smith Plc. SWOT Analysis
7.8. Graphic Packaging Holding Co.
7.8.1. Graphic Packaging Holding Co. Key Developments 2016-2020
7.8.2. Graphic Packaging Holding Co. Sales 2015-2019
7.8.3. Graphic Packaging Holding Co. Company Structure
7.8.4. Graphic Packaging Holding Co. Active, Smart and Intelligent Packaging Market Products / Services
7.8.5. Graphic Packaging Holding Co. Overview
7.8.6. Graphic Packaging Holding Co. Paperboard Mills and Folding Carton Facilities
7.9. Sonoco Products Co.
7.9.1. Sonoco Products Co. Key Developments 2016-2020
7.9.2. Sonoco Products Co. Sales 2015-2019
7.9.3. Sonoco Products Co. Segment Information
7.9.4. Sonoco Products Co. Active, Smart and Intelligent Packaging Market Products / Services
7.9.5. Sonoco Products Co. Overview
7.9.6. Sonoco Products Co. SWOT Analysis
7.10. Tetra Laval
7.10.1. Tetra Laval Key Developments 2016-2018
7.10.2. Tetra Laval Sales 2015-2018
7.10.3. Tetra Laval Segment Information
7.10.4. Tetra Laval Active, Smart and Intelligent Packaging Market Products / Services
7.10.5. Tetra Laval Overview
7.10.6. Tetra Pak Top Ten Markets in Packaging Materials
7.10.7. Tetra Pak Top Ten Markets in Processing Solutions
7.10.8. Tetra Laval SWOT Analysis
7.11. West Rock Company
7.11.1. West Rock Company Key Developments 2015-2019
7.11.2. West Rock Company Sales 2015-2019
7.11.3. West Rock Company Organisational Structure
7.11.4. West Rock Company Active, Smart and Intelligent Packaging Market Products / Services
7.11.5. West Rock Company Overview
7.11.6. West Rock Company Corporate and Operating Facilities
7.11.7. West Rock Company Consumer Packaging Mills
7.11.8. West Rock Company SWOT Analysis
7.12. Ampacet Corporation
7.12.1. Company Overview
7.12.2. Product Offerings
7.13. Coveris
7.13.1. Company Overview
7.13.2. Product Offerings
7.14. Innovia Films
7.14.1. Product Offerings
7.14.2. Innovia Films Key Developments 208-2019
7.15. Klöckner Pentaplast
7.15.1. Product Offerings
7.16. Other Leading Companies in the Value Chain
8. Conclusions
9. Glossary
10. Associated Visiongain Reports
11. Visiongain Report Sales Order Type
12. Appendix A
13. About Visiongain
14. Appendix B
15. Visiongain Report Evaluation Forms
List of Figures
Figure 1. Global Active, Smart and Intelligent Packaging Market Segmentation
Figure 2. Global Active, Smart and Intelligent Packaging Market Segmentation Overview
Figure 3. Global Active, Smart and Intelligent Packaging Market Supply Chain
Figure 4. Global Active, Smart and Intelligent Packaging Market Forecast 2020-2030 (US$ billion, AGR %)
Figure 5. SWOT Analysis
Figure 6. PEST Analysis
Figure 7. Porter’s Five Forces Analysis
Figure 8. Global Active, Smart, and Intelligent Packaging Market Share Forecast by Type, 2020 (%), 2025 (%), 2030 (%)
Figure 9. Global Active, Packaging Market Share Forecast by Region, 2020 (%), 2025 (%), 2030 (%)
Figure 10. Global Smart and Intelligent Packaging Market Share Forecast by Region, 2020 (%), 2025 (%), 2030 (%)
Figure 11. Global Active, Smart, and Intelligent Packaging Market Share Forecast by Application, 2020 (%), 2025 (%), 2030 (%)
Figure 12. Global Active, Smart, and Intelligent Packaging Market Share Forecast for Food Segment by Region, 2020 (%), 2025 (%), 2030 (%)
Figure 13. Global Active, Smart, and Intelligent Packaging Market Share Forecast for Beverage Segment by Region, 2020 (%), 2025 (%), 2030 (%)
Figure 14. Global Active, Smart, and Intelligent Packaging Market Share Forecast for Healthcare Segment by Region, 2020 (%), 2025 (%), 2030 (%)
Figure 15. Global Active, Smart, and Intelligent Packaging Market Share Forecast for Cosmetics Segment by Region, 2020 (%), 2025 (%), 2030 (%)
Figure 16. Global Active, Smart, and Intelligent Packaging Market Share Forecast for Others Segment by Region, 2020 (%), 2025 (%), 2030 (%)
Figure 17. North American Active, Smart, and Intelligent Packaging Market Share Forecast by Type, 2020 (%), 2025 (%), 2030 (%)
Figure 18. North American Active, Smart, and Intelligent Packaging Market Share Forecast by Application, 2020 (%), 2025 (%), 2030 (%)
Figure 19. North American Active, Smart, and Intelligent Packaging Market Share Forecast by Country, 2020 (%), 2025 (%), 2030 (%)
Figure 20. U.S. Active, Smart, and Intelligent Packaging Market Share Forecast by Type, 2020 (%), 2025 (%), 2030 (%)
Figure 21. U.S. Active, Smart, and Intelligent Packaging Market Share Forecast by Application, 2020 (%), 2025 (%), 2030 (%)
Figure 22. Canada Active, Smart, and Intelligent Packaging Market Share Forecast by Type, 2020 (%), 2025 (%), 2030 (%)
Figure 23. Canada Active, Smart, and Intelligent Packaging Market Share Forecast by Application, 2020 (%), 2025 (%), 2030 (%)
Figure 24. Asia Pacific Active, Smart, and Intelligent Packaging Market Share Forecast by Type, 2020 (%), 2025 (%), 2030 (%)
Figure 25. Asia Pacific Active, Smart, and Intelligent Packaging Market Share Forecast by Application, 2020 (%), 2025 (%), 2030 (%)
Figure 26. Asia Pacific Active, Smart, and Intelligent Packaging Market Share Forecast by Country, 2020 (%), 2025 (%), 2030 (%)
Figure 27. China Active, Smart, and Intelligent Packaging Market Share Forecast by Type, 2020 (%), 2025 (%), 2030 (%)
Figure 28. China Active, Smart, and Intelligent Packaging Market Share Forecast by Application, 2020 (%), 2025 (%), 2030 (%)
Figure 29. India Active, Smart, and Intelligent Packaging Market Share Forecast by Type, 2020 (%), 2025 (%), 2030 (%)
Figure 30. India Active, Smart, and Intelligent Packaging Market Share Forecast by Application, 2020 (%), 2025 (%), 2030 (%)
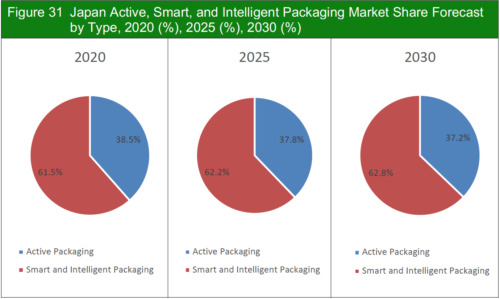
Figure 31. Japan Active, Smart, and Intelligent Packaging Market Share Forecast by Type, 2020 (%), 2025 (%), 2030 (%)
Figure 32. Japan Active, Smart, and Intelligent Packaging Market Share Forecast by Application, 2020 (%), 2025 (%), 2030 (%)
Figure 33. Indonesia Active, Smart, and Intelligent Packaging Market Share Forecast by Type, 2020 (%), 2025 (%), 2030 (%)
Figure 34. Indonesia Active, Smart, and Intelligent Packaging Market Share Forecast by Application, 2020 (%), 2025 (%), 2030 (%)
Figure 35. South Korea Active, Smart, and Intelligent Packaging Market Share Forecast by Type, 2020 (%), 2025 (%), 2030 (%)
Figure 36. South Korea Active, Smart, and Intelligent Packaging Market Share Forecast by Application, 2020 (%), 2025 (%), 2030 (%)
Figure 37. Australia Active, Smart, and Intelligent Packaging Market Share Forecast by Type, 2020 (%), 2025 (%), 2030 (%)
Figure 38. Australia Active, Smart, and Intelligent Packaging Market Share Forecast by Application, 2020 (%), 2025 (%), 2030 (%)
Figure 39. Rest of Asia Pacific Active, Smart, and Intelligent Packaging Market Share Forecast by Type, 2020 (%), 2025 (%), 2030 (%)
Figure 40. Rest of Asia Pacific Active, Smart, and Intelligent Packaging Market Share Forecast by Application, 2020 (%), 2025 (%), 2030 (%)
Figure 41. Europe Active, Smart, and Intelligent Packaging Market Share Forecast by Type, 2020 (%), 2025 (%), 2030 (%)
Figure 42. Europe Active, Smart, and Intelligent Packaging Market Share Forecast by Application, 2020 (%), 2025 (%), 2030 (%)
Figure 43. Europe Active, Smart, and Intelligent Packaging Market Share Forecast by Country, 2020 (%), 2025 (%), 2030 (%)
Figure 44. Germany Active, Smart, and Intelligent Packaging Market Share Forecast by Type, 2020 (%), 2025 (%), 2030 (%)
Figure 45. Germany Active, Smart, and Intelligent Packaging Market Share Forecast by Application, 2020 (%), 2025 (%), 2030 (%)
Figure 46. France Active, Smart, and Intelligent Packaging Market Share Forecast by Type, 2020 (%), 2025 (%), 2030 (%)
Figure 47. France Active, Smart, and Intelligent Packaging Market Share Forecast by Application, 2020 (%), 2025 (%), 2030 (%)
Figure 48. UK Active, Smart, and Intelligent Packaging Market Share Forecast by Type, 2020 (%), 2025 (%), 2030 (%)
Figure 49. UK Active, Smart, and Intelligent Packaging Market Share Forecast by Application, 2020 (%), 2025 (%), 2030 (%)
Figure 50. Italy Active, Smart, and Intelligent Packaging Market Share Forecast by Type, 2020 (%), 2025 (%), 2030 (%)
Figure 51. Italy Active, Smart, and Intelligent Packaging Market Share Forecast by Application, 2020 (%), 2025 (%), 2030 (%)
Figure 52. Russia Active, Smart, and Intelligent Packaging Market Share Forecast by Type, 2020 (%), 2025 (%), 2030 (%)
Figure 53. Russia Active, Smart, and Intelligent Packaging Market Share Forecast by Application, 2020 (%), 2025 (%), 2030 (%)
Figure 54. Spain Active, Smart, and Intelligent Packaging Market Share Forecast by Type, 2020 (%), 2025 (%), 2030 (%)
Figure 55. Spain Active, Smart, and Intelligent Packaging Market Share Forecast by Application, 2020 (%), 2025 (%), 2030 (%)
Figure 56. Turkey Active, Smart, and Intelligent Packaging Market Share Forecast by Type, 2020 (%), 2025 (%), 2030 (%)
Figure 57. Turkey Active, Smart, and Intelligent Packaging Market Share Forecast by Application, 2020 (%), 2025 (%), 2030 (%)
Figure 58. Rest of Europe Active, Smart, and Intelligent Packaging Market Share Forecast by Type, 2020 (%), 2025 (%), 2030 (%)
Figure 59. Rest of Europe Active, Smart, and Intelligent Packaging Market Share Forecast by Application, 2020 (%), 2025 (%), 2030 (%)
Figure 60. Latin America Active, Smart, and Intelligent Packaging Market Share Forecast by Type, 2020 (%), 2025 (%), 2030 (%)
Figure 61. Latin America Active, Smart, and Intelligent Packaging Market Share Forecast by Application, 2020 (%), 2025 (%), 2030 (%)
Figure 62. Latin America Active, Smart, and Intelligent Packaging Market Share Forecast by Country, 2020 (%), 2025 (%), 2030 (%)
Figure 63. Brazil Active, Smart, and Intelligent Packaging Market Share Forecast by Type, 2020 (%), 2025 (%), 2030 (%)
Figure 64. Brazil Active, Smart, and Intelligent Packaging Market Share Forecast by Application, 2020 (%), 2025 (%), 2030 (%)
Figure 65. Mexico Active, Smart, and Intelligent Packaging Market Share Forecast by Type, 2020 (%), 2025 (%), 2030 (%)
Figure 66. Mexico Active, Smart, and Intelligent Packaging Market Share Forecast by Application, 2020 (%), 2025 (%), 2030 (%)
Figure 67. Rest of Latin America Active, Smart, and Intelligent Packaging Market Share Forecast by Type, 2020 (%), 2025 (%), 2030 (%)
Figure 68. Rest of Latin America Active, Smart, and Intelligent Packaging Market Share Forecast by Application, 2020 (%), 2025 (%), 2030 (%)
Figure 69. MEA Active, Smart, and Intelligent Packaging Market Share Forecast by Type, 2020 (%), 2025 (%), 2030 (%)
Figure 70. MEA Active, Smart, and Intelligent Packaging Market Share Forecast by Application, 2020 (%), 2025 (%), 2030 (%)
Figure 71. Amcor Ltd. Sales 2015-2019 (US$ million, AGR %)
Figure 72. Amcor Ltd. Business Divisions 2020
Figure 73. AptarGroup, Inc. Sales 2015-2019 (US$ million, AGR %)
Figure 74. AptarGroup, Inc. Organizational Structure 2020
Figure 75. Ball Corporation Key Developments (Date, Strategy, Details)
Figure 76. Ball Corporation Organizational Structure 2020
Figure 77. BASF SE Company Sales 2015-2018 (US$ million, AGR %)
Figure 78. BASF SE Organizational Structure 2020
Figure 79. Crown Holdings, Inc. Sales 2015-2019 (US$ million, AGR %)
Figure 80. Crown Holdings, Inc. Company Structure 2020
Figure 81. DS Smith Plc Sales 2015-2018 (£ million, AGR %)
Figure 82. DS Smith Plc Business Sectors 2020
Figure 83. Graphic Packaging Holding Co. Sales 2015-2019 (US$ million, AGR %)
Figure 84. Graphic Packaging Holding Co. Company Structure 2020
Figure 85. Sonoco Products Co. Sales 2015-2019 (US$ million, AGR %)
Figure 86. Sonoco Products Co. Segment Information 2020
Figure 87. Tetra Laval Sales 2015-2018 (US$ million, AGR %)
Figure 88. Tetra Laval Segment Information 2020
Figure 89. West Rock Company Sales 2015-2019 (US$ million, AGR %)
Figure 90. West Rock Company Organizational Structure 2020
List of Tables
Table 1. Active Packaging Submarkets (Type, Form, Function, Use)
Table 2. Global Active, Smart and Intelligent Packaging Market Forecast 2020-2030 (US$ billion, AGR%, CAGR %)
Table 3. Global Active, Smart and Intelligent Packaging Market Forecast by Type 2020-2030 (US$ billion, AGR%, CAGR %)
Table 4. Global Active Packaging Market Forecast by Region 2020-2030 (US$ billion, AGR%, CAGR %)
Table 5. Global Active Packaging Market Forecast by Region 2020-2030 (US$ billion, AGR%, CAGR %)
Table 6. Global Active, Smart and Intelligent Packaging Market Forecast by Application 2020-2030 (US$ billion, AGR%, CAGR %)
Table 7. Global Active, Smart and Intelligent Packaging Market Forecast for Food Segment by Region 2020-2030 (US$ billion, AGR%, CAGR %)
Table 8. Global Active, Smart and Intelligent Packaging Market Forecast for Beverage Segment by Region 2020-2030 (US$ billion, AGR%, CAGR %)
Table 9. Global Active, Smart and Intelligent Packaging Market Forecast for Healthcare Segment by Region 2020-2030 (US$ billion, AGR%, CAGR %)
Table 10. Global Active, Smart and Intelligent Packaging Market Forecast for Cosmetics Segment by Region 2020-2030 (US$ billion, AGR%, CAGR %)
Table 11. Global Active, Smart and Intelligent Packaging Market Forecast for Others Segment by Region 2020-2030 (US$ billion, AGR%, CAGR %)
Table 12. Regional Active, Smart and Intelligent Packaging Market Forecast 2020-2030 (US$ billion, AGR%, CAGR %)
Table 13. North American Active, Smart and Intelligent Packaging Market Forecast by Type 2020-2030 (US$ billion, AGR%, CAGR %)
Table 14. North America Active, Smart and Intelligent Packaging Market Forecast by Application 2020-2030 (US$ billion, AGR%, CAGR %)
Table 15. North America Active, Smart and Intelligent Packaging Market Forecast by Country 2020-2030 (US$ billion, AGR%, CAGR %)
Table 16. U.S. Active, Smart and Intelligent Packaging Market Forecast by Type 2020-2030 (US$ billion, AGR%, CAGR %)
Table 17. U.S. Active, Smart and Intelligent Packaging Market Forecast by Application 2020-2030 (US$ billion, AGR%, CAGR %)
Table 18. Canada Active, Smart and Intelligent Packaging Market Forecast by Type 2020-2030 (US$ billion, AGR%, CAGR %)
Table 19. Canada Active, Smart and Intelligent Packaging Market Forecast by Application 2020-2030 (US$ billion, AGR%, CAGR %)
Table 20. Asia Pacific Active, Smart and Intelligent Packaging Market Forecast by Type 2020-2030 (US$ billion, AGR%, CAGR %)
Table 21. Asia Pacific Active, Smart and Intelligent Packaging Market Forecast by Application 2020-2030 (US$ billion, AGR%, CAGR %)
Table 22. Asia Pacific Active, Smart and Intelligent Packaging Market Forecast by Country 2020-2030 (US$ billion, AGR%, CAGR %)
Table 23. China Active, Smart and Intelligent Packaging Market Forecast by Type 2020-2030 (US$ billion, AGR%, CAGR %)
Table 24. China Active, Smart and Intelligent Packaging Market Forecast by Application 2020-2030 (US$ billion, AGR%, CAGR %)
Table 25. India Active, Smart and Intelligent Packaging Market Forecast by Type 2020-2030 (US$ billion, AGR%, CAGR %)
Table 26. India Active, Smart and Intelligent Packaging Market Forecast by Type 2020-2030 (US$ billion, AGR%, CAGR %)
Table 27. Japan Active, Smart and Intelligent Packaging Market Forecast by Application 2020-2030 (US$ billion, AGR%, CAGR %)
Table 28. Japan Active, Smart and Intelligent Packaging Market Forecast by Application 2020-2030 (US$ billion, AGR%, CAGR %)
Table 29. Indonesia Active, Smart and Intelligent Packaging Market Forecast by Type 2020-2030 (US$ billion, AGR%, CAGR %)
Table 30. Indonesia Active, Smart and Intelligent Packaging Market Forecast by Application 2020-2030 (US$ billion, AGR%, CAGR %)
Table 31. South Korea Active, Smart and Intelligent Packaging Market Forecast by Type 2020-2030 (US$ billion, AGR%, CAGR %)
Table 32. South Korea Active, Smart and Intelligent Packaging Market Forecast by Application 2020-2030 (US$ billion, AGR%, CAGR %)
Table 33. Australia Active, Smart and Intelligent Packaging Market Forecast by Type 2020-2030 (US$ billion, AGR%, CAGR %)
Table 34. Australia Active, Smart and Intelligent Packaging Market Forecast by Application 2020-2030 (US$ billion, AGR%, CAGR %)
Table 35. Rest of Asia Pacific Active, Smart and Intelligent Packaging Market Forecast by Type 2020-2030 (US$ billion, AGR%, CAGR %)
Table 36. Rest of Asia Pacific Active, Smart and Intelligent Packaging Market Forecast by Application 2020-2030 (US$ billion, AGR%, CAGR %)
Table 37. Europe Active, Smart and Intelligent Packaging Market Forecast by Type 2020-2030 (US$ billion, AGR%, CAGR %)
Table 38. Europe Active, Smart and Intelligent Packaging Market Forecast by Application 2020-2030 (US$ billion, AGR%, CAGR %)
Table 39. Europe Active, Smart and Intelligent Packaging Market Forecast by Country 2020-2030 (US$ billion, AGR%, CAGR %)
Table 40. Germany Active, Smart and Intelligent Packaging Market Forecast by Type 2020-2030 (US$ billion, AGR%, CAGR %)
Table 41. Germany Active, Smart and Intelligent Packaging Market Forecast by Application 2020-2030 (US$ billion, AGR%, CAGR %)
Table 42. UK Active, Smart and Intelligent Packaging Market Forecast by Type 2020-2030 (US$ billion, AGR%, CAGR %)
Table 43. UK Active, Smart and Intelligent Packaging Market Forecast by Type 2020-2030 (US$ billion, AGR%, CAGR %)
Table 44. France Active, Smart and Intelligent Packaging Market Forecast by Application 2020-2030 (US$ billion, AGR%, CAGR %)
Table 45. France Active, Smart and Intelligent Packaging Market Forecast by Application 2020-2030 (US$ billion, AGR%, CAGR %)
Table 46. Italy Active, Smart and Intelligent Packaging Market Forecast by Type 2020-2030 (US$ billion, AGR%, CAGR %)
Table 47. Italy Active, Smart and Intelligent Packaging Market Forecast by Application 2020-2030 (US$ billion, AGR%, CAGR %)
Table 48. Russia Active, Smart and Intelligent Packaging Market Forecast by Type 2020-2030 (US$ billion, AGR%, CAGR %)
Table 49. Russia Active, Smart and Intelligent Packaging Market Forecast by Application 2020-2030 (US$ billion, AGR%, CAGR %)
Table 50. Spain Active, Smart and Intelligent Packaging Market Forecast by Type 2020-2030 (US$ billion, AGR%, CAGR %)
Table 51. Spain Active, Smart and Intelligent Packaging Market Forecast by Application 2020-2030 (US$ billion, AGR%, CAGR %)
Table 52. Turkey Active, Smart and Intelligent Packaging Market Forecast by Type 2020-2030 (US$ billion, AGR%, CAGR %)
Table 53. Turkey Active, Smart and Intelligent Packaging Market Forecast by Application 2020-2030 (US$ billion, AGR%, CAGR %)
Table 54. Rest of Europe Active, Smart and Intelligent Packaging Market Forecast by Type 2020-2030 (US$ billion, AGR%, CAGR %)
Table 55. Rest of Europe Active, Smart and Intelligent Packaging Market Forecast by Application 2020-2030 (US$ billion, AGR%, CAGR %)
Table 56. Latin America Active, Smart and Intelligent Packaging Market Forecast by Type 2020-2030 (US$ billion, AGR%, CAGR %)
Table 57. Latin America Active, Smart and Intelligent Packaging Market Forecast by Application 2020-2030 (US$ billion, AGR%, CAGR %)
Table 58. Latin America Active, Smart and Intelligent Packaging Market Forecast by Country 2020-2030 (US$ billion, AGR%, CAGR %)
Table 59. Brazil Active, Smart and Intelligent Packaging Market Forecast by Type 2020-2030 (US$ billion, AGR%, CAGR %)
Table 60. Brazil Active, Smart and Intelligent Packaging Market Forecast by Application 2020-2030 (US$ billion, AGR%, CAGR %)
Table 61. Mexico Active, Smart and Intelligent Packaging Market Forecast by Type 2020-2030 (US$ billion, AGR%, CAGR %)
Table 62. Mexico Active, Smart and Intelligent Packaging Market Forecast by Type 2020-2030 (US$ billion, AGR%, CAGR %)
Table 63. Rest of Latin America Active, Smart and Intelligent Packaging Market Forecast by Application 2020-2030 (US$ billion, AGR%, CAGR %)
Table 64. Rest of Latin America Active, Smart and Intelligent Packaging Market Forecast by Application 2020-2030 (US$ billion, AGR%, CAGR %)
Table 65. MEA Active, Smart and Intelligent Packaging Market Forecast by Type 2020-2030 (US$ billion, AGR%, CAGR %)
Table 66. MEA Active, Smart and Intelligent Packaging Market Forecast by Application 2020-2030 (US$ billion, AGR%, CAGR %)
Table 67. Leading Active, Smart and Intelligent Packaging Companies 2020
Table 68. Amcor Ltd. Profile 2019 (CEO, Company Sales US$m, Business Segment in the Market, HQ, Founded, Website)
Table 69. Amcor Ltd.: Key Developments 2015-2020 (Date, Strategy, Details
Table 70. Amcor Ltd. Sales 2015-2019 (US$ million, AGR %)
Table 71. Amcor Ltd. Active, Smart and Intelligent Packaging Market Products/Services (Segment of Business, Product, Specification / Features)
Table 72. Amcor Ltd. SWOT Analysis 2020
Table 73. AptarGroup, Inc. Profile 2019 (CEO, Company Sales US$m, Business Segment in the Market, HQ, Founded, No. of Employees, Website)
Table 74. Aptar Group: Market Developments 2015-2020 (Date, Strategy, Details)
Table 75. AptarGroup, Inc. Sales 2015-2019 (US$ million, AGR %)
Table 76. AptarGroup, Inc. Active, Smart and Intelligent Packaging Market Products / Services (Segment of Business, Product, Specification / Features)
Table 77. AptarGroup, Inc. SWOT Analysis 2020
Table 78. Ball Corporation Profile 2019 (CEO, Company Sales US$m, Business Segment in the Market, HQ, Founded, Website)
Table 79. Ball Corporation Key Developments (Date, Strategy, Details)
Table 80. Ball Corporation Sales 2015-2019 (US$ million, AGR %)
Table 81. Ball Corporation Active, Smart and Intelligent Packaging Market Products / Services (Segment of Business, Product, Specification / Features)
Table 82. Ball Corporation Food & Aerosol Facilities (Location and Approximate Floor Space in Square Feet)
Table 83. Ball Corporation SWOT Analysis 2020
Table 84. BASF SE Company Profile 2019 (CEO, Company Sales US$ million, Business Segment in the Market, HQ, Founded, No. of employees, Website)
Table 85. BASF SE Company Key Strategies (date, Strategy, Details)
Table 86. BASF SE Company Sales 2015-2019 (US$m, AGR %)
Table 87. BASF SE Company Active, Smart and Intelligent Packaging Products/Services (Segment of Business, Product, Specification/ Features)
Table 88. BASF SE SWOT Analysis 2020
Table 89. Crown Holdings, Inc. Profile 2019 (CEO, Company Sales US$m, HQ, Founded, No. of Employees, Website)
Table 90. Crown Holdings, Inc. Key Developments 2015-2019 (Date, Strategy, Details)
Table 91. Crown Holdings, Inc. Sales 2015-2019 (US$ million, AGR %)
Table 92. Crown Holdings, Inc. Active, Smart and Intelligent Packaging Market Products/Services (Segment of Business, Product, Specification / Features)
Table 93. Crown Holdings, Inc. SWOT Analysis 2020
Table 94. DS Smith Plc Profile 2019 (CEO, Company Sales US$ million, Business Segment in the Market, HQ, Founded, No. of Employees, Website)
Table 95. DS Smith Plc: Market Developments 2015-2019 (Date, Strategy, Details)
Table 96. DS Smith Plc Sales 2015-2019 (£ million, AGR %)
Table 97. DS Smith Plc Active, Smart and Intelligent Packaging Market Products / Services (Segment of Business, Product, Specification / Features)
Table 98. DS Smith Plc. SWOT Analysis 2020
Table 99. Graphic Packaging Holding Co. Profile 2019 (CEO, Company Sales US$ million, Business Segment in the Market, HQ, Founded, No. of Employees, Website)
Table 100. Graphic Packaging Holding Co.: Market Developments 2016-2020 (Date, Strategy, Details)
Table 101. Graphic Packaging Holding Co. Sales 2015-2019 (US$ million, AGR %)
Table 102. Graphic Packaging Holding Co. Active, Smart and Intelligent Packaging Market Products / Services (Segment of Business, Product)
Table 103. Graphic Packaging Holding Co.: Paperboard Mills and Folding Carton Facilities (Location, Product, No of Machines, Net Tons Produced)
Table 104. Sonoco Products Co. Profile 2019 (CEO, Company Sales US$ million, Business Segment in the Market, HQ, Founded, No. of Employees, Website)
Table 105. Sonoco Products Co.: Market Developments 2016-2020 (Date, Strategy, Details)
Table 106. Sonoco Products Co. Sales 2015-2019 (US$ million, AGR %)
Table 107. Sonoco Products Co.: Market Products/Services (Segment of Business, Product)
Table 108. Sonoco Products Co. SWOT Analysis 2020
Table 109. Tetra Laval Profile 2019 (CEO, Company Sales US$ million, Industry Group in the Market, HQ, No. of Employees, Website)
Table 110. Tetra Laval: Market Developments 2016-2018 (Date, Strategy, Details)
Table 111. Tetra Laval Sales 2015-2019 (US$ million, AGR %)
Table 112. Tetra Laval Active, Smart and Intelligent Packaging Market Products / Services (Segment of Business, Product, Specification / Features)
Table 113. Tetra Pak Top Ten Markets in Packaging Materials (Rank, Countries)
Table 114. Tetra Pak Top Ten Markets in Processing Solutions (Rank, Countries)
Table 115. Tetra Laval SWOT Analysis 2020
Table 116. WestRock Company Profile 2019 (CEO, Company Sales US$m, Business Segment in the Market, HQ, Founded, No. of Employees, Website)
Table 117. WestRock Company Profile 2019 (CEO, Company Sales US$m, Business Segment in the Market, HQ, Founded, No. of Employees, Website)
Table 118. West Rock Company Sales 2015-2019 (US$ million, AGR %)
Table 119. West Rock Company Active, Smart and Intelligent Packaging Market Products / Services (Segment of Business, Product, Specification / Features)
Table 120. West Rock Company Total Number of Corporate and Operating Facilities (Segment, Number of Facilities)
Table 121. West Rock Company Consumer Packaging Mills (Location and Total Capacity)
Table 122. West Rock Company SWOT Analysis 2020
Table 123. Ampacet Corporation: Product Offerings
Table 124. Coveris: Product Offerings
Table 125. Innovia Films: Product Offerings
Table 126. Innovia Films: Selected Recent Market Developments 2018-2019 (Date, Strategy, Details)
Table 127. Klöckner Pentaplast: Product Offerings
Table 128. Klöckner Pentaplast: Selected Recent Market Developments 2018-2019 (Date, Strategy, Details)
Table 129. Other Leading Companies in the Active, Smart and Intelligent Packaging Market Value Chain 2020 (Company, Revenue, Employee, Location)
Amcor
Ampacet Corporation
AptarGroup, Inc.
Ball Corporation
BASF SE
Coveris
Crown Holdings, Inc.
DS Smith Plc
Graphic Packaging Holding Co.
Innovia Films
Klöckner Pentaplast
Sonoco Products Co
Tetra Laval
West Rock Company
Download sample pages
Complete the form below to download your free sample pages for Active, Smart and Intelligent Packaging Market Report 2020-2030
Related reports
-

Cosmetics Packaging Market Report 2019-2029
The latest report from business intelligence provider Visiongain offers a comprehensive analysis of the global cosmetic packaging market. Visiongain assesses...Full DetailsPublished: 08 August 2019 -
Tobacco Packaging Market Report 2020-2030
Visiongain has forecasted that the global tobacco packaging market will see a revenue of $16,059 million in 2020.
...Full DetailsPublished: 20 January 2020 -
Rigid Plastic Packaging Market Report 2020-2030
Global rigid plastic packaging market is anticipated to surpass USD 300 billion by 2030 while growing at a CAGR of...
Full DetailsPublished: 10 February 2020 -
Beverage Packaging Market Report 2020-2030
The global beverage packaging market is expected to grow at a lucrative rate during the forecast period....Full DetailsPublished: 27 July 2020 -

Thermoformed Plastic Packaging Market Report 2020-2030
Thermoforming is a manufacturing process in which paperboard, plastic, or aluminium sheets are heated to a temperature such that the...
Full DetailsPublished: 02 March 2020 -
Caps & Closures Market Report 2021-2031
Key trend driving the market growth is the rising demand for packaged goods in developing countries such as India and...
Full DetailsPublished: 29 September 2020 -

Packaging Automation Market Report 2020-2030
Packaging Automation Market is Driven by the increasing adoption of robotic technologies such as robotic process automation and automated conveyors.
...Full DetailsPublished: 27 July 2020 -

Smart Card Materials Market Report 2020-2030
The growth of the market is attributed to the increasing adoption of smart cards by millions of users globally.
...Full DetailsPublished: 01 January 1970 -

Wafer Level Packaging Market Report 2019-2029
The $4.7Bn market is expected to grow significantly by 2029 because of wide range of end-user applications....Full DetailsPublished: 25 January 2019 -

Packaging Wax Market Report 2020-2030
- Expanding food & beverage industry
...
- Emerging end-use industries
- Rising acceptance for synthetic waxesFull DetailsPublished: 01 January 1970
Download sample pages
Complete the form below to download your free sample pages for Active, Smart and Intelligent Packaging Market Report 2020-2030
Do you have any custom requirements we can help you with?
Any specific country, geo region, market segment or specific company information?
Email us today, we can discuss your needs and see how we can help: jamie.roberts@visiongain.com
Would you like a free report overview of the report of your choice?
If so, please drop an email to Jamie Roberts stating your chosen report title to jamie.robertsvisiongain.com
Visiongain packaging related reports are compiled using a broad and rich mixture of both primary and secondary information to produce an overall industry outlook. In order to provide our clients with the best product possible product, visiongain analysts reach out to market-leading vendors and industry experts but also review a wealth of financial data and product information from a vast range of sources. To find out more about our reports methodology, please email jamie.roberts@visiongain.com
Would you like to get the latest Visiongain packaging reports catalogue?
What are the dynamic growth sectors? where are the regional business opportunities?
Which technologies will prevail and who are the leading companies succeeding in these sectors and why?
If you want definitive answers to business critical questions, discover Visiongain’s full range of business intelligence reports.
If so, please email Jamie Roberts on jamie.roberts@visiongain.com or call her today on +44 207 336 6100
Adhesive & Sealant Council
Alliance of Foam Packaging Recyclers
American Bakers Association
American Chemistry Council
American Forest & Paper Association
American Frozen Food Institute
American Institute of Food Distributors
American Iron and Steel Institute
American Management Association
American National Standards Institute
American Plastics Council (APC)
American Society for Testing and Materials
Association for Suppliers of Printing, Publishing
AICC, The Independent Packaging Association
Association of Industrial Metallizers, Coaters and Laminators (AIMCAL)
Automated Identification Manufacturer
Automated Imaging Association
Can Manufacturers Institute
Chocolate Manufacturers Association of the U.S.A.
Consumer Healthcare Products Association
Contract Manufacturing and Packaging Association
Converting Equipment Manufacturers Association
Corrugated Packaging Council
Drug, Chemical & Allied Trade Association
Envelope Manufacturers Association
Fibre Box Association
Flexible Packaging Association
Flexographic Technical AssociationFlexographic Technical Association
Foil Stamping and Embossing Association
Food and Drug Law Institute
Food Institute
Food Marketing Institute
Food Processing Machinery & Supplies Association
Foodservice & Packaging Institute
Glass Packaging Institute
Graphic Arts Technical Foundation
Gravure Association of America
Grocery Manufacturers of America
Healthcare Compliance Packaging Council
High Definition Flexo Consortium
Institute of Food Technologists
Institute of Packaging Professionals
International Association of Food Industry Suppliers
International Bottled Water Association
International Dairy Foods Association
International Foodservice Manufacturers Association
International Safe Transit Association
Label Printing Industries of America
Material Handling Industry of America
National Association of Container Distributors
National Association of Manufacturers
National Chicken Council
National Coil Coating Association
National Confectioners Association of the U.S.A.
National Freight Claim & Security
National Institute of Packaging, Handling & Logistics Engineers
National Paper Trade Association
National Wooden Pallet & Container
Open Modular Architecture Controls (OMAC) Packaging Workgroup
Packaging Association of Canada
Paperboard Packaging Council
Petroleum Packaging Council
Pharmaceutical Research and Manufacturers of America
PMMI: The Association for Packaging and Processing Technologies
Polystyrene Packaging Council
Pressure Sensitive Tape Council
Printing Industries of America
Processing and Packaging Machinery Association (PPMA)
Produce Marketing Association, Inc.
Research & Development Associates for Military Food & Packaging Systems
Robotic Industries Association (RIA)
Snack Food Association
Soap & Detergent Association
Society of Glass and Ceramic Decorators
Society of Manufacturing Engineers
Society of Plastics Engineers (SPE)
Society of the Plastics Industry (SPI)
Steel Recycling Institute
Steel Shipping Containers Institute
Tag and Label Manufacturers Institute
Technical Association of the Pulp & Paper Industry
The Aluminum Association
Transportation Consumer Protection Council
Transportation Loss Prevention & Security Association
Tube Council of North America
Uniform Code Council, Inc.
Western Packaging Association (WPA)
World Packaging Organisation
Latest Packaging news
Visiongain Publishes Caps & Closures Market Report 2024-2034
The global caps & closures market was valued at US$80.8 billion in 2023 and is projected to grow at a CAGR of 9% during the forecast period 2024-2034.
22 February 2024
Visiongain Publishes Flexible (Converted) Plastic Packaging Market Report 2024-2034
The global Flexible (Converted) Plastic Packaging market was valued at US$157.3 billion in 2023 and is projected to grow at a CAGR of 5.4% during the forecast period 2024-2034.
04 January 2024
Visiongain Publishes Beverage Packaging Market Report 2023-2033
The global Beverage Packaging market was valued at US$144.3 billion in 2022 and is projected to grow at a CAGR of 4.6% during the forecast period 2023-2033.
28 September 2023
Visiongain Publishes Cosmetics Packaging Market Report 2023-2033
The global Cosmetics Packaging market is projected to grow at a CAGR of 4.3% by 2033
21 July 2023
