Industries > Pharma > Top 25 Dermatological Drugs Manufacturers 2019
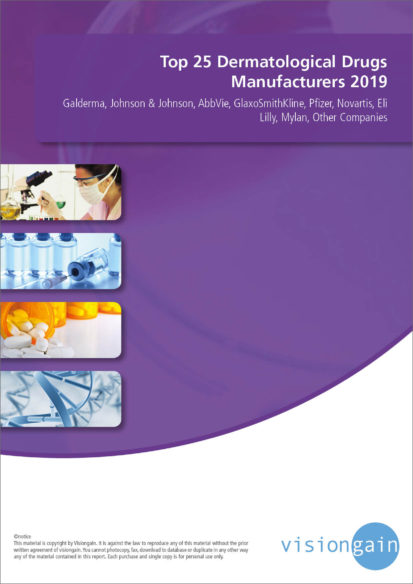
Top 25 Dermatological Drugs Manufacturers 2019
Galderma, Johnson & Johnson, AbbVie, GlaxoSmithKline, Pfizer, Novartis, Eli Lilly, Mylan, Other Companies
Dermatological drugs market has been growing over the last decade. A combination of significant new market launches, and corporate activities has changed the outlook of the pharmaceutical industry towards this market. The dermatological drugs market in 2018 was reported to be US$ 26.23bn. Visiongain’s analysis of the market shows Humira, Stelara, Enbrel, Remicade, Otezla and Cosentyx among the top dermatological drugs driving the market at present.
How this report will benefit you
Read on to discover how you can exploit the future business opportunities emerging in this sector.
In this brand new 176-page report you will receive 108 tables and 71 figures– all unavailable elsewhere.
The 176-page report provides clear detailed insight into the top 25 dermatological drugs manufacturers. Discover the key drivers and challenges affecting the market.
Report Scope
• Assessment of the leading companies in the global dermatological drugs market. The list below shows some of the companies that are discussed in the report:
• Abbvie Inc.
• Allergan plc
• Almirall S.A.
• Amgen
• Astellas
• Bayer
• Concert Pharmaceuticals
• Eli Lilly and Company
• Galderma
• GlaxoSmithkline plc (GSK)
• Johnson & Johnson (J&J)
• Leo Pharma A/S
• Lupin Ltd
• Mayne Pharma
• Other companies
• For each company, the report provides information and discussion on:
• Total revenue forecast to 2028
• Dermatology segment revenue forecast to 2028
• The leading dermatology drugs revenue forecast to 2028
• Drugs portfolio
• Recent developments
• The report provides revenue forecast to 2028 for the following dermatological drugs:
• Epiduo
• Differin
• Stelara
• Remicade
• Humira
• Valtrex
• Lamisil
• Bactroban
• Dermovate
• Zyvox
• Protopic
• Solodyn
• Ziana
• Taltz
• Cosentyx
• Aczone
• Cubicin
• Elocon
• Absorica /Epirus
• Enbrel
• Doryx
• Canesten
• Bepanthen/Bepanthol
• Key questions answered by this report:
• How is the Dermatological Drugs Manufacturers market evolving?
• What is driving and restraining the Dermatological Drugs Manufacturers market?
• What will be the main driver for the overall market to 2028?
• Will leading Dermatological Drugs Manufacturers broadly follow the macroeconomic dynamics, or will individual national markets outperform others?
• Who are the leading players and what are their prospects over the forecast period?
Visiongain’s study is intended for anyone requiring commercial analyses for the Top 25 Dermatological Drugs Manufacturers 2019. You find data, trends and predictions.
Buy our report today Top 25 Dermatological Drugs Manufacturers 2019: Galderma, Johnson & Johnson, AbbVie, GlaxoSmithKline, Pfizer, Novartis, Eli Lilly, Mylan, Other Companies.
Visiongain is a trading partner with the US Federal Government
CCR Ref number: KD4R6
1. Report Overview
1.1 Why You Should Read This Report
1.2 How the Study Delivers
1.3 Main Questions Covered in the Analysis
1.4 Who is this Report For?
1.5 Methods of Research and Analysis
1.5.1 Primary Research
1.5.2 Secondary Research
1.5.3 Market Evaluation and Forecasting Methods
1.6 Frequently Asked Questions (FAQ)
1.7 Associated Reports
1.8 About Visiongain
2. Leading Companies in the Dermatological Drugs Market 2019
2.1 Dermatological Drugs – A Rapidly Consolidating Market
2.2 Galderma (Nestle Skin Health S.A.)
2.2.1 Galderma (Nestle Skin Health S.A.): Total Revenue Forecast to 2028
2.2.2 Galderma (Nestle Skin Health S.A.): Dermatology Revenue Forecast to 2028
2.2.3 Galderma: Dermatological Drugs Portfolio, 2018
2.2.4 Global Leading Dermatological Drugs Galderma
2.2.4.1 Epiduo
2.2.4.1.1 Epiduo: Revenue Forecast to 2028
2.2.4.2 Differin
2.2.4.1.2 Differin: Revenue Forecast to 2028
2.2.5 Galderma: Recent Developments
2.2.5.1 Nestlé’s Acquisition of Galderma
2.2.5.2 Approval and Launch of Soolantra for Rosacea
2.2.5.3 FDA Approval of Restylane Lyft for Hands
2.2.5.4 Collaboration between Janssen’s and Galderma’s Nordic affiliates
2.3 Johnson & Johnson (J&J)
2.3.1 Johnson & Johnson: Total Revenue Forecast to 2028
2.3.2 Johnson & Johnson: Dermatology Revenue Forecast to 2028
2.3.3 Johnson & Johnson: Dermatological Drugs Portfolio, 2018
2.3.4 Global Leading Dermatological Drugs Johnson & Johnson
2.3.4.1 Stelara
2.3.4.1.1 Stelara: Revenue Forecast to 2028
2.3.4.2 Remicade
2.3.4.2.1 Remicade: Revenue Forecast to 2028
2.3.5 Johnson & Johnson: Recent Developments
2.3.5.1 U.S. FDA Approval of Tremfya (Guselkumab)
2.3.5.2 New TREMFYA (GUSELKUMAB) Data Demonstrates Long–Term Skin Clearance in Patients with Moderate to Severe Plaque Psoriasis
2.3.5.3 Extended Indication U.S. FDA Approval of STELARA (ustekinumab)
2.4 AbbVie, Inc.
2.4.1 AbbVie, Inc.: Total Revenue Forecast to 2028
2.4.2 AbbVie, Inc.: Dermatology Revenue Forecast to 2028
2.4.3 AbbVie, Inc.: Dermatological Drugs Portfolio, 2017
2.4.4 Global Leading Dermatological Drug AbbVie: Humira
2.4.4.1 Humira: Revenue Forecast to 2028
2.4.5 AbbVie, Inc.: Dermatological Drugs Product Pipeline, 2018
2.4.6 AbbVie, Inc.: Recent Developments
2.4.6.1 AbbVie Announces HUMIRA (adalimumab) Patent License with Mylan
2.4.6.2 AbbVie and Calico Announce Extension of Ground-breaking Collaboration
2.4.6.3 AbbVie Submits Marketing Authorization Application to the European Medicines Agency for Investigational Treatment Risankizumab for Moderate to Severe Plaque Psoriasis
2.5 GlaxoSmithKline, plc (GSK)
2.5.1 GlaxoSmithKline, plc (GSK): Total Revenue Forecast to 2028
2.5.2 GlaxoSmithKline, plc (GSK): Dermatology Revenue Forecast to 2028
2.5.3 GlaxoSmithKline, plc. (GSK): Dermatological Drugs Portfolio, 2017
2.5.4 Global Leading Dermatological Drug Glaxosmithkline
2.5.4.1 Valtrex
2.5.4.1.1 Valtrex: Revenue Forecast to 2028
2.5.4.2 Lamisil
2.5.4.2.1 Lamisil: Revenue Forecast to 2028
2.5.4.3 Bactroban
2.5.4.3.1 Bactroban: Revenue Forecast to 2028
2.5.4.4 Dermovate
2.5.4.4.1 Dermovate: Revenue Forecast to 2028
2.5.5 GlaxoSmithKline, plc. (GSK): Dermatological Drugs Product Pipeline, 2018
2.5.6 GlaxoSmithKline, plc. (GSK): Recent Developments
2.5.6.1 GSK and 23andMe sign agreement to leverage genetic insights for the development of novel medicines
2.5.6.2 Business Restructuring Arrangements with Novartis
2.5.6.3 Roivant subsidiary Dermavant Sciences signs agreement with GSK to purchase rights to tapinarof
2.6 Pfizer, Inc.
2.6.1 Pfizer, Inc.: Total Revenue Forecast to 2028
2.6.2 Pfizer, Inc.: Dermatology Revenue Forecast to 2028
2.6.3 Pfizer, Inc.: Dermatological Drugs Portfolio, 2018
2.6.4 Global Leading Dermatological Drug Pfizer
2.6.4.1 Zyvox
2.6.4.1.1 Zyvox: Revenue Forecast to 2028
2.6.5 Pfizer, Inc.: Dermatological Drugs Product Pipeline, 2018
2.6.6 Pfizer, Inc.: Recent Developments
2.6.6.1 XELJANZ (Tofacitinib Citrate) receives marketing authorisation in the European Union for active psoriatic arthritis
2.6.6.2 Pfizer to expand venture investing with $600 Million commitment to Pfizer ventures
2.6.6.3 Pfizer receives breakthrough therapy designation from FDA for PF–04965842, an oral JAK1 inhibitor, for the treatment of patients with moderate–to–severe atopic dermatitis
2.7 LEO Pharma A/S
2.7.1 LEO Pharma A/S: Total Revenue Forecast to 2028
2.7.2 LEO Pharma A/S: Dermatology Revenue Forecast to 2028
2.7.3 LEO Pharma A/S: Dermatological Drugs Portfolio, 2018
2.7.4 Global Leading Dermatological Drugs LEO Pharma
2.7.4.1 Protopic
2.7.4.1.1 Protopic: Revenue Forecast to 2028
2.7.5 LEO Pharma A/S: Dermatological Drugs Product Pipeline, 2018
2.7.6 LEO Pharma A/S: Recent Developments
2.7.6.1 LEO Pharma A/S to expand its lead in medical dermatology with acquisition of Bayer’s prescription dermatology unit
2.7.6.2 LEO Pharma A/S begins phase 3 clinical study with tralokinumab in adolescent patients with moderate–to–severe atopic dermatitis
2.7.6.3 LEO Pharma A/S and FibroTx LLC enter partnership to explore non–invasive skin test technology
2.8 Valeant Pharmaceuticals (Bausch Health Companies Inc.)
2.8.1 Valeant Pharmaceuticals: Total Revenue Forecast to 2028
2.8.2 Valeant Pharmaceuticals: Dermatology Revenue Forecast to 2028
2.8.3 Valeant Pharmaceuticals (Bausch Health Companies Inc.): Dermatological Drugs Portfolio, 2018
2.8.4 Global Leading Dermatological Drug Valeant Pharmaceuticals
2.8.4.1 Solodyn
2.8.4.1.1 Solodyn: Revenue Forecast to 2028
2.8.4.2 Ziana
2.8.4.2.1 Ziana: Revenue Forecast to 2028
2.8.5 Valeant Pharmaceuticals (Bausch Health Companies Inc.): Dermatological Drugs Product Pipeline, 2018
2.8.6 Valeant Pharmaceuticals (Bausch Health Companies Inc.): Recent Developments
2.8.6.1 Bausch Health Companies Inc. completes name change
2.8.6.2 Valeant Down as FDA Refuses to Approve Duobrii for Psoriasis
2.8.6.3 Valeant Announces U.S. Launch of SILIQ (brodalumab) Injection
2.9 Almirall S.A.
2.9.1 Almirall S.A.: Total Revenue Forecast to 2028
2.9.2 Almirall S.A.: Dermatology Revenue Forecast to 2028
2.9.3 Almirall S.A.: Dermatological Drugs Portfolio, 2018
2.9.4 Almirall S.A.: Dermatological Drugs Product Pipeline, 2018
2.9.5 Almirall S.A.: Recent Developments
2.9.5.1 Transformational Transaction – Almirall to acquire US medical dermatology portfolio from Allergan
2.9.5.2 Almirall receives positive CHMP opinion for new anti IL23 tildrakizumab for the treatment of patients with moderate–to–severe chronic plaque psoriasis Almirall
2.10 Eli Lilly and Company
2.10.1 Eli Lilly and Company: Total Revenue Forecast to 2028
2.10.2 Eli Lilly and Company: Dermatology Revenue Forecast to 2028
2.10.3 Eli Lilly and Company: Dermatological Drugs Portfolio, 2018
2.10.4 Global Leading Dermatological Drug Eli Lilly: Taltz
2.10.4.1 Taltz: Revenue Forecast to 2028
2.10.5 Eli Lilly and Company: Dermatological Drugs Product Pipeline, 2018
2.10.6 Eli Lilly and Company: Recent Developments
2.10.6.1 Lilly Announces Positive Top–Line Results for Second Phase 3 Study of Taltz (ixekizumab) in Ankylosing Spondylitis (Radiographic Axial Spondyloarthritis) for TNF Inhibitor–Experienced Patients
2.10.6.2 Lilly Completes Acquisition of ARMO BioSciences
2.11 Mylan N.V.
2.11.1 Mylan N.V.:Total Revenue Forecast to 2028
2.11.2 Mylan N.V.: Dermatology Revenue Forecast to 2028
2.11.3 Mylan N.V.: Dermatological Drugs Portfolio, 2018
2.11.4 Mylan N.V.: Recent Developments
2.11.4.1 Mylan to Bring a Biosimilar of BOTOX to the Market through a Collaboration and License agreement with Revance Therapeutics, Inc.
2.11.4.2 Mylan Completes Acquisition of Renaissance's Leading Topicals–Focused Specialty and Generics Business
2.11.4.3 Mylan Completes Acquisition of Meda
2.12 Lupin Ltd.
2.12.1 Lupin Ltd.: Total Revenue Forecast to 2028
2.12.2 Lupin Ltd.: Dermatology Revenue Forecast to 2028
2.12.3 Lupin Ltd.: Dermatological Drugs Portfolio, 2018
2.12.4 Lupin Ltd.: Dermatological Drugs Product Pipeline, 2018
2.12.5 Lupin Ltd.: Recent Developments
2.12.5.1 Lupin launches generic Desoximetasone Topical Spray, 0.25% in the US
2.12.5.2 Lupin and Mylan Partner to Commercialize Enbrel (Etanercept) Biosimilar
2.12.5.3 Lupin submits New Drug Application for Etanercept biosimilar in Japan
2.13 Novartis AG
2.13.1 Novartis AG: Total Revenue Forecast to 2028
2.13.2 Novartis AG: Dermatology Revenue Forecast to 2028
2.13.3 Novartis AG: Dermatological Drugs Portfolio, 2018
2.13.4 Global Leading Dermatological Drug Novartis: Cosentyx
2.13.4.1 Cosentyx: Revenue Forecast to 2028
2.13.5 Novartis AG: Dermatological Drugs Product Pipeline, 2018
2.13.6 Novartis AG: Recent Developments
2.13.6.1 Novartis demonstrates commitment to lead immuno–dermatology by in–licensing IL–17C compound for atopic dermatitis
2.13.6.2 Sandoz receives European Commission approval for biosimilar Hyrimoz (adalimumab)
2.13.6.3 Sandoz receives European Commission approval for Zessly (infliximab) in gastroenterological, rheumatological and dermatological diseases
2.14 Sanofi
2.14.1 Sanofi: Total Revenue Forecast to 2028
2.14.2 Sanofi: Dermatology Revenue Forecast to 2028
2.14.3 Sanofi: Dermatological Drugs Portfolio, 2018
2.14.4 Sanofi: Recent Developments
2.14.4.1 Sanofi and Advent finalize negotiations for the acquisition of Zentiva
2.14.4.2 Sanofi completes its acquisition of Ablynx following the expiration of the Squeeze–out Procedure
2.14.4.3 Dupixent (dupilumab) showed positive Phase–3 results in adolescents with inadequately controlled moderate–to–severe atopic dermatitis
2.14.4.4 Demand for Dupixent remains strong
2.15 Allergan plc.
2.15.1 Allergan plc.: Total Revenue Forecast to 2028
2.15.2 Allergan plc.: Dermatology Revenue Forecast to 2028
2.15.3 Allergan plc.: Dermatological Drugs Portfolio, 2018
2.15.4 Global Leading Dermatological Drug Allergan
2.15.4.1 Aczone
2.15.4.1.1 Aczone: Revenue Forecast to 2028
2.15.5 Allergan plc.: Dermatological Drugs Product Pipeline, 2018
2.15.6 Allergan plc.: Recent Developments
2.15.6.1 FDA Accepts New Drug Application for Seysara (Sarecycline) for the Treatment of Moderate to Severe Acne
2.15.6.2 ACZONE (dapsone) Gel, 7.5% Recognized with Teen Vogue Acne Award Win
2.15.6.3 Allergan Expands Leading Research & Development NASH Program with Novartis Clinical Collaboration
2.16 Merck
2.16.1 Merck: Total Revenue Forecast to 2028
2.16.2 Merck: Dermatology Revenue Forecast to 2028
2.16.3 Merck: Dermatological Drugs Portfolio, 2018
2.16.4 Global Leading Dermatological Drug Merck
2.16.4.1 Cubicin
2.16.4.1.1 Cubicin: Revenue Forecast to 2028
2.16.4.2 Elocon
2.16.4.2.1 Elocon: Revenue Forecast to 2028
2.16.5 Merck: Recent Developments
2.16.5.1 Merck and Viralytics Announce Acquisition Agreement, Expanding Merck’s Leading Immuno–Oncology Pipeline
2.16.5.2 Merck to Acquire Rigontec, RIG–I Therapeutics Pioneer, Advancing Leadership in Immuno–Oncology
2.16.5.3 Allergan Expands Leading Research & Development NASH Program with Novartis Clinical Collaboration
2.17 Sun Pharmaceutical Industries, Ltd.
2.17.1 Sun Pharmaceutical Industries, Ltd.: Total Revenue Forecast to 2028
2.17.2 Sun Pharmaceutical Industries, Ltd.: Dermatology Revenue Forecast to 2028
2.17.3 Sun Pharmaceutical Industries, Ltd.: Dermatological Drugs Portfolio, 2018
2.17.4 Global Leading Dermatological Drug Sun Pharmaceutical
2.17.4.1 Absorica /Epirus
2.17.4.1.1 Absorica /Epirus: Revenue Forecast to 2028
2.17.5 Sun Pharmaceutical Industries, Ltd.: Recent Developments
2.17.5.1 Sun Pharma Announces U.S. FDA Approval of ILUMYA (tildrakizumab–asmn) for the Treatment of Moderate–to–Severe Plaque Psoriasis
2.17.5.2 Sun Pharma & Samsung BioLogics announce strategic manufacturing tie–up for Tildrakizumab
2.17.5.3 Sun Pharma announces distribution alliance with Mitsubishi Tanabe Pharma Corporation in Japan
2.18 Amgen Inc.
2.18.1 Amgen Inc.: Total Revenue Forecast to 2028
2.18.2 Amgen Inc.: Dermatology Revenue Forecast to 2028
2.18.3 Amgen Inc.: Dermatological Drugs Portfolio, 2018
2.18.4 Global Leading Dermatological Drug Amgen: Enbrel
2.18.4.1 Enbrel: Revenue Forecast to 2028
2.18.5 Amgen Inc.: Dermatological Drugs Product Pipeline, 2018
2.18.6 Amgen Inc.: Recent Developments
2.18.6.1 Amgen Announces Top–Line Results from Phase 3 Study of ABP 710, Biosimilar Candidate to Infliximab
2.18.6.2 Amgen Launches the ENBREL Mini Single–Dose Prefilled Cartridge with AutoTouch Reusable Autoinjector That Is Ergonomically Designed for Patients
2.18.6.3 Amgen and CytomX Therapeutics Announce Strategic Collaboration in Immuno–Oncology
2.19 F. Hoffmann–La Roche Ltd
2.19.1 F. Hoffmann–La Roche Ltd: Total Revenue Forecast to 2028
2.19.2 F. Hoffmann–La Roche Ltd: Dermatology Revenue Forecast to 2028
2.19.3 F. Hoffmann–La Roche Ltd: Dermatological Drugs Portfolio, 2018
2.20 Mayne Pharma
2.20.1 Mayne Pharma: Total Revenue Forecast to 2028
2.20.2 Mayne Pharma: Dermatology Revenue Forecast to 2028
2.20.3 Mayne Pharma: Dermatological Drugs Portfolio, 2018
2.20.4 Global Leading Dermatological Drugs Mayne Pharma
2.20.4.1 Doryx
2.20.4.1.1 Doryx: Revenue Forecast to 2028
2.20.5 Mayne Pharma: Recent Developments
2.20.5.1 Mayne Pharma acquires generic EFUDEX, Complementing US Dermatology Portfolio
2.20.5.2 Mayne Pharma announces FDA approval and immediate launch of Doxycycline Hyclate IR tablets, first generic to Acticlate
2.20.5.3 Mayne Pharma launches Fabior and Sorilux in the UNITED STATES
2.21 Concert Pharmaceuticals, Inc.
2.21.1 Concert Pharmaceuticals, Inc.: Total Revenue Forecast to 2028
2.21.2 Concert Pharmaceuticals, Inc.: Dermatology Revenue Forecast to 2028
2.21.3 Concert Pharmaceuticals, Inc.: Recent Developments
2.21.3.1 Vertex and Concert Pharmaceuticals Complete Asset Purchase Agreement
2.21.3.2 Concert Pharmaceuticals Announces Strategic Collaboration with Celgene Corporation to Develop Deuterium–Modified Compounds
2.22 Novan, Inc.
2.22.1 Novan, Inc.: Total Revenue Forecast to 2028
2.22.2 Novan, Inc.: Total Revenue Forecast: ($bn), AGR (%), CAGR (%), 2018–2028
2.22.3 Novan, Inc.: Dermatological Drugs Product Pipeline, 2018
2.22.4 Novan, Inc.: Recent Developments
2.22.4.1 Novan to Present Integrated Data from Phase 3 Trials with SB204 for Treatment of Acne
2.22.4.2 Novan Acquires IP Rights to Treat Viral Malignancies with Nitric Oxide
2.22.4.3 Novan Presents Preclinical Data from Inflammatory Skin Diseases Program
2.23 Bayer AG
2.23.1 Bayer AG: Total Revenue Forecast to 2028
2.23.2 Bayer AG: Dermatology Revenue Forecast to 2028
2.23.3 Bayer AG: Dermatological Drugs Portfolio, 2018
2.23.4 Global Leading Dermatological Drugs Bayer
2.23.4.1 Canesten
2.23.4.1.1 Canesten: Revenue Forecast to 2028
2.23.4.2 Bepanthen/Bepanthol
2.23.4.2.1 Bepanthen/ Bepanthol: Revenue Forecast to 2028
2.23.5 Bayer AG: Recent Developments
2.23.5.1 Bayer hones its brand profile
2.23.5.2 Bayer combines pharmaceutical research and development unit
2.24 Astellas Pharma Inc.
2.24.1 Astellas Pharma Inc.: Total Revenue Forecast to 2028
2.24.2 Astellas Pharma Inc.: Dermatology Revenue Forecast: ($bn), AGR (%), CAGR (%), 2018–2028
2.24.3 Astellas Pharma Inc.: Dermatological Drugs Portfolio, 2018
2.24.4 Astellas Pharma Inc.: Recent Developments
2.24.4.1 Astellas Acquires Universal Cells, Inc.
2.25 Pierre Fabre, S.A.
2.24.1 Pierre Fabre, S.A.: Total Revenue Forecast to 2028
2.24.2 Pierre Fabre, S.A.: Dermatology Revenue Forecast to 2028
2.25.3 Pierre Fabre, S.A.: Dermatological Drugs Portfolio, 2018
2.25.4 Pierre Fabre, S.A.: Recent Developments
2.25.4.1 Pierre Fabre Pharmaceuticals acquires promising assets from Igenica Biotherapeutics in the field of immuno–oncology
2.25.4.2 PIERRE FABRE signs a partnership with biotech company SETUBIO as part of the Nature Open Library program
2.25.4.3 Pierre Fabre and Hill Dermaceuticals, Inc. announce a strategic commercial partnership for TOLAK (fluorouracil) Cream 4% in the USA and beyond
3. Conclusion
Associated Reports
Visiongain Report Sales Order Form
About Visiongain
Visiongain Report Evaluation Form
List of Tables
Table 2.1 Leading Dermatological Drug Manufacturers: Total Company Revenue ($bn), 2017
Table 2.2 Leading Dermatological Drug Manufacturers: Dermatology Segment Revenue ($bn), 2017
Table 2.3 Galderma: Company Overview, 2017
Table 2.4 Galderma (Nestle Skin Health S.A.): Total Revenue Forecast: ($bn), AGR (%), CAGR (%), 2018–2028
Table 2.5 Galderma (Nestle Skin Health S.A.): Dermatology Revenue Forecast: (US$ bn), AGR (%), CAGR (%), 2018–2028
Table 2.6 Epiduo: Revenue Forecast ($bn), AGR (%), CAGR (%), 2018–2028
Table 2.7 Differin: Revenue Forecast ($bn), AGR (%), CAGR (%), 2018–2028
Table 2.8 Johnson & Johnson: Company Overview, 2017
Table 2.9 Johnson & Johnson: Total Revenue Forecast: ($bn), AGR (%), CAGR (%), 2018–2028
Table 2.10 Johnson & Johnson: Dermatology Revenue Forecast: ($bn), AGR (%), CAGR (%), 2018–2028
Table 2.11 Stelara: Revenue Forecast: ($bn), AGR (%), CAGR (%), 2018–2028
Table 2.12 Remicade: Revenue Forecast: ($bn), AGR (%), CAGR (%), 2018–2028
Table 2.13 AbbVie, Inc.: Company Overview, 2017
Table 2.14 AbbVie, Inc.: Total Revenue Forecast: ($bn), AGR (%), CAGR (%), 2018–2028
Table 2.15 AbbVie, Inc.: Dermatology Revenue Forecast ($bn), AGR (%), CAGR (%), 2018–2028
Table 2.16 Humira: Revenue Forecast: ($bn), AGR (%), CAGR (%), 2018–2028
Table 2.17 AbbVie Inc., Dermatological Drug Pipeline, 2018
Table 2.18 GlaxoSmithKline, plc (GSK): Company Overview, 2017
Table 2.19 GlaxoSmithKline, plc (GSK): Total Revenue Forecast: ($bn), AGR (%), CAGR (%), 2018–2028
Table 2.20 GlaxoSmithKline, plc (GSK): Dermatology Revenue Forecast ($bn), AGR (%), CAGR (%), 2018–2028
Table 2.21 Valtrex: Revenue Forecast: ($bn), AGR (%), CAGR (%), 2018–2028
Table 2.22 Lamisil: Revenue Forecast ($bn), AGR (%), CAGR (%), 2018–2028
Table 2.23 Bactroban: Revenue Forecast ($bn), AGR (%), CAGR (%), 2018–2028
Table 2.24 Dermovate: Revenue Forecast ($bn), AGR (%), CAGR (%), 2018–2028
Table 2.25 GlaxoSmithKline, plc., dermatological drug pipeline, 2018
Table 2.26 Pfizer, Inc.: Company Overview, 2017
Table 2.27 Pfizer, Inc.: Revenue Forecast ($bn), AGR (%), CAGR (%), 2018–2028
Table 2.28 Pfizer, Inc.: Dermatology Revenue Forecast: ($bn), AGR (%), CAGR (%), 2018–2028
Table 2.29 Zyvox: Revenue Forecast ($bn), AGR (%), CAGR (%), 2018–2028
Table 2.30 Pfizer, Inc.: Dermatological Drug Pipeline, 2018
Table 2.31 LEO Pharma A/S: Company Overview, 2017
Table 2.32 LEO Pharma A/S: Total Revenue Forecast ($bn), AGR (%), CAGR (%), 2018–2028
Table 2.33 LEO Pharma A/S: Dermatology Revenue Forecast ($bn), AGR (%), CAGR (%), 2018–2028
Table 2.34 Protopic: Revenue Forecast ($bn), AGR (%), CAGR (%), 2018–2028
Table 2.35 LeoPharmaA/S: Dermatological Drug Pipeline, 2018
Table 2.36 Valeant Pharmaceuticals (Bausch Health Companies Inc.): Company Overview, 2017
Table 2.37 Valeant Pharmaceuticals: Total Revenue Forecast ($bn), AGR (%), CAGR (%), 2018–2028
Table 2.38 Valeant Pharmaceuticals: Dermatology Revenue Forecast ($bn), AGR (%), CAGR (%), 2018 – 2028
Table 2.39 Solodyn: Revenue Forecast ($bn), AGR (%), CAGR (%), 2018–2028
Table 2.40 Ziana: Revenue Forecast ($bn), AGR (%), CAGR (%), 2018–2028
Table 2.41 Valeant Pharmaceuticals: Dermatological Drug Pipeline, 2018
Table 2.42 Almirall S.A.: Company Overview, 2017
Table 2.43 Almirall S.A.: Total Revenue Forecast ($bn), AGR (%), CAGR (%), 2018 – 2028
Table 2.44 Almirall S.A.: Dermatology Revenue Forecast ($bn), AGR (%), CAGR (%), 2018–2028
Table 2.45 Almirall S.A.: Dermatological Drug Pipeline, 2018
Table 2.46 Eli Lilly and Company: Company Overview, 2017
Table 2.47 Eli Lilly and Company: Total Revenue Forecast ($bn), AGR (%), CAGR (%), 2018–2028
Table 2.48 Eli Lilly and Company: Dermatology Revenue Forecast ($bn), AGR (%), CAGR (%), 2018–2028
Table 2.49 Taltz: Revenue Forecast ($bn), AGR (%), CAGR (%), 2018–2028
Table 2.50 Eli Lilly and Company: Dermatological Drug Pipeline, 2018
Table 2.51 Mylan N.V.: Company Overview, 2017
Table 2.52 Mylan N.V.: Total Revenue Forecast ($bn), AGR (%), CAGR (%), 2018–2028
Table 2.53 Mylan N.V.: Dermatology Revenue Forecast ($bn), AGR (%), CAGR (%), 2018–2028
Table 2.54 Lupin Ltd.: Company Overview, 2017
Table 2.55 Lupin Ltd.: Total Revenue Forecast ($bn), AGR (%), CAGR (%), 2018–2028
Table 2.56 Lupin Ltd.: Dermatology Revenue Forecast ($bn), AGR (%), CAGR (%), 2018–2028
Table 2.57 Lupin Ltd: Dermatological Drug Pipeline, 2018
Table 2.58 Novartis AG: Company Overview, 2017
Table 2.59 Novartis AG: Total Revenue Forecast ($bn), AGR (%), CAGR (%), 2018–2028
Table 2.60 Novartis AG: Dermatology Revenue Forecast ($bn), AGR (%), CAGR (%), 2018–2028
Table 2.61 Cosentyx: Revenue Forecast ($bn), AGR (%), CAGR (%), 2018–2028
Table 2.62 Novartis AG: Dermatological Drug Pipeline, 2018
Table 2.63 Sanofi: Company Overview, 2017
Table 2.64 Sanofi: Total Revenue Forecast ($bn), AGR (%), CAGR (%), 2018–2028
Table 2.65 Sanofi: Dermatology Revenue Forecast ($bn), AGR (%), CAGR (%), 2018–2028
Table 2.66 Allergan plc.: Company Overview, 2017
Table 2.67 Allergan plc.: Total Revenue Forecast ($bn), AGR (%), CAGR (%), 2018–2028
Table 2.68 Allergan plc.: Dermatology Revenue Forecast ($bn), AGR (%), CAGR (%), 2018–2028
Table 2.69 Aczone: Revenue Forecast ($bn), AGR (%), CAGR (%), 2018–2028
Table 2.70 Allergan, plc: Dermatological Drug Pipeline, 2018
Table 2.71 Merck: Company Overview, 2017
Table 2.72 Merck: Total Revenue Forecast: ($bn), AGR (%), CAGR (%), 2018–2028
Table 2.73 Merck: Dermatology Revenue Forecast: ($bn), AGR (%), CAGR (%), 2018–2028
Table 2.74 Cubicin: Revenue Forecast ($bn), AGR (%), CAGR (%), 2018–2028
Table 2.75 Elocon: Revenue Forecast ($bn), AGR (%), CAGR (%), 2018–2028
Table 2.76 Sun Pharmaceutical Industries, Ltd.: Company Overview, 2017
Table 2.77 Sun Pharmaceutical Industries, Ltd.: Total Revenue Forecast ($bn), AGR (%), CAGR (%), 2018–2028
Table 2.78 Sun Pharmaceutical Industries, Ltd.: Dermatology Revenue Forecast: ($bn), AGR (%), CAGR (%), 2018–2028
Table 2.79 Absorica /Epirus: Revenue Forecast: ($bn), AGR (%), CAGR (%), 2018–2028
Table 2.80 Amgen Inc.: Company Overview, 2017
Table 2.81 Amgen Inc.: Total Revenue Forecast ($bn), AGR (%), CAGR (%), 2018–2028
Table 2.82 Amgen Inc.: Dermatology Revenue Forecast ($bn), AGR (%), CAGR (%), 2018–2028
Table 2.83 Enbrel: Revenue Forecast ($bn), AGR (%), CAGR (%), 2018–2028
Table 2.84 Amgen, Inc.: Dermatological Drug Pipeline, 2018
Table 2.85 F. Hoffmann–La Roche Ltd: Company Overview, 2017
Table 2.86 F. Hoffmann–La Roche Ltd: Total Revenue Forecast ($bn), AGR (%), CAGR (%), 2018–2028
Table 2.87 F. Hoffmann–La Roche Ltd: Dermatology Revenue Forecast: ($bn), AGR (%), CAGR (%), 2018–2028
Table 2.88 Mayne Pharma: Company Overview, 2017
Table 2.89 Mayne Pharma: Revenue Forecast ($bn), AGR (%), CAGR (%), 2018–2028
Table 2.90 Mayne Pharma: Dermatology Revenue Forecast ($bn), AGR (%), CAGR (%), 2018–2028
Table 2.91 Doryx: Revenue Forecast: ($bn), AGR (%), CAGR (%), 2018–2028
Table 2.92 Concert Pharmaceuticals, Inc.: Company Overview, 2017
Table 2.93 Concert Pharmaceuticals, Inc.: Total Revenue Forecast ($bn), AGR (%), CAGR (%), 2018–2028
Table 2.94 Concert Pharmaceuticals, Inc.: Dermatology Revenue Forecast: ($bn), AGR (%), CAGR (%), 2018–2028
Table 2.95 Novan, Inc.: Company Overview, 2017
Table 2.96 Novan, Inc.: Total Revenue Forecast ($bn), AGR (%), CAGR (%), 2018–2028
Table 2.97 Novan, Inc.: Total Revenue Forecast: ($bn), AGR (%), CAGR (%), 2018–2028
Table 2.98 Novan, Inc.: Dermatological Drug Pipeline, 2018
Table 2.99 Bayer AG: Company Overview, 2017
Table 2.100 Bayer AG: Total Revenue Forecast ($bn), AGR (%), CAGR (%), 2018–2028
Table 2.101 Bayer AG: Dermatology Revenue Forecast: ($bn), AGR (%), CAGR (%), 2018–2028
Table 2.102 Canesten: Revenue Forecast ($bn), AGR (%), CAGR (%), 2018–2028
Table 2.103 Bepanthen/ Bepanthol: Revenue Forecast: ($bn), AGR (%), CAGR (%), 2018–2028
Table 2.104 Astellas Pharma Inc.: Company Overview, 2017
Table 2.105 Astellas Pharma Inc.: Total Revenue Forecast: ($bn), AGR (%), CAGR (%), 2018–2028
Table 2.106 Astellas Pharma Inc.: Dermatology Revenue Forecast ($bn), AGR (%), CAGR (%), 2018–2028
Table 2.107 Pierre Fabre, S.A.: Company Overview, 2017
Table 2.108 Pierre Fabre, S.A.: Total Revenue Forecast: ($bn), AGR (%), CAGR (%), 2018–2028
List of Figures
Figure 2.1 Galderma: Total Revenue Forecast ($bn), 2018-2028
Figure 2.2 Galderma: Dermatology Revenue Forecast ($bn), 2018-2028
Figure 2.3 Epiduo: Revenue Forecast ($bn), 2018-2028
Figure 2.4 Differin: Revenue Forecast ($bn), 2018-2028
Figure 2.5 Johnson & Johnson: Total Revenue Forecast ($bn), 2018-2028
Figure 2.6 Johnson & Johnson: Dermatology Revenue Forecast ($bn), 2018-2028
Figure 2.7 Stelara: Revenue Forecast ($bn), 2018-2028
Figure 2.8 Remicade: Revenue Forecast ($bn), 2018-2028
Figure 2.9 AbbVie, Inc.: Revenue Forecast ($bn), 2018-2028
Figure 2.10 AbbVie, Inc.: Dermatology Revenue Forecast ($bn), 2018-2028
Figure 2.11 Humira: Revenue Forecast ($bn), 2018-2028
Figure 2.12 GlaxoSmithKline, plc (GSK): Total Revenue Forecast ($bn), 2018-2028
Figure 2.13 GlaxoSmithKline, plc (GSK): Dermatology Revenue Forecast ($bn), 2018-2028
Figure 2.14 Valtrex: Revenue Forecast ($bn), 2018-2028
Figure 2.15 Lamisil: Revenue Forecast ($bn), 2018-2028
Figure 2.16 Bactroban: Revenue Forecast ($bn), 2018-2028
Figure 2.17 Dermovate: Revenue Forecast ($bn), 2018-2028
Figure 2.18 Pfizer, Inc.: Total Revenue Forecast ($bn), 2018-2028
Figure 2.19 Pfizer, Inc.: Dermatology Revenue Forecast ($bn), 2018-2028
Figure 2.20 Zyvox Revenue Forecast ($bn), 2018-2028
Figure 2.21 LEO Pharma A/S: Total Revenue Forecast ($bn), 2018-2028
Figure 2.22 LEO Pharma A/S: Dermatology Revenue Forecast ($bn), 2018-2028
Figure 2.23 Protopic: Revenue Forecast ($bn), 2018-2028
Figure 2.24 Valeant Pharmaceuticals: Total Revenue Forecast ($bn), 2018-2028
Figure 2.25 Valeant Pharmaceuticals: Dermatology Revenue Forecast ($bn), 2018 - 2028
Figure 2.26 Solodyn: Revenue Forecast ($bn), 2018-2028
Figure 2.27 Ziana: Revenue Forecast ($bn), 2018-2028
Figure 2.28 Almirall S.A.: Total Revenue Forecast ($bn), 2018-2028
Figure 2.29 Almirall S.A.: Dermatology Revenue Forecast ($bn), 2018-2028
Figure 2.30 Eli Lilly and Company: Total Revenue Forecast ($bn), 2018-2028
Figure 2.31 Eli Lilly and Company: Dermatology Revenue Forecast ($bn), 2018-2028
Figure 2.32 Taltz: Revenue Forecast ($bn), 2018-2028
Figure 2.33 Mylan N.V.: Total Revenue Forecast ($bn), 2018-2028
Figure 2.34 Mylan N.V.: Dermatology Revenue Forecast ($bn), 2018-2028
Figure 2.35 Lupin Ltd.: Total Revenue Forecast ($bn), 2018-2028
Figure 2.36 Lupin Ltd.: Dermatology Revenue Forecast ($bn), 2018-2028
Figure 2.37 Novartis AG: Total Revenue Forecast ($bn), 2018-2028
Figure 2.38 Novartis AG: Dermatology Revenue Forecast ($bn), 2018-2028
Figure 2.39 Cosentyx: Revenue Forecast ($bn), 2018-2028
Figure 2.40 Sanofi: Total Revenue Forecast ($bn), 2018-2028
Figure 2.41 Sanofi: Dermatology Revenue Forecast ($bn), 2018-2028
Figure 2.42 Allergan plc.: Total Revenue Forecast (US$ bn), 2018-2028
Figure 2.43 Allergan plc.: Dermatology Revenue Forecast ($bn), 2018-2028
Figure 2.44 Aczone: Revenue Forecast ($bn), 2018-2028
Figure 2.45 Merck: Total Revenue Forecast ($bn), 2018-2028
Figure 2.46 Merck: Dermatology Revenue Forecast ($bn), 2018-2028
Figure 2.47 Cubicin: Revenue Forecast ($bn), 2018-2028
Figure 2.48 Elocon: Revenue Forecast ($bn), 2018-2028
Figure 2.49 Sun Pharmaceutical Industries, Ltd.: Total Revenue Forecast ($bn), 2018-2028
Figure 2.50 Sun Pharmaceutical Industries, Ltd.: Dermatology Revenue Forecast ($bn), 2018-2028
Figure 2.51 Absorica /Epirus: Revenue Forecast ($bn), 2018-2028
Figure 2.52 Amgen Inc.: Total Revenue Forecast ($bn), 2018-2028
Figure 2.53 Amgen Inc.: Dermatology Revenue Forecast ($bn), 2018-2028
Figure 2.54 Enbrel Revenue Forecast: ($bn), 2018-2028
Figure 2.55 F. Hoffmann-La Roche Ltd: Total Revenue Forecast ($bn), 2018-2028
Figure 2.56 F. Hoffmann-La Roche Ltd: Dermatology Revenue Forecast ($bn), 2018-2028
Figure 2.57 Mayne Pharma: Total Revenue Forecast ($bn), 2018-2028
Figure 2.58 Mayne Pharma: Dermatology Revenue Forecast ($bn), 2018-2028
Figure 2.59 Doryx: Revenue Forecast ($bn), 2018-2028
Figure 2.60 Concert Pharmaceuticals, Inc.: Total Revenue Forecast ($bn), 2018-2028
Figure 2.61 Concert Pharmaceuticals, Inc.: Dermatology Revenue Forecast ($bn), 2018-2028
Figure 2.62 Novan, Inc.: Total Revenue Forecast ($bn), 2018-2028
Figure 2.63 Novan, Inc.: Total Revenue Forecast ($bn), 2018-2028
Figure 2.64 Bayer AG: Total Revenue Forecast ($bn), 2018-2028
Figure 2.65 Bayer AG: Dermatology Revenue Forecast ($bn), 2018-2028
Figure 2.66 Canesten: Revenue Forecast ($bn), 2018-2028
Figure 2.67 Bepanthen/ Bepanthol: Revenue Forecast ($bn), 2018-2028
Figure 2.68 Astellas Pharma Inc.: Total Revenue Forecast ($bn), 2018-2028
Figure 2.69 Astellas Pharma Inc.: Dermatology Revenue Forecast ($bn), 2018-2028
Figure 2.70 Pierre Fabre, S.A.: Total Revenue Forecast ($bn), 2018-2028
Figure 2.71 Pierre Fabre, S.A.: Dermatology Revenue Forecast ($bn), 2018-2028
23andMe, Inc.
Abbott Laboratories
AbbVie Inc.
Ablynx NV
Actavis plc
Advent International
Allergan plc
Almirall S.A.
American Academy of Dermatology (AAD)
Amgen
ARMO BioSciences
Astellas Pharma Inc.
Avanir Pharmaceuticals, Inc.
Bausch Health Companies Inc.
Bayer AG
Calico Life Sciences LLC
Celgene Corporation
Celgene International Sarl
Celgene Pharmaceuticals, Inc.
Concert Pharmaceuticals, Inc.
Dermavant Sciences
Eli Lilly and Company
European Commission (EC)
European Medicines Agency (EMA)
FibroTx LLC
Food and Drug Administration (FDA)
Galapagos
Galderma
GlaxoSmithkline plc (GSK)
Hill Dermaceuticals, Inc.
Igenica Biotherapeutics
Janssen
Jazz Pharmaceuticals, Inc.
Johnson & Johnson (J&J)
KNOW Bio
L’Oréal
Laboratorios Almirall, S.A.
Leo Pharma A/S
Lupin Ltd
Mayne Pharma Group Limited
Meda Aktiebolag
Merck
Mitsubishi Tanabe Pharma
MorphoSys
Mylan N.V.
Nestlé
Nestle Skin Health S.A.
New Moon B.V.
Novan, Inc.
Novartis AG
Pfizer Inc.
Pharmaceuticals and Medical Devices Agency (PMDA)
Pierre Fabre S.A.
Proteostasis Therapeutics, Inc.
Renaissance Acquisition Holdings, LLC.
Revance Therapeutics, Inc.
Rigontec
Roche
Roivant Sciences
Samsung BioLogics
Sandoz
SangStat
Sanofi
Stiefel Laboratories
Sun Pharmaceutical Industries, Ltd.
Taro Pharmaceuticals U.S.A Inc.
The University of Texas MD Anderson Cancer Center
Universal Cells, Inc.
Valeant Pharmaceuticals
Viralytics Limited
Download sample pages
Complete the form below to download your free sample pages for Top 25 Dermatological Drugs Manufacturers 2019
Related reports
-
Pharmaceutical Contract Manufacturing Market 2018-2028
The pharmaceutical contract manufacturing market is expected to grow at a CAGR of 6.0% in the first half of the...
Full DetailsPublished: 27 June 2018 -

Global Probiotics Market Forecast 2018-2028
The global probiotics market reached $43bn in 2017 and is estimated to reach $59bn by 2022. In 2017, the bacterial...
Full DetailsPublished: 29 October 2018 -

The Global Respiratory Inhalers Market 2018-2028
The global respiratory inhalers market reached $33bn in 2017 and is estimated to reach $38bn by 2023. In 2017, the...
Full DetailsPublished: 24 October 2018 -

Advanced Wound Care Market Forecast 2018-2028
Our 277-page report provides 175 tables, charts, and graphs. Read on to discover the most lucrative areas in the industry...
Full DetailsPublished: 29 August 2018 -

Biologics Market Trends and Forecasts 2018-2028
The global biologics market is estimated to reach $250bn in 2023. The market is expected to grow at a CAGR...
Full DetailsPublished: 14 November 2018 -

Pharma Leader Series: Top 50 Pharmaceutical Contract Manufacturing Organisations (CMOs) Market 2018
Contract manufacturing represents the largest sector of the pharma outsourcing industry. Pharmaceutical companies have sought to take advantage of the...Full DetailsPublished: 28 September 2018 -
Global Medical Device Contract Manufacturing Market Forecast 2019-2029
The global medical device contract manufacturing market was valued at $75.84bn in 2018. Visiongain forecasts this market to increase to...Full DetailsPublished: 06 August 2019 -
Top 25 Translational Regenerative Medicine Manufacturers 2019
In 2018, the global translational regenerative medicine is estimated at $28bn. The global translational regenerative medicine market is highly competitive...
Full DetailsPublished: 05 April 2019 -

Top 20 Global Respiratory Inhalers Manufacturers 2019
The global respiratory inhalers market is estimated to reach $38bn in 2023. In the respiratory Inhalers market the top three...
Full DetailsPublished: 09 April 2019 -

Collagen Market Report 2019-2029
The collagen market is estimated to have reached $3.8bn in 2018 and expected to grow at a CAGR of 8.10%...Full DetailsPublished: 08 April 2019
Download sample pages
Complete the form below to download your free sample pages for Top 25 Dermatological Drugs Manufacturers 2019
Do you have any custom requirements we can help you with?
Any specific country, geo region, market segment or specific company information?
Email us today, we can discuss your needs and see how we can help: jamie.roberts@visiongain.com
Would you like a free report overview of the report of your choice?
If so, please drop an email to Jamie Roberts stating your chosen report title to jamie.roberts@visiongain.com
Visiongain’s reports are based on comprehensive primary and secondary research. Those studies provide global market forecasts (sales by drug and class, with sub-markets and leading nations covered) and analyses of market drivers and restraints (including SWOT analysis) and current pipeline developments. To find out more about our reports methodology, please email jamie.roberts@visiongain.com
“Thank you for this Gene Therapy R&D Market report and for how easy the process was. Your colleague was very helpful and the report is just right for my purpose. This is the 2nd good report from Visiongain and a good price.”
Dr Luz Chapa Azuella, Mexico
American Association of Colleges of Pharmacy
American College of Clinical Pharmacy
American Pharmacists Association
American Society for Pharmacy Law
American Society of Consultant Pharmacists
American Society of Health-System Pharmacists
Association of Special Pharmaceutical Manufacturers
Australian College of Pharmacy
Biotechnology Industry Organization
Canadian Pharmacists Association
Canadian Society of Hospital Pharmacists
Chinese Pharmaceutical Association
College of Psychiatric and Neurologic Pharmacists
Danish Association of Pharmaconomists
European Association of Employed Community Pharmacists in Europe
European Medicines Agency
Federal Drugs Agency
General Medical Council
Head of Medicines Agency
International Federation of Pharmaceutical Manufacturers & Associations
International Pharmaceutical Federation
International Pharmaceutical Students’ Federation
Medicines and Healthcare Products Regulatory Agency
National Pharmacy Association
Norwegian Pharmacy Association
Ontario Pharmacists Association
Pakistan Pharmacists Association
Pharmaceutical Association of Mauritius
Pharmaceutical Group of the European Union
Pharmaceutical Society of Australia
Pharmaceutical Society of Ireland
Pharmaceutical Society Of New Zealand
Pharmaceutical Society of Northern Ireland
Professional Compounding Centers of America
Royal Pharmaceutical Society
The American Association of Pharmaceutical Scientists
The BioIndustry Association
The Controlled Release Society
The European Federation of Pharmaceutical Industries and Associations
The European Personalised Medicine Association
The Institute of Clinical Research
The International Society for Pharmaceutical Engineering
The Pharmaceutical Association of Israel
The Pharmaceutical Research and Manufacturers of America
The Pharmacy Guild of Australia
The Society of Hospital Pharmacists of Australia
Don’t Miss Out!
Subscribe to receive the latest Industry news, trending insight and analysis straight to your inbox.Choose your preferences:
Latest Pharma news
Retinal Gene Therapy Market
The global Retinal Gene Therapy market is projected to grow at a CAGR of 9.6% by 2034
26 July 2024
HIV Drugs and Injectables Market
The global HIV Drugs & Injectables market is projected to grow at a CAGR of 4.6 % by 2034
24 July 2024
Digital Twin Technology in Pharmaceutical Manufacturing Market
The global Digital Twin Technology in Pharmaceutical Manufacturing market is projected to grow at a CAGR of 31.3% by 2034
23 July 2024
Specialty Pharma Market
The global Specialty Pharma market is projected to grow at a CAGR of 7.5% by 2034
22 July 2024
