1. Report Overview
1.1 Overview of the Top Translational Regenerative Medicine Manufacturers
1.2 Why You Should Read This Report
1.3 How This Report Delivers
1.4 Main Questions Answered by This Analytical Study
1.5 Who is This Report For?
1.6 Methodology
1.7 Frequently Asked Questions (FAQ)
1.8 Associated Visiongain Reports
1.9 About Visiongain
2. Translational Regenerative Medicine Market Landscape
2.1 Introduction to Translational Regenerative Medicine
2.1.1 What is Regenerative Medicine?
2.1.2 Translational Regenerative Medicine – From Bench to Bedside
2.1.3 Translational Regenerative Medicine Segments
2.2 Stem Cell Therapy Definition and Overview
2.2.1 How Embryonic Stem Cells (ESCs) Entered the Fray
2.2.2 Classifying Stem Cells by Potency
2.2.3 Stem Cells Categories: ESCs, SSCs, iPSCs
2.2.4 Parthenogenetic Stem Cells: Ethical ESC-Like Cells?
2.2.5 Autologous vs. Allogeneic Stem Cells: Towards Universal Stem Cell Products?
2.3 Tissue Engineering Definition and Overview
2.4 Gene Therapy Definition and Overview
2.4.1 Harnessing Infectivity: Viral Vectors in Gene Therapy
2.5 Other Approaches to Regenerative Medicine
2.5.1 Small Molecules and Proteins – Scaffold-Based Delivery of Signalling Molecules
2.5.2 Cosmetic Applications of Regenerative Medicine
2.6 Regulation of Regenerative Medicine
2.6.1 Regulation of Regenerative Medicine Products in Europe
2.6.2 Regulation of Regenerative Medicine Products in the US
2.6.3 Regulation of Regenerative Medicine Products in Japan
2.6.4 Regulation of Regenerative Medicine Products in China
2.6.5 Regulation of Regenerative Medicine Products in Australia
2.6.6 Regulation of Regenerative Medicine Products in India
2.6.7 Regulation of Regenerative Medicine Products in Ireland
2.7 The Phases of Clinical Trials
2.8 Global Translational Regenerative Medicine: Market Overview & Market Revenue Forecast, 2018-2028
2.9 Market Dynamics
2.9.1 Driving and Restrictive Forces for Translational Regenerative Medicine Market, 2018
2.9.1.1 Market Driver:
2.9.1.1.1 Improvements in Regulatory Frameworks
2.9.1.1.2 Advancements in General Cellular and Tissue Research Aiding Regenerative Medicine
2.9.1.1.3 Strong Support from Governments in Multiple Regions
2.9.1.1.4 Increasing Ease of Product Commercialisation and Market Access
2.9.1.2 Market Restraints:
2.9.1.2.1 The High Price of Translational Regenerative Medicine Products May Restrain Market Growth
2.9.1.2.2 Lack of Funding from Venture Capital
2.9.1.2.3 The Intrinsic Lack of Standardisation is a Burden to Scaling up Manufacturing
2.9.1.2.4 Successful Commercialisation of TRM Products Requires New Business Models
2.9.2 Opportunity and Trends in Translational Regenerative Medicine Market, 2018
2.9.2.1 Market Opportunities:
2.9.2.1.1 3D Bioprinting and Other Technologies May Enable Rapid Scale-Up
2.9.2.1.2 Medical Tourism May Stimulate Standardisation and Drive Market Growth
2.9.2.1.3 Disruptive Translational Regenerative Medicine Therapies Can Create New Markets
2.9.2.2 Market Threats:
2.9.2.2.1 Ethical Concerns Limiting R&D in Regenerative Medicine
2.9.2.2.2 Difficulty Establishing Evidence Base for Long-Term Efficacy of TRM Therapies
2.9.2.2.3 Rate of Scientific Progress – A Major Determinant of TRM Market Growth
2.9.2.2.4 Restraints on Reimbursement May Slow Growth
2.9.3 PESTEL Analysis for Global Translational Regenerative Medicine Market, 2018
2.9.3.1 Political
2.9.3.2 Economic
2.9.3.3 Social
2.9.3.4 Technological
2.9.3.5 Legal
2.9.3.6 Enviromental
2.9.4 Porter's Five Force Analysis for Global Translational Regenerative Medicine Market, 2018
2.9.4.1 Threat of New Entrants
2.9.4.2 Threat of Substitutes
2.9.4.3 Power of Suppliers
2.9.4.4 Power of Buyers
2.9.4.5 Rivalry among Competitors
3. Global Leading Translational Regenerative Medicine Products: Overview, 2018
3.1 Stem Cell Therapy
3.1.1 Cx601 (TiGenix)
3.1.2 NiCord (Gamida Cell Ltd.)
3.1.3 Osteocel Plus (NuVasive)
3.1.3.1 Osteocel Plus: Sales Forecast 2018-2028
3.2 Tissue Engineering
3.2.1 Apligraf (Organogenesis, Inc.)
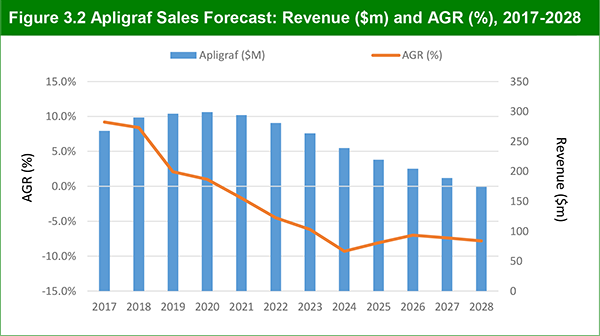
3.2.1.1 Apligraf: Sales Forecast 2018-2028
3.2.2 Grafix (Osiris Therapeutics, Inc.)
3.2.2.1 Grafix: Sales Forecast 2018-2028
3.2.3 ReCell (Avita Medical)
3.2.3.1 ReCell (Avita Medical): Sales Forecast 2018-2028
3.3 Gene Therapy
3.3.1 RT-100 (AC6 Gene Transfer) (Renova Therapeutics)
3.3.2 OXB 201 (Oxford Biomedica Plc)
3.3.3 LUXTURNA (voretigene neparvovec) (Spark Therapeutics, Inc)
4. Leading Global Translational Regenerative Medicine Manufacturers, 2018
4.1 Translational Regenerative Medicine: Leading Companies
4.2 Alphatec Spine, Inc.
4.2.1 Alphatec Spine, Inc: Financial and Performance Analysis, 2012-2017
4.2.2 Alphatec Spine’s Shifting Focus from Regenerative Medicine to Medical Devices
4.2.3 Alphatec Spine, Inc: Revenue Forecast, 2018-2028
4.3 Anterogen Co Ltd.
4.3.1 Anterogen Co Ltd: Financial and Performance Analysis, 2014-2017
4.3.2 Anterogen Co Ltd: Regenerative Medicine Product Portfolio, 2017
4.3.3 Anterogen Co Ltd: Pipeline Analysis, 2017
4.3.4 Anterogen Co Ltd: Revenue Forecast, 2018-2028
4.4 Athersys Inc
4.4.1 Athersys Inc: Financial and Performance Analysis, 2012-2017 & Revenue Forecast, 2018-2028
4.4.2 Athersys Inc: Key Developments in Regenerative Medicine Segment
4.4.3 Athersys Inc: Pipeline Analysis, 2017
4.4.3.1 MultiStem Technology – Potential Treatment for a Range of Diseases
4.5 Avita Medical Ltd
4.5.1 Avita Medical Ltd: Financial and Performance Analysis, 2013-2017 & Revenue Forecast, 2018-2028
4.5.2 Avita Medical Ltd: Regenerative Medicine Portfolio, 2017
4.5.3 Avita Medical Ltd: Key Developments in Regenerative Medicine Segment
4.5.4 Avita Medical Ltd: Pipeline Analysis, 2017
4.6 AxoGen, Inc.
4.6.1 AxoGen, Inc: Financial and Performance Analysis, 2013-2017 and Revenue Forecast, 2018-2028
4.6.2 AxoGen, Inc: Regenerative Medicine Portfolio, 2017
4.6.3 AxoGen, Inc: Pipeline Analysis, 2017
4.7 Medipost, Co Ltd.
4.7.1 Medipost Co Ltd: Financial and Performance Analysis, 2013-2017 and Revenue Forecast, 2018-2028
4.7.2 Medipost Co Ltd: Regenerative Medicine Portfolio, 2017
4.7.3 Medipost Co Ltd: Pipeline Analysis, 2017
4.8 Mesoblast Ltd
4.8.1 Mesoblast, Ltd: Financial and Performance Analysis, 2012-2017 and Revenue Forecast, 2018-2028
4.8.2 Mesoblast, Ltd Product Portfolio, 2017
4.8.3 Mesoblast, Ltd: Pipeline Analysis, 2017
4.8.3.1 NeoFuse
4.8.3.2 Chondrogen
4.8.3.3 Prochymal / TEMCELL
4.8.3.4 Other Recent Pipeline Acquisitions by Mesoblast
4.9 NuVasive, Inc
4.9.1 NuVasive, Inc: Financial and Performance Analysis, 2013-2017 and Revenue Forecast, 2018-2028
4.9.2 NuVasive, Inc Product Portfolio, 2017
4.9.3 NuVasive: Pipeline Analysis, 2017
4.10 BioTime, Inc.
4.10.1 Biotime, Inc: Financial and Performance Analysis, 2013-2017 and Revenue Forecast, 2018-2028
4.10.2 BioTime, Inc: Regenerative Medicine Product Portfolio, 2017
4.10.3 BioTime, Inc: Key Developments in Regenerative Medicine Segment
4.10.4 BioTime, Inc: Pipeline Analysis, 2018
4.11 Organogenesis
4.11.1 Organogenesis, Inc: Regenerative Medicine Portfolio, 2017
4.11.2 Organogenesis, Inc: Key Developments in Regenerative Medicine Segment
4.11.3 Organogenesis, Inc: Pipeline Analysis, 2017
4.12 Pharmicell, Co Ltd.
4.12.1 Pharmicell, Co Ltd: Financial and Performance Analysis, 2013-2017 and Revenue Forecast, 2018-2028
4.12.2 Pharmicell, Co Ltd: Pipeline Analysis, 2017
4.13 Regenerys, Ltd
4.13.1 Regenerys, Ltd: Regenerative Medicine Portfolio, 2017
4.13.2 Regenerys: Pipeline Analysis, 2017
4.14 TiGenix
4.14.1 TiGenix NV: Regenerative Medicine Product Portfolio, 2017
4.14.2 TiGenix NV: Key Developments in Regenerative Medicine Segment
4.14.3 TiGenix: Financial and Performance Analysis, 2013-2017 and Revenue Forecast, 2018-2028
4.14.4 TiGenix: Pipeline Analysis, 2017
4.15 UniQure
4.15.1 Uniqure: Regenerative Medicine Product Portfolio, 2017
4.15.2 Uniqure: Financial and Performance Analysis, 2015-2017 and Revenue Forecast, 2018-2028
4.15.3 UniQure: Recent Major Acquisition and Collaboration
4.15.4 UniQure: Pipeline Analysis, 2017
4.16 Vericel Corporation (Formerly Aastrom Biosciences, Inc.)
4.16.1 Vericel Corporation: Regenerative Medicine Portfolio, 2017
4.16.2 Vericel’s Acquisition of Sanofi’s Regenerative Medicine Business
4.16.3 Vericel Corporation: Historical Financial and Performance Analysis, 2013-2017 and Revenue Forecast, 2018-2028
4.16.4 Vericel Corporation: Pipeline Analysis, 2017
4.16.4.1 The ixCELL-DCM Clinical Trial
4.17 Anika Therapeutics, Inc.
4.17.1 Anika Therapeutics, Inc: Regenerative Medicine Product Portfolio, 2017
4.17.2 Anika Therapeutics, Inc: Key Developments in Regenerative Medicine Segment
4.17.3 Anika Therapeutics, Inc: Historical Financial & Performance Analysis, 2013-2017 and Revenue Forecast, 2018-2028
4.17.4 Anika Therapeutics, Inc: Pipeline Analysis, 2017
4.18 Orthofix International, Inc.
4.18.1 Orthofix International, Inc: Regenerative Medicine Product Portfolio, 2017
4.18.2 Orthofix International, Inc: Key Developments in Regenerative Medicine Segment
4.18.3 Orthofix International, Inc: Historical Financial & Performance Analysis, 2012-2017 and Revenue Forecast, 2018-2028
4.18.4 Orthofix International, Inc: Pipeline Analysis, 2017
4.19 Medtronic, Plc.
4.19.1 Medtronic, Plc: Product Portfolio, 2017
4.19.2 Medtronic, Plc: Key Developments in Regenerative Medicine Segment
4.19.3 Medtronic, Plc: Historical Financial & Performance Analysis, 2015-2017 and Revenue Forecast 2018-2028
4.19.4 Medtronic, Plc: Pipeline Analysis, 2017
4.20 Stryker Corporation
4.20.1 Stryker Corporation: Regenerative Medicine Product Portfolio, 2017
4.20.2 Stryker Corporation: Key Developments in Regenerative Medicine Segment
4.20.3 Stryker Corporation: Historical Financial & Performance Analysis, 2013-2017 and Revenue Forecast, 2018-2028
4.21 Acelity, Inc.
4.21.1 Acelity, Inc: Regenerative Medicine Product Portfolio, 2017
4.21.2 Acelity, Inc: Key Developments in Regenerative Medicine Segment
4.21.3 Acelity, Inc: Historical Financial & Performance Analysis, 2011-2015 and Revenue Forecast, 2018-2028
4.22 Brainstorm Cell Therapeutics, Inc.
4.22.1 Brainstorm Cell Therapeutics, Inc: Regenerative Medicine Product Portfolio, 2017
4.22.2 Brainstorm Cell Therapeutics, Inc: Key Developments in Regenerative Medicine Segment
4.22.3 Brainstorm Cell Therapeutics, Inc: Historical Financial & Performance Analysis, 2015-2017
4.22.4 Brainstorm Cell Therapeutics, Inc: Pipeline Analysis, 2017
4.23 Integra Lifesciences.
4.23.1 Integra Lifesciences: Regenerative Medicine Product Portfolio, 2017
4.23.2 Integra Lifesciences: Key Developments in Regenerative Medicine Segment
4.23.3 Integra Lifesciences: Historical Financial & Performance Analysis, 2013-2017 and Revenue Forecast, 2018-2028
4.24 Sangamo Therapeutics, Inc
4.24.1 Sangamo Therapeutics, Inc: Regenerative Medicine Product Portfolio, 2017
4.24.2 Sangamo Therapeutics, Inc: Key Developments in Regenerative Medicine Segment
4.24.3 Sangamo Therapeutics, Inc: Historical Financial & Performance Analysis, 2015-2017 and Revenue Forecast, 2018-2028
4.24.4 Sangamo Therapeutics, Inc: Pipeline Analysis, 2017
4.25 Japan Tissue Engineering, Co Ltd (J-Tec)
4.25.1 Japan Tissue Engineering, Co Ltd: Regenerative Medicine Product Portfolio, 2017
4.25.2 Japan Tissue Engineering, Co Ltd: Key Developments in Regenerative Medicine Segment
4.25.3 Japan Tissue Engineering, Co Ltd: Historical Financial & Performance Analysis, 2014-2017 and Revenue Forecast, 2018-2028
4.25.4 Japan Tissue Engineering, Co Ltd: Pipeline Analysis, 2017
4.26 Cytori Therapeutics, Inc.
4.26.1 Cytori Therapeutics, Inc: Regenerative Medicine Product Portfolio, 2017
4.26.2 Cytori Therapeutics, Inc: Key Developments In Regenerative Medicine Segment
4.26.3 Cytori Therapeutics, Inc: Historical Financial & Performance Analysis, 2015-2017 and Revenue Forecast, 2018-2028
4.26.4 Cytori Therapeutics, Inc: Pipeline Analysis, 2017
5. Conclusion
5.1 Overview of Current Market Competition and Competitor Forecast, 2018-2028
5.2 Leading Regenerative Medicine Players in 2017 and 2018
5.2.1 Acelity, Inc
5.2.2 Organogenesis Inc
5.2.3 Uniqure
5.2.4 TiGenix NV
5.2.5 Vericel Corporation
5.3 Future Outlook of Top 10 TRM competitors, 2018-2028
5.3.1 Medtronic PLC
5.3.2 Acelity
5.3.3 Integra Lifesciences
5.3.4 NuVasive, Inc
5.3.5 Orthofix International NV
5.3.6 Anika Therapeutics, Inc
5.3.7 Organogenesis
5.3.8 Uniqure
5.3.9 TiGenix NV
5.3.10 Vericel Corporation
5.3.11 R&D Pipeline Products Crucial to Future Market Growth
5.4 What Does the Future Hold for Regenerative Medicine?
Appendices
Associated Visiongain Reports
Visiongain Report Sales Order Form
About Visiongain
Visiongain report evaluation form
List of Tables
Table 2.1 European Union Definitions of Regenerative Medicine Products, 2018
Table 2.2 Potency and Source of Stem Cells, 2018
Table 2.3 Germ Layers and Their Associated Types of Cells and Organs, 2018
Table 2.4 Major Types of Stem Cells and Their Properties, 2018
Table 2.5 Terminology for Stem Cell Donor-Types, 2018
Table 2.6 Clinical Trial Phases, 2018
Table 2.7 The Global Translational Regenerative Medicine Market: Market Forecast ($m, AGR% and CAGR%) by Sector, 2017-2022
Table 2.8 The Global Translational Regenerative Medicine Market: Market Forecast ($m, AGR% and CAGR%) by Sector, 2023-2028
Table 2.9 SWOT Analysis of the Global Translational Regenerative Medicine Market, 2018-2028
Table 3.1 Osteocel Plus Sales Forecast: Revenue ($m), AGR (%) and CAGR (%), 2017-2022
Table 3.2 Osteocel Plus Sales Forecast: Revenue ($m), AGR (%) and CAGR (%), 2023-2028
Table 3.3 Apligraf Sales Forecast: Revenue ($m), AGR (%) and CAGR (%), 2017-2022
Table 3.4 Apligraf Sales Forecast: Revenue ($m), AGR (%) and CAGR (%), 2023-2028
Table 3.5 Grafix/Stravix Sales Forecast: Revenue ($m), AGR (%) and CAGR (%), 2017-2022
Table 3.6 Grafix/Stravix Sales Forecast: Revenue ($m), AGR (%) and CAGR (%), 2023-2028
Table 3.7 ReCell Sales Forecast: Revenue ($m), AGR (%) and CAGR (%), 2017-2022
Table 3.8 ReCell Sales Forecast: Revenue ($m), AGR (%) and CAGR (%), 2023-2028
Table 4.1 Alphatec Spine Details, 2018
Table 4.2 Alphatec Spine, Inc: Historical Sales ($m) and Operating Profit / Loss ($m), 2012-2017
Table 4.3 Alphatec Spine: Regenerative Medicine Clinical Trials, 2017
Table 4.4 Forecast Alphatec Spine: Revenue ($m), Annual Growth (%), CAGR (%), 2017-2028
Table 4.5 Anterogen Co Ltd Details, 2018
Table 4.6 Anterogen Co Ltd: Historical Sales ($m) and Operating Profit / Loss ($m), 2014-2017
Table 4.7 Anterogen: Regenerative Medicine Clinical Trials, 2017
Table 4.8 Forecast Anterogen: Revenue ($m), Annual Growth (%), CAGR (%), 2017-2028
Table 4.9 Athersys Inc, Details, 2018
Table 4.10 Athersys Inc: Historical Sales ($m) 2012-2017
Table 4.11 Athersys Inc: Historical Expenditure and Losses ($m) 2012-2017
Table 4.12 Forecast Athersys Inc: Revenue ($m), Annual Growth (%), CAGR (%), 2017-2028
Table 4.13 Athersys Inc: Regenerative Medicine Clinical Trials, 2018
Table 4.14 Avita Medical Ltd Details, 2018
Table 4.15 Avita Medical Ltd: Historical Sales ($m, AUD m) and Net Loss ($m, AUD m), 2013-2017
Table 4.16 Forecast Avita Medical Ltd: Revenue ($m), Annual Growth (%), CAGR (%), 2017-2028
Table 4.17 Avita Medical: Regenerative Medicine Clinical Trials, 2017
Table 4.18 AxoGen Inc. Details, 2018
Table 4.19 AxoGen, Inc: Historical Sales ($m) and Net Loss ($m), 2013-2017
Table 4.20 Forecast AxoGen, Inc: Revenue ($m), Annual Growth (%), CAGR (%), 2017-2028
Table 4.21 AxoGen, Inc: Regenerative Medicine Clinical Trials, 2017
Table 4.22 Medipost Co Ltd Details, 2018
Table 4.23 Medipost: Historical Sales ($m, mil.KRW), Net Income ($m, mil.KRW) and Revenue Growth (%) 2013-2017
Table 4.24 Medipost: Historical Sales (mil.KRW), Net Income ($m, mil.KRW) and Revenue Growth (%) 2013-2017
Table 4.25 Forecast Medipost: Revenue ($m), Annual Growth (%), CAGR (%), 2017-2028
Table 4.26 Medipost: Regenerative Medicine Clinical Trials, 2017
Table 4.27 Mesoblast Ltd Details, 2018
Table 4.28 Mesoblast: Historical Sales ($m, AUD m), 2012-2017
Table 4.29 Forecast Mesoblast: Revenue ($m), Annual Growth (%), CAGR (%), 2017-2028
Table 4.30 Mesoblast: Regenerative Medicine Clinical Trials, 2017
Table 4.31 Nuvasive, Inc Details, 2018
Table 4.32 NuVasive, Inc: Historical Sales ($m) and Net Income (Profits and Losses) ($m), 2013-2017
Table 4.33 Forecast NuVasive, Inc: Revenue ($m), Annual Growth (%), CAGR (%), 2017-2028
Table 4.34 NuVasive: Regenerative Medicine Clinical Trials, 2017
Table 4.35 BioTime, Inc Details, 2018
Table 4.36 BioTime Inc: Historical Sales ($m) and Gross Income ($m), 2013-2017
Table 4.37 Forecast BioTime Inc: Revenue ($m), Annual Growth (%), CAGR (%), 2017-2028
Table 4.38 Biotime, Inc: Regenerative Medicine Clinical Trials, 2018
Table 4.39 Organogenesis Inc, Details, 2018
Table 4.40 Organogenesis: Regenerative Medicine Clinical Trials, 2018
Table 4.41 Pharmicell, Co Ltd, Details, 2018
Table 4.42 Pharmicell: Historical Sales ($m, mil.KRW) and Net Income ($m, mil.KRW), 2013-2016
Table 4.43 Forecast Pharmicell: Revenue ($m), Annual Growth (%), CAGR (%), 2017-2028
Table 4.44 Pharmicell Regenerative Medicine Trails, 2017
Table 4.45 Regenerys, Ltd Details, 2018
Table 4.46 Regenerys: Regenerative Medicine Clinical Trials, 2017
Table 4.47 TiGenix NV, Details, 2018
Table 4.48 TiGenix: Historical Sales (€m, $m) and Net Income (€m, $m), 2013-2017
Table 4.49 Forecast TiGenix: Revenue ($m), Annual Growth (%), CAGR (%), 2017-2028
Table 4.50 TiGenix: Regenerative Medicine Clinical Trials, 2017
Table 4.51 Uniqure Details, 2018
Table 4.52 Uniqure: Historical Sales ($m) and Operating Profit / Loss ($m), 2015-2017
Table 3.53 Forecast Uniqure: Revenue ($m), Annual Growth (%), CAGR (%), 2017-2028
Table 4.54 UniQure: Regenerative Medicine Clinical Trials, 2018
Table 4.55 Vericel Corporation, Details, 2018
Table 4.56 Vericel: Sales by Product ($m) and Revenue Share (%), 2016-2017
Table 4.57 Vericel: Historical Sales ($m and AGR%), 2013-2017
Table 3.58 Forecast Vericel: Revenue ($m), Annual Growth (%), CAGR (%), 2017-2028
Table 4.59 Vericel Corporation: Regenerative Medicine Clinical Trials, 2017
Table 4.60 Anika Therapeutics, Inc; Details, 2018
Table 4.61 Anika Therapeutics, Inc: Financial & Performance Analysis, 2013-2017
Table 4.62 Anika Therapeutics, Inc: Product Revenue Analysis, ($ Million) 2016-2017
Table 4.63 Forecast Anika Therapeutics, Inc: Revenue ($m), Annual Growth (%), CAGR (%), 2017-2028
Table 4.64 Orthofix International, Inc; Details, 2018
Table 4.65 Orthofix International, Inc: Financial & Performance Analysis, 2012-2017
Table 4.66 Orthofix International, Inc: Business Units Revenue Analysis, 2014- 2016
Table 4.67 Orthofix International, Inc: Business Units Revenue Analysis, 2016
Table 4.68 Forecast Orthofix International, Inc: Revenue ($m), Annual Growth (%), CAGR (%), 2017-2028
Table 4.69 Orthofix International, Inc: Regenerative Medicine Clinical Trials, 2017
Table 4.70 Medtronic, Plc; Details, 2017
Table 4.71 Medtronic, Plc: Financial & Performance Analysis, 2012-2017
Table 4.72 Medtronic, Plc: Divisional Revenue Analysis, 2014-2017
Table 4.73 Forecast Medtronic, Plc: Revenue ($m), Annual Growth (%), CAGR (%), 2017-2028
Table 4.74 Stryker Corporation; Details, 2018
Table 4.75 Stryker Corporation: Financial & Performance Analysis, 2013-2017
Table 4.76 Forecast Stryker Corporation: Revenue ($m), Annual Growth (%), CAGR (%), 2017-2028
Table 4.77 Acelity, Inc; Details, 2018
Table 4.78 Acelity, Inc: Financial & Performance Analysis, 2011-2015
Table 4.79 Forecast Acelity, Inc: Revenue ($m), Annual Growth (%), CAGR (%), 2017-2028
Table 4.80 Brainstorm Cell Therapeutics, Inc; Details, 2018
Table 4.81 Brainstorm Cell Therapeutics, Inc: Financial & Performance Analysis, 2015-2017
Table 4.82 Brainstorm Cell Therapeutics, Inc: Pipeline Development of NurOwn product for different diseases
Table 4.83 Integra Lifesciences; Details, 2018
Table 4.84 Integra Lifesciences: Financial & Performance Analysis, 2013-2017
Table 4.85 Integra Lifesciences: Business Segment Revenue Analysis, 2015-2017
Table 4.86 Forecast Integra Lifesciences: Revenue ($m), Annual Growth (%), CAGR (%), 2017-2028
Table 4.87 Integra Lifesciences: Regenerative Medicine Clinical Trials, 2017
Table 4.88 Sangamo Therapeutics, Inc; Details, 2018
Table 4.89 Sangamo Therapeutics, Inc: Financial & Performance Analysis, 2013-2017
Table 4.90 Forecast Sangamo Therapeutics, Inc: Revenue ($m), Annual Growth (%), CAGR (%), 2017-2028
Table 4.91 Sangamo Therapeutics: Regenerative Medicine Clinical Trials, 2017
Table 4.92 Japan Tissue Engineering, Co Ltd; Details, 2018
Table 4.93 Japan Tissue Engineering, Co Ltd: Financial & Performance Analysis, 2014-2018
Table 4.94 Forecast Japan Tissue Engineering, Co Ltd: Revenue ($m), Annual Growth (%), CAGR (%), 2017-2028
Table 4.95 Cytori Therapeutics, Inc; Details, 2018
Table 4.96 Cytori Therapeutics, Inc: Financial & Performance Analysis, 2012-2017
Table 4.97 Forecast Cytori Therapeutics, Inc: Revenue ($m), Annual Growth (%), CAGR (%), 2017-2028
Table 5.1 Top Five TRM Manufacturers: Grouped Revenue ($m), Annual Growth Rate (%), CAGR (%), 2012-2017
Table 5.2 TRM Manufacturers by Absolute Change in Revenue ($m): Annual Revenue ($m), Absolute Change in Revenue ($m), 2012-2017
Table 5.3 Top 5 TRM Manufacturers ($m): Grouped Revenue ($m), Annual Growth Rate (%), CAGR (%), 2016-2027
Table 5.4 Top TRM Manufacturers by Absolute Change in Revenue: Annual Revenue ($m), Absolute Change in Revenue ($m), 2017-2022
Table 5.5 Top TRM Manufacturers by Absolute Change in Revenue: Annual Revenue ($m), Absolute Change in Revenue ($m), 2023-2028
Table 5.6 Global Translational Regenerative Medicine Market: Products in Late Stage Development, 2018
List of Figures
Figure 2.1 European Union Definitions of Regenerative Medicine Products, 2018
Figure 2.2 Examples of FDA-Approved Tissue Engineering Products
Figure 2.3 Brief History of Gene Therapy, 1970-2018
Figure 2.4 The Global Translational Regenerative Medicine Market Forecast: Revenue ($m) and AGR (%), 2017-2028
Figure 2.5 Porter’s Five Force Analysis of the Translational Regenerative Medicine Market, 2018
Figure 3.1 Osteocel Plus Sales Forecast: Revenue ($m) and AGR (%), 2017-2028
Figure 3.2 Apligraf Sales Forecast: Revenue ($m) and AGR (%), 2017-2028
Figure 3.3 Grafix/Stravix Sales Forecast: Revenue ($m) and AGR (%), 2017-2028
Figure 3.4 ReCell Sales Forecast: Revenue ($m) and AGR (%), 2017-2028
Figure 4.1 Alphatec Spine, Inc: Historical Sales ($m) and Operating Loss ($m), 2012-2017
Figure 4.2 Forecast Alphatec Spine: Revenue ($m), 2017-2028
Figure 4.3 Anterogen Co Ltd: Historical Sales ($ Thousand) and Operating Loss ($ Thousand), 2014-2017
Figure 4.4 Forecast Anterogen: Revenue ($m), 2017-2028
Figure 4.5 Athersys Inc: Historical Sales ($m) 2012-2017
Figure 4.6 Athersys Inc: Historical Revenue, Expenditure and Losses ($m) 2012-2017
Figure 4.7 Forecast Athersys Inc: Revenue ($m), 2017-2028
Figure 4.8 Avita Medical Ltd: Historical Sales ($m, AUD m) and Net Loss ($m), 2013-2017
Figure 4.9 Forecast Avita Medical Ltd: Revenue ($m), 2017-2028
Figure 4.10 AxoGen, Inc: Historical Sales ($m) and Net Loss ($m), 2013-2017
Figure 4.11 Forecast AxoGen, Inc: Revenue ($m), 2017-2028
Figure 4.12 Medipost Co Ltd: Historical Sales ($m, mil.KRW) and Net Income ($m, mil.KRW), 2013-2017
Figure 4.13 Medipost: Revenue Share by Business Area (%), 2014
Figure 4.14 Medipost: Revenue Share by Business Area (%), 2015
Figure 4.15 Medipost: Revenue Share by Business Area (%), 2016
Figure 4.16 Medipost: Revenue Share by Business Area (%), 2017
Figure 4.17 Forecast AxoGen, Inc: Revenue ($m), 2017-2028
Figure 4.18 Mesoblast: Historical Sales (AUD m), 2013-2017
Figure 4.19 Forecast Mesoblast: Revenue ($m), 2017-2028
Figure 4.20 NuVasive, Inc: Historical Sales and Net Income (Profits and Losses) ($m), 2013-2017
Figure 4.21 Forecast NuVasive, Inc: Revenue ($m), 2017-2028
Figure 4.22 BioTime Inc: Historical Sales ($m) and Gross Income ($m), 2013-2017
Figure 4.23 Forecast BioTime Inc: Revenue ($m), 2017-2028
Figure 4.24 Pharmicell: Historical Sales (mil.KRW) and Net Income (mil.KRW), 2013-2017
Figure 4.25 Forecast Pharmicell: Revenue ($m), 2017-2028
Figure 4.26 TiGenix: Historical Sales ($m) and Net Income ($m), 2013-2017
Figure 4.27 Forecast TiGenix: Revenue ($m), 2017-2028
Figure 4.28 Uniqure: Sales ($m) and Operating Loss (In Thousands), 2015-2017
Figure 4.29 Forecast AxoGen, Inc: Revenue ($m), 2017-2028
Figure 4.30 Vericel: Revenue Contribution by Product (%) 2017
Figure 4.31 Vericel: Historical Sales ($m), 2013-2017
Figure 4.32 Forecast Vericel: Revenue ($m), 2017-2028
Figure 4.33 Anika Therapeutics, Inc: Financial & Performance Analysis, 2013-2017
Figure 4.34 Forecast Anika Therapeutics, Inc: Revenue ($m), 2017-2028
Figure 4.35 Orthofix International, Inc: Financial & Performance Analysis, 2012-2017
Figure 4.36 Orthofix International, Inc: Business Units Revenue Analysis, 2016
Figure 4.37 Forecast Orthofix International, Inc: Revenue ($m), 2017-2028
Figure 4.38 Medtronic Plc: Business Segment Revenue Analysis, 2017
Figure 4.39 Medtronic, Plc: Financial & Performance Analysis, 2012-2017
Figure 4.40 Medtronic, Plc: Divisional Revenue Analysis, 2014-2017
Figure 4.41 Forecast Medtronic, Plc: Revenue ($m), 2017-2028
Figure 4.42 Stryker Corporation: Financial & Performance Analysis, 2012-2017
Figure 4.43 Stryker Corporation: Business Segment Revenue Analysis, 2017
Figure 4.44 Forecast Stryker Corporation: Revenue ($m), 2017-2028
Figure 4.45 Acelity, Inc: Financial & Performance Analysis, 2011-2015
Figure 4.46 Forecast Acelity, Inc: Revenue ($m), 2017-2028
Figure 4.47 Brainstorm Cell Therapeutics, Inc: Financial & Performance Analysis, 2012-2017
Figure 4.48 Integra Lifesciences: Financial & Performance Analysis, 2013-2017
Figure 4.49 Integra Lifesciences: Business Segment Revenue Analysis, 2017
Figure 4.50 Forecast Integra Lifesciences: Revenue ($m), 2017-2028
Figure 4.51 Sangamo Therapeutics, Inc: Financial & Performance Analysis, 2013-2017
Figure 4.52 Forecast AxoGen, Inc: Revenue ($m), 2017-2028
Figure 4.53 Japan Tissue Engineering, Co Ltd: Financial & Performance Analysis, 2014-2018
Figure 4.54 Forecast Japan Tissue Engineering, Co Ltd: Revenue ($m), 2017-2028
Figure 4.55 Cytori Therapeutics, Inc: Financial & Performance Analysis, 2012-2017
Figure 4.56 Forecast Cytori Therapeutics, Inc: Revenue ($m), 2017-2028
Figure 5.1 Top Five TRM Manufacturers: Grouped Revenue ($m), 2012-2017
Figure 5.2 TRM Manufacturers by Absolute Change in Revenue ($m): Absolute Change in Revenue ($m), 2012-2017
Figure 5.3 Top 5 TRM Manufacturers: Grouped Revenue ($m), 2017-2028
Figure 5.4 Top TRM Manufacturers by Absolute Change in Revenue: Absolute Change in Revenue ($m), 2017-2022
Figure 5.5 Top TRM Manufacturers by Absolute Change in Revenue: Absolute Change in Revenue ($m), 2023-2028