Industries > Pharma > Top 30 Pharmaceutical Wholesale & Distribution Organizations 2019
Top 30 Pharmaceutical Wholesale & Distribution Organizations 2019
Branded Drugs, Generic Drugs, Leading Companies
The pharmaceutical wholesale and distribution market is vital, providing access to life saving drugs to vast number of people in a timely manner. The market is large, with many opportunities for growth and development during the forecast period.
The establishment of the pharmaceutical wholesale market was driven by manufacturers wanting to outsource distribution to wholesalers to focus on core competencies of R&D and marketing. At the same time, hospitals outsourced inventory management in an effort to reduce investment in this area. These factors created a high demand for a comprehensive wholesale and distribution service.
How this report will benefit you
Read on to discover how you can exploit the future business opportunities emerging in this sector.
In this brand new 253-page report you will receive 157 charts– all unavailable elsewhere.
The 253-page report provides clear detailed insight into the leading pharmaceutical wholesale & distribution organizations. Discover the key drivers and challenges affecting the market.
By ordering and reading our brand-new report today you stay better informed and ready to act.
Report Scope
• Global Pharmaceutical Wholesale & Distribution Market Size Forecast from 2019-2029
• Global Pharmaceutical Wholesale & Distribution Market Size Forecast from 2019-2029 segmented by submarket:
• Branded Drugs
• Generic Drugs
• Others
• A SWOT and STEP analysis of the global pharmaceutical wholesale & distribution market
• Profiles of the 30 leading pharmaceutical wholesale & distribution organizations:
• Alfresa Holdings
• AmerisourceBergen
• Anda Inc.
• Auburn Pharmaceutical Company
• Capital Wholesale Drug Company
• Cardinal Health
• CR Pharmaceutical
• CuraScript Special
• Dakota Drug, Inc.
• Fff Enterprises Inc.
• Fortissa Limited
• HyGen Pharmaceuticals Inc.
• Kingworld Medicines Group Ltd.
• Mawdsley-Brooks & Co. Ltd.
• McKesson
• MEDIPAL HOLDINGS
• Morris & Dickson Co. LLC
• North Carolina Mutual Wholesale Drug
• Ohki Health Care Holdings, Inc.
• Prodigy Health
• Profarma Distribuidora de Produtos Farmaceuticos SA
• Realcan Pharmaceutical Group Co., Ltd
• Rochester Drug Cooperative
• Shanghai Pharmaceutical Holdings.
• SINOPHARM
• Smith Drug Company
• SUZUKEN
• The PHOENIX Group
• Walgreens Boots Alliance
• Zhejiang Intl Group Co., Ltd.
• The content of each profile differs, depending on the organization. In general, a profile gives the following information:
• Overview of the company’s services and operations
• Analysis of recent financial performance – annual revenue for services, including data on operating profit and margins
• Revenue forecast from 2019 to 2029
• Assessment of developments – activities, acquisitions, production capacity, deals, new service offerings and collaborations
• Sales Force Structure
• Key Questions Answered by this Report:
• How is the pharmaceutical wholesale and distribution drug market evolving?
• What is driving and restraining the pharmaceutical wholesale and distribution industry?
• What are the market shares of main segments of the world pharmaceutical wholesale and distribution market?
• How will each submarket grow over the forecast period and how much revenue will these segments account for in 2029?
• How will the market shares for pharmaceutical wholesale and distribution submarkets develop from 2018 to 2029?
• What will be the main sales drivers for the overall market and components from 2018-2029?
• How will political and regulatory events influence regional markets and submarkets?
• How will the market shares of top national markets change from 2018 and which geographical region will lead the market in 2029?
• Who are the leading companies and what are their revenue prospects over the forecast period to 2029?
• What are the trends for M&A activity, consolidation for existing players and the prospects for new market entrants?
• How will that industry evolve between 2018 and 2029? Where does it head and what forces change it?
Visiongain’s study is intended for anyone requiring commercial analyses for pharmaceutical wholesale & distribution market. You find data, trends and predictions.
Buy our report today Top 30 Pharmaceutical Wholesale & Distribution Organizations 2019: Branded Drugs, Generic Drugs, Leading Companies.
Visiongain is a trading partner with the US Federal Government
CCR Ref number: KD4R6
Do you have any custom requirements we can help you with? Any need for specific country, geo region, market segment or specific company information? Contact us today, we can discuss your needs and see how we can help: sara.peerun@visiongain.com
1. Report Overview
1.1 Global Pharma Wholesale and Distribution Industry and Market Overview
1.2 How This Report Delivers
1.3 Questions Answered by This Analytical Report
1.4 Who is This Report For?
1.5 Methodology
1.6 Frequently Asked Questions (FAQ)
1.7 Associated Visiongain Reports
1.8 About Visiongain
2. Introduction to Pharma Wholesale and Distribution
2.1 The Role of Pharmaceutical Wholesalers: The Middlemen of the Pharmaceutical Industry
2.1.1 Full-Line Wholesalers (FLWs)
2.1.2 Short-Line Wholesalers (SLWs)
2.2 The Chain of Distribution: Wholesalers vs. Logistic Service Providers
2.2.1 Secondary Wholesalers
2.2.2 Direct-to-Pharmacy (DTP) Distribution is Becoming More Prevalent
2.2.3 Major Wholesalers: Distribution of a Large Number of Products to Generate High Profits
2.2.4 Distribution from Large to Small Wholesalers: A Lengthy Distribution Chain
2.2.5 Pharmacy Benefit Managers
2.3 Generative Revenue and Profit
2.3.1 Forward Buying to Avoid Price Increases
2.3.2 Fee-for-Service: A Clear Pricing Structure
2.3.2.1 Inventory Management Agreements
2.3.3 Discounts: Incentives for Prompt Payment or Bulk Purchases
2.3.4 Reimbursement and Wholesalers
2.3.5 Clawback: The Recovery of Reimbursement Costs by Governments
2.3.6 Parallel Trade: Different Attitudes in Europe and the US
3. The World Pharmaceutical Wholesale and Distribution Market: 2019-2029
3.1 The World Pharmaceutical Wholesale and Distribution Market in 2018, Restricted by Government Price Reductions and Generic Substitution
3.2 The Pharmaceutical Wholesale and Distribution Industry: World Market Forecast, 2019-2029
3.3 Branded and Generic Drugs: Revenue vs. Profit, 2019-2029
3.3.1 Branded and Generic Drugs: Revenue Generation, 2018
3.3.2 Branded Drugs: Revenue Forecast, 2019-2029
3.3.3 Generic Drugs: Revenue Forecast, 2019-2029
4. Leading Pharma Wholesalers and Distributors In 2018: Current and Future Performance
4.1 McKesson: The Oldest and Largest Healthcare Services Company in the US
4.1.1 McKesson: General Information
4.1.1.1 McKesson, Pharmaceutical Product Category
4.1.1.2 McKesson, Management Member Names
4.1.1.3 McKesson, Sales Structure
4.1.2 McKesson: Historical Performance, 2008-2018
4.1.3 Future Strategies: Consummate Acquisitions to Complement Existing Business or Expand Businesses
4.1.4 McKesson: Revenue Forecast, 2019-2029
4.1.5 McKesson: Strategic Moves & Developments, 2018-2019
4.2 Cardinal Health: The World’s Third Largest Pharma Wholesaler
4.2.1 Cardinal Health: General Information
4.2.1.1 Cardinal Health, Pharmaceutical Product Category
4.2.1.2 Cardinal Health, Sales Structure
4.2.1.3 Cardinal Health, Management Member Names
4.2.2 Cardinal Health: Historical Performance, 2008-2018
4.2.3 Will CVS Joint Venture and Acquisitions Stimulate Future Growth?
4.2.4 Cardinal Health: Revenue Forecast, 2019-2029
4.2.5 Cardinal Health: Strategic Moves & Developments, 2018-2019
4.3 AmerisourceBergen: Third Largest Global Pharma Wholesaler and Distributor
4.3.1 AmerisourceBergen: General Information
4.3.1.1 AmerisourceBergen, Pharmaceutical Product Category
4.3.1.2 AmerisourceBergen: Sales Structure
4.3.1.3 AmerisourceBergen, Management Member Names
4.3.2 AmerisourceBergen: Historical Performance, 2008-2018
4.3.3 Will Contracts with Walgreens and Alliance Boots Drive Future Growth?
4.3.4 AmerisourceBergen: Revenue Forecast, 2019-2029
4.3.5 AmerisourceBergen: Strategic Moves & Developments, 2017-2019
4.4 Walgreens Boots Alliance: The Largest Drugstore Chain in the US and Global Wholesale and Distribution Network
4.4.1 Walgreens Boots Alliance: General Information
4.4.1.1 Walgreens Boots Alliance, Pharmaceutical Product Category and Brands
4.4.1.2 Walgreens Boots Alliance (WBA), Sales Structure
4.4.1.3 Walgreens Boots Alliance, Management Member Names
4.4.2 Walgreens Boots Alliance: Historical Performance, 2011-2018
4.4.3 Acquisitions and Future Strategies of Walgreens Boots Alliance
4.4.4 Walgreens Boots Alliance: Revenue Forecast, 2019-2029
4.4.5 Walgreens Boots Alliance: Strategic Moves & Developments, 2018-2019
4.5 MEDIPAL HOLDINGS CORPORATION: Japan’s Leading Pharmaceutical Wholesaler
4.5.1 MEDIPAL Holdings: General Information
4.5.1.1 MEDIPAL Holdings, Pharmaceutical Product Category
4.5.1.2 MEDIPAL Holdings, Sales Structure
4.5.1.3 MEDIPAL Holdings, Management Member Names
4.5.2 MEDIPAL HOLDINGS CORPORATION: Historical Performance, 2008-2018
4.5.3 Future Strategies of MEDIPAL HOLDINGS CORPORATION: Revised Business Portfolio with Diverse Sources of Earnings
4.5.4 MEDIPAL HOLDINGS CORPORATION: Revenue Forecast, 2019-2029
4.6 Phoenix Group: Biggest European Wholesalers
4.6.1 Phoenix Group: General Information
4.6.1.1 Phoenix Group, Pharmaceutical Product Category
4.6.1.2 Phoenix Group, Sales Structure
4.6.1.3 Phoenix Group, Management Member Names
4.6.2 The PHOENIX Group: Historical Performance, 2011-2018
4.6.3 Future Strategies of the PHOENIX Group: Selective Acquisition
4.6.4 The PHOENIX Group: Revenue Forecast, 2019-2029
4.7 SINOPHARM: The Leading Pharmaceutical Wholesaler and Distributor in China
4.7.1 SINOPHARM: General Information
4.7.1.1 SINOPHARM, Pharmaceutical Product and Business Category
4.7.1.2 SINOPHARM, Sales Structure
4.7.1.3 SINOPHARM, Management Member Names
4.7.2 SINOPHARM: Historical Performance, 2011-2018
4.7.3 Future Strategies of SINOPHARM: Provide Comprehensive Services and Wider Business Coverage
4.7.4 SINOPHARM: Revenue Forecast, 2019-2029
4.8 Alfresa Holdings: Second Largest Pharmaceutical Wholesaler and Distributor in Japan
4.8.1 Alfresa Holdings: General Information
4.8.1.1 Alfresa Holdings, Pharmaceutical Product and Business Category
4.8.1.2 Alfresa Holdings, Sales Structure
4.8.1.3 Alfresa Holdings, Management Member Names
4.8.2 Alfresa Holdings: Historical Performance, 2011-2018
4.8.3 Future Strategy of Alfresa Holdings: To Focus on Expanding Business Fields and Increasing Footprint
4.8.4 Alfresa Holdings: Revenue Forecast, 2019-2029
4.9 SUZUKEN CO., LTD: The First Nationwide Wholesaler of Japan
4.9.1 SUZUKEN CO., LTD: General Information
4.9.1.1 SUZUKEN CO., LTD, Pharmaceutical Product and Business Category
4.9.1.2 SUZUKEN CO., LTD, Sales Structure
4.9.1.3 SUZUKEN CO., LTD, Management Member Names
4.9.2 SUZUKEN CO. LTD: Historical Performance, 2011-2018
4.9.3 Future Strategies of SUZUKEN CO., LTD: Five Growth Initiatives and Special Focus on Diabetes Field
4.9.4 SUZUKEN CO., LTD: Revenue Forecast, 2019-2029
4.9.5 SUZUKEN: Strategic Moves & Developments, 2018-2019
4.10 Shanghai Pharmaceuticals Holding: China’s Second Largest Wholesaler
4.10.1 Shanghai Pharmaceuticals Holding: General Information
4.10.1.1 Shanghai Pharmaceuticals Holding, Pharmaceutical Product and Business Category
4.10.1.2 Shanghai Pharmaceuticals Holding; Sales Structure
4.10.1.3 Shanghai Pharmaceuticals Holding Management Member Names
4.10.2 Shanghai Pharmaceuticals Holding: Historical Performance, 2011-2018
4.10.3 Future Strategies of Shanghai Pharma: Expansion of Three Leading Regions in China
4.10.4 Shanghai Pharma: Revenue Forecast, 2019-2029
4.11 Morris & Dickson Co. LLC: Serving More than 175 Years
4.12 Smith Drug Company: Serving More than 1400 Customers in U.S.
4.13 Anda Inc.
4.13.1 Segment Overview
4.13.2 Anda Inc. Strategies:
4.14 CuraScript Specialty Distribution
4.14.1 Curascript Speciality Distribution Strategies:
4.15 Mawdsley-Brooks & Co. Ltd.
4.15.1 Mawdsley-Brooks & Co Company History:
4.15.2 Mawdsley-Brooks & Co Company Strategies:
4.16 North Carolina Mutual Wholesale Drug: 65 years of service
4.16.1 Mutual Wholesale Drug Company History:
4.16.2 Company Strategies
4.17 Prodigy Health
4.18 Fortissa Limited: 20 years of vast experience
4.19 CR Pharmaceutical
4.19.1 Company History
4.19.2 Company Strategies
4.20 Hygen Pharmaceuticals Inc.
4.20.1 Hygen Pharmaceuticals Inc.; Key Strategies and achievements:
4.21 Fff Enterprises Inc.
4.21.1 Company Strengths:
4.21.2 Fff Enterprises Inc.Strategies, Development and Achievements:
4.22 Rochester Drug Cooperative
4.23 Auburn Pharmaceutical Company
4.23.1 Generic Product with Launch Dates
4.24 Capital Wholesale Drug Company
4.25 Realcan Pharmaceutical Group Co., Ltd.
4.26 Profarma Distribuidora de Produtos Farmaceuticos SA
4.27 Dakota Drug, Inc.
4.28 Zhejiang Intl Group Co., Ltd.
4.29 Ohki Health Care Holdings, Inc.
4.30 Kingworld Medicines Group Ltd.
5. Qualitative Analysis of The Pharma Wholesale and Distribution Market
5.1 The Strengths and Weaknesses of the Pharma Wholesale and Distribution Market, 2018
5.1.1 The Insatiable Demand for Drugs: A Recession Proof Industry?
5.1.2 Wholesalers Do More than Deliver Drugs
5.1.2.1 Pre-Wholesaling: More Prevalent in Europe
5.1.2.2 Through Pre-Financing, Full-Line Wholesalers Finance the Entire Medicines Market
5.1.3 Large Companies Dominate the Market
5.1.4 Despite High Revenues, Profit Margins Are Low
5.1.5 Government-Induced Drug Price Pressures Restrict Profits
5.1.6 The Problem of Counterfeit Drugs
5.2 The Opportunities and Threats of the Pharma Wholesale and Distribution Market, 2019-2029
5.2.1 The Demand for Pharmaceuticals is Increasing
5.2.2 The Increasing Use of Specialty Drugs Will Drive Growth
5.2.3 The Increasing Use of Generic Drugs Will Limit Revenue, But Drive Profit Generation
5.2.4 The Promotion of Drug Therapy in the US
5.2.5 Globalisation: The Major National Markets are Dominated by Few Companies
5.2.6 Increased Adoption of the DTP Distribution Model
5.2.6.1 DTP in Europe: The First Place the Scheme Has Taken Hold
5.2.6.2 DTP in the UK Since 1991
5.2.6.3 DTP in Poland: The Second European Country To Adopt the DTP Model
5.2.6.4 Further Expansion of the DTP Model
5.2.7 The Threat of Healthcare Budget Cuts
5.2.7.1 Healthcare Budget Cuts in Germany
5.2.7.2 Healthcare Budget Cuts in France
5.2.7.3 Healthcare Budget Cuts in Italy
5.2.7.4 Healthcare Budget Cuts in Spain
5.2.7.5 Healthcare Budget Cuts in the UK
5.2.8 Do Large Pharmacy Chains Pose a Threat?
5.2.8.1 Case Study: Walmart and the $4 Prescription Scheme
5.2.8.2 Vertical Integration of Wholesalers: A Response to the Threat of Pharmacy Chains
5.2.9 Does the Diversion and Re-Importation of Medicines Pose a Threat to the Industry?
5.2.10 The Threat of Industry Consolidation
5.3 Social, Technological, Economic and Political Factors Influencing the Market, 2018-2029 (STEP Analysis)
5.3.1 Political Factor: The Impact of Recent Regulatory Changes in the EU
5.3.2 Political Factor: Combating Counterfeit Medicines
5.3.2.1 The US and E-Pedigree: Becoming Law in California
5.3.2.2 European Pedigree Legislation
5.3.2.3 Anti-Counterfeiting Strategies in Other Markets: The Chinese Government is Attempting to Address the Challenge
5.3.2.4 Serialisation for Wholesalers: Opportunity or a Challenge?
6. Conclusions
6.1 The Future of the Pharma Wholesale and Distribution Market
6.2 The Leading National Pharma Wholesale and Distribution Markets
6.3 The Leading Companies in the Pharma Wholesale and Distribution Industry
6.4 Trends in the Pharma Wholesale and Distribution Industry
6.4.1 Generics Will Threaten Revenue
6.4.2 Manufacturers Will Deliver More Drugs Directly
6.4.3 There Will Be Greater Demand for Specialty Medicines
6.4.4 Consolidation Will Drive Growth
6.4.5 Anti-Counterfeiting Demands Will Add to Wholesalers’ Costs
Appendices
Associated Visiongain Reports
Visiongain Report Sales Order Form
About Visiongain
Visiongain Report Evaluation Form
List of Tables
TABLE 2.1 USE OF DTP MODEL IN THE UK, 2007-2012
TABLE 3.1 PHARMACEUTICAL WHOLESALE AND DISTRIBUTION: WORLD MARKET FORECAST ($BN), AGR (%), CAGR (%), 2019-2029
TABLE 3.2 PHARMACEUTICAL WHOLESALE AND DISTRIBUTION BY SEGMENT: REVENUE ($BN) FORECASTS, AGR (%), CAGR (%) AND MARKET SHARES (%), 2019-2029
TABLE 3.3 WHOLESALE AND DISTRIBUTION OF BRANDED DRUGS: REVENUE ($BN) FORECASTS, AGR (%), CAGR (%), 2019-2029
TABLE 3.4 WHOLESALE AND DISTRIBUTION OF GENERIC DRUGS: REVENUE ($BN) FORECASTS, AGR (%), CAGR (%), 2019-2029
TABLE 4.1 MCKESSON, DISTRIBUTION SOLUTIONS: SERVICES AND CUSTOMERS, 2018
TABLE 4.2 MCKESSON, TECHNOLOGY SOLUTIONS: SERVICES AND CUSTOMERS, 2018
TABLE 4.3 MCKESSON, TECHNOLOGY SOLUTIONS: MANAGEMENT MEMBERS, 2018
TABLE 4.4 MCKESSON: HISTORICAL REVENUE ($BN), REVENUE AGR (%), REVENUE CAGR (%), GROSS PROFIT ($BN), GROSS PROFIT AGR (%) AND GROSS PROFIT CAGR (%), 2008-2018
TABLE 4.5 MCKESSON REVENUE ($BN), REVENUE SHARE (%) AND AGR (%) BREAKDOWN BY BUSINESS SEGMENT, 2017-2018
TABLE 4.6 MCKESSON: GROSS PROFIT ($BN), GROSS PROFIT SHARE (%) AND AGR (%) BREAKDOWN BY BUSINESS SEGMENT, 2017-2018
TABLE 4.7 ACQUISITIONS BY MCKESSON, 2007-2018
TABLE 4.8 MCKESSON: REVENUE ($BN), AGR (%) AND CAGR (%) FORECAST, 2019-2024
TABLE 4.9 MCKESSON: REVENUE ($BN), AGR (%) AND CAGR (%) FORECAST, 2024-2029
TABLE 4.10 MCKESSON: STRATEGIC MOVES & DEVELOPMENTS, 2018-2019
TABLE 4.11 CARDINAL HEALTH: MANAGEMENT MEMBERS, 2018
TABLE 4.12 CARDINAL HEALTH: HISTORICAL REVENUE ($BN), REVENUE AGR (%), REVENUE CAGR (%), OPERATING EARNINGS ($BN), AGR (%) AND CAGR (%), 2008-2018
TABLE 4.13 CARDINAL HEALTH: REVENUE ($BN), REVENUE SHARE (%) AND AGR (%) BREAKDOWN BY BUSINESS SEGMENT, 2017-2018
TABLE 4.14 CARDINAL HEALTH: OPERATING EARNINGS ($BN) AND ANNUAL GROWTH (%) BREAKDOWN BY BUSINESS SEGMENT, 2017-2018
TABLE 4.15 CARDINAL HEALTH: REVENUE ($BN) AND REVENUE SHARE (%) BREAKDOWN BY CUSTOMER, 2018
TABLE 4.16 SELECTED ACQUISITIONS BY CARDINAL HEALTH AND THEIR LINE OF BUSINESS, 2008-2018
TABLE 4.17 CARDINAL HEALTH: REVENUE ($BN), AGR (%) AND CAGR (%) FORECAST, 2019-2024
TABLE 4.18 CARDINAL HEALTH: REVENUE ($BN), AGR (%) AND CAGR (%) FORECAST, 2024-2029
TABLE 4.19 CARDINAL HEALTH: STRATEGIC MOVES & DEVELOPMENTS, 2018-2019
TABLE 4.20 AMERISOURCEBERGEN: MANAGEMENT MEMBERS, 2018
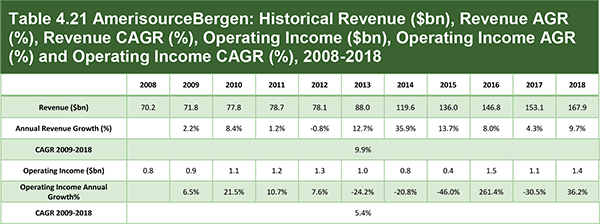
TABLE 4.21 AMERISOURCEBERGEN: HISTORICAL REVENUE ($BN), REVENUE AGR (%), REVENUE CAGR (%), OPERATING INCOME ($BN), OPERATING INCOME AGR (%) AND OPERATING INCOME CAGR (%), 2008-2018
TABLE 4.22 AMERISOURCEBERGEN: REVENUE ($BN), REVENUE SHARE (%) AND AGR (%) BREAKDOWN BY BUSINESS SEGMENT, 2017-2018
TABLE 4.23 AMERISOURCEBERGEN: GROSS PROFIT ($BN), GROSS PROFIT SHARE (%) AND AGR (%) BREAKDOWN BY BUSINESS SEGMENT, 2017-2018
TABLE 4.24 AMERISOURCEBERGEN: REVENUE ($BN) AND REVENUE SHARE (%) BREAKDOWN BY CUSTOMER, 2018
TABLE 4.25 ACQUISITIONS BY AMERISOURCEBERGEN AND THEIR LINE OF BUSINESS, 2008-2018
TABLE 4.26 AMERISOURCEBERGEN: REVENUE ($BN), AGR (%) AND CAGR (%) FORECAST, 2019-2024
TABLE 4.27 AMERISOURCEBERGEN: REVENUE ($BN), AGR (%) AND CAGR (%) FORECAST, 2024-2029
TABLE 4.28 AMERISOURCEBERGEN: STRATEGIC MOVES & DEVELOPMENTS, 2017-2019
TABLE 4.29 WALGREENS BOOTS ALLIANCE: MANAGEMENT MEMBERS, 2018
TABLE 4.30 WALGREENS BOOTS ALLIANCE: REVENUE ($BN), REVENUE AGR (%), REVENUE CAGR (%), GROSS PROFIT ($BN), GROSS PROFIT AGR (%) AND GROSS PROFIT CAGR (%), 2011-2018
TABLE 4.31 WALGREENS BOOTS ALLIANCE: REVENUE ($BN), AGR (%) AND CAGR (%) FORECAST, 2019-2024
TABLE 4.32 WALGREENS BOOTS ALLIANCE: REVENUE ($BN), AGR (%) AND CAGR (%) FORECAST, 2024-2029
TABLE 4.33 WALGREENS BOOTS ALLIANCE: STRATEGIC MOVES & DEVELOPMENTS, 2018-2019
TABLE 4.34 MEDIPAL HOLDINGS: CONSOLIDATED SUBSIDIARY COMPANIES, 2016
TABLE 4.35 MEDIPAL HOLDINGS: MANAGEMENT MEMBERS, 2018
TABLE 4.36 MEDIPAL HOLDINGS: HISTORICAL REVENUE (¥BN, $BN), REVENUE AGR (%), REVENUE CAGR (%), GROSS PROFIT AGR (%), 2008-2018
TABLE 4.37 MEDIPAL HOLDINGS: REVENUE (¥BN) AND AGR (%) BREAKDOWN BY BUSINESS SEGMENT, 2016-2019
TABLE 4.38 MEDIPAL HOLDINGS: OPERATING PROFIT (¥BN), AND AGR (%) BREAKDOWN BY BUSINESS SEGMENT, 2017-2018
TABLE 4.39 MEDIPAL HOLDINGS: REVENUE ($BN), AGR (%) AND CAGR (%) FORECAST, 2019-2024
TABLE 4.40 MEDIPAL HOLDINGS: REVENUE ($BN), AGR (%) AND CAGR (%) FORECAST, 2024-2029
TABLE 4.41 PHOENIX GROUP: MANAGEMENT MEMBERS, 2018
TABLE 4.42 PHOENIX GROUP: SUBSIDIARY COMPANIES, 2018
TABLE 4.43 PHOENIX GROUP: HISTORICAL REVENUE (€BN, $BN), REVENUE AGR (%), REVENUE CAGR (%), GROSS PROFIT (€BN, $BN), GROSS PROFIT AGR (%) AND GROSS PROFIT CAGR (%), 2011-2018
TABLE 4.44 PHOENIX GROUP: REVENUE SHARE (%) BREAKDOWN BY REGION, 2017-2018
TABLE 4.45 PHOENIX GROUP: REVENUE ($BN), AGR (%) AND CAGR (%) FORECAST, 2019-2024
TABLE 4.46 PHOENIX GROUP: REVENUE ($BN), AGR (%) AND CAGR (%) FORECAST, 2024-2029
TABLE 4.47 SINOPHARM: MANAGEMENT MEMBERS, 2018
TABLE 4.48 SINOPHARM GROUP: HISTORICAL REVENUE (RMBBN, $BN), REVENUE AGR (%), REVENUE CAGR (%), GROSS PROFIT (RMBBN, $BN), GROSS PROFIT AGR (%) AND GROSS PROFIT CAGR (%), 2011-2018
TABLE 4.49 SINOPHARM GROUP: REVENUE (RMBBN, $BN) AND REVENUE SHARE (%) AND AGR (%) BREAKDOWN BY BUSINESS SEGMENT, 2016-2018
TABLE 4.50 SINOPHARM GROUP: REVENUE ($BN), AGR (%) AND CAGR (%) FORECAST, 2019-2024
TABLE 4.51 SINOPHARM GROUP: REVENUE ($BN), AGR (%) AND CAGR (%) FORECAST, 2024-2029
TABLE 4.52 ALFRESA HOLDINGS: LIST OF SIGNIFICANT SUBSIDIARIES AND AFFILIATES, 2018
TABLE 4.53 ALFRESA HOLDINGS: MANAGEMENT MEMBERS, 2018
TABLE 4.54 ALFRESA HOLDINGS: HISTORICAL REVENUE (¥BN, $BN), REVENUE AGR (%), REVENUE CAGR (%), GROSS PROFIT (¥BN, $BN), GROSS PROFIT AGR (%) AND GROSS PROFIT CAGR (%), 2011-2018
TABLE 4.55 ALFRESA HOLDINGS: BUSINESS STRATEGIES, 2013-2018
TABLE 4.56 ALFRESA HOLDINGS: REVENUE (¥BN, $BN), REVENUE SHARE (%) AND AGR (%) BREAKDOWN BY BUSINESS SEGMENT, 2016-2018
TABLE 4.57 ALFRESA HOLDINGS: REVENUE ($BN), AGR (%) AND CAGR (%) FORECAST, 2019-2024
TABLE 4.58 ALFRESA HOLDINGS: REVENUE ($BN), AGR (%) AND CAGR (%) FORECAST, 2024-2029
TABLE 4.59 SUZUKEN CO., LTD: MANAGEMENT MEMBERS, 2018
TABLE 4.60 SUZUKEN: HISTORICAL REVENUE (¥BN, $BN), REVENUE AGR (%), REVENUE CAGR (%), GROSS PROFIT (¥BN, $BN), GROSS PROFIT AGR (%) AND GROSS PROFIT CAGR (%), 2011-2018
TABLE 4.61 SUZUKEN: REVENUE (¥BN, $BN), REVENUE SHARE (%) AND AGR (%) BREAKDOWN BY BUSINESS SEGMENT, 2016-2018
TABLE 4.62 SUZUKEN: OPERATING INCOME (¥BN, $BN), OPERATING INCOME SHARE (%) AND AGR (%) BREAKDOWN BY BUSINESS SEGMENT, 2016-2018
TABLE 4.63 SUZUKEN: REVENUE ($BN), AGR (%) AND CAGR (%) FORECAST, 2019-2024
TABLE 4.64 SUZUKEN: REVENUE ($BN), AGR (%) AND CAGR (%) FORECAST, 2024-2029
TABLE 4.65 SUZUKEN: STRATEGIC MOVES & DEVELOPMENTS, 2018-2019
TABLE 4.66 SHANGHAI PHARMACEUTICALS HOLDING: MANAGEMENT MEMBERS, 2018
TABLE 4.67 SHANGHAI PHARMACEUTICALS HOLDING: HISTORICAL REVENUE (RMBBN, $BN), REVENUE AGR (%), REVENUE CAGR (%), 2011-2018
TABLE 4.68 SHANGHAI PHARMACEUTICALS HOLDING: REVENUE (RMBBN, $BN), REVENUE SHARE (%) AND AGR (%) BREAKDOWN BY BUSINESS SEGMENT, 2016-2018
TABLE 4.69 SHANGHAI PHARMACEUTICALS: REVENUE ($BN), AGR (%) AND CAGR (%) FORECAST, 2019-2024
TABLE 4.70 SHANGHAI PHARMACEUTICALS: REVENUE ($BN), AGR (%) AND CAGR (%) FORECAST, 2024-2029
TABLE 4.71 MORRIS & DICKSON CO. LLC PROFILE 2018
TABLE 4.72 SMITH DRUG COMPANY, PROFILE 2018
TABLE 4.73 ANDA, INC. PROFILE 2018
TABLE 4.74 CURASCRIPT SPECIALTY DISTRIBUTION. PROFILE 2018
TABLE 4.75 MAWDSLEY-BROOKS & CO. LTD. PROFILE 2018
TABLE 4.76 NORTH CAROLINA MUTUAL WHOLESALE DRUG PROFILE 2018
TABLE 4.77 PRODIGY HEALTH PROFILE 2018
TABLE 4.78 FORTISSA LIMITED PROFILE 2018
TABLE 4.79 CR PHARMACEUTICAL PROFILE 2018
TABLE 4.80 HYGEN PHARMACEUTICALS INC.: PROFILE 2018
TABLE 4.81 FFF ENTERPRISES INC. PROFILE 2018
TABLE 4.82 ROCHESTER DRUG COOPERATIVE, PROFILE 2018
TABLE 4.83 AUBURN PHARMACEUTICAL COMPANY, PROFILE 2018
TABLE 4.84 AUBURN PHARMACEUTICAL COMPANY, GENERIC PRODUCT WITH LAUNCH DATES
TABLE 4.85 CAPITAL WHOLESALE DRUG COMPANY, PROFILE 2018
TABLE 4.86 REALCAN PHARMACEUTICAL GROUP CO., LTD., PROFILE 2018
TABLE 4.87 PROFARMA DISTRIBUIDORA DE PRODUTOS FARMACEUTICOS SA, PROFILE 2018
TABLE 4.88 DAKOTA DRUG, INC., PROFILE 2018
TABLE 4.89 ZHEJIANG INTL GROUP CO., LTD., PROFILE 2018
TABLE 4.90 OHKI HEALTH CARE HOLDINGS, INC., PROFILE 2018
TABLE 4.91 KINGWORLD MEDICINES GROUP LTD., PROFILE 2018
TABLE 5.1 THE PHARMACEUTICAL W&D MARKET: STRENGTHS AND WEAKNESSES
TABLE 5.2 THE PHARMACEUTICAL W&D MARKET: OPPORTUNITIES AND THREATS
TABLE 5.3 STRENGTHS AND WEAKNESSES OF THE DTP DISTRIBUTION MODEL
TABLE 5.4 ITR RATINGS AND CORRESPONDING REIMBURSEMENT RATES, 2018
TABLE 5.5 SOCIAL, TECHNOLOGICAL, ECONOMIC AND POLITICAL FACTORS INFLUENCING THE PHARMACEUTICAL WHOLESALE AND DISTRIBUTION MARKET (STEP ANALYSIS)
List of Figures
FIGURE 2.1 ROUTES OF DRUG DISTRIBUTION, 2018
FIGURE 3.1 THE GLOBAL PHARMACEUTICAL WHOLESALE AND DISTRIBUTION MARKET: DRIVERS AND RESTRAINTS, 2018
FIGURE 3.2 PHARMACEUTICAL WHOLESALE AND DISTRIBUTION: WORLD MARKET FORECAST ($BN), 2018-2029
FIGURE 3.3 PHARMACEUTICAL WHOLESALE & DISTRIBUTION BY SEGMENT: MARKET SHARES (%), 2018
FIGURE 3.4 PHARMACEUTICAL WHOLESALE & DISTRIBUTION BY SEGMENT: MARKET SHARES (%), 2024
FIGURE 3.5 PHARMACEUTICAL WHOLESALE & DISTRIBUTION BY SEGMENT: MARKET SHARES (%), 2029
FIGURE 3.6 PHARMACEUTICAL WHOLESALE & DISTRIBUTION BY SEGMENT: REVENUE FORECASTS ($BN), 2018-2029
FIGURE 3.7 WHOLESALE AND DISTRIBUTION OF BRANDED DRUGS: REVENUE ($BN) FORECAST, 2019-2029
FIGURE 3.8 WHOLESALE AND DISTRIBUTION OF GENERIC DRUGS: REVENUE ($BN) FORECAST, 2018-2029
FIGURE 4.1 MCKESSON: HISTORICAL REVENUE ($BN), REVENUE AGR (%), GROSS PROFIT ($BN) AND GROSS PROFIT AGR (%), 2008-2018
FIGURE 4.2 MCKESSON: REVENUE SHARE (%) BREAKDOWN BY BUSINESS SEGMENT, 2018
FIGURE 4.3 MCKESSON: GROSS PROFIT SHARE (%) BREAKDOWN BY BUSINESS SEGMENT, 2018
FIGURE 4.4 MCKESSON: REVENUE ($BN) FORECAST, 2019-2029
FIGURE 4.5 MCKESSON: DRIVERS AND RESTRAINTS, 2018
FIGURE 4.6 CARDINAL HEALTH: HISTORICAL REVENUE ($BN), REVENUE AGR (%), OPERATING EARNINGS ($BN) AND OPERATING EARNINGS AGR(%), 2008-2018
FIGURE 4.7 CARDINAL HEALTH: REVENUE SHARE (%) BREAKDOWN BY BUSINESS SEGMENT, 2018
FIGURE 4.8 CARDINAL HEALTH: REVENUE SHARE (%) BREAKDOWN BY CUSTOMER, 2018
FIGURE 4.9 CARDINAL HEALTH: REVENUE ($BN) FORECAST, 2019-2029
FIGURE 4.10 CARDINAL HEALTH: DRIVERS AND RESTRAINTS, 2018
FIGURE 4.11 AMERISOURCEBERGEN: HISTORICAL REVENUE ($BN), REVENUE AGR (%), OPERATING INCOME ($BN) AND OPERATING INCOME AGR (%), 2008-2018
FIGURE 4.12 AMERISOURCEBERGEN: REVENUE SHARE (%) BREAKDOWN BY BUSINESS SEGMENT, 2018
FIGURE 4.13 AMERISOURCEBERGEN: REVENUE ($BN) BREAKDOWN BY CUSTOMER, 2018
FIGURE 4.14 AMERISOURCEBERGEN: REVENUE ($BN) FORECAST, 2019-2029
FIGURE 4.15 AMERISOURCEBERGEN: DRIVERS AND RESTRAINTS, 2018
FIGURE 4.16 WALGREENS BOOTS ALLIANCE: REVENUE ($BN), REVENUE AGR (%), GROSS PROFIT ($BN) AND GROSS PROFIT AGR (%), 2011-2018
FIGURE 4.17 WALGREENS BOOTS ALLIANCE: REVENUE ($BN) FORECAST, 2019-2029
FIGURE 4.18 WALGREENS BOOTS ALLIANCE: REVENUE SHARE (%) BREAKDOWN BY BUSINESS SEGMENT, 2018
FIGURE 4.19 WALGREENS BOOTS ALLIANCE: DRIVERS AND RESTRAINTS, 2018
FIGURE 4.20 MEDIPAL HOLDINGS: HISTORICAL REVENUE (¥BN), REVENUE AGR (%), AND GROSS PROFIT AGR (%), 2008-2018
FIGURE 4.21 MEDIPAL HOLDINGS: REVENUE SHARE (%) BREAKDOWN BY BUSINESS SEGMENT, 2018
FIGURE 4.22 MEDIPAL HOLDINGS: REVENUE ($BN) FORECAST, 2019-2029
FIGURE 4.23 MEDIPAL HOLDINGS: DRIVERS AND RESTRAINTS, 2018
FIGURE 4.24 PHOENIX GROUP: HISTORICAL REVENUE (£BN), REVENUE AGR (%), GROSS PROFIT (£BN) AND GROSS PROFIT AGR (%), 2011-2018
FIGURE 4.25 PHOENIX GROUP: REVENUE SHARE (%) BREAKDOWN BY REGION, 2018
FIGURE 4.26 PHOENIX GROUP: REVENUE ($BN) FORECAST, 2019-2029
FIGURE 4.27 PHOENIX GROUP DRIVERS AND RESTRAINTS, 2018
FIGURE 4.28 SINOPHARM GROUP: HISTORICAL REVENUE (RMBBN), REVENUE AGR (%), GROSS PROFIT (RMBBN) AND GROSS PROFIT AGR (%), 2011-2018
FIGURE 4.29 SINOPHARM GROUP: REVENUE ($BN) FORECAST, 2019-2029
FIGURE 4.30 SINOPHARM GROUP: DRIVERS AND RESTRAINTS, 2018
FIGURE 4.31 ALFRESA HOLDINGS: HISTORICAL REVENUE (¥BN), REVENUE AGR (%), GROSS PROFIT (¥BN), GROSS PROFIT AGR (%), 2011-2018
FIGURE 4.32 ALFRESA HOLDINGS: REVENUE SHARE (%) BREAKDOWN BY BUSINESS SEGMENT, 2018
FIGURE 4.33 ALFRESA HOLDINGS: REVENUE ($BN) FORECAST, 2019-2029
FIGURE 4.34 ALFRESA HOLDINGS: DRIVERS AND RESTRAINTS, 2018
FIGURE 4.35 SUZUKEN: HISTORICAL REVENUE (¥BN), REVENUE AGR (%), GROSS PROFIT (¥BN) AND GROSS PROFIT AGR (%), 2011-2018
FIGURE 4.36 SUZUKEN: REVENUE SHARE (%) BREAKDOWN BY BUSINESS SEGMENT, 2018
FIGURE 4.37 SUZUKEN: OPERATING INCOME SHARE (%) BREAKDOWN BY BUSINESS SEGMENT, 2018
FIGURE 4.38 SUZUKEN: REVENUE ($BN) FORECAST, 2019-2029
FIGURE 4.39 SUZUKEN: DRIVERS AND RESTRAINTS, 2018
FIGURE 4.40 SHANGHAI PHARMACEUTICALS HOLDING: HISTORICAL REVENUE (RMBBN), REVENUE AGR (%), 2011-2018
FIGURE 4.41 SHANGHAI PHARMACEUTICALS HOLDING: REVENUE SHARE (%) BREAKDOWN BY BUSINESS SEGMENT, 2018
FIGURE 4.42 SHANGHAI PHARMACEUTICALS HOLDING: REVENUE ($BN) FORECAST, 2019-2029
FIGURE 4.43 SHANGHAI PHARMACEUTICALS HOLDING: DRIVERS AND RESTRAINTS, 2018
FIGURE 5.1 COMPARISON OF THE WHOLESALE AND DTP ROUTES OF DISTRIBUTION, 2018
FIGURE 6.1 PHARMACEUTICAL WHOLESALE AND DISTRIBUTION: GLOBAL MARKET FORECASTS ($BN) BY SUBMARKET, 2019-2029
FIGURE 6.2 LEADING NATIONAL PHARMACEUTICAL WHOLESALE AND DISTRIBUTION MARKETS: REVENUE PROJECTIONS ($BN), 2018, 2024 AND 2029
FIGURE 6.3 LEADING PHARMACEUTICAL WHOLESALE AND DISTRIBUTION COMPANIES: REVENUE ($BN) PROJECTIONS 2018, 2024 AND 2029
AAH Pharmaceuticals
AccessClosure
Acofarma (Asociación Cooperativas Farmacéuticas)
ADG Apotheken-Dienstleistungsgesellschaft mbH
Admenta
Alfresa Fine Chemical Corporation
Alfresa Holdings
Alliance Boots
Alliance Healthcare
Alliance Santé
Alliance UniChem
AmeriSource Health
AmerisourceBergen
AmerisourceBergen Canada
AmerisourceBergen Drug Corporation (ABDC)
AmerisourceBergen Specialty Group (ABSG)
Anda Inc.
Apollo Medical Holdings
ASTEC Co., Ltd.
ASTIS Co., Ltd.
Athos Farma
ATOL CO., LTD.
Auburn Pharmaceutical Company
Azwell
Bayer
BENU Apotheek
Bergen Brunswig
Biologics Inc
Boots Group
Bristol-Myers Squibb
Brocacef Groep NV
Brocacef Holding
Bundesverband des Pharmazeutischen Grosshandel
Capital Wholesale Drug Company
Cardinal Health
Caremark Rx
Celesio AG
CERP Bretagne Nord
CERP Rhin Rhone Mediterranee
CERP Rouen
Chiyaku Co
Chuounyu Co., Ltd.
Cloumed Corporation
Cofares
Comifar
Cordis
CoverMyMeds
CoverMyMeds LLC
CR Pharmaceutical
CuraScript Special
CVS Caremark
CVS Corporation
CVS Health Corporation
Cystic Fibrosis Foundation Pharmacy, LLC
Daiichi Sankyo Propharma Co.
Dakota Drug, Inc.
Dong Ying (Jiangsu) Pharmaceuticals Co., Ltd.
Drogarias Tamoio
Drug Trading Company Ltd
Dutch ACM
Emart Company
ENSHU YAKUHIN CO., LTD.
Ethicon
EVERLTH AGROTECH Co., Ltd.
EVERLTH Co., Ltd.
Farcopa Distribuzione
Fff Enterprises Inc.
Fortissa Limited
Fukujin Co.
Good Service Co
Guangzhou Pharmaceutical Company Ltd.
Guangzhou Pharmaceuticals Corporation
Harvard Drug
Hedef Alliance
Hefame
HEISEI YAKUHIN CO., LTD.
HyGen Pharmaceuticals Inc.
IZUTSU KURAYA SANSEIDO Inc.
IZUTSU PHARMACEUTICAL CO. LTD.
Japanese Pharmaceutical Wholesalers Association
Jingu Yakuhin Co., Ltd.
Johnson & Johnson
Katren
Kenzmedico Co., Ltd.
Kerr Drug
Kingworld Medicines Group Ltd.
KOBASHOU. CO., LTD.
KURAYA SANSEIDO Inc
Life Medicom Co., Ltd.
Lloyds Pharmacy
MARUZEN YAKUHIN CO., LTD.
Mawdsley-Brooks & Co. Ltd.
McKesson
McQueary Brothers of Springfield
Medical Specialties Distributors
MEDICEO CORPORATION
Medicine Shoppe Canada Inc.
MEDIE Co., Ltd.
MEDIPAL HOLDINGS CORPORATION
Mediq Apotheken Nederland B.V.
Medtronic
Meinan Distribution Center
Metro Medical Supply Inc
Mitsubishi
MM CORPORATION
Morris & Dickson Co. LLC
MP AGRO CO., LTD.
MVC CO., LTD
MWI Veterinary Supply, Inc.
Nadro
Nakano Yakuhin Co., Ltd.
National Health Service (NHS)
National Pharmaceutical Pricing Authority (NPPA)
Nihon Apoch Co.
North Carolina Mutual Wholesale Drug
Novo Nordisk
Novodata Zrt.
Numark
OCP
Ohki Health Care Holdings, Inc.
Oncology Therapeutics
Oncoprod
OptumRx
P.J.D. Network
PALTAC CORPORATION
Paltac Corporation
Panpharma
Pfercos Co., Ltd.
Pfizer
PharMEDium
Polska Grupa Farmaceutyczna
Prodigy Health
Profarma Distribuidora de Produtos Farmaceuticos SA
Prosper
Protek
PSC Co, Ltd.
PSS World Medical Inc.
Ratiopharm
RDC Kanto5
Realcan Pharmaceutical Group Co., Ltd
Red Oak Sourcing
Red Oak, LLC
Rexall Health
Rite Aid Corporation
Rochester Drug Cooperative
Rosta
RxCrossroads
S. D.Collabo Co.,Ltd.
S.D.Logi CO., Ltd.
Sakurai Tsusho Corporation
Sanacorp
Sandoz
Sanki Corporation
Sanki MediHeart Limited
Sanki Wellbe Co., Ltd.
Sannova
Sanwa Kagaku Kenkyusho Co., Ltd.
S-Care Mate Co., Ltd.
Sciclone Trade
SEIWA SANGYO CO
Shanghai Fosun Pharmaceutical
Shanghai Pharma Zhenjiang Co., Ltd.
Shanghai Pharmaceutical Holdings
Shinohara Chemicals
Shinsegai Group
Shoyaku Co., Ltd.
SIA International
Sincamesp
SINOPHARM
S-mile, Inc
Smith Drug Company
Sonexus Health
SPH Jiangxi Shangrao Pharmaceutical Co., Ltd.
SPH Keyuan Xinhai Pharmaceutical Hebei Co., Ltd.
SPH Keyuan Xinhai Pharmaceutical Heilongjiang Co., Ltd.
SPLine Corporation
Suzuken Co., Ltd.
Suzuken Iwate Co., Ltd.
Suzuken Medical Instruments Co, Ltd
Suzuken Okinawa Yakuhin Co., Ltd.
The PHOENIX Group
Toho Holdings
Tokiwa Yakuhin Co
Torfarm
Tradex International
TS Alfresa Corporation
UniChem
US Oncology Holdings, Inc.
USHIODA KURAYA SANSEIDO Inc.
USHIODA SANGOKUDO YAKUHIN CO., LTD.
Vaccine Safe Co
Vantage Oncology
Victoria Merger Sub, Inc.
Vitaco Holdings
Walgreen
Walgreens Boots Alliance
World Courier Group Inc.
Wyeth Pharmaceuticals
YAMAHIRO KURAYA SANSEIDO Inc.
Yunnan Pharmaceutical Co., Ltd.
Zhejiang Intl Group Co., Ltd.
Zuellig Pharma
Download sample pages
Complete the form below to download your free sample pages for Top 30 Pharmaceutical Wholesale & Distribution Organizations 2019
Related reports
-

Pharma Leader Series: Top Generic Drug Producers Market Forecast 2019-2029
The top 10 generic drug producers have 61% share of the total revenue made by these top 50 companies. ...Full DetailsPublished: 29 January 2019 -

Global Ophthalmic Drugs Market Forecast 2019-2029
The global ophthalmic drugs market is expected to grow at a CAGR of 4.8% in the first half of the...Full DetailsPublished: 17 June 2019 -

Global Medical Device Contract Manufacturing Market Forecast 2019-2029
The global medical device contract manufacturing market was valued at $75.84bn in 2018. Visiongain forecasts this market to increase to...Full DetailsPublished: 06 August 2019 -

Global Biosimilars and Follow-On Biologics Market 2019-2029
The global biosimilars and follow-on biologics market is estimated to have reached $10.7bn in 2018 and expected to grow at...
Full DetailsPublished: 21 March 2019 -

Global Antifungal Drugs Market Forecast 2019-2029
The global antifungal drugs market is estimated to have reached $14bn in 2018 and is expected to grow at a...
Full DetailsPublished: 04 June 2019 -

Pharma Leader Series: Top 55 Pharmaceutical Contract Manufacturing Organisations (CMOs) Market 2020
Contract manufacturing represents the largest sector of the pharma outsourcing industry. Pharmaceutical companies have sought to take advantage of the...
Full DetailsPublished: 16 January 2020 -

Top 30 Oncology Drugs Manufacturers 2019
Cancer treating drugs market forms the most lucrative sector in pharmaceuticals. As the ageing population continues to rise across the...Full DetailsPublished: 03 May 2019 -

Top 25 Dermatological Drugs Manufacturers 2019
Dermatological drugs market has been growing over the last decade. A combination of significant new market launches, and corporate activities...
Full DetailsPublished: 15 April 2019 -
Global Rheumatoid Arthritis Drugs Market Forecast 2019-2029
The global rheumatoid arthritis drugs market will reach $47bn in 2024. In 2018, the Biologics submarket held 87% of the...
Full DetailsPublished: 17 December 2018 -

Top 20 Global Respiratory Inhalers Manufacturers 2019
The global respiratory inhalers market is estimated to reach $38bn in 2023. In the respiratory Inhalers market the top three...
Full DetailsPublished: 09 April 2019
Download sample pages
Complete the form below to download your free sample pages for Top 30 Pharmaceutical Wholesale & Distribution Organizations 2019
Do you have any custom requirements we can help you with?
Any specific country, geo region, market segment or specific company information?
Email us today, we can discuss your needs and see how we can help: jamie.roberts@visiongain.com
Would you like a free report overview of the report of your choice?
If so, please drop an email to Jamie Roberts stating your chosen report title to jamie.roberts@visiongain.com
Visiongain’s reports are based on comprehensive primary and secondary research. Those studies provide global market forecasts (sales by drug and class, with sub-markets and leading nations covered) and analyses of market drivers and restraints (including SWOT analysis) and current pipeline developments. To find out more about our reports methodology, please email jamie.roberts@visiongain.com
“Thank you for this Gene Therapy R&D Market report and for how easy the process was. Your colleague was very helpful and the report is just right for my purpose. This is the 2nd good report from Visiongain and a good price.”
Dr Luz Chapa Azuella, Mexico
American Association of Colleges of Pharmacy
American College of Clinical Pharmacy
American Pharmacists Association
American Society for Pharmacy Law
American Society of Consultant Pharmacists
American Society of Health-System Pharmacists
Association of Special Pharmaceutical Manufacturers
Australian College of Pharmacy
Biotechnology Industry Organization
Canadian Pharmacists Association
Canadian Society of Hospital Pharmacists
Chinese Pharmaceutical Association
College of Psychiatric and Neurologic Pharmacists
Danish Association of Pharmaconomists
European Association of Employed Community Pharmacists in Europe
European Medicines Agency
Federal Drugs Agency
General Medical Council
Head of Medicines Agency
International Federation of Pharmaceutical Manufacturers & Associations
International Pharmaceutical Federation
International Pharmaceutical Students’ Federation
Medicines and Healthcare Products Regulatory Agency
National Pharmacy Association
Norwegian Pharmacy Association
Ontario Pharmacists Association
Pakistan Pharmacists Association
Pharmaceutical Association of Mauritius
Pharmaceutical Group of the European Union
Pharmaceutical Society of Australia
Pharmaceutical Society of Ireland
Pharmaceutical Society Of New Zealand
Pharmaceutical Society of Northern Ireland
Professional Compounding Centers of America
Royal Pharmaceutical Society
The American Association of Pharmaceutical Scientists
The BioIndustry Association
The Controlled Release Society
The European Federation of Pharmaceutical Industries and Associations
The European Personalised Medicine Association
The Institute of Clinical Research
The International Society for Pharmaceutical Engineering
The Pharmaceutical Association of Israel
The Pharmaceutical Research and Manufacturers of America
The Pharmacy Guild of Australia
The Society of Hospital Pharmacists of Australia
Don’t Miss Out!
Subscribe to receive the latest Industry news, trending insight and analysis straight to your inbox.Choose your preferences:
Latest Pharma news
Retinal Gene Therapy Market
The global Retinal Gene Therapy market is projected to grow at a CAGR of 9.6% by 2034
26 July 2024
HIV Drugs and Injectables Market
The global HIV Drugs & Injectables market is projected to grow at a CAGR of 4.6 % by 2034
24 July 2024
Digital Twin Technology in Pharmaceutical Manufacturing Market
The global Digital Twin Technology in Pharmaceutical Manufacturing market is projected to grow at a CAGR of 31.3% by 2034
23 July 2024
Specialty Pharma Market
The global Specialty Pharma market is projected to grow at a CAGR of 7.5% by 2034
22 July 2024
