Industries > Pharma > Top 30 Oncology Drugs Manufacturers 2019
Top 30 Oncology Drugs Manufacturers 2019
AstraZeneca, Merck, Novartis, Amgen, GlaxoSmithKline, Johnson & Johnson, Roche, Pfizer, Eli Lilly, Other Companies
Cancer treating drugs market forms the most lucrative sector in pharmaceuticals. As the ageing population continues to rise across the world, the incidence of cancer will continue to grow, leading to increased spending on cancer-treating medicines. This report lists and discusses the top 30 oncology drugs manufacturers.
How this report will benefit you
Read on to discover how you can exploit the future business opportunities emerging in this sector.
In this brand new 157-page report you will receive 83 tables and 64 figures–all unavailable elsewhere.
The 157-page report provides clear detailed insight into the top 30 oncology drugs manufacturers. Discover the key drivers and challenges affecting the market.
By ordering and reading our brand-new report today you stay better informed and ready to act.
Report Scope
• Assessment of the leading companies in the global oncology drugs market. The list below shows some of the companies that are discussed in the report:
• Abbott Laboratories
• AbbVie
• Amgen
• Astellas Pharma
• AstraZeneca
• Aurora Biophama
• Boehringer Ingelheim
• Bristol-Myers Squibb (BMS)
• Celgene Corporation
• Eli Lilly
• Fresenius Kabi
• Gilead
• GlaxoSmithKline (GSK)
• Grifols
• Johnson & Johnson
• Jounce Therapeutics
• Other companies
• For each company, the report provides information and discussion on:
• Company overview
• Product portfolio
• Recent development
• Financial information
• Key questions answered by this report:
• How is the Oncology Drugs Manufacturers market evolving?
• What is driving and restraining the Oncology Drugs Manufacturers market?
• What will be the main driver for the overall market?
• Will leading Oncology Drugs Manufacturers broadly follow the macroeconomic dynamics, or will individual national markets outperform others?
• Who are the leading players and what are their prospects over the forecast period?
Visiongain’s study is intended for anyone requiring commercial analyses for the Top 30 Oncology Drugs Manufacturers 2019. You find data, trends and predictions.
Buy our report today Top 30 Oncology Drugs Manufacturers 2019: AstraZeneca, Merck, Novartis, Amgen, GlaxoSmithKline, Johnson & Johnson, Roche, Pfizer, Eli Lilly, Other Companies.
Visiongain is a trading partner with the US Federal Government
CCR Ref number: KD4R6
1.1 Global Cancer-Treating drugs Overview
1.2 Research Methodology
1.3 Primary Research
1.4 Secondary Research
1.5 Why You Should Read This Report
1.6 Who is This Report For?
1.7 Associated Visiongain Reports
1.8 About Visiongain
2 Introduction to Cancer-Treating Drugs
2.1 The Physiology of Cancer – Causes and Effects
2.2 Uncontrolled Growth
2.3 Dedifferentiation
2.4 Invasiveness and Metastasis
2.5 Causes of Cancer
2.6 The Incidence and Prevalence of Cancer – Trends in the World
2.7 Incidence
2.8 Mortality
2.9 Survival – Improving Odds
2.10 The Developed World
2.11 Treating Tumours – How Can We Fight Back?
2.12 Chemotherapy – The Traditional Treatment
2.13 Hormone Therapies
2.14 Immunotherapy – A Magic Bullet?
2.14.1 Monoclonal Antibodies (mAbs)
2.14.2 Cancer Vaccines
2.14.3 Non-Specific Immunotherapies
2.14.4 Targeted Therapies
2.14.5 Differentiating Agents
3 Cancer Treating Drugs Market, Qualitative Analysis
3.1 SWOT Analysis of the Anti-Cancer Drugs Market
3.1.1 Strengths of the Market
3.1.1.1 The Rising Incidence of Cancer
3.1.1.2 Ample Treatment Options Available
3.1.2 Weaknesses
3.1.2.1 The Challenges of Drug Development
3.1.2.2 The Complex Nature of Cancer
3.1.3 Opportunities in the Anti-Cancer Drugs Market
3.1.3.1 The Advancement of Research
3.1.3.2 A Shift Towards Personalisation
3.1.4 Threats Facing the Anti-Cancer Drugs Market
3.1.4.1 The Threat of Regulation
3.2 STEP Analysis of the Anti-Cancer Drugs Market
3.2.1 Social Factors: The Cost of Living Longer
3.2.2 Technological Developments: Making the Market Move Forward
3.2.3 Economic Pressure: Treatment’s Hefty Price Tag
3.2.4 Political Issues: Governmental Involvement in Treatment
4 Leading Companies in Cancer Treating Drugs Market
4.1 AstraZeneca Plc
4.1.1 AstraZeneca Plc: Company Overview
4.1.2 AstraZeneca Plc: Product Portfolio
4.1.3 AstraZeneca Plc: Recent Developments
4.2 Merck & Co. Inc.
4.2.1 Merck & Co. Inc.: Company Overview
4.2.2 Merck & Co. Inc.: Product Portfolio
4.3.1 Merck & Co. Inc.: Recent Developments
4.3 Novartis AG
4.3.1 Novartis AG: Company Overview
4.3.2 Novartis AG: Product Portfolio
4.3.3 Novartis AG: Recent Developments
4.4 Amgen Inc.
4.4.1 Amgen Inc.: Company Overview
4.4.2 Amgen Inc.: Product Portfolio
4.4.3 Amgen Inc.: Recent Developments
4.5 BRISTOL-MYERS SQUIBB
4.5.1 BRISTOL-MYERS SQUIBB: Company Overview
4.5.2 BRISTOL-MYERS SQUIBB: Product Portfolio
4.5.3 BRISTOL-MYERS SQUIBB: Recent Developments
4.6 GlaxoSmithKline PLC (GSK Consumer Care)
4.6.1 GlaxoSmithKline PLC: Company Overview
4.6.1 GlaxoSmithKline PLC: Product Portfolio
4.6.2 GlaxoSmithKline PLC: Recent Developments
4.7 Johnson & Johnson
4.7.1 Johnson & Johnson: Company Overview
4.7.2 Johnson & Johnson: Product Portfolio
4.7.3 Johnson & Johnson: Recent Developments
4.8 F. HOFFMANN-LA ROCHE AG
4.8.1 F. Hoffmann-La Roche: Company Overview
4.8.2 F. Hoffmann-La Roche: Product Portfolio
4.8.3 F. Hoffmann-La Roche: Recent Developments
4.9 Eli Lilly and Company
4.9.1 Eli Lilly and Company: Company Overview
4.9.2 Eli Lilly and Company: Product Portfolio
4.9.3 Eli Lilly and Company: Recent Developments
4.10 Celgene Corporation
4.10.1 Celgene Corporation: Company Overview
4.10.2 Celgene Corporation: Product Portfolio
4.10.3 Celgene Corporation: Recent Developments
4.11 Pfizer Inc.
4.11.1 Pfizer Inc.: Company Overview
4.11.2 Pfizer Inc.: Product Portfolio
4.11.3 Pfizer: Recent Developments
4.12 Astellas Pharma, Inc.
4.12.1 Astellas Pharma, Inc.: Company Overview
4.12.2 Astellas Pharma, Inc.: Recent Development
4.13 Abbott Laboratories Inc.
4.13.1 Abbott Laboratories Inc.: Company Overview
4.13.2 Abbott Laboratories Inc.: Product Portfolio
4.13.3 Abbott Laboratories Inc.: Recent Development
4.14 AbbVie Inc.
4.14.1 AbbVie Inc.: Company Overview
4.14.2 AbbVie Inc.: Product Portfolio
4.14.3 AbbVie: Recent Development
4.15 Sanofi S.A. (Sanofi Genzyme)
4.15.1 Sanofi S.A.: Company Overview
4.15.2 Sanofi S.A.: Product Portfolio
4.15.3 Sanofi S.A.: Recent Development
4.16 Takeda Pharmaceutical Company Ltd.
4.16.1 Takeda Pharmaceutical Company Ltd.: Company Overview
4.16.2 Takeda Pharmaceutical Company Ltd.: Product Portfolio
4.16.3 Takeda Pharmaceutical Company Ltd.: Recent Developments
4.17 Gilead Science, Inc.
4.17.1 Gilead Science, Inc.: Company Overview
4.17.2 Gilead Science, Inc.: Product Portfolio
4.17.3 Gilead Science, Inc.: Recent Developments
4.18 A. Menarini Industrie Farmaceutiche Riunite Srl
4.18.1 A. Menarini Industrie Farmaceutiche Riunite Srl: Company Overview
4.18.2 A. Menarini Industrie Farmaceutiche Riunite Srl: Recent Developments
4.19 FRESENIUS KABI AG
4.19.1 FRESENIUS KABI AG: Product Portfolio
4.19.2 FRESENIUS KABI AG: Recent Developments
4.20 GRIFOLS S.A.
4.21 Boehringer Ingelheim GMBH
4.21.1 Boehringer Ingelheim GMBH: Company Overview
4.21.2 Boehringer Ingelheim GMBH: Product Portfolio
4.21.3 Boehringer Ingelheim GMBH: Recent Developments
4.22 Sun Pharmaceutical Industries Ltd.
4.22.1 Sun Pharmaceutical Industries Ltd.: Company Overview
4.22.2 Sun Pharmaceutical Industries Ltd.: Product Portfolio
4.22.3 Sun Pharmaceutical Industries Ltd.: Recent Developments
4.23 Teva Pharmaceutical Industries Ltd.
4.23.1 Teva Pharmaceutical Industries Ltd.: Company Overview
4.23.2 Teva Pharmaceutical Industries Ltd.: Product Portfolio
4.23.3 Teva Pharmaceutical Industries Ltd.: Recent Developments
4.24 Valeant Pharmaceuticals International, Inc.
4.24.1 Valeant Pharmaceuticals International, Inc.: Company Overview
4.24.2 Valeant Pharmaceuticals International, Inc.: Product Portfolio
4.24.3 Valeant Pharmaceuticals International, Inc.: Recent Developments
4.25 ZIOPHARM Oncology, Inc.
4.25.1 ZIOPHARM Oncology, Inc.: Company Overview
4.26 Sorrento Therapeutics, Inc.
4.26.1 Sorrento Therapeutics, Inc.: Company Overview
4.26.2 Sorrento Therapeutics, Inc.: Recent Developments
4.27 Aurora Biopharma, Inc.
4.27.1 Aurora Biopharma, Inc.: Company Overview
4.28 Tessa Therapeutics Pte Ltd.
4.28.1 Tessa Therapeutics Pte Ltd.: Company Overview
4.28.2 Tessa Therapeutics Pte Ltd.: Recent Developments
4.29 Jounce Therapeutics, Inc.
4.29.1 Jounce Therapeutics, Inc.: Company Overview
4.29.2 Jounce Therapeutics, Inc.: Recent Developments
4.30 Mylan N.V.
4.30.1 Mylan N.V.: Company Overview
4.30.1 Mylan N.V.: Recent Developments
Appendices
Associated Visiongain Reports
Visiongain Report Sales Order Form
Appendix A
About Visiongain
Appendix B
Visiongain report evaluation form
List of Tables
Table 2.1 Cancer-Treating Agents: Chemotherapies and Hormone Therapies, 2017
Table 2.2 Cancer-Treating Agents: Immunotherapies, Targeted Therapies and Differentiating Agents, 2017
Table 3.1 Strengths, Weaknesses, Opportunities and Threats in the Anti-Cancer Drugs Market
Table 3.2 Social, Technological, Economic and Political Analysis of the Anti-Cancer Drugs Market, 2017
Table 4.1 AstraZeneca Plc: Company Overview
Table 4.2 AstraZeneca Plc: Product Portfolio
Table 4.3 AstraZeneca Plc: Recent Developments
Table 4.4 Merck & Co. Inc.: Company Overview
Table 4.5 Merck & Co. Inc.: Product Portfolio
Table 4.6 Merck & Co. Inc.: Recent Developments
Table 4.7 Novartis AG: Company Overview
Table 4.8 Novartis AG: Product Portfolio
Table 4.9 Novartis AG: Recent Developments
Table 4.10 Amgen Inc.: Company Overview
Table 4.11 Amgen Inc.: Product Portfolio
Table 4.12 Amgen Inc.: Recent Developments
Table 4.13 BRISTOL-MYERS SQUIBB: Company Overview
Table 4.14 BRISTOL-MYERS SQUIBB: Product Portfolio
Table 4.15 BRISTOL-MYERS SQUIBB: Recent Developments
Table 4.16 GlaxoSmithKline PLC: Company Overview
Table 4.17 GlaxoSmithKline PLC: Product Portfolio
Table 4.18 GlaxoSmithKline PLC: Recent Developments
Table 4.19 Johnson & Johnson: Company Overview
Table 4.20 Johnson & Johnson: Product Portfolio
Table 4.21 Johnson & Johnson: Recent Developments
Table 4.22 F. Hoffmann-La Roche: Company Overview
Table 4.23 F. Hoffmann-La Roche: Product Portfolio
Table 4.24 F. Hoffmann-La Roche: Recent Developments
Table 4.25 Eli Lilly and Company: Company Overview
Table 4.26 Eli Lilly and Company: Product Portfolio
Table 4.27 Eli Lilly and Company: Recent Developments
Table 4.28 Celgene Corporation: Company Overview
Table 4.29 Celgene Corporation: Product Portfolio
Table 4.30 Celgene Corporation: Recent Developments
Table 4.31 Pfizer Inc.: Company Overview
Table 4.32 Pfizer Inc.: Product Portfolio
Table 4.33 Pfizer: Recent Developments
Table 4.34 Astellas Pharma, Inc.: Company Overview
Table 4.35 Astellas Pharma, Inc.: Recent Developments
Table 4.36 Abbott Laboratories Inc.: Company Overview
Table 4.37 Abbott Laboratories Inc.: Product Portfolio
Table 4.38 Abbott Laboratories Inc.: Recent Developments
Table 4.39 AbbVie Inc.: Company Overview
Table 4.40 AbbVie Inc.: Product Portfolio
Table 4.41 AbbVie Inc.: Recent Developments
Table 4.42 Sanofi S.A.: Company Overview
Table 4.43 Sanofi S.A.: Product Portfolio
Table 4.44 Sanofi S.A.: Recent Developments
Table 4.45 Takeda Pharmaceutical Company Ltd.: Company Overview
Table 4.46 Takeda Pharmaceutical Company Ltd.: Product Portfolio
Table 4.47 Takeda Pharmaceutical Company Ltd.: Recent Developments
Table 4.48 Gilead Science, Inc.: Company Overview
Table 4.49 Gilead Science, Inc.: Product Portfolio
Table 4.50 Gilead Science, Inc.: Recent Developments
Table 4.51 A. Menarini Industrie Farmaceutiche Riunite Srl : Company Overview
Table 4.52 A. Menarini Industrie Farmaceutiche Riunite Srl : Recent Developments
Table 4.53 FRESENIUS KABI AG: Company Overview
Table 4.54 FRESENIUS KABI AG: Product Portfolio
Table 4.55 FRESENIUS KABI AG: Recent Developments
Table 4.56 Grifols S.A.: Company Overview
Table 4.57 Grifols S.A.: Product Portfolio
Table 4.58 Boehringer Ingelheim GMBH: Company Overview
Table 4.59 Boehringer Ingelheim GMBH: Product Portfolio
Table 4.60 Boehringer Ingelheim GMBH: Recent Developments
Table 4.61 Sun Pharmaceutical Industries Ltd.: Company Overview
Table 4.62 Sun Pharmaceutical Industries Ltd.: Product Portfolio
Table 4.63 Sun Pharmaceutical Industries Ltd.: Recent Developments
Table 4.64 Teva Pharmaceutical Industries Ltd.: Company Overview
Table 4.65 Teva Pharmaceutical Industries Ltd.: Product Portfolio
Table 4.66 Teva Pharmaceutical Industries Ltd.: Recent Developments
Table 4.67 Valeant Pharmaceuticals International, Inc.: Company Overview
Table 4.68 Valeant Pharmaceuticals International, Inc.: Product Portfolio
Table 4.69 Valeant Pharmaceuticals International, Inc.: Recent Developments
Table 4.70 ZIOPHARM Oncology, Inc.: Company Overview
Table 4.71 Sorrento Therapeutics, Inc.: Company Overview
Table 4.72 Sorrento Therapeutics, Inc.: Recent Developments
Table 4.73 Aurora Biopharma, Inc.: Company Overview
Table 4.74 Tessa Therapeutics Pte Ltd.: Company Overview
Table 4.75 Tessa Therapeutics Pte Ltd.: Recent Developments
Table 4.76 Jounce Therapeutics, Inc.: Company Overview
Table 4.77 Valeant Pharmaceuticals International, Inc.: Recent Developments
Table 4.78 Mylan N.V.: Company Overview
Table 4.79 Mylan N.V.: Recent Developments
List of Figures
Figure 4.1 AstraZeneca Plc: Revenue, ($million), 2013-2017
Figure 4.2 AstraZeneca Plc: Product Segments Share (%), 2017
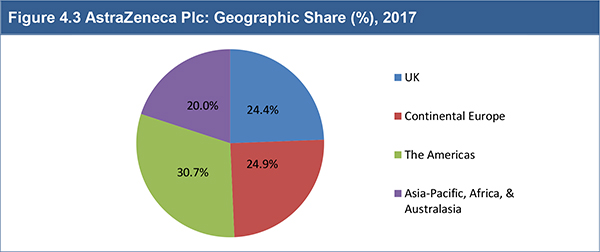
Figure 4.3 AstraZeneca Plc: Geographic Share (%), 2017
Figure 4.4 Merck & Co. Inc.: Revenue, ($million), 2013-2017
Figure 4.5 Merck & Co. Inc., Product Segments Share (%), 2017
Figure 4.6 Merck & Co. Inc., Geographical Presence Share (%), 2017
Figure 4.7 Novartis AG: Revenue, ($million), 2013-2017
Figure 4.8 Novartis AG, Product Segments Share (%), 2017
Figure 4.9 Novartis AG: Geographical Presence Share (%), 2017
Figure 4.10 Amgen Inc., Revenue, ($million), 2013-2017
Figure 4.11 Amgen Inc., Product Segments Share (%), 2017
Figure 4.12 Amgen Inc.: Geographical Presence Share (%), 2017
Figure 4.13 BRISTOL-MYERS SQUIBB: Revenue, ($million), 2013-2017
Figure 4.14 BRISTOL-MYERS SQUIBB: Product Segments Share (%), 2017
Figure 4.15 BRISTOL-MYERS SQUIBB: Geographical Presence Share (%), 2017
Figure 4.16 GlaxoSmithKline PLC: Revenue, ($million), 2013-2017
Figure 4.17 GlaxoSmithKline PLC: Product Segments Share (%), 2017
Figure 4.18 GlaxoSmithKline PLC: Geographical Presence Share (%), 2017
Figure 4.19 Johnson & Johnson: Revenue, ($million), 2013-2017
Figure 4.20 Johnson & Johnson: Product Segments Share (%), 2017
Figure 4.21 Johnson & Johnson: Geographical Presence Share (%), 2017
Figure 4.22 F. Hoffmann-La Roche: Revenue, ($million), 2013-2017
Figure 4.23 F. Hoffmann-La Roche: Product Segments Share (%), 2017
Figure 4.24 F. Hoffmann-La Roche, Geographical Presence Share (%), 2017
Figure 4.25 Eli Lilly and Company: Revenue, ($million), 2013-2017
Figure 4.26 Eli Lilly and Company: Product Segments Share (%), 2017
Figure 4.27 Eli Lilly and Company: Geographical Presence Share (%), 2017
Figure 4.28 Celgene Corporation, Revenue, ($million), 2013-2017
Figure 4.29 Pfizer Inc.: Revenue, ($million), 2013-2017
Figure 4.30 Pfizer Inc.: Product Segments Share (%), 2017
Figure 4.31 Pfizer Inc., Geographical Presence Share (%), 2017
Figure 4.32 Astellas Pharma, Inc.: Revenue, ($million), 2013-2017
Figure 4.33 Astellas Pharma, Inc.: Geographical Presence Share (%), 2017
Figure 4.34 Abbott Laboratories Inc.: Revenue, ($million), 2013-2017
Figure 4.35 Abbott Laboratories Inc.: Product Segment Share (%), 2017
Figure 4.36 Abbott Laboratories Inc., Geographic Presence Share (%), 2017
Figure 4.37 AbbVie Inc.: Revenue, ($million), 2013-2017
Figure 4.38 AbbVie Inc.: Product Segments Share (%), 2017
Figure 4.39 AbbVie Inc.: Geographical Presence Share (%), 2017
Figure 4.40 Sanofi S.A.: Revenue, ($million), 2013-2017
Figure 4.41 Sanofi S.A.: Product Segments Share (%), 2017
Figure 4.42 Sanofi S.A., Geographical Presence Share (%), 2017
Figure 4.43 Takeda Pharmaceutical Company Ltd., Revenue, ($million), 2014-2018
Figure 4.44 Takeda Pharmaceuticals Inc., Geographical Presence Share (%), 2018
Figure 4.45 Gilead Science, Inc.: Revenue, ($million), 2013-2017
Figure 4.46 Gilead Science, Inc., Product Segments Share (%), 2017
Figure 4.47 Gilead Science, Inc., Geographical Presence Share (%), 2017
Figure 4.48 Grifols S.A.: Revenue, ($million), 2013-2017
Figure 4.49 Grifols S.A., Product Segments Share (%), 2017
Figure 4.50 Grifols S.A., Geographical Presence Share (%), 2017
Figure 4.51 Boehringer Ingelheim GMBH, Revenue, ($million), 2013-2017
Figure 4.52 Boehringer Ingelheim GMBH, Product Segments Share (%), 2017
Figure 4.53 Boehringer Ingelheim GMBH, Geographical Presence Share (%), 2017
Figure 4.54 Sun Pharmaceutical Industries Ltd., Revenue, ($million), 2014-2018
Figure 4.55 Teva Pharmaceutical Industries Ltd.: Revenue, ($million), 2013-2017
Figure 4.56 Teva Pharmaceutical Industries Ltd.: Product Segments Share (%), 2017
Figure 4.57 Teva Pharmaceutical Industries Ltd., Geographical Presence Share (%), 2017
Figure 4.58 Valeant Pharmaceuticals International, Inc.: Revenue, ($million), 2013-2017
Figure 4.59 Valeant Pharmaceuticals International, Inc.: Product Segments Share (%), 2017
Figure 4.60 Valeant Pharmaceuticals International, Inc.: Geographical Presence Share (%), 2017
Figure 4.61 ZIOPHARM Oncology, Inc., Revenue, ($million), 2013-2017
Figure 4.62 Jounce Therapeutics, Inc.: Revenue, ($million), 2016-2017
Figure 4.63 Mylan N.V., Revenue, ($million), 2013-2017
Figure 4.64 Mylan N.V., Geographical Presence Share (%), 2017
AbbVie
Ablynx NV
Agios Pharmaceuticals, Inc.
Alcon
Allergan plc.
Allogene Therapeutics, Inc.
Amgen
ARMO BioSciences, Inc.
Astellas Pharma Inc.
AstraZeneca
AurKa Pharma, Inc.
Aurora Biopharma, Inc.
Bavarian Nordic
BeiGene
BiolineRX
BioNTech AG.
Biothera
Bristol-Myers Squibb
Boehringer Ingelheim
Calibr
Calico
Calithera Biosciences
Celgene Corporation
Celgene International Sarl
Ciba-Geigy
CytomX Therapeutics
Eisai Co., Ltd.
Eli Lilly
Flatiron Health
Flexus Biosciences, Inc.
Fosun Pharma
Foundation Medicine, Inc.
Fresenius Kabi AG
Genscript Biotech Corporation
Gilead Science
GlaxoSmithKline (GSK)
Harpoon Therapeutics
Heptares Therapeutics
IBM
IBM Watson
IFM Therapeutics
Ignyta
Immatics Biotechnologies
Janssen Diagnostics, LLC.
Johnson & Johnson
Jounce Therapeutics, Inc.
Juno Therapeutics, Inc.
Kimberly-Clark Corporation
Kite Pharma
Legend Biotech Ireland Limited
Legend Biotech USA Inc.
MD Anderson
MedImmune
Menarini Industrie Farmaceutiche Riunite Srl
Merck & Co.
Miltenyi Biotec
Moderna Therapeutics
Mylan N.V.
Nektar Therapeutics
Noile-Immune Biotech
Novartis
Ono Pharmaceutical Company
OSE
Parker Institute
Pfizer
Regeneron Pharmaceuticals, Inc
Rigontec
Roche
Sandoz
Sangamo Therapeutics
SARAH CANNON Research Institute
SCILEX
Selvita
Simcere
Sorrento Therapeutics, Inc.
Sosei Group Corporation
Sun Pharmaceutical Industries Ltd.
Takeda
TerSera Therapeutics LLC
Tessa Therapeutics Pte Ltd.
Valeant Phamaceuticals International, Inc.
Veropharm
Vyriad
ZIOPHARM Oncology, Inc.
List of Organizations Mentioned in the Report
European Commission
European Medicines Agency
Food and Drug Administration (FDA)
Health Canada
Japan’s Pharmaceuticals and Medical Devices Agency (PMDA)
Japanese Ministry of Health, Labour and Welfare
Johns Hopkins
World Child Cancer
World Health Organization (WHO)
Download sample pages
Complete the form below to download your free sample pages for Top 30 Oncology Drugs Manufacturers 2019
Related reports
-
Top 25 Translational Regenerative Medicine Manufacturers 2019
In 2018, the global translational regenerative medicine is estimated at $28bn. The global translational regenerative medicine market is highly competitive...
Full DetailsPublished: 05 April 2019 -
Checkpoint Inhibitors for Anti-Cancer Treatment Market 2019-2029
The global checkpoint inhibitors for anti-cancer treatment market is estimated to have reached $11.43 bn in 2018 and is expected...
Full DetailsPublished: 28 May 2019 -
Clinical Trial Supply and Logistics Market for Pharma 2019-2029
The global clinical trial supply and logistics market for pharma is estimated to have reach $17.1bn in 2018, dominated by...
Full DetailsPublished: 18 April 2019 -
Generic Drugs Market Forecast 2019-2029
The generic drugs market is estimated to have reached $257.3bn in 2018 and is expected to grow at a CAGR...
Full DetailsPublished: 14 June 2019 -
Lyophilization in Pharmaceutical Market Forecast 2019-2029
The global lyophilization in pharmaceutical market is estimated to have reached $5.6bn in 2018. The pharmaceutical and biotechnology segment held...Full DetailsPublished: 28 March 2019 -
Global Cancer Immunotherapy Market Forecast 2019-2029
The world cancer immunotherapy market is expected to grow at a CAGR of 11.4% in the second half of the...Full DetailsPublished: 21 January 2019 -
Global Oncology Pricing, Reimbursement & Market Access 2019-2029
In this report, we provide comprehensive view on some of the trends for top-seller oncology drugs including payer’s perspective on...Full DetailsPublished: 10 September 2019 -
Top 50 Bioreactor Manufacturers 2019
Asia-Pacific bioreactors market is anticipated to be the fast-growing market in the forecast period with a CAGR of 8.0% from...
Full DetailsPublished: 25 March 2019 -
Top 25 Biosimilar Drug Manufacturers 2019
Visiongain forecasts that the biosimilar drugs market will grow with a CAGR of 40% from 2018 to 2028.
...Full DetailsPublished: 17 April 2019 -
Global Next-Generation Antibody Therapies Market Forecast 2018-2028
The global next-generation antibody therapies market reached $4bn in 2017 and is estimated to reach $17bn by 2023. In 2017,...
Full DetailsPublished: 26 September 2018
Download sample pages
Complete the form below to download your free sample pages for Top 30 Oncology Drugs Manufacturers 2019
Do you have any custom requirements we can help you with?
Any specific country, geo region, market segment or specific company information?
Email us today, we can discuss your needs and see how we can help: jamie.roberts@visiongain.com
Would you like a free report overview of the report of your choice?
If so, please drop an email to Jamie Roberts stating your chosen report title to jamie.roberts@visiongain.com
Visiongain’s reports are based on comprehensive primary and secondary research. Those studies provide global market forecasts (sales by drug and class, with sub-markets and leading nations covered) and analyses of market drivers and restraints (including SWOT analysis) and current pipeline developments. To find out more about our reports methodology, please email jamie.roberts@visiongain.com
“Thank you for this Gene Therapy R&D Market report and for how easy the process was. Your colleague was very helpful and the report is just right for my purpose. This is the 2nd good report from Visiongain and a good price.”
Dr Luz Chapa Azuella, Mexico
American Association of Colleges of Pharmacy
American College of Clinical Pharmacy
American Pharmacists Association
American Society for Pharmacy Law
American Society of Consultant Pharmacists
American Society of Health-System Pharmacists
Association of Special Pharmaceutical Manufacturers
Australian College of Pharmacy
Biotechnology Industry Organization
Canadian Pharmacists Association
Canadian Society of Hospital Pharmacists
Chinese Pharmaceutical Association
College of Psychiatric and Neurologic Pharmacists
Danish Association of Pharmaconomists
European Association of Employed Community Pharmacists in Europe
European Medicines Agency
Federal Drugs Agency
General Medical Council
Head of Medicines Agency
International Federation of Pharmaceutical Manufacturers & Associations
International Pharmaceutical Federation
International Pharmaceutical Students’ Federation
Medicines and Healthcare Products Regulatory Agency
National Pharmacy Association
Norwegian Pharmacy Association
Ontario Pharmacists Association
Pakistan Pharmacists Association
Pharmaceutical Association of Mauritius
Pharmaceutical Group of the European Union
Pharmaceutical Society of Australia
Pharmaceutical Society of Ireland
Pharmaceutical Society Of New Zealand
Pharmaceutical Society of Northern Ireland
Professional Compounding Centers of America
Royal Pharmaceutical Society
The American Association of Pharmaceutical Scientists
The BioIndustry Association
The Controlled Release Society
The European Federation of Pharmaceutical Industries and Associations
The European Personalised Medicine Association
The Institute of Clinical Research
The International Society for Pharmaceutical Engineering
The Pharmaceutical Association of Israel
The Pharmaceutical Research and Manufacturers of America
The Pharmacy Guild of Australia
The Society of Hospital Pharmacists of Australia
Latest Pharma news
Visiongain Publishes Cell Therapy Technologies Market Report 2024-2034
The cell therapy technologies market is estimated at US$7,041.3 million in 2024 and is projected to grow at a CAGR of 10.7% during the forecast period 2024-2034.
18 April 2024
Visiongain Publishes Automation in Biopharma Industry Market Report 2024-2034
The global Automation in Biopharma Industry market is estimated at US$1,954.3 million in 2024 and is projected to grow at a CAGR of 7% during the forecast period 2024-2034.
17 April 2024
Visiongain Publishes Anti-obesity Drugs Market Report 2024-2034
The global Anti-obesity Drugs market is estimated at US$11,540.2 million in 2024 and is expected to register a CAGR of 21.2% from 2024 to 2034.
12 April 2024
Visiongain Publishes Inflammatory Bowel Diseases (IBD) Drugs Market Report 2024-2034
The global Inflammatory Bowel Diseases (IBD) Drugs market was valued at US$27.53 billion in 2023 and is projected to grow at a CAGR of 6.2% during the forecast period 2024-2034.
11 April 2024


