Visiongain has calculated that the global Concentrated Solar Power (CSP) Market will see a capital expenditure (CAPEX) of $12,568 mn in 2018. Read on to discover the potential business opportunities available.
The Concentrating solar power (CSP) is a power generation technology which uses mirrors to concentrate energy from the sun which drives steam turbines and generators to produce electricity. The four major CSP technologies comprise of a parabolic trough, linear Fresnel reflector, solar tower and solar dish. The CSP technology has an ability to store energy so as to provide electricity as and when required and thus help reduce the development cost of new power plants. This can be beneficial to meet future demand for electricity.
Solar power is a renewable source of energy that is inexhaustible and sustainable, compared to fossil fuels which are finite. Solar energy is freely available in abundance, and no other fuels are required in the process of harnessing and utilising it.
Government incentives for CSP industry encourage the growth of CSP market. Several countries including China, US, India introduced feed-in tariff, federal incentives, tax benefits to promote CSP projects.
Due to its high cost, most of the solar projects have switched from the CSP technology to PV technology resulting in a considerable decrease in the cost of PV panels. The US Department of Energy has introduced the SunShot Initiative in order to reduce the cost of CSP technology as well as increase its adoption in the development of solar power plants globally.
Growing concerns about depletion of fossil fuel and strict government regulations regarding carbon footprint reduction will drive the CSP market. In addition to industrialization, lack of infrastructure in developing countries and rising consumption of electricity.
Visiongain’s global Concentrated Solar Power (CSP) Market report can keep you informed and up to date with the developments in the market, across eleven different nations: United States, Spain, Australia, China, India, Morocco, South Africa, Chile, Saudi Arabia, UAE and Rest of the World.
With reference to this report, it details the key investments trend in the global market, subdivided by regions, capital expenditure, capacity and technology. Through extensive secondary research and interviews with industry experts, visiongain has identified a series of market trends that will impact the Concentrated Solar Power (CSP) Market over the forecast timeframe.
The report will answer questions such as:
– How is the Concentrating Solar Power Market evolving?
– What is driving and restraining Concentrating Solar Power Market dynamics?
– How will each Concentrating Solar Power submarket segment grow over the forecast period and how much sales will these submarkets account for in 2028?
– How will market shares of each Concentrating Solar Power submarket develop from 2018-2028?
– Which individual technologies will prevail and how will these shifts be responded to?
– Which Concentrating Solar Power submarket will be the main driver of the overall market from 2018-2028?
– How will political and regulatory factors influence regional Concentrating Solar Power Markets and submarkets?
– Will leading national Concentrating Solar Power Market broadly follow macroeconomic dynamics, or will individual country sectors outperform the rest of the economy?
– How will market shares of the national markets change by 2028 and which nation will lead the market in 2028?
– Who are the leading players and what are their prospects over the forecast period?
– How will the sector evolve as alliances form during the period between 2018 and 2028?
Five Reasons Why You Must Order and Read This Report Today:
1) The report provides Forecasts for the Concentrated Solar Power (CSP) Market for the period 2018-2028 by
– CAPEX (US$mn)
– Capacity (MW)
2) The report also Forecasts and Analyses the Concentrated Solar Power (CSP) Market by Technology from 2018-2028
– Parabolic Trough
– Fresnel Reflector
– Solar Tower
– Solar Dish
3) The report Forecasts and Analyses the Concentrated Solar Power (CSP) Market by Nation from 2018-2028
– United States
– Spain
– Australia
– China
– India
– Morocco
– South Africa
– Chile
– Saudi Arabia
– UAE
– Rest of the World
4) The report includes Drivers and Restraints affecting the Concentrated Solar Power (CSP) Market

5) The report provides Detailed Profiles of The Leading Companies Operating within the Concentrated Solar Power (CSP) Market:
– BrightSource Energy Inc.
– Abengoa Solar SA
– eSolar
– Acciona
– Solar Millennium AG
– Siemens AG
– SCHOTT AG
– TSK Group
– NextEra Energy Resources, LLC
– SolarReserve, LLC
– Novatec Solar
– Lointek
– ACWA Power
– ENGIE Group
– General Electric Company
– Grupo COBRA
This independent 177-page report guarantees you will remain better informed than your competitors. With 175 tables and figures examining the Concentrated Solar Power (CSP) market space, the report gives you a direct, detailed breakdown of the market. PLUS, Capital expenditure by technology and nation, as well as in-Depth analysis of leading companies in the Concentrated Solar Power (CSP) market from 2018-2028 that will keep your knowledge that one step ahead of your rivals.
This report is essential reading for you or anyone in the Energy sector. Purchasing this report today will help you to recognise those important market opportunities and understand the possibilities there. I look forward to receiving your order.
Visiongain is a trading partner with the US Federal Government
CCR Ref number: KD4R6
1. Report Overview
1.1 Global Concentrating Solar Power Market Overview
1.2 Why You Should Read This Report
1.3 How This Report Delivers
1.4 Key Questions Answered by This Analytical Report Include:
1.5 Who is This Report For?
1.6 Methodology
1.6.1 Primary Research
1.6.2 Secondary Research
1.6.3 Market Evaluation & Forecasting Methodology
1.7 Frequently Asked Questions (FAQ)
1.8 Associated Visiongain Reports
1.9 About Visiongain
2. Introduction to the Concentrating Solar Power Market
2.1 Concentrating Solar Power Market Definition
2.2 Concentrating Solar Power Market Structure
2.3 Brief History of Concentrating Solar Power
3. Global Concentrating Solar Power Market 2018-2028
3.1 Global Concentrating Solar Power Market Forecast 2018-2028
3.2 Concentrating Solar Power Market Drivers & Restraints 2018
3.2.1 Drivers in the Concentrating Solar Power Market
3.2.1.1 Favourable Government Initiatives
3.2.1.2 Increasing Electricity Demand
3.2.1.3 Rising Demand for Clean Energy
3.2.2 Restraints in the Concentrating Solar Power Market
3.2.2.1 High Initial Cost
3.2.2.2 Financial Crunch
3.2.2.3 Increasing Adoption of Other Renewable Technologies
4. Global Concentrating Solar Power Market By Technology Forecast 2018-2028
4.1 Global Concentrating Solar Power Market By Parabolic Trough Technology Forecast 2018-2028
4.2 Global Concentrating Solar Power Market By Fresnel Reflector Technology Forecast 2018-2028
4.3 Global Concentrating Solar Power Market By Solar Tower Technology Forecast 2018-2028
4.4 Global Concentrating Solar Power Market By Solar Dish Technology Forecast 2018-2028
5. Leading National Concentrating Solar Power Market Forecast 2018-2028
5.1 The US Concentrating Solar Power Market Forecast 2018-2028
5.2 Spain Concentrating Solar Power Market Forecast 2018-2028
5.3 Australia Concentrating Solar Power Market Forecast 2018-2028
5.4 China Concentrating Solar Power Market Forecast 2018-2028
5.5 India Concentrating Solar Power Market Forecast 2018-2028
5.6 Morocco Concentrating Solar Power Market Forecast 2018-2028
5.7 South Africa Concentrating Solar Power Market Forecast 2018-2028
5.8 Chile Concentrating Solar Power Market Forecast 2018-2028
5.9 Saudi Arabia Concentrating Solar Power Market Forecast 2018-2028
5.10 UAE Concentrating Solar Power Market Forecast 2018-2028
5.11 Rest of World Concentrating Solar Power Market Forecast 2018-2028
6. SWOT Analysis of the Concentrating Solar Power Market 2018-2028
6.1 Strengths
6.2 Weaknesses
6.3 Opportunities
6.4 Threats
7. The Leading Companies in the Concentrating Solar Power Market
7.1 BrightSource Energy Inc.
7.1.1 BrightSource Energy Inc. Concentrating Solar Power Selected Recent Contracts / Projects / Programmes 2017
7.2 Abengoa Solar SA
7.2.1 Abengoa Solar SA Concentrating Solar Power Selected Recent Contracts / Projects / Programmes 2017
7.2.2 Abengoa Solar SA Total Company Sales 2011-2016
7.2.3 Abengoa Solar SA Sales in the Concentrating Solar Power Market 2011-2016
7.3 eSolar
7.3.1 eSolar Concentrating Solar Power Selected Recent Contracts / Projects / Programmes 2017
7.4 Acciona
7.4.1 Acciona Concentrating Solar Power Selected Recent Contracts / Projects / Programmes 2017
7.4.2 Acciona Total Company Sales 2011-2016
7.4.3 Acciona Sales in the Concentrating Solar Power Market 2012-2016
7.5 Solar Millennium AG
7.5.1 Solar Millennium AG Concentrating Solar Power Selected Recent Contracts / Projects / Programmes 2017
7.5.2 Solar Millennium AG Total Company Sales 2007-2010
7.6 Siemens AG
7.6.1 Siemens AG Total Company Sales 2011-2017
7.6.2 Siemens AG Sales in the Concentrating Solar Power Market 2014-2017
7.7 SCHOTT AG
7.7.1 SCHOTT AG Total Company Sales 2011-2016
7.8 TSK Group
7.8.1 TSK Group Concentrating Solar Power Selected Recent Contracts / Projects / Programmes 2017
7.8.2 TSK Group Total Company Sales 2011-2016
7.8.3 TSK Group Sales in the Concentrating Solar Power Market 2011-2016
7.9 NextEra Energy Resources, LLC
7.9.1 NextEra Energy Resources, LLC Concentrating Solar Power Selected Recent Contracts / Projects / Programmes 2017
7.9.2 NextEra Energy Resources, LLC Total Company Sales 2011-2016
7.9.3 NextEra Energy Resources, LLC Sales in the Concentrating Solar Power Market 2011-2016
7.10 SolarReserve, LLC
7.10.1 SolarReserve, LLC Concentrating Solar Power Selected Recent Contracts / Projects / Programmes 2017
7.11 Novatec Solar
7.11.1 Novatec Solar Concentrating Solar Power Selected Recent Contracts / Projects / Programmes 2017
7.12 Lointek
7.13 ENGIE Group
7.13.1 Engie Group Solar Concentrating Solar Power Selected Recent Contracts / Projects / Programmes 2017
7.13.2 Engie Group Total Company Sales 2011-2016
7.14 ACWA Power
7.14.1 ACWA Power Solar Concentrating Solar Power Selected Recent Contracts / Projects / Programmes 2017
7.14.2 ACWA Power Total Company Sales 2011-2016
7.14.3 ACWA Power Sales in the Concentrating Solar Power Market 2011-2013
7.15 General Electric Company
7.15.1 General Electric Company Concentrating Solar Power Selected Recent Contracts / Projects / Programmes 2017
7.15.2 General Electric Company Total Company Sales 2012-2016
7.15.3 General Electric Company Sales in the Concentrating Solar Power Market 2014-2016
7.16 Grupo COBRA
7.16.1 Grupo COBRA Concentrating Solar Power Selected Recent Contracts / Projects / Programmes 2017
7.17 Other Companies Involved in the Concentrating Solar Power Market 2017
8. Conclusions and Recommendations
8.1 Key Findings
8.2 Recommendations
9. Glossary
Appendix
Associated Visiongain Reports
Visiongain Report Sales Order Form
Appendix A
Appendix B
Visiongain Report Evaluation Form
List of Tables
Table 1.1 Leading National Concentrating Solar Power Market Forecast 2018-2028 (US$mn, MW, Global AGR %, Cumulative)
Table 1.2 Global Concentrating Solar Power By Technology Forecast 2018-2028 (US$mn, AGR %, CAGR %, Cumulative)
Table 3.1 Global Concentrating Solar Power Market Forecast 2018-2028 (US$mn, AGR %, CAGR %, Cumulative)
Table 3.2 Global Concentrating Solar Power Market Forecast 2018-2028 (MW, AGR %, CAGR %, Cumulative)
Table 3.3 Concentrating Solar Power Market Drivers & Restraints
Table 4.1 Global Concentrating Solar Power Market By Technology Forecast 2018-2028 (US$mn, AGR %, Cumulative)
Table 4.2 Global Concentrating Solar Power Market By Technology CAGR Forecast 2018-2023, 2023-2028, 2018-2028 (CAGR %)
Table 4.3 Global Concentrating Solar Power Market By Parabolic Trough Technology Forecast 2018-2028 (US$mn, AGR %, CAGR %, Cumulative)
Table 4.4 Global Concentrating Solar Power Market By Fresnel Reflector Technology Forecast 2018-2028 (US$mn, AGR %, CAGR %, Cumulative)
Table 4.5 Global Concentrating Solar Power Market By Solar Tower Technology Forecast 2018-2028 (US$mn, AGR %, CAGR %, Cumulative)
Table 4.6 Global Concentrating Solar Power Market By Solar Dish Technology Forecast 2018-2028 (US$mn, AGR %, CAGR %, Cumulative)
Table 5.1 Leading National Concentrating Solar Power Market Forecast 2018-2028 (US$mn, Global AGR %, Cumulative)
Table 5.2 Regional Concentrating Solar Power Market Percentage Change in Market Share 2018-2023, 2023-2028, 2018-2028 (% Change)
Table 5.3 Leading National Concentrating Solar Power Market Forecast 2018-2028 (MW, Global AGR %, Cumulative)
Table 5.4 Regional Concentrating Solar Power Market Percentage Change in Market Share 2018-2023, 2023-2028, 2018-2028 (% Change)
Table 5.5 US Concentrating Solar Power Market Forecast 2018-2028 (US$mn, AGR %, CAGR %, Cumulative)
Table 5.6 US Concentrating Solar Power Market Forecast 2018-2028 (MW, AGR %, CAGR %, Cumulative)
Table 5.7 The U.S. Concentrating Solar Power By Technology Forecast 2018-2028 (US$mn, AGR %, CAGR %, Cumulative)
Table 5.8 Spain Concentrating Solar Power Market Forecast 2018-2028 (US$mn, AGR %, CAGR %, Cumulative)
Table 5.9 Spain Concentrating Solar Power Market Forecast 2018-2028 (MW, AGR %, CAGR %, Cumulative)
Table 5.10 Spain Concentrating Solar Power By Technology Forecast 2018-2028 (US$mn, AGR %, CAGR %, Cumulative)
Table 5.11 Australia Concentrating Solar Power Market Forecast 2018-2028 (US$mn, AGR %, CAGR %, Cumulative)
Table 5.12 Australia Concentrating Solar Power Market Forecast 2018-2028 (MW, AGR %, CAGR %, Cumulative)
Table 5.13 Australia Concentrating Solar Power By Technology Forecast 2018-2028 (US$mn, AGR %, CAGR %, Cumulative)
Table 5.14 China Concentrating Solar Power Market Forecast 2018-2028 (US$mn, AGR %, CAGR %, Cumulative)
Table 5.15 China Concentrating Solar Power Market Forecast 2018-2028 (MW, AGR %, CAGR %, Cumulative)
Table 5.16 China Concentrating Solar Power By Technology Forecast 2018-2028 (US$mn, AGR %, CAGR %, Cumulative)
Table 5.17 India Concentrating Solar Power Market Forecast 2018-2028 (US$mn, AGR %, CAGR %, Cumulative)
Table 5.18 India Concentrating Solar Power Market Forecast 2018-2028 (MW, AGR %, CAGR %, Cumulative)
Table 5.19 India Concentrating Solar Power By Technology Forecast 2018-2028 (US$mn, AGR %, CAGR %, Cumulative)
Table 5.20 Morocco Concentrating Solar Power Market Forecast 2018-2028 (US$mn, AGR %, CAGR %, Cumulative)
Table 5.21 Morocco Concentrating Solar Power Market Forecast 2018-2028 (MW, AGR %, CAGR %, Cumulative)
Table 5.22 Morocco Concentrating Solar Power By Technology Forecast 2018-2028 (US$mn, AGR %, CAGR %, Cumulative)
Table 5.23 South Africa Concentrating Solar Power Market Forecast 2018-2028 (US$mn, AGR %, CAGR %, Cumulative)
Table 5.24 South Africa Concentrating Solar Power Market Forecast 2018-2028 (MW, AGR %, CAGR %, Cumulative)
Table 5.25 South Africa Concentrating Solar Power By Technology Forecast 2018-2028 (US$mn, AGR %, CAGR %, Cumulative)
Table 5.26 Chile Concentrating Solar Power Market Forecast 2018-2028 (US$mn, AGR %, CAGR %, Cumulative)
Table 5.27 Chile Concentrating Solar Power Market Forecast 2018-2028 (MW, AGR %, CAGR %, Cumulative)
Table 5.28 Chile Concentrating Solar Power By Technology Forecast 2018-2028 (US$mn, AGR %, CAGR %, Cumulative)
Table 5.29 Saudi Arabia Concentrating Solar Power Market Forecast 2018-2028 (US$mn, AGR %, CAGR %, Cumulative)
Table 5.30 Saudi Arabia Concentrating Solar Power Market Forecast 2018-2028 (MW, AGR %, CAGR %, Cumulative)
Table 5.31 Saudi Arabia Concentrating Solar Power By Technology Forecast 2018-2028 (US$mn, AGR %, CAGR %, Cumulative)
Table 5.32 UAE Concentrating Solar Power Market Forecast 2018-2028 (US$mn, AGR %, CAGR %, Cumulative)
Table 5.33 UAE Concentrating Solar Power Market Forecast 2018-2028 (MW, AGR %, CAGR %, Cumulative)
Table 5.34 UAE Concentrating Solar Power By Technology Forecast 2018-2028 (US$mn, AGR %, CAGR %, Cumulative)
Table 5.35 Rest of the World Concentrating Solar Power Market Forecast 2018-2028 (US$mn, AGR %, CAGR %, Cumulative)
Table 5.36 Rest of the World Concentrating Solar Power Market Forecast 2018-2028 (MW, AGR %, CAGR %, Cumulative)
Table 5.37 Rest of the World Concentrating Solar Power By Technology Forecast 2018-2028 (US$mn, AGR %, CAGR %, Cumulative)
Table 6.1 Global Concentrating Solar Power Market SWOT Analysis 2018-2028
Table 7.1 BrightSource Energy Inc. 2017 (CEO, Business Segment in the Market, HQ, Founded, No. of Employees, IR Contact, Ticker, Website)
Table 7.2 Selected Recent BrightSource Energy Inc. Concentrating Solar Power Contracts / Projects / Programmes 2017 (Projects, Country, Subcontractor, Technology, Status and Capacity (MW))
Table 7.3 Abengoa Solar SA 2017 (CEO, Total Company Sales US$m, Sales from Company Division that includes CSP (US$m), Share of Total Company Sales from Company Division that includes CSP (%), Net Income / Loss US$m, Net Capital Expenditure US$m, Strongest Business Region, Business Segment in the Market, HQ, Founded, No. of Employees, IR Contact, Ticker, Website)
Table 7.4 Selected Recent Abengoa Solar SA Concentrating Solar Power Contracts / Projects / Programmes 2017 (Projects, Country, Subcontractor, Technology, Status and Capacity (MW))
Table 7.5 Abengoa Solar SA Total Company Sales 2010-2016 (US$m, AGR %)
Table 7.6 Abengoa Solar SA Sales in the Concentrating Solar Power Market 2010-2016 (US$m, AGR %)
Table 7.7 eSolar 2017 (CEO, HQ, Founded, No. of Employees, IR Contact, Ticker, Website)
Table 7.8 Selected Recent eSolar Concentrating Solar Power Contracts / Projects / Programmes 2017 (Projects, Country, Subcontractor, Technology, Status and Capacity (MW))
Table 7.9 Acciona 2017 (CEO, Total Company Sales US$m, Sales from Company Division that includes CSP (US$m), Share of Total Company Sales from Company Division that includes CSP (%), Net Income / Loss US$m, Net Capital Expenditure US$m, Strongest Business Region, Business Segment in the Market, HQ, Founded, No. of Employees, IR Contact, Ticker, Website)
Table 7.10 Selected Recent Acciona Concentrating Solar Power Contracts / Projects / Programmes 2017 (Projects, Country, Subcontractor, Technology, Status and Capacity (MW))
Table 7.11 Acciona Total Company Sales 2010-2016 (US$m, AGR %)
Table 7.12 Acciona Sales in the Concentrating Solar Power Market 2011-2016 (US$m, AGR %)
Table 7.13 Solar Millennium AG 2017 (CEO, Total Company Sales US$m, Sales in the Market US$m, Net Income / Loss US$m, Net Capital Expenditure US$m, Strongest Business Region, Business Segment in the Market, HQ, Founded, No. of Employees, IR Contact, Ticker, Website)
Table 7.14 Selected Recent Solar Millennium AG Concentrating Solar Power Contracts / Projects / Programmes 2017 (Projects, Country, Subcontractor, Technology, Status and Capacity (MW))
Table 7.15 Solar Millennium AG Total Company Sales 2006-2010 (US$m, AGR %)
Table 7.16 Siemens AG Profile 2017 (CEO, Total Company Sales US$m, Sales from Company Division that includes CSP (US$m), Share of Total Company Sales from Company Division that includes CSP (%), Net Income / Loss US$m, Net Capital Expenditure US$m, Strongest Business Region, Business Segment in the Market, HQ, Founded, No. of Employees, IR Contact, Ticker, Website)
Table 7.17 Siemens AG Total Company Sales 2010-2017 (US$m, AGR %)
Table 7.18 Siemens AG Sales in the Concentrating Solar Power Market 2013-2017 (US$m, AGR %)
Table 7.19 SCHOTT AG 2017 (CEO, Total Company Sales US$m, Sales in the Market US$m, Net Income / Loss US$m, Net Capital Expenditure US$m, Strongest Business Region, Business Segment in the Market, HQ, Founded, No. of Employees, IR Contact, Ticker, Website)
Table 7.20 SCHOTT AG Total Company Sales 2010-2016 (US$m, AGR %)
Table 7.21 TSK Group 2017 (CEO, Total Company Sales US$m, Sales from Company Division that includes CSP (US$m), Share of Total Company Sales from Company Division that includes CSP (%), Net Income / Loss US$m, Net Capital Expenditure US$m, Strongest Business Region, Business Segment in the Market, HQ, Founded, No. of Employees, IR Contact, Ticker, Website)
Table 7.22 Selected Recent TSK Group Concentrating Solar Power Contracts / Projects / Programmes 2017 (Projects, Country, Subcontractor, Technology, Status and Capacity (MW))
Table 7.23 TSK Group Total Company Sales 2010-2016 (US$m, AGR %)
Table 7.24 TSK Group Sales in the Concentrating Solar Power Market 2010-2016 (US$m, AGR %)
Table 7.25 NextEra Energy Resources, LLC 2017 (CEO, Total Company Sales US$m, Sales from Company Division that includes CSP (US$m), Share of Total Company Sales from Company Division that includes CSP (%), Net Income / Loss US$m, Net Capital Expenditure US$m, Strongest Business Region, Business Segment in the Market, HQ, Founded, No. of Employees, IR Contact, Ticker, Website)
Table 7.26 Selected Recent NextEra Energy Resources, LLC Concentrating Solar Power Contracts / Projects / Programmes 2017 (Projects, Country, Subcontractor, Technology, Status and Capacity (MW))
Table 7.27 NextEra Energy Resources, LLC Total Company Sales 2010-2016 (US$m, AGR %)
Table 7.28 NextEra Energy Resources, LLC Sales in the Concentrating Solar Power Market 2010-2016 (US$m, AGR %)
Table 7.29 SolarReserve, LLC Profile 2017 (CEO, Business Segment in the Market, HQ, Founded, No. of Employees, IR Contact, Ticker, Website)
Table 7.30 Selected Recent SolarReserve, LLC Concentrating Solar Power Contracts / Projects / Programmes 2017 (Projects, Country, Subcontractor, Technology, Status and Capacity (MW))
Table 7.31 Novatec Solar Profile 2017 (CEO, Business Segment in the Market, HQ, Founded, No. of Employees, IR Contact, Ticker, Website)
Table 7.32 Selected Recent Novatec Solar Concentrating Solar Power Contracts / Projects / Programmes 2017 (Projects, Country, Subcontractor, Technology, Status and Capacity (MW))
Table 7.33 Lointek Profile 2017 (CEO, Business Segment in the Market, HQ, Founded, No. of Employees, IR Contact, Ticker, Website)
Table 7.34 ENGIE Group Profile 2017 (CEO, Total Company Sales US$m, Sales in the Market US$m, Net Income / Loss US$m, Net Capital Expenditure US$m, Strongest Business Region, Business Segment in the Market, HQ, Founded, No. of Employees, IR Contact, Ticker, Website)
Table 7.35 Selected Recent Engie Group Solar Concentrating Solar Power Contracts / Projects / Programmes 2017 (Projects, Country, Subcontractor, Technology, Status and Capacity (MW))
Table 7.36 Engie Group Total Company Sales 2010-2016 (US$m, AGR %)
Table 7.37 ACWA Power 2017 (CEO, Total Company Sales US$m, Sales from Company Division that includes CSP (US$m), Share of Total Company Sales from Company Division that includes CSP (%), Net Income / Loss US$m, Net Capital Expenditure US$m, Strongest Business Region, Business Segment in the Market, HQ, Founded, No. of Employees, IR Contact, Ticker, Website)
Table 7.38 Selected Recent ACWA Power Solar Concentrating Solar Power Contracts / Projects / Programmes 2017 (Projects, Country, Subcontractor, Technology, Status and Capacity (MW))
Table 7.39 ACWA Power Total Company Sales 2010-2016 (US$m, AGR %)
Table 7.40 ACWA Power Sales in the Concentrating Solar Power Market 2010-2013 (US$m, AGR %)
Table 7.41 General Electric Company 2017 (CEO, Total Company Sales US$m, Sales from Company Division that includes CSP (US$m), Share of Total Company Sales from Company Division that includes CSP (%), Net Income / Loss US$m, Net Capital Expenditure US$m, Strongest Business Region, Business Segment in the Market, HQ, Founded, No. of Employees, IR Contact, Ticker, Website)
Table 7.42 Selected Recent General Electric Company Concentrating Solar Power Contracts / Projects / Programmes 2017 (Projects, Country, Subcontractor, Technology, Status and Capacity (MW))
Table 7.43 General Electric Company Total Company Sales 2011-2016 (US$m, AGR %)
Table 7.44 General Electric Company Sales in the Concentrating Solar Power Market 2013-2016 (US$m, AGR %)
Table 7.45 Grupo COBRA 2017 (CEO, Total Company Sales US$m, Strongest Business Region, Business Segment in the Market, HQ, Founded, No. of Employees, IR Contact, Ticker, Website)
Table 7.46 Selected Recent Grupo COBRA Concentrating Solar Power Contracts / Projects / Programmes 2017 (Projects, Country, Subcontractor, Technology, Status and Capacity (MW))
Table 7.47 Other Companies Involved in the Concentrating Solar Power Market 2017 (Company, Location)
Table 8.1 Global Concentrating Solar Power Market By Technology Forecast 2018-2028 (US$mn, AGR %, Cumulative)
Table 8.2 Leading National Concentrating Solar Power Market Forecast 2018-2028 (US$mn, Global AGR %, Cumulative)
Table 8.3 Leading National Concentrating Solar Power Market Forecast 2018-2028 (MW, Global AGR %, Cumulative)
List of Figures
Figure 2.1 Global Concentrating Solar Power Market Segmentation Overview
Figure 3.1 Global Concentrating Solar Power Market Forecast 2018-2028 (US$mn, AGR %)
Figure 3.2 Global Concentrating Solar Power Market Forecast 2018-2028 (MW, AGR %)
Figure 4.1 Global Concentrating Solar Power Market By Technology AGR Forecast 2018-2028 (AGR %)
Figure 4.2 Global Concentrating Solar Power Market By Technology Forecast 2018-2028 (US$mn, Global AGR %)
Figure 4.3 Global Concentrating Solar Power Market By Technology Share Forecast 2018 (% Share)
Figure 4.4 Global Concentrating Solar Power Market By Technology Share Forecast 2023 (% Share)
Figure 4.5 Global Concentrating Solar Power Market By Technology Share Forecast 2028 (% Share)
Figure 4.6 Global Concentrating Solar Power Market By Parabolic Trough Technology Forecast 2018-2028 (US$mn, Global AGR %)
Figure 4.7 Share of the Parabolic Trough Technology in Global Concentrating Solar Power Market 2018-2028 (%)
Figure 4.8 Global Concentrating Solar Power Market By Fresnel Reflector Technology Forecast 2018-2028 (US$mn, Global AGR %)
Figure 4.9 Share of the Fresnel Reflector Technology in Global Concentrating Solar Power Market 2018-2028 (%)
Figure 4.10 Global Concentrating Solar Power Market By Solar Tower Technology Forecast 2018-2028 (US$mn, Global AGR %)
Figure 4.11 Share of the Solar Tower Technology in Global Concentrating Solar Power Market 2018-2028 (%)
Figure 4.12 Global Concentrating Solar Power Market By Solar Dish Technology Forecast 2018-2028 (US$mn, Global AGR %)
Figure 4.13 Share of the Solar Dish Technology in Global Concentrating Solar Power Market 2018-2028 (%)
Figure 5.1 Global Concentrating Solar Power Market by Region Market Forecast 2018-2028 (US$mn, Global AGR %)
Figure 5.2 Global Concentrating Solar Power Market by Region Market AGR Forecast 2018-2028 (AGR %)
Figure 5.3 Global Concentrating Solar Power Market by Regional Market Share Forecast 2018 (% Share)
Figure 5.4 Global Concentrating Solar Power Market by Regional Market Share Forecast 2023 (% Share)
Figure 5.5 Global Concentrating Solar Power Market by Regional Market Share Forecast 2028 (% Share)
Figure 5.6 Global Concentrating Solar Power Market by Region Market Forecast 2018-2028 (MW, Global AGR %)
Figure 5.7 Global Concentrating Solar Power Market by Region Market AGR Forecast 2018-2028 (AGR %)
Figure 5.8 Global Concentrating Solar Power Market by Regional Market Share Forecast 2018 (% Share)
Figure 5.9 Global Concentrating Solar Power Market by Regional Market Share Forecast 2023 (% Share)
Figure 5.10 Global Concentrating Solar Power Market by Regional Market Share Forecast 2028 (% Share)
Figure 5.11 US Concentrating Solar Power Market Forecast 2018-2028 (US$mn, Global AGR %)
Figure 5.12 US Concentrating Solar Power Market Forecast 2018-2028 (MW, Global AGR %)
Figure 5.13 U.S. Concentrating Solar Power by Technology Market Forecast 2018-2028 (US$mn)
Figure 5.14 Spain Concentrating Solar Power Market Forecast 2018-2028 (US$mn, Global AGR %)
Figure 5.15 Spain Concentrating Solar Power Market Forecast 2018-2028 (MW, Global AGR %)
Figure 5.16 Spain Concentrating Solar Power by Technology Market Forecast 2018-2028 (US$mn)
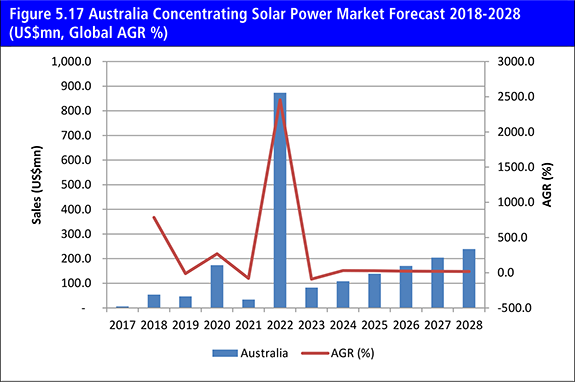
Figure 5.17 Australia Concentrating Solar Power Market Forecast 2018-2028 (US$mn, Global AGR %)
Figure 5.18 Australia Concentrating Solar Power Market Forecast 2018-2028 (MW, Global AGR %)
Figure 5.19 Australia Concentrating Solar Power by Technology Market Forecast 2018-2028 (US$mn)
Figure 5.20 China Concentrating Solar Power Market Forecast 2018-2028 (US$mn, Global AGR %)
Figure 5.21 China Concentrating Solar Power Market Forecast 2018-2028 (MW, Global AGR %)
Figure 5.22 China Concentrating Solar Power by Technology Market Forecast 2018-2028 (US$mn)
Figure 5.23 India Concentrating Solar Power Market Forecast 2018-2028 (US$mn, Global AGR %)
Figure 5.24 India Concentrating Solar Power Market Forecast 2018-2028 (MW, Global AGR %)
Figure 5.25 India Concentrating Solar Power by Technology Market Forecast 2018-2028 (US$mn)
Figure 5.26 Morocco Concentrating Solar Power Market Forecast 2018-2028 (US$mn, Global AGR %)
Figure 5.27 Morocco Concentrating Solar Power Market Forecast 2018-2028 (MW, Global AGR %)
Figure 5.28 Morocco Concentrating Solar Power by Technology Market Forecast 2018-2028 (US$mn)
Figure 5.29 South Africa Concentrating Solar Power Market Forecast 2018-2028 (US$mn, Global AGR %)
Figure 5.30 South Africa Concentrating Solar Power Market Forecast 2018-2028 (MW, Global AGR %)
Figure 5.31 South Africa Concentrating Solar Power by Technology Market Forecast 2018-2028 (US$mn)
Figure 5.32 Chile Concentrating Solar Power Market Forecast 2018-2028 (US$mn, Global AGR %)
Figure 5.33 Chile Concentrating Solar Power Market Forecast 2018-2028 (MW, Global AGR %)
Figure 5.34 Chile Concentrating Solar Power by Technology Market Forecast 2018-2028 (US$mn)
Figure 5.35 Saudi Arabia Concentrating Solar Power Market Forecast 2018-2028 (US$mn, Global AGR %)
Figure 5.36 Saudi Arabia Concentrating Solar Power Market Forecast 2018-2028 (MW, Global AGR %)
Figure 5.37 Saudi Arabia Concentrating Solar Power by Technology Market Forecast 2018-2028 (US$mn)
Figure 5.38 UAE Concentrating Solar Power Market Forecast 2018-2028 (US$mn, Global AGR %)
Figure 5.39 UAE Concentrating Solar Power Market Forecast 2018-2028 (MW, Global AGR %)
Figure 5.40 UAE Concentrating Solar Power by Technology Market Forecast 2018-2028 (US$mn)
Figure 5.41 Rest of the World Concentrating Solar Power Market Forecast 2018-2028 (US$mn, Global AGR %)
Figure 5.42 Rest of the World Concentrating Solar Power Market Forecast 2018-2028 (MW, Global AGR %)
Figure 5.43 Rest of the World Concentrating Solar Power by Technology Market Forecast 2018-2028 (US$mn)
Figure 7.1 Abengoa Solar SA Total Company Sales 2011-2016 (US$m, AGR %)
Figure 7.2 Abengoa Solar SA Sales in the Concentrating Solar Power Market 2011-2016 (US$m, AGR %)
Figure 7.3 Acciona Company Total Company Sales 2011-2016 (US$m, AGR %)
Figure 7.4 Acciona Sales in the Concentrating Solar Power Market 2012-2016 (US$m, AGR %)
Figure 7.5 Solar Millennium AG Total Company Sales 2007-2010 (US$m, AGR %)
Figure 7.6 Siemens AG Total Company Sales 2011-2017 (US$m, AGR %)
Figure 7.7 Siemens AG Sales in the Concentrating Solar Power Market 2014-2017 (US$m, AGR %)
Figure 7.8 SCHOTT AG Company Sales 2011-2016 (US$m, AGR %)
Figure 7.9 TSK Group Total Company Sales 2011-2016 (US$m, AGR %)
Figure 7.10 TSK Group Sales in the Concentrating Solar Power Market 2011-2016 (US$m, AGR %)
Figure 7.11 NextEra Energy Resources, LLC Company Sales 2011-2016 (US$m, AGR %)
Figure 7.12 NextEra Energy Resources, LLC Sales in the Concentrating Solar Power Market 2011-2016 (US$m, AGR %)
Figure 7.13 Engie Group Total Company Sales 2011-2016 (US$m, AGR %)
Figure 7.14 ACWA Power Total Company Sales 2011-2016 (US$m, AGR %)
Figure 7.15 ACWA Power Sales in the Concentrating Solar Power Market 2011-2013 (US$m, AGR %)
Figure 7.16 General Electric Company Total Company Sales 2012-2016 (US$m, AGR %)
Figure 7.17 General Electric Company Sales in the Concentrating Solar Power Market 2014-2016 (US$m, AGR %)


