Visiongain has calculated that the global Geothermal Power Market will see a capital expenditure (CAPEX) of $2,368 mn in 2018. Read on to discover the potential business opportunities available.
Geothermal energy is a clean and renewable energy derived from the heat produced by the slow decay of radioactive particles in the core of the earth. Geothermal reservoirs are located deep underground and can be detected through volcanoes and fumaroles, hot springs and geysers. The most active geothermal resources exist along major tectonic plate boundaries that incorporate maximum volcanic areas. The geothermal energy is mainly used in three main applications including direct use and district heating systems, electricity generation power plants and geothermal heat pumps.
Geothermal energy is considered to be a most sustainable energy source owing to its limited burning of fuels and minimal emission of carbon dioxide and other greenhouse gases. The geothermal power market is mainly driven by the factors including an efficient and sustainable energy source and growing adoption of renewable energy. The limited burning of fuels and minimal emission of carbon dioxide and other greenhouse gases favour the adoption of geothermal energy.
The introduction of favourable government regulations and policies are expected to recover the otherwise untapped huge geothermal potential for low-carbon electricity generation and direct use in cooling and heating. Despite these advantages, the geothermal energy has experienced a low adoption owing to the high initial cost associated with the technology. The increasing demand for reliable and sustainable electricity supply is further expected to boost the demand for geothermal power.
The pressing concerns over global warming and energy security are likely to favour the geothermal power market. As there are significant risks involved with initial exploration and drilling, favourable regulatory environments – including tax incentives and land permits – can do much to facilitate further developments in the sector. Besides from being a clean and renewable energy source, geothermal energy is also suitable for base load electricity generation and thus has the potential to become the backbone of local grid systems.
Visiongain’s Global Geothermal Power Market report can keep you informed and up to date with the developments in the market, segmented in terms of countries: United States, Philippines, Indonesia, Italy, Mexico, Kenya, Iceland, New Zealand, Japan, Turkey, Costa Rica and Ethiopia.
With reference to this report, it details the key investments trend in the global market, subdivided by regions, capital expenditure and equipment. Through extensive secondary research and interviews with industry experts, visiongain has identified a series of market trends that will impact the Geothermal Power Market over the forecast timeframe.
The report will answer questions such as:
– How is the Geothermal Power market evolving?
– What is driving and restraining Geothermal Power market dynamics?
– How will each Geothermal Power submarket segment grow over the forecast period and how much sales and capacity will these submarkets account for in 2028?
– How will market shares of each Geothermal Power submarket develop from 2018-2028?
– Which individual technologies will prevail and how will these shifts be responded to?
– Which Geothermal Power submarket will be the main driver of the overall market from 2018-2028?
– How will political and regulatory factors influence regional Geothermal Power markets and submarkets?
– Will leading national Geothermal Power market broadly follow macroeconomic dynamics, or will individual country sectors outperform the rest of the economy?
– How will market shares of the national markets change by 2028 and which nation will lead the market in 2028?
– Who are the leading players and what are their prospects over the forecast period?
– How will the sector evolve as alliances form during the period between 2018 and 2028?
Five Reasons Why You Must Order and Read This Report Today:
1) The report provides Forecasts for the Geothermal Power Market for the period 2018-2028 by:
– CAPEX (US$mn) 2018-2028
– Capacity (MW) 2018-2028
2) The report provides Forecasts for the Geothermal Power Market by Technology, for the period 2018-2028
– Binary Cycle 2018-2028
– Flash-Binary 2018-2028
– Flash Steam 2018-2028
– Dry Steam 2018-2028
– Others (EGS, Co-Production and Hybrid Generation) 2018-2028
3) The report also Forecasts and Analyses the Geothermal Power Market for Leading Nations By CAPEX & Capacity from 2018-2028
– U.S
– Philippines
– Indonesia
– Italy
– Mexico
– Kenya
– New Zealand
– Iceland
– Kenya
– Japan
– Turkey
– Costa Rica
– Ethiopia
– Rest of the World
4) The report lists Extensive Details and Analysis of Existing and Upcoming Geothermal Power Plants in the Geothermal Power) Market including:
– Plant Name
– Owner/Operator
– Type
– Capacity (MW)
– Capacity
– Year
– Region
– Country
5) The report provides Detailed Profiles of The Leading Companies Operating within the Geothermal Power Market:
– Ormat Technologies Inc.
– Ansaldo Energia
– Mitsubishi Electric Corporation
– General Electric Company
– Toshiba Corporation
– Fuji Electric Co. Ltd.
– Calpine Corporation
– US Geothermal Inc.
– Enel Green Power
– Halliburton
This independent 204-page report guarantees you will remain better informed than your competitors. With 155 tables and figures examining the Geothermal Power market space, the report gives you a direct, detailed breakdown of the market. PLUS, Capital Expenditure, Capacity, by Technology and Nation, as well as in-Depth analysis of leading companies in the Geothermal Power market from 2018-2028 that will keep your knowledge that one step ahead of your rivals.
This report is essential reading for you or anyone in the Energy sector. Purchasing this report today will help you to recognise those important market opportunities and understand the possibilities there. I look forward to receiving your order.
Visiongain is a trading partner with the US Federal Government
CCR Ref number: KD4R6
1. Report Overview
1.1 Global Geothermal Power Market Overview
1.2 Why You Should Read This Report
1.3 How This Report Delivers
1.4 Key Questions Answered by This Analytical Report Include:
1.5 Who is This Report For?
1.6 Methodology
1.6.1 Primary Research
1.6.2 Secondary Research
1.6.3 Market Evaluation & Forecasting Methodology
1.7 Frequently Asked Questions (FAQ)
1.8 Associated Visiongain Reports
1.9 About Visiongain
2. Introduction to the Geothermal Power Market
2.1 Geothermal Power Market Definition
2.2 Geothermal Power Market Structure
2.3 Brief History of Geothermal
2.4 Geothermal Power Plant Technologies
2.4.1 Mainstream Geothermal Power Plant Technologies
2.4.1.1 Dry Steam Power Plants
2.4.1.2 Flash Steam Power Plants
2.4.1.3 Binary Cycle Power Plants
2.4.1.4 Flash-Binary Power Plants
2.4.2 Other Technologies
2.4.2.1 Enhanced Geothermal Systems (EGS)
2.4.2.2 Co-Production
2.4.2.3 Hybrid Generation
2.5 Geothermal Power Plant Development
2.6 Geothermal Power Market Dynamics
2.7 Environmental Factors and the Geothermal Market
2.7.1 Air Pollution
2.7.2 On-Site Chemicals
2.7.3 Land Impacts
2.7.4 Water Impacts
2.7.5 Noise Impacts
2.7.6 Environmental Assessment and Permitting
2.8 List of Existing and Upcoming Geothermal Power Plants
3. Global Geothermal Market 2018-2028
3.1 Global Geothermal Market Forecast 2018-2028
3.2 Geothermal Market Drivers & Restraints 2018
3.2.1 Drivers in the Geothermal Market
3.2.1.2 Growing Adoption of Renewable Energy
3.2.2 Restraints in the Geothermal Market
3.2.2.1 High Initial Cost
4. Global Geothermal Power Market By Technology Forecast 2018-2028
4.1 Global Geothermal Power Market By Dry Steam Forecast 2018-2028
4.2 Global Geothermal Market By Flash Steam Forecast 2018-2028
4.3 Global Geothermal Market By Binary Cycle Forecast 2018-2028
4.4 Global Geothermal Market By Flash Binary Forecast 2018-2028
4.5 Global Geothermal Market By Other Technologies Forecast 2018-2028
5. Leading National Geothermal Power Market Forecast 2018-2028
5.1 The US Geothermal Power Market Forecast 2018-2028
5.2 Philippines Geothermal Power Market Forecast 2018-2028
5.3 Indonesia Geothermal Power Market Forecast 2018-2028
5.4 Italy Geothermal Power Market Forecast 2018-2028
5.5 Mexico Geothermal Power Market Forecast 2018-2028
5.6 Kenya Geothermal Power Market Forecast 2018-2028
5.7 Iceland Geothermal Power Market Forecast 2018-2028
5.8 New Zealand Geothermal Power Market Forecast 2018-2028
5.9 Japan Geothermal Power Market Forecast 2018-2028
5.10 Turkey Geothermal Power Market Forecast 2018-2028
5.11 Costa Rica Geothermal Power Market Forecast 2018-2028
5.12 Ethiopia Geothermal Power Market Forecast 2018-2028
5.13 Rest of the World Geothermal Power Market Forecast 2018-2028
6. SWOT Analysis of the Geothermal Power Market 2018-2028
7. PEST Analysis of the Geothermal Power Market 2018-2028
8. The Leading Companies in the Geothermal Power Market
8.1 Ormat Technologies Inc.
8.1.1 Ormat Technologies Inc. Total Company Sales 2011-2016
8.1.2 Ormat Technologies Inc. Sales in the Geothermal Power Market 2011-2016
8.2 Ansaldo Energia
8.2.1 Ansaldo Energia Total Company Sales 2011-2016
8.3 General Electric Company
8.4 Mitsubishi Heavy Industries Limited
8.4.1 Mitsubishi Heavy Industries Limited Total Company Sales 2011-2016
8.4.2 Mitsubishi Heavy Industries Limited Sales in the Geothermal Power Market 2013-2016
8.5 Toshiba Corporation
8.5.1 Toshiba Corporation Total Company Sales 2013-2016
8.5.2 Toshiba Corporation Sales in Geothermal Power Market 2015-2016
8.6 Fuji Electric Co. Ltd.
8.6.1 Fuji Electric Co. Ltd. Total Company Sales 2011-2016
8.6.2 Fuji Electric Co. Ltd. Sales in the Geothermal Power Market 2012-2016
8.7 Calpine Corporation
8.7.1 Calpine Corporation Total Company Sales 2011-2016
8.8 US Geothermal Inc.
8.8.1 US Geothermal Inc. Total Company Sales 2013-2016
8.9 Enel Green Power
8.9.1 Enel Green Power Total Company Sales 2011-2015
8.10 Halliburton
8.10.1 Halliburton Total Company Sales 2011-2016
8.11 Other Companies Involved in the Geothermal Power Market 2017
9. Conclusions and Recommendations
9.1 Key Findings
9.2 Recommendations
10. Glossary
Appendix
Associated Visiongain Reports
Visiongain Report Sales Order Form
Appendix A
Appendix B
Visiongain Report Evaluation Form
List of Tables
Table 1.1 Leading National Geothermal Power Market Forecast 2018-2028 (Spending US$mn, Capacity MW, Global AGR %, Cumulative)
Table 1.2 Global Geothermal Power By Technology Forecast 2018-2028 (Spending US$mn, Capacity MW, AGR %, CAGR %, Cumulative)
Table 2.1 Layers of the Earth, Corresponding Temperature (°C), Depth (km) and Share in Volume of Earth (%)
Table 2.2 Types and Temperatures (°C) of Geothermal Sources
Table 2.3 Types of Geothermal Power Plants, Basic Methodology, Example, Description
Table 2.4 Phases of Geothermal Projects, Portion of Total Cost (%), Years
Table 2.5 List of Existing and Upcoming Geothermal Power Plants 1911-2015
Table 3.1 Global Geothermal Market Forecast 2018-2028 (US$mn, AGR %, CAGR %, Cumulative)
Table 3.2 Global Geothermal Market Forecast 2018-2028 (MW, AGR %, CAGR %, Cumulative)
Table 3.3 Geothermal Market Drivers & Restraints
Table 4.1 Global Geothermal Power Market By Technology Forecast 2018-2028 (US$mn, AGR %, Cumulative)
Table 4.2 Global Geothermal Power Market By Technology CAGR Forecast 2018-2023, 2023-2028, 2018-2028 (CAGR %)
Table 4.3 Global Geothermal Power Market By Dry Steam Forecast 2018-2028 (US$mn, AGR %, CAGR %, Cumulative)
Table 4.4 Global Geothermal Market By Flash Steam Forecast 2018-2028 (US$mn, AGR %, CAGR %, Cumulative)
Table 4.5 Global Geothermal Market By Binary Cycle Forecast 2018-2028 (US$mn, AGR %, CAGR %, Cumulative)
Table 4.6 Global Geothermal Market By Flash Binary Forecast 2018-2028 (US$mn, AGR %, CAGR %, Cumulative)
Table 4.7 Global Geothermal Market By Other Technologies Forecast 2018-2028 (US$mn, AGR %, CAGR %, Cumulative)
Table 5.1 Leading National Geothermal Power Market Forecast 2018-2028 (US$mn, Global AGR %, Cumulative)
Table 5.2 National Geothermal Power Market Percentage Change in Market Share 2018-2023, 2023-2028, 2018-2028 (% Change)
Table 5.3 Leading National Geothermal Power Market Forecast 2018-2028 (MW, Global AGR %, Cumulative)
Table 5.4 National Geothermal Power Market Percentage Change in Market Share 2018-2023, 2023-2028, 2018-2028 (% Change)
Table 5.5 US Geothermal Power Market Forecast 2018-2028 (US$mn, AGR %, CAGR %, Cumulative)
Table 5.6 US Geothermal Power Market Forecast 2018-2028 (MW, AGR %, CAGR %, Cumulative)
Table 5.7 List of Announced US Geothermal Power Developments
Table 5.8 Philippines Geothermal Power Market Forecast 2018-2028 (US$mn, AGR %, CAGR %, Cumulative)
Table 5.9 Philippines Geothermal Power Market Forecast 2018-2028 (MW, AGR %, CAGR %, Cumulative)
Table 5.10 List of Announced Philippines Geothermal Power Developments
Table 5.11 Indonesia Geothermal Power Market Forecast 2018-2028 (US$mn, AGR %, CAGR %, Cumulative)
Table 5.12 Indonesia Geothermal Power Market Forecast 2018-2028 (MW, AGR %, CAGR %, Cumulative)
Table 5.13 List of Announced Indonesia Geothermal Power Developments
Table 5.14 List of Announced Italy Geothermal Power Developments
Table 5.15 Mexico Geothermal Power Market Forecast 2018-2028 (US$mn, AGR %, CAGR %, Cumulative)
Table 5.16 Mexico Geothermal Power Market Forecast 2018-2028 (MW, AGR %, CAGR %, Cumulative)
Table 5.17 List of Announced Mexico Geothermal Power Developments
Table 5.18 Kenya Geothermal Power Market Forecast 2018-2028 (US$mn, AGR %, CAGR %, Cumulative)
Table 5.19 Kenya Geothermal Power Market Forecast 2018-2028 (MW, AGR %, CAGR %, Cumulative)
Table 5.20 List of Announced Kenya Geothermal Power Developments
Table 5.21 Iceland Geothermal Power Market Forecast 2018-2028 (US$mn, AGR %, CAGR %, Cumulative)
Table 5.22 Iceland Geothermal Power Market Forecast 2018-2028 (MW, AGR %, CAGR %, Cumulative)
Table 5.23 List of Announced Iceland Geothermal Power Developments
Table 5.24 New Zealand Geothermal Power Market Forecast 2018-2028 (US$mn, AGR %, CAGR %, Cumulative)
Table 5.25 New Zealand Geothermal Power Market Forecast 2018-2028 (MW, AGR %, CAGR %, Cumulative)
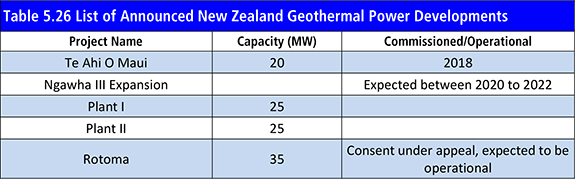
Table 5.26 List of Announced New Zealand Geothermal Power Developments
Table 5.27 Japan Geothermal Power Market Forecast 2018-2028 (US$mn, AGR %, CAGR %, Cumulative)
Table 5.28 Japan Geothermal Power Market Forecast 2018-2028 (MW, AGR %, CAGR %, Cumulative)
Table 5.29 List of Announced Japan Geothermal Power Developments
Table 5.30 Turkey Geothermal Power Market Forecast 2018-2028 (US$mn, AGR %, CAGR %, Cumulative)
Table 5.31 Turkey Geothermal Power Market Forecast 2018-2028 (MW, AGR %, CAGR %, Cumulative)
Table 5.32 List of Announced Turkey Geothermal Power Developments
Table 5.33 Costa Rica Geothermal Power Market Forecast 2018-2028 (US$mn, AGR %, CAGR %, Cumulative)
Table 5.34 Costa Rica Geothermal Power Market Forecast 2018-2028 (MW, AGR %, CAGR %, Cumulative)
Table 5.35 List of Announced Costa Rica Geothermal Power Developments
Table 5.36 Ethiopia Geothermal Power Market Forecast 2018-2028 (US$mn, AGR %, CAGR %, Cumulative)
Table 5.37 Ethiopia Geothermal Power Market Forecast 2018-2028 (MW, AGR %, CAGR %, Cumulative)
Table 5.38 List of Announced Ethiopia Geothermal Power Developments
Table 5.39 Rest of the World Geothermal Power Market Forecast 2018-2028 (US$mn, AGR %, CAGR %, Cumulative)
Table 5.40 Rest of the World Geothermal Power Market Forecast 2018-2028 (MW, AGR %, CAGR %, Cumulative)
Table 6.1 Global Geothermal Power Market SWOT Analysis 2018-2028
Table 7.1 Global Geothermal Power Market PEST Analysis 2018-2028
Table 8.1 Ormat Technologies Inc. 2017 (CEO, Total Company Sales US$m, Sales from Company Division that includes Geothermal Power (US$m), Share of Total Company Sales from Company Division that includes Geothermal Power (%), Net Income / Loss US$m, Net Capital Expenditure US$m, Strongest Business Region, Business Segment in the Market, HQ, Founded, No. of Employees, IR Contact, Ticker, Website)
Table 8.2 Ormat Technologies Inc. Total Company Sales 2010-2016 (US$m, AGR %)
Table 8.3 Ormant Technologies Inc. Sales in the Geothermal Power Market 2010-2016 (US$m, AGR %)
Table 8.4 Ansaldo Energia 2017 (CEO, Total Company Sales US$m, Sales from Company Division that includes Geothermal Power (US$m), Share of Total Company Sales from Company Division that includes Geothermal Power (%), Net Income / Loss US$m, Net Capital Expenditure US$m, Strongest Business Region, Business Segment in the Market, HQ, Founded, No. of Employees, IR Contact, Ticker, Website)
Table 8.5 Ansaldo Energia Total Company Sales 2010-2016 (US$m, AGR %)
Table 8.6 General Electric Company 2017 (CEO, Total Company Sales US$m, Sales from Company Division that includes Geothermal Power (US$m), Share of Total Company Sales from Company Division that includes Geothermal Power (%), Net Income / Loss US$m, Net Capital Expenditure US$m, Strongest Business Region, Business Segment in the Market, HQ, Founded, No. of Employees, IR Contact, Ticker, Website)
Table 8.7 General Electric Company Total Company Sales 2011-2016 (US$m, AGR %)
Table 8.8 General Electric Company Sales in the Geothermal Power Market 2011-2016 (US$m, AGR %)
Table 8.9 Mitsubishi Heavy Industries Limited 2017 (CEO, Total Company Sales US$m, Sales from Company Division that includes Geothermal Power (US$m), Share of Total Company Sales from Company Division that includes Geothermal Power (%), Net Income / Loss US$m, Net Capital Expenditure US$m, Strongest Business Region, Business Segment in the Market, HQ, Founded, No. of Employees, IR Contact, Ticker, Website)
Table 8.10 Mitsubishi Heavy Industries Limited Total Company Sales 2010-2016 (US$m, AGR %)
Table 8.11 Mitsubishi Heavy Industries Limited Sales in the Geothermal Power Market 2012-2016 (US$m, AGR %)
Table 8.12 Toshiba Corporation Profile 2017 (CEO, Total Company Sales US$m, Sales from Company Division that includes Geothermal Power (US$m), Share of Total Company Sales from Company Division that includes Geothermal Power (%), Net Income / Loss US$m, Net Capital Expenditure US$m, Strongest Business Region, Business Segment in the Market, HQ, Founded, No. of Employees, IR Contact, Ticker, Website)
Table 8.13 Toshiba Corporation Total Company Sales 2012-2016 (US$m, AGR %)
Table 8.14 Toshiba Corporation Sales in the Geothermal Power Market 2015-2016 (US$m, AGR %)
Table 8.15 Fuji Electric Co. Ltd. Profile 2017 (CEO, Total Company Sales US$m, Sales from Company Division that includes Geothermal Power (US$m), Share of Total Company Sales from Company Division that includes Geothermal Power (%), Net Income / Loss US$m, Net Capital Expenditure US$m, Strongest Business Region, Business Segment in the Market, HQ, Founded, No. of Employees, IR Contact, Ticker, Website)
Table 8.16 Fuji Electric Co. Ltd. Total Company Sales 2010-2016 (US$m, AGR %)
Table 8.17 Fuji Electric Co. Ltd. Sales in the Geothermal Power Market 2011-2016 (US$m, AGR %)
Table 8.18 Calpine Corporation 2017 (CEO, Total Company Sales US$m, Sales in the Market US$m, Share of Company Sales from Geothermal Power Market %, Net Income / Loss US$m, Net Capital Expenditure US$m, Strongest Business Region, Business Segment in the Market, HQ, Founded, No. of Employees, IR Contact, Ticker, Website)
Table 8.19 Calpine Corporation Total Company Sales 2010-2016 (US$m, AGR %)
Table 8.20 US Geothermal Inc. 2017 (CEO, Total Company Sales US$m, Sales in the Market US$m, Share of Company Sales from Geothermal Power Market %, Net Income / Loss US$m, Net Capital Expenditure US$m, Strongest Business Region, Business Segment in the Market, HQ, Founded, No. of Employees, IR Contact, Ticker, Website)
Table 8.21 US Geothermal Inc. Total Company Sales 2012-2016 (US$m, AGR %)
Table 8.22 Enel Green Power 2017 (CEO, Total Company Sales US$m, Sales in the Market US$m, Share of Company Sales from Geothermal Power Market %, Net Income / Loss US$m, Net Capital Expenditure US$m, Strongest Business Region, Business Segment in the Market, HQ, Founded, No. of Employees, IR Contact, Ticker, Website)
Table 8.23 Enel Green Power Total Company Sales 2010-2015 (US$m, AGR %)
Table 8.24 Halliburton Profile 2017 (CEO, Total Company Sales US$m, Sales in the Market US$m, Share of Company Sales from Geothermal Power Market %, Net Income / Loss US$m, Net Capital Expenditure US$m, Strongest Business Region, Business Segment in the Market, HQ, Founded, No. of Employees, IR Contact, Ticker, Website)
Table 8.25 Halliburton Total Company Sales 2010-2016 (US$m, AGR %)
Table 8.26 Other Companies Involved in the Geothermal Power Market 2017 (Company, Location)
Table 9.1 Global Geothermal Power Market By Technology Forecast 2018-2028 (US$mn, AGR %, Cumulative)
Table 9.2 Leading National Geothermal Power Market Forecast 2018-2028 (US$mn, Global AGR %, Cumulative)
Table 9.3 Leading National Geothermal Power Market Forecast 2018-2028 (MW, Global AGR %, Cumulative)
List of Figures
Figure 2.1 Global Geothermal Power Market Segmentation Overview
Figure 3.1 Global Geothermal Market Forecast 2018-2028 (US$mn, AGR %)
Figure 3.2 Global Geothermal Market Forecast 2018-2028 (MW, AGR %)
Figure 4.1 Global Geothermal Power Market By Technology AGR Forecast 2018-2028 (AGR %)
Figure 4.2 Global Geothermal Power Market By Technology Forecast 2018-2028 (US$mn, Global AGR %)
Figure 4.3 Global Geothermal Power Market By Technology Share Forecast 2018 (% Share)
Figure 4.4 Global Geothermal Power Market By Technology Share Forecast 2023 (% Share)
Figure 4.5 Global Geothermal Power Market By Technology Share Forecast 2028 (% Share)
Figure 4.6 Global Geothermal Power Market By Dry Steam Forecast 2018-2028 (US$mn, Global AGR %)
Figure 4.7 Share of Dry Steam in Global Geothermal Power Market 2018-2028 (%)
Figure 4.8 Global Geothermal Market By Flash Steam Forecast 2018-2028 (US$mn, Global AGR %)
Figure 4.9 Share of Flash Steam in Global Geothermal Market 2018-2028 (%)
Figure 4.10 Global Geothermal Market By Binary Cycle Forecast 2018-2028 (US$mn, Global AGR %)
Figure 4.11 Share of Binary Cycle in Global Geothermal Market 2018-2028 (%)
Figure 4.12 Global Geothermal Market By Flash Binary Forecast 2018-2028 (US$mn, Global AGR %)
Figure 4.13 Share of Flash Binary in Global Geothermal Market 2018-2028 (%)
Figure 4.14 Global Geothermal Market By Other Technologies Forecast 2018-2028 (US$mn, Global AGR %)
Figure 4.15 Share of Other Technologies in Global Geothermal Market 2018-2028 (%)
Figure 5.1 Global Geothermal Power Market by Country Forecast 2018-2028 (US$mn, Global AGR %)
Figure 5.2 Global Geothermal Power Market by Country AGR Forecast 2018-2028 (AGR %)
Figure 5.3 Global Geothermal Power Market by Country Share Forecast 2018 (% Share)
Figure 5.4 Global Geothermal Power Market by Country Share Forecast 2023 (% Share)
Figure 5.5 Global Geothermal Power Market by Country Share Forecast 2028 (% Share)
Figure 5.6 Global Geothermal Power Market by Country Forecast 2018-2028 (MW, Global AGR %)
Figure 5.7 Global Geothermal Power Market by Country AGR Forecast 2018-2028 (AGR %)
Figure 5.8 Global Geothermal Power Market by Country Share Forecast 2018 (% Share)
Figure 5.9 Global Geothermal Power Market by Country Share Forecast 2023 (% Share)
Figure 5.10 Global Geothermal Power Market by Country Share Forecast 2028 (% Share)
Figure 5.11 U.S. Geothermal Power Market Forecast 2018-2028 (US$mn)
Figure 5.12 U.S. Geothermal Power Market Forecast 2018-2028 (MW)
Figure 5.13 Philippines Geothermal Power Market Forecast 2018-2028 (US$mn)
Figure 5.14 Philippines Geothermal Power Market Forecast 2018-2028 (MW)
Figure 5.15 Indonesia Geothermal Power Market Forecast 2018-2028 (US$mn)
Figure 5.16 Indonesia Geothermal Power Market Forecast 2018-2028 (MW)
Figure 5.17 Mexico Geothermal Power Market Forecast 2018-2028 (US$mn)
Figure 5.18 Mexico Geothermal Power Market Forecast 2018-2028 (MW)
Figure 5.19 Kenya Geothermal Power Market Forecast 2018-2028 (US$mn)
Figure 5.20 Kenya Geothermal Power Market Forecast 2018-2028 (MW)
Figure 5.21 Iceland Geothermal Power Market Forecast 2018-2028 (US$mn)
Figure 5.22 Iceland Geothermal Power Market Forecast 2018-2028 (MW)
Figure 5.23 New Zealand Geothermal Power Market Forecast 2018-2028 (US$mn)
Figure 5.24 New Zealand Geothermal Power Market Forecast 2018-2028 (MW)
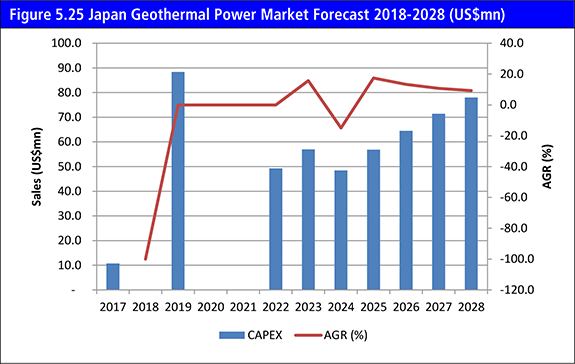
Figure 5.25 Japan Geothermal Power Market Forecast 2018-2028 (US$mn)
Figure 5.26 Japan Geothermal Power Market Forecast 2018-2028 (MW)
Figure 5.27 Turkey Geothermal Power Market Forecast 2018-2028 (US$mn)
Figure 5.28 Turkey Geothermal Power Market Forecast 2018-2028 (MW)
Figure 5.29 Costa Rica Geothermal Power Market Forecast 2018-2028 (US$mn)
Figure 5.30 Costa Rica Geothermal Power Market Forecast 2018-2028 (MW)
Figure 5.31 Ethiopia Geothermal Power Market Forecast 2018-2028 (US$mn)
Figure 5.32 Ethiopia Geothermal Power Market Forecast 2018-2028 (MW)
Figure 5.33 Rest of the World Geothermal Power Market Forecast 2018-2028 (US$mn)
Figure 5.34 Rest of the World Geothermal Power Market Forecast 2018-2028 (MW)
Figure 8.1 Ormat Technologies Inc. Total Company Sales 2011-2016 (US$m, AGR %)
Figure 8.2 Ormat Technologies Inc. Sales in the Geothermal Power Market 2011-2016 (US$m, AGR %)
Figure 8.3 Ansaldo Energia Total Company Sales 2011-2016 (US$m, AGR %)
Figure 8.4 General Electric Company Total Company Sales 2012-2016 (US$m, AGR %)
Figure 8.5 General Electric Company Sales in the Geothermal Power Market 2012-2016 (US$m, AGR %)
Figure 8.6 Mitsubishi Heavy Industries Limited Total Company Sales 2011-2016 (US$m, AGR %)
Figure 8.7 Mitsubishi Heavy Industries Limited Sales in the Geothermal Power Market 2013-2016 (US$m, AGR %)
Figure 8.8 Toshiba Corporation Total Company Sales 2013-2016 (US$m, AGR %)
Figure 8.9 Toshiba Corporation Sales in the Geothermal Power Market 2015-2016 (US$m, AGR %)
Figure 8.10 Fuji Electric Co. Ltd. Total Company Sales 2011-2016 (US$m, AGR %)
Figure 8.11 Fuji Electric Co. Ltd. Sales in the Geothermal Power Market 2012-2016 (US$m, AGR %)
Figure 8.12 Calpine Corporation Company Sales 2011-2016 (US$m, AGR %)
Figure 8.13 US Geothermal Inc. Total Company Sales 2013-2016 (US$m, AGR %)
Figure 8.14 Enel Green Power Company Sales 2011-2015 (US$m, AGR %)
Figure 8.15 Halliburton Total Company Sales 2011-2016 (US$m, AGR %)