• Do you need definitive BIPV market data?
• Succinct BIPV market analysis?
• Sectoral insights?
• Clear competitor analysis?
• Actionable business recommendations?
Read on to discover how this definitive report can transform your own research and save you time.
This market is expected to grow at a faster pace, owing to supportive government policies and attractive incentives and tax exemptions are the prime factors propelling the demand of BIPV globally. However, factors such as high initial cost and increasing adoption of other renewable technologies such as wind energy, solar PV, etc. may hamper the growth of the BIPV market. Spain accounts for the largest market share for the BIPV market, due to the favorable geographic condition and growing demand of sustainable energy over fossil fuel.
Visiongain calculates that the building integrated photovoltaic market will reach $7.9bn in 2019. Furthermore, the period 2019-2029 will see a significant growth in the adoption of Building integrated photovoltaic (BIPV).
Report highlights
106 quantitative tables, charts, and graphs
Analysis of Key Players in Building integrated photovoltaic (BIPV) Market
• SunPower
• Alta Devices
• Enecoms.r.l
• Flisom AG
• Global Solar Energy
• PowerFilm Solar Inc
• Solbian Energie Alternative
• Sunflare
• Shenzhen Sungold Solar
• SoloPower Systems
Global Building integrated photovoltaic BIPV Market Outlook and Analysis From 2019-2029
Global Building integrated photovoltaic (BIPV) Market by Submarket Projections Analysis and Potential From 2019-2029:
• Application
– Portable
– Distributed Power Generation
– Utility Scale Power
• Building Type
– Commercial Building
– Healthcare Organization
– Education Institution
– Other
Regional Building integrated photovoltaic (BIPV) Forecasts From 2019-2029
• US BIPV Forecast 2019-2029
• Canada BIPV Forecast 2019-2029
• Mexico BIPV Forecast 2019-2029
• Germany BIPV Forecast 2019-2029
• UK BIPV Forecast 2019-2029
• France BIPV Forecast 2019-2029
• Italy BIPV Forecast 2019-2029
• Spain BIPV Forecast 2019-2029
• Other European Countries BIPV Forecast 2019-2029
• China BIPV Forecast 2019-2029
• India BIPV Forecast 2019-2029
• Japan BIPV Forecast 2019-2029
• Australia BIPV Forecast 2019-2029
• South Korea BIPV Forecast 2019-2029
• Rest of APAC BIPV Forecast 2019-2029
• Argentina BIPV Forecast 2019-2029
• Saudi Arabia BIPV Forecast 2019-2029
• Brazil BIPV Forecast 2019-2029
• Rest of the World BIPV Forecast 2019-2029
Why you must buy this report
This report features news, insights, and the latest developments and with up-to-date analysis as well as tables, graphs and charts. This report is a vital addition to gaining an understanding of this market sector and will give your company ‘the edge’ on your competitors. You cannot afford to be without this latest report from Visiongain.
Who should read this report?
• Solar power companies
• Utility companies
• Renewable companies
• Electronics companies
• Component suppliers
• Energy storage specialists
• Engineers
• R&D staff
• Market analysts
• Consultants
• Executives
• Business development managers
• Investors
• Banks
• Industry associations
• Regulators
• Government departments
Key questions answered
• How is the BIPV market evolving?
• What is driving and restraining BIPV market dynamics?
• How will each BIPV submarket segment grow over the forecast period and how much sales will these submarkets account for in 2029?
• How will market shares of each BIPV submarket develop from 2019-2029?
• Which individual technologies will prevail and how will these shifts be responded to?
• Which BIPV submarket will be the main driver of the overall market from 2019-2029?
• How will political and regulatory factors influence national BIPV markets and submarkets?
• How will market shares of the national markets change by 2029 and which nation will lead the market in 2029?
• Who are the leading players and what are their prospects over the forecast period?
• How will the sector evolve as alliances form during the period between 2019 and 2029?
Visiongain is a trading partner with the US Federal Government
CCR Ref number: KD4R6
Do you have any custom requirements we can help you with? Any need for specific country, geo region, market segment or specific company information? Contact us today, we can discuss your needs and see how we can help: sara.peerun@visiongain.com
1. Report Overview
1.1 Global Building Integrated Photovoltaic Solar Power Overview
1.2 Global Building Integrated Photovoltaic Solar Power Market Segmentation
1.3 Global Building Integrated Photovoltaic Solar Power Market by Building Type
1.4 Global Building Integrated Photovoltaic Solar Power Market by Application
1.5 How this Report Delivers
1.6 Key Questions Answered by This Analytical Report Include:
1.7 Who is this report for?
1.8 Methodology
1.9 Frequently Asked Questions (FAQ)
1.10 Associated Visiongain Reports
1.11 About Visiongain
2. Executive Summary
2.1 What is Building Integrated Photovoltaic Solar Power?
2.2 Building Integrated Photovoltaic Solar Power, By Application and Building Type
2.3 Market Insights
3. Market Overview
3.1 Introduction
3.2 Market Segmentation
3.3 Global Building Integrated Photovoltaic Solar Power Market Forecast 2019-2029
3.4 Building Integrated Photovoltaic Solar Power Market Dynamics
3.4.1 Drivers
3.4.1.1 Increasing Government Support
3.4.1.2 Increasing demand for the better alternatives
3.4.2 Restraints
3.4.2.1 High Cost of Panels
3.5.3 Opportunities
3.8 Industry Analysis
3.8 Supply Chain Analysis
3.9 Solar Energy Incentive Programs
3.9.1 Solar renewable energy certificates (SREC)
3.9.2 Feed in tariffs (FIT)
4. Building Integrated Photovoltaic Solar Power Market by Application Sectors 2019-2029
4.1 Introduction
4.2 Building Integrated Photovoltaic Solar Power Application Summary
4.3 Portable Application Building Integrated Photovoltaic Solar Power Forecast & Analysis 2019-2029
4.4 Distributed Power Generation Building Integrated Photovoltaic Solar Power Forecast & Analysis 2019-2029
4.4 Utility Scale Power Building Integrated Photovoltaic Solar Power Forecast & Analysis 2019-2029
5. Building Integrated Photovoltaic Solar Power Market by Building Type 2019-2029
5.1 Introduction
5.2 Building Integrated Photovoltaic Solar Power by Building Type Summary
5.3 Commercial Building Integrated Photovoltaic Solar Power Forecast & Analysis 2019-2029
5.4 Healthcare Organization Building Integrated Photovoltaic Solar Power Forecast & Analysis 2019-2029
5.5 Education Institution Building Integrated Photovoltaic Solar Power Forecast & Analysis 2019-2029
5.6 Others Building Integrated Photovoltaic Solar Power Forecast & Analysis 2019-2029
6. PEST Analysis of the Building Integrated Photovoltaic Solar Power Market 2019-2029
7. Building Integrated Photovoltaic Solar Power Markets, By Geography 2019-2029
7.1 Introduction
7.2 Building Integrated Photovoltaic Solar Power by Region Summary
7.3 North America Building Integrated Photovoltaic Solar Power Forecast & Analysis 2019-2029
7.3.1 U.S. Building Integrated Photovoltaic Solar Power Forecast & Analysis 2019-2029
7.3.2 Canada Building Integrated Photovoltaic Solar Power Forecast & Analysis 2019-2029
7.3.3 Mexico Building Integrated Photovoltaic Solar Power Forecast & Analysis 2019-2029
7.4 Europe Building Integrated Photovoltaic Solar Power Forecast & Analysis 2019-2029
7.4.1 Germany Building Integrated Photovoltaic Solar Power Forecast & Analysis 2019-2029
7.4.3 U.K. Building Integrated Photovoltaic Solar Power Forecast & Analysis 2019-2029
7.4.4 France Building Integrated Photovoltaic Solar Power Forecast & Analysis 2019-2029
7.4.4 Italy Building Integrated Photovoltaic Solar Power Forecast & Analysis 2019-2029
7.4.4 Spain Building Integrated Photovoltaic Solar Power Forecast & Analysis 2019-2029
7.4.6 Other European Countries Building Integrated Photovoltaic Solar Power Forecast & Analysis 2019-2029
7.5 Asia Pacific Building Integrated Photovoltaic Solar Power Forecast & Analysis 2019-2029
7.5.1 China Building Integrated Photovoltaic Solar Power Forecast & Analysis 2019-2029
7.5.2 India Building Integrated Photovoltaic Solar Power Forecast & Analysis 2019-2029
7.5.3 Japan Building Integrated Photovoltaic Solar Power Forecast & Analysis 2019-2029
7.5.4 Australia Building Integrated Photovoltaic Solar Power Forecast & Analysis 2019-2029
7.5.4 South Korea Building Integrated Photovoltaic Solar Power Forecast & Analysis 2019-2029
7.5.5 Rest of Asia Pacific Countries Building Integrated Photovoltaic Solar Power Forecast & Analysis 2019-2029
7.6 Rest of the World Building Integrated Photovoltaic Solar Power Forecast & Analysis 2019-2029
7.6.1 Argentina Building Integrated Photovoltaic Solar Power Forecast & Analysis 2019-2029
7.6.2 Saudi Arabia Building Integrated Photovoltaic Solar Power Forecast & Analysis 2019-2029
7.6.3 Brazil Building Integrated Photovoltaic Solar Power Forecast & Analysis 2019-2029
7.6.4 Remaining Countries Building Integrated Photovoltaic Solar Power Forecast & Analysis 2019-2029
8. SWOT Analysis of the Building Integrated Photovoltaic Solar Power Market 2019-2029
9. Leading Companies in the Building Integrated Photovoltaic Solar Power Market
9.1 SunPower Corporation
9.1.1 SunPower Corporation Overview
9.1.2 SunPower Corporation Financial Performance
9.1.3 SunPower Corporation Products/Services
9.1.4 SunPower Corporation Recent Development
9.2 Alta Devices
9.2.1 Alta Devices Overview
9.2.2 Alta Devices Financial Performance
9.2.3 Alta Devices Products/Services
9.2.4 Alta Devices Recent Development
9.3 Enecoms.r.l.
9.3.1 Enecoms.r.l. Overview
9.3.2 Enecoms.r.l. Financial Performance
9.3.3 Enecoms.r.l. Products/Services
9.3.4 Enecoms.r.l. Recent Development
9.4 Flisom AG
9.4.1 Flisom AG Overview
9.4.2 Flisom AG Financial Performance
9.4.3 Flisom AG Products/Services
9.4.4 Flisom AG Recent Development
9.5 Global Solar Energy, Inc.
9.5.1 Global Solar Energy, Inc. Overview
9.5.2 Global Solar Energy, Inc. Financial Performance
9.5.3 Global Solar Energy, Inc. Products/Services
9.4.4 Global Solar Energy, Inc. Services Recent Development
9.6 PowerFilm Solar Inc.
9.6.1 PowerFilm Solar Inc. Overview
9.6.2 PowerFilm Solar Inc. Financial Performance
9.6.3 PowerFilm Solar Inc. Products/Services
9.6.4 PowerFilm Solar Inc. Services Recent Development
9.7 SolbianEnergie Alternative srl
9.7.1 SolbianEnergie Alternative srl Overview
9.7.2 SolbianEnergie Alternative srl Financial Performance
9.7.3 SolbianEnergie Alternative srl Products/Services
9.7.4 SolbianEnergie Alternative srl Services Recent Development
9.8 Sunflare
9.8.1 Sunflare Overview
9.8.2 Sunflare Financial Performance
9.8.3 Sunflare Products/Services
9.8.4 Sunflare Services Recent Development
9.9 SHENZHEN SUNGOLD SOLAR CO., LTD
9.9.1 SHENZHEN SUNGOLD SOLAR CO., LTD Overview
9.9.2 SHENZHEN SUNGOLD SOLAR CO., LTD Financial Performance
9.9.3 SHENZHEN SUNGOLD SOLAR CO., LTD
9.9.4 SHENZHEN SUNGOLD SOLAR CO., LTD Services Recent Development
9.10 SoloPower Systems, Inc.
9.10.1 SoloPower Systems, Inc. Overview
9.10.2 SoloPower Systems, Inc. Financial Performance
9.10.3 SoloPower Systems, Inc. Products/Services
9.10.4 SoloPower Systems, Inc. Services Recent Development
10. Conclusions
10.1 Building Integrated Photovoltaic Solar Power Market Study Conclusion
11. Glossary
Associated Visiongain Reports
Visiongain Report Sales Order Form
Appendix A
About Visiongain
Appendix B
Visiongain Report Evaluation Form
List of Tables
Table 3.1 Global Building Integrated Photovoltaic Solar Power Market Forecast 2019-2029 ($Mn, CAGR %, CAGR %)
Table 4.1 Building Integrated Photovoltaic Solar Power Market by Application Forecast 2019-2029 ($Mn, AGR %, CAGR %)
Table 4.2 Building Integrated Photovoltaic Solar Power Market by Type Forecast CAGR (%) 2019-2029, 2019-2024, and 2024-2029
Table 4.3 Building Integrated Photovoltaic Solar Power Market for Portable Forecast 2019-2029 ($Mn, AGR %, CAGR %)
Table 4.4 Building Integrated Photovoltaic Solar Power Market for Distributed Power Generation Forecast 2019-2029 ($Mn, AGR %, CAGR %)
Table 4.5 Building Integrated Photovoltaic Solar Power Market for Utility Scale Power Forecast 2019-2029 ($Mn, AGR %, CAGR %)
Table 5.1 Building Integrated Photovoltaic Solar Power Market by Building Type Forecast 2019-2029 ($Mn, AGR %, CAGR %)
Table 5.2 Building Integrated Photovoltaic Solar Power Market by Building Type Forecast CAGR (%) 2019-2029, 2019-2024, and 2024-2029
Table 5.3 Commercial Building Integrated Photovoltaic Solar Power Market Forecast 2019-2029 ($Mn, AGR %, CAGR %)
Table 5.4 Healthcare Organization Building Integrated Photovoltaic Solar Power Market Forecast 2019-2029 ($Mn, AGR %, CAGR %)
Table 5.5 Education Institution Building Integrated Photovoltaic Solar Power Market Forecast 2019-2029 ($Mn, AGR %, CAGR %)
Table 5.6 Other Building Integrated Photovoltaic Solar Power Market Forecast 2019-2029 ($Mn, AGR %, CAGR %)
Table 6.1 PEST Analysis of the Building Integrated Photovoltaic Solar Power Market 2019-2029
Table 7.1 Building Integrated Photovoltaic Solar Power Market by Region Forecast 2019-2029 ($Mn, AGR %)
Table 7.2 North America Building Integrated Photovoltaic Solar Power Market Forecast by
Country 2019-2029 ($Million, CAGR %)
Table 7.3 U.S. Building Integrated Photovoltaic Solar Power Market Forecast 2019-2029 ($Million, AGR %, CAGR %)
Table 7.4 Canada Building Integrated Photovoltaic Solar Power Market Forecast 2019-2029 ($Million, AGR %, CAGR %)
Table 7.5 Mexico Building Integrated Photovoltaic Solar Power Market Forecast 2019-2029 ($Million, AGR %, CAGR %)
Table 7.6 Europe Building Integrated Photovoltaic Solar Power Market Forecast by Country 2019-2029 ($Million, CAGR %)
Table 7.7 Germany Building Integrated Photovoltaic Solar Power Market Forecast 2019-2029 ($Million, AGR %, CAGR %)
Table 7.8 The U.K. Building Integrated Photovoltaic Solar Power Market Forecast 2019-2029 ($Million, AGR %, CAGR %)
Table 7.9 France Building Integrated Photovoltaic Solar Power Market Forecast 2019-2029 ($Million, AGR %, CAGR %)
Table 7.10 Italy Building Integrated Photovoltaic Solar Power Market Forecast 2019-2029 ($Million, AGR %, CAGR %)
Table 7.11 Spain Building Integrated Photovoltaic Solar Power Market Forecast 2019-2029 ($Million, AGR %, CAGR %)
Table 7.12 Other European Countries Building Integrated Photovoltaic Solar Power Market Forecast 2019-2029 ($Million, AGR %, CAGR %, Cumulative)
Table 7.13 Asia Pacific Building Integrated Photovoltaic Solar Power Market Forecast by Country 2019-2029 ($Million, CAGR %)
Table 7.14 China Building Integrated Photovoltaic Solar Power Market Forecast 2019-2029 ($Million, AGR %, CAGR %)
Table 7.15 India Building Integrated Photovoltaic Solar Power Market Forecast 2019-2029 ($Million, AGR %, CAGR %)
Table 7.16 Japan Building Integrated Photovoltaic Solar Power Market Forecast 2019-2029 ($Million, AGR %, CAGR %)
Table 7.17 Australia Building Integrated Photovoltaic Solar Power Market Forecast 2019-2029 ($Million, AGR %, CAGR %)
Table 7.18 South Korea Building Integrated Photovoltaic Solar Power Market Forecast 2019-2029 ($Million, AGR %, CAGR %)
Table 7.19 Rest of Asia Pacific Building Integrated Photovoltaic Solar Power Market Forecast 2019-2029 ($Million, AGR %, CAGR %)
Table 7.20 Rest of the World Building Integrated Photovoltaic Solar Power Market Forecast by Country 2019-2029 ($Million, CAGR %)
Table 7.21 Argentina Building Integrated Photovoltaic Solar Power Market Forecast 2019-2029 ($Million, AGR %, CAGR %)
Table 7.22 Saudi Arabia Building Integrated Photovoltaic Solar Power Market Forecast 2019-2029 ($Million, AGR %, CAGR %)
Table 7.23 Brazil Building Integrated Photovoltaic Solar Power Market Forecast 2019-2029 ($Million, AGR %, CAGR %)
Table 7.24 Rest of World Building Integrated Photovoltaic Solar Power Market Forecast 2019-2029 ($Million, AGR %, CAGR %)
Table 8.1 SWOT Analysis of the Building Integrated Photovoltaic Solar Power Market 2019-2029
Table 9.1 SunPower Corporation Overview 2018 (Total Revenue, CEO, HQ, Number of Employees, Contact, Website)
Table 9.2 SunPower Corporation Building Integrated Photovoltaic Solar Power Products/Services 2018 (Products & Specification)
Table 9.3 SunPower Corporation Building Integrated Photovoltaic Solar Power Recent Development 2018
Table 9.4 Alta Devices Overview 2018 (Total Revenue, CEO, HQ, Number of Employees, Contact, Website)
Table 9.5 Alta Devices Building Integrated Photovoltaic Solar Power Products/Services 2018 (Products & Specification)
Table 9.6 Alta Devices Building Integrated Photovoltaic Solar Power Recent Development 2018
Table 9.7 Enecoms.r.l. Overview 2018 (Total Revenue, Building Integrated Photovoltaic Solar Power Revenues, CEO, HQ, Number of Employees, Contact, Website)
Table 9.8 Enecoms.r.l. Building Integrated Photovoltaic Solar Power Products/Services 2018 (Products & Specification)
Table 9.9 Enecoms.r.l. Building Integrated Photovoltaic Solar Power Recent Development 2018
Table 9.10 Flisom AG Overview 2018 (Total Revenue, CEO, HQ, Number of Employees, Contact, Website)
Table 9.11 Flisom AG Building Integrated Photovoltaic Solar Power Products/Services 2018 (Products & Specification)
Table 9.12 Flisom AG Building Integrated Photovoltaic Solar Power Recent Development 2018
Table 9.13 Global Solar Energy, Inc. Overview 2018 (Total Revenue, CEO, HQ, Number of Employees, Contact, Website)
Table 9.14 Global Solar Energy, Inc. Building Integrated Photovoltaic Solar Power Products/Services 2018 (Products & Specification)
Table 9.15 Global Solar Energy, Inc Building Integrated Photovoltaic Solar Power Recent Development 2018
Table 9.16 PowerFilm Solar Inc. Overview 2018 (Total Revenue, CEO, HQ, Number of Employees, Contact, Website)
Table 9.17 PowerFilm Solar Inc. Building Integrated Photovoltaic Solar Power Products/Services 2018 (Products & Specification)
Table 9.18 PowerFilm Solar Inc Building Integrated Photovoltaic Solar Power Recent Development 2018
Table 9.19 SolbianEnergie Alternative srl Overview 2018 (Total Revenue, CEO, HQ, Number of Employees, Contact, Website)
Table 9.20 SolbianEnergie Alternative srl. Building Integrated Photovoltaic Solar Power Products/Services 2018 (Products & Specification)
Table 9.21 SolbianEnergie Alternative srl Building Integrated Photovoltaic Solar Power Recent Development 2018
Table 9.22 Sunflare Overview 2018 (Total Revenue, CEO, HQ, Number of Employees, Contact, Website)
Table 9.23 Sunflare. Building Integrated Photovoltaic Solar Power Products/Services 2018 (Products & Specification)
Table 9.24 Sunflare Building Integrated Photovoltaic Solar Power Recent Developments 2018
Table 9.25 SHENZHEN SUNGOLD SOLAR CO., LTD Overview 2018 (Total Revenue, CEO, HQ, Number of Employees, Contact, Website)
Table 9.26 SHENZHEN SUNGOLD SOLAR CO., LTD. Building Integrated Photovoltaic Solar Power Products/Services 2018 (Products & Specification)
Table 9.27 SoloPower Systems, Inc. Overview 2018 (Total Revenue, CEO, HQ, Number of Employees, Contact, Website)
Table 9.28 SoloPower Systems, Inc. Building Integrated Photovoltaic Solar Power Products/Services 2018 (Products & Specification)
Table 10.1 Global Building Integrated Photovoltaic Solar Power Market Summary 2019 to 2029 (Market Value)
List of Figures
Figure 1.1 Global Building Integrated Photovoltaic Solar Power Market Segmentation by Application
Figure 1.2 Global Building Integrated Photovoltaic Solar Power Market Segmentation by Building Type
Figure 2.1 Building Integrated Photovoltaic Solar Power market, By Application Snapshot 2019 Vs 2029 (% Share)
Figure 2.2 Building Integrated Photovoltaic Solar Power Submarket Snapshot, by Building Type 2019 Vs 2029 (% Share)
Figure 2.3 Emerging Economies Accelerating the Growth Of Global Building Integrated Photovoltaic Solar Power Market 2019 vs. 2029
Figure 3.1 Global Building Integrated Photovoltaic Solar Power Market Segmentation
Figure 3.2 Building Integrated Photovoltaic Solar Power Market, Porter’s Five Force Model
Figure 4.1 Building Integrated Photovoltaic Solar Power Market by Type Forecast 2019-2029 ($Mn)
Table 4.2 Building Integrated Photovoltaic Solar Power Market by Type Forecast CAGR (%) 2019-2029, 2019-2024, and 2024-2029
Figure 4.3 Building Integrated Photovoltaic Solar Power Market for Portable Forecast 2019-2029 ($Mn, AGR %)
Figure 4.4 Building Integrated Photovoltaic Solar Power Market for Distributed Power Generation Forecast 2019-2029 ($Mn, AGR %)
Figure 4.5 Building Integrated Photovoltaic Solar Power Market for Distributed Power Generation Forecast 2019-2029 ($Mn, AGR %)
Figure 5.1 Building Integrated Photovoltaic Solar Power Market by Building Type Forecast 2019-2029 ($Mn)
Figure 5.2 Building Integrated Photovoltaic Solar Power Building Type Market Share Forecast 2019, 2024, 2029 (%)
Figure 5.3 Commercial Building Integrated Photovoltaic Solar Power Market Forecast 2019-2029 ($Mn, AGR %)
Figure 5.4 Healthcare Organization Building Integrated Photovoltaic Solar Power Market Forecast 2019-2029 ($Mn, AGR %)
Figure 5.5 Education Institution Building Integrated Photovoltaic Solar Power Market Forecast 2019-2029 ($Mn, AGR %)
Figure 5.6 Other Building Integrated Photovoltaic Solar Power Market Forecast 2019-2029 ($Mn, AGR %)
Figure 7.1 Global Building Integrated Photovoltaic Solar Power Market, By Region Market Value Forecast 2019-2029
Figure 7.2 North America Building Integrated Photovoltaic Solar Power Market Forecast 2019-2029 ($Million, AGR %)
Figure 7.3 United States of America Building Integrated Photovoltaic Solar Power Market Forecast 2019-2029 ($Million, AGR %)
Figure 7.4 Canada Building Integrated Photovoltaic Solar Power Market Forecast 2019-2029 ($Million, AGR %)
Figure 7.5 Mexico Building Integrated Photovoltaic Solar Power Market Forecast 2019-2029 ($Million, AGR %)
Figure 7.6 Europe Building Integrated Photovoltaic Solar Power Market Forecast 2019-2029 ($Million, AGR %)
Figure 7.7 Germany Building Integrated Photovoltaic Solar Power Market Forecast 2019-2029 ($Million, AGR %)
Figure 7.8 The U.K. Building Integrated Photovoltaic Solar Power Market Forecast 2019-2029 ($Million, AGR %)
Figure 7.9 France Building Integrated Photovoltaic Solar Power Market Forecast 2019-2029 ($Million, AGR %)
Figure 7.10 Italy Building Integrated Photovoltaic Solar Power Market Forecast 2019-2029 ($Million, AGR %)
Figure 7.11 Spain Building Integrated Photovoltaic Solar Power Market Forecast 2019-2029 ($Million, AGR %)
Figure 7.12 Other European Countries Building Integrated Photovoltaic Solar Power Market Forecast 2019-2029 ($Million, AGR %)
Figure 7.13 Asia Pacific Building Integrated Photovoltaic Solar Power Market Forecast 2019-2029 ($Million, AGR %)
Figure 7.14 China Building Integrated Photovoltaic Solar Power Market Forecast 2019-2029 ($Million, AGR %)
Figure 7.15 India Building Integrated Photovoltaic Solar Power Market Forecast 2019-2029 ($Million, AGR %)
Figure 7.16 Japan Building Integrated Photovoltaic Solar Power Market Forecast 2019-2029 ($Million, AGR %)
Figure 7.17 Australia Building Integrated Photovoltaic Solar Power Market Forecast 2019-2029 ($Million, AGR %)
Figure 7.18 South Korea Building Integrated Photovoltaic Solar Power Market Forecast 2019-2029 ($Million, AGR %)
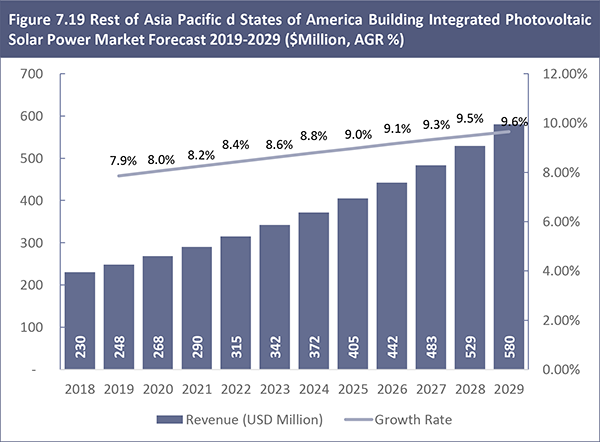
Figure 7.19 Rest of Asia Pacific d States of America Building Integrated Photovoltaic Solar Power Market Forecast 2019-2029 ($Million, AGR %)
Figure 7.20 Rest of the World Building Integrated Photovoltaic Solar Power Market Forecast 2019-2029 ($Million, AGR %)
Figure 7.21 Argentina Building Integrated Photovoltaic Solar Power Market Forecast 2019-2029 ($Million, AGR %)
Figure 7.22 Saudi Arabia Building Integrated Photovoltaic Solar Power Market Forecast 2019-2029 ($Million, AGR %)
Figure 7.23 Brazil Building Integrated Photovoltaic Solar Power Market Forecast 2019-2029 ($Million, AGR %)
Figure 7.24 Rest of World Building Integrated Photovoltaic Solar Power Market Forecast 2019-2029 ($Million, AGR %)
Figure 9.1 SunPower Corporation Revenue, 2016-2018 (USD Million)
Figure 9.2 SunPower Corporation Segmental Revenue Split, 2018 (%)
Figure 9.3 Alta Devices Revenue, 2016-2018 (USD Million)
Figure 9.4 Enecoms.r.l. Revenue, 2016-2018 (USD Million)
Figure 9.5 Flisom AG Revenue, 2016-2018 (USD Million)
Figure 9.6 Global Solar Energy, Inc. Revenue, 2016-2018 (USD Million)
Figure 9.7 PowerFilm Solar Inc. Revenue, 2016-2018 (USD Million)
Figure 9.8 SolbianEnergie Alternative srl. Revenue, 2016-2018 (USD Million)