As a key player in marine solar, it is important for you to remain up to date with news surrounding COVID-19 and the solar industry
Thankfully, you don’t have to look any further. Visiongain has collated important marine solar industry updates from across the country. With the scale of the COVID-19 pandemic, no sector has been left unaffected. This is true for the solar industry. The last few months have seen a shift in rules and regulation surrounding commercial market. It is important to stay abreast to the market activities to get an edge over competitors in the global marine solar market.
Marine Solar Market–our new study reveals trends, R&D progress, and predicted revenues
Although there is a high degree of preference for replacing fossil energy sources by their renewable equivalents aboard ships; the study of developing renewable infrastructures for marine transportation is still in its first steps. Application of solar energy in the marine power system is widely accepted as a promising solution for many countries to develop green ship.
If you read only 1 solar report this year – this is the report you need to read. Take a look at our report on marine solar. It’ll give you an idea of what activities are in the global market and how you can leverage your products and services to generate revenue.
Key questions answered in this exclusive report are:
• What are the implication of marine solar projects taking place now and over the next 10 years?
• Is there a greater need for product commercialisation to further scale the marine solar market?
• Where is the marine solar market heading? And how can you ensure you are at the forefront of the market?
You need to discover how this will impact the marine solar market today, and over the next 10 years:
• Our 368-page report provides 219 tables and 211 charts/graphs exclusively to you.
• The report highlights key lucrative areas in the industry so you can target them – NOW.
• Contains in-depth analyse of global, regional and national sales and growth
• Highlights for you the key successful trends, changes and revenue projections made by your competitors
This report tells you TODAY how the marine solar market will develop in the next 10 years, and in-line with the variations in COVID-19 economic recession and bounce. This market is more critical now than at any point over the last 10 years.
Delivers exclusive COVID-19 variations economic data specific to your market.
To access the data contained in this document please email contactus@visiongain.com
Forecasts to 2031 and other analyses reveal the commercial prospects
• In addition to revenue forecasting to 2031, our new study provides you with recent results, growth rates, and market shares.
• You find original analyses, with business outlooks and developments.
• Discover qualitative analyses (including market dynamics, drivers, opportunities, restraints and challenges), cost structure, impact of rising solar panel prices and recent developments.
This report includes data analysis and invaluable insight into how COVID-19 will affect your industry. Four COVID-19 recovery patterns and their impact, namely, V, L, W and U are discussed in this report.
Global Marine Solar Market by Technology (COVID Impact Analysis)
• Multistring Technology
• MIC Technology
• String Technology
• Centralized Technology
• Hybrid Technology
• Other Technology
Global Marine Solar Market By Solar Module (COVID Impact Analysis)
• Poly-Crystalline Solar Panel
• Mono-Crystalline Solar Panel
• Thin-Film Solar Panel
• Hybrid Solar Panel
• Other Solar Modules
Global Marine Solar Market By Component Based Method (COVID Impact Analysis)
• Solar Panel Array
• Energy Storage
• Computer System
• Charge Controllers
• Installation Components
• Other Component
Global Marine Solar Market By End-User Based Method (COVID Impact Analysis)
• Pleasure Boats
• Commercial Boats
• Fishing Boats
• Military Boats
• Carrier Boats
• Other End-User

In addition to the revenue predictions for the overall world market and segments, you will also find revenue forecasts for 4 regional and 20 leading national markets:
• North America Marine Solar Market, 2021 to 2031 Market Outlook
– U.S. Marine Solar Market, 2021 to 2031 Market Forecast & COVID Impact Analysis
– Canada Marine Solar Market, 2021 to 2031 Market Forecast & COVID Impact Analysis
• Europe Marine Solar Market, 2021 to 2031 Market Outlook
– Germany Marine Solar Market, 2021 to 2031 Market Forecast & COVID Impact Analysis
– Russia Marine Solar Market, 2021 to 2031 Market Forecast & COVID Impact Analysis
– United Kingdom Marine Solar Market, 2021 to 2031 Market Forecast & COVID Impact Analysis
– France Marine Solar Market, 2021 to 2031 Market Forecast & COVID Impact Analysis
– Italy Marine Solar Market, 2021 to 2031 Market Forecast & COVID Impact Analysis
– Rest of Europe Market Forecast & COVID Impact Analysis
• Asia Pacific Marine Solar Market, 2021 to 2031 Market Outlook
– China Marine Solar Market, 2021 to 2031 Market Forecast & COVID Impact Analysis
– Japan Marine Solar Market, 2021 to 2031 Market Forecast & COVID Impact Analysis
– India Marine Solar Market, 2021 to 2031 Market Forecast & COVID Impact Analysis
– Australia Marine Solar Market, 2021 to 2031 Market Forecast & COVID Impact Analysis
– South Korea Marine Solar Market, 2021 to 2031 Market Forecast & COVID Impact Analysis
– Rest of Asia Pacific Market Forecast & COVID Impact Analysis
• LAMEA Marine Solar Market, 2021 to 2031 Market Outlook
– Brazil Marine Solar Market, 2021 to 2031 Market Forecast & COVID Impact Analysis
– Mexico Marine Solar Market, 2021 to 2031 Market Forecast & COVID Impact Analysis
– Saudi Arabia Marine Solar Market, 2021 to 2031 Market Forecast & COVID Impact Analysis
– South Africa Marine Solar Market, 2021 to 2031 Market Forecast & COVID Impact Analysis
– UAE Marine Solar Market, 2021 to 2031 Market Forecast & COVID Impact Analysis
– Rest of Latin America, Middle East and Africa
Need industry data? Please contact us today.
The report also includes profiles and for some of the leading companies in the Marine Solar Market, 2021 to 2031, with a focus on this segment of these companies’ operations.
Leading companies and the potential for market growth
• China Everbright Greentech Limited
• Hengdian Group DMEGC Magnetics Co., Ltd
• Jinko Solar Holding Co., Ltd.
• Motech Industries Inc.
• REC Silicon ASA
• Risen Energy Co., Ltd.
• Shenzhen Kingsun Science & Technology Co., Ltd
• Shunfeng International Clean Energy Ltd
• Solar World AG
• SunPower Corporation
Overall world revenue for Marine Solar Market, 2021 to 2031 Market will surpass US$xx billion in 2021, our work calculates. We predict strong revenue growth through to 2031. Our work identifies which organizations hold the greatest potential. Discover their capabilities, progress, and commercial prospects, helping you stay ahead.
How the Marine Solar Market, 2021 to 2031 Market report helps you
In summary, our 360+ page report provides you with the following knowledge:
• Revenue forecasts to 2031 for Marine Solar Market, 2021 to 2031 Market, with forecasts for technology, component, solar module, end-user each forecasted at a global and regional level– discover the industry’s prospects, finding the most lucrative places for investments and revenues
• Revenue forecasts to 2031 for 5 regional and 20 key national markets – See forecasts for the Marine Solar Market, 2021 to 2031 market in North America, Europe, Asia-Pacific and LAMEA. Also forecasted is the market in the US, Canada, Mexico, Brazil, Germany, France, UK, Italy, China, India, Japan, and Australia among other prominent economies.
• Prospects for established firms and those seeking to enter the market– including company profiles for 15 of the major companies involved in the Marine Solar Market, 2021 to 2031 Market.
Find quantitative and qualitative analyses with independent predictions. Receive information that only our report contains, staying informed with this invaluable business intelligence.
Information found nowhere else
With our newly report title, you are less likely to fall behind in knowledge or miss out on opportunities. See how our work could benefit your research, analyses, and decisions. Visiongain’s study is for everybody needing commercial analyses for the Marine Solar Market, 2021 to 2031 Market and leading companies. You will find data, trends and predictions.
To access the data contained in this document please email contactus@visiongain.com
Buy our report today Marine Solar Market Report 2021-2031: Forecasts by Technology (Multistring Technology, MIC Technology, String Technology, Centralised Technology, Hybrid Technology, Other Technology), by Solar Module (Poly-crystalline, Solar Panel, Mono-crystalline, Solar Panel, Thin-film, Solar Panel, Hybrid Solar, Panel, Other Solar, Modules), by Component (Solar Panel, Array, Energy, Storage, Computer, System, Charge, Controllers, Installation, Components, Other Component), by End-User (Pleasure, Boats, Commercial, Boats, Fishing Boats, Military Boats, Carrier Boats, Other End-user) AND Regional and Leading National Market Analysis PLUS Analysis of Leading Marine Solar Companies AND COVID-19. Avoid missing out by staying informed – order our report now.
Visiongain is a trading partner with the US Federal Government
CCR Ref number: KD4R6
Do you have any custom requirements we can help you with? Any need for a specific country, geo region, market segment or specific company information? Contact us today, we can discuss your needs and see how we can help: sara.peerun@visiongain.com
1. Report Overview
1.1 Introduction to Marine Solar Market
1.2 Global Marine Solar Market Overview
1.3 What are the Objectives of this Report?
1.4 Reasons for Doing the Study
1.5 What is the Scope of the Report?
1.6 Marine Solar Market Definition
1.7 Why You Should Read This Report
1.8 What This Report Delivers
1.9 Information
1.10 Key Questions Answered By This Analytical Report Include:
1.11 Who is This Report For?
1.12 Methodology
1.12.1 Primary Research
1.12.2 Secondary Research
1.12.3 Market Evaluation & Forecasting Methodology
1.13 Frequently Asked Questions (FAQs)
1.14 Associated Visiongain Reports
1.15 About Visiongain
2 Executive Summary
2.1 Photovoltaic Ship Powering System
2.1.1 Operation Modes of Solar Powered Ship Power Systems
2.1.2 Off-grid mode
2.1.3 Grid connected mode
2.1.4 Hybrid grid connected/off-grid mode
3 Marine Solar Industry Overview
3.1 Essential Requirements for a Successful Solar-Powered Ship
3.1.1 Solar Radiation Distribution
3.1.2 Sun-Exposed Deck Area
3.1.3 Grid-Connected PV Solar Power System
3.1.4 Impact of the Weight of Solar Energy System on Ship Stability
3.2 The Electrical System of a Marine Vessel
3.2.1 What are the types of marine solar panels?
3.2.2 Reasons to choose marine solar panels
3.2.3 How do marine solar panels work?
3.3 Technical Specifications for PV Systems in Marine Vessels
4 Market Dynamics
4.1 Market Analysis of the Marine Solar Cells Market
4.1.1 Macroeconomic perspective of solar energy.
4.1.2 The market for small scale solar applications did grow, but not to a proportion sufficient to support a growing industry
4.1.3 The challenge lies in providing functional solar cells fitting the power conversion efficiency and lifetime requirements for the given application at the right cost.
4.2 Market Drivers of the marine Solar Cells Market
4.2.1 Global Primary Energy Consumption Expected to Continue Its Swift Pace of Growth
4.2.2 Solar PV Growth Forecast
4.2.3 Growth in Solar is Led by Falling Prices
4.2.4 Increasing Energy Usage and Improving Standards of Living
4.2.5 Thin Film Technology Grabbing Increasing Share in the Solar Photovoltaic Industry
4.3 Market Restraints of the Marine Solar Cells Market
4.3.1 Low Efficiency of Marine Technologies is a Significant Inhibitor
4.3.2 COVID-19 Has Had Significant Impacts on Distributed Solar
4.4 Opportunities in marine Solar Cells Market
4.4.1 Market Expansion Coupled with the Entry of New Players Driving Growth
4.4.2 Solar Industry Growing at a Record Pace
4.4.3 Storage is Increasingly Paired with All Forms of Solar
4.4.4 Large Utility-Scale Solar Pipeline Outpaces Installs
4.5 Challenges in Marine Photovoltaics
4.6 Solar Cell Patent Analysis
4.7 Recent Photovoltaic Ship Projects And Developments
5 Global Marine Solar Market Outlook
5.1 Global Market Analysis
5.2 Global Market Size Estimation and Forecast
5.2.1 Pre-COVID Market Scenario
5.2.2 COVID-19 Impact Recovery Scenarios (V, W, U, L-Shaped Analysis)
5.3 Global Market Breakdown by Technology
5.3.1 Marine Solar Technology Overview
5.3.2 String Technology
5.3.3 Multistring Technology
5.3.4 MIC Technology
5.3.5 Dynamic Photovoltaic Arrays
5.3.6 Maximum Power Point(MPPT) Control of Ship PV System
5.3.7 Pre-COVID Market Scenario
5.3.8 COVID-19 Impact Recovery Scenarios (V, W, U, L-Shaped Analysis)
5.4 Global Market Breakdown by Solar Module
5.4.1 Pre-COVID Market Scenario
5.4.2 COVID-19 Impact Recovery Scenarios (V, W, U, L-Shaped Analysis)
5.5 Global Market Breakdown by Component
5.5.1 Marine Solar Component Overview
5.5.2 Pre-COVID Market Scenario
5.5.3 COVID-19 Impact Recovery Scenarios (V, W, U, L-Shaped Analysis)
5.6 Global Market Breakdown by End-User
5.6.1 Marine Solar End-User Overview
5.6.2 Pre-COVID Market Scenario
5.6.3 COVID-19 Impact Recovery Scenarios (V, W, U, L-Shaped Analysis)
5.7 Global Market Breakdown by Region
5.7.1 Pre-COVID Market Scenario
5.7.2 COVID-19 Impact Recovery Scenarios (V, W, U, L-Shaped Analysis)
6 North America Marine Solar Market Outlook
6.1 North America Market Analysis
6.2 North America Market Size Estimation and Forecast
6.2.1 Pre-COVID Market Scenario
6.2.2 COVID-19 Impact Recovery Scenarios (V, W, U, L-Shaped Analysis)
6.3 North America Market Breakdown by Technology
6.3.1 Pre-COVID Market Scenario
6.3.2 COVID-19 Impact Recovery Scenarios (V, W, U, L-Shaped Analysis)
6.4 North America Market Breakdown by Solar Module
6.4.1 Pre-COVID Market Scenario
6.4.2 COVID-19 Impact Recovery Scenarios (V, W, U, L-Shaped Analysis)
6.5 North America Market Breakdown by Component
6.5.1 Pre-COVID Market Scenario
6.5.2 COVID-19 Impact Recovery Scenarios (V, W, U, L-Shaped Analysis)
6.6 North America Market Breakdown by End-User
6.6.1 Pre-COVID Market Scenario
6.6.2 COVID-19 Impact Recovery Scenarios (V, W, U, L-Shaped Analysis)
6.7 North America Market Breakdown by Country
6.7.1 Pre-COVID Market Scenario
6.7.2 COVID-19 Impact Recovery Scenarios (V, W, U, L-Shaped Analysis)
6.8 US Marine Solar Market Outlook
6.8.1 US Market Overview
6.8.2 Pre-COVID Market Scenario
6.8.3 COVID-19 Impact Recovery Scenarios (V, W, U, L-Shaped Analysis)
6.9 Canada Marine Solar Market Outlook
6.9.1 Canada Market Overview
6.9.2 Pre-COVID Market Scenario
6.9.3 COVID-19 Impact Recovery Scenarios (V, W, U, L-Shaped Analysis)
7 Europe Marine Solar Market Outlook
7.1 Europe Market Analysis
7.2 Europe Market Size Estimation and Forecast
7.2.1 Pre-COVID Market Scenario
7.2.2 COVID-19 Impact Recovery Scenarios (V, W, U, L-Shaped Analysis)
7.3 Europe Market Breakdown by Technology
7.3.1 Pre-COVID Market Scenario
7.3.2 COVID-19 Impact Recovery Scenarios (V, W, U, L-Shaped Analysis)
7.4 Europe Market Breakdown by Solar Module
7.4.1 Pre-COVID Market Scenario
7.4.2 COVID-19 Impact Recovery Scenarios (V, W, U, L-Shaped Analysis)
7.5 Europe Market Breakdown by Component
7.5.1 Pre-COVID Market Scenario
7.5.2 COVID-19 Impact Recovery Scenarios (V, W, U, L-Shaped Analysis)
7.6 Europe Market Breakdown by End-User
7.6.1 Pre-COVID Market Scenario
7.6.2 COVID-19 Impact Recovery Scenarios (V, W, U, L-Shaped Analysis)
7.7 Europe Market Breakdown by Country
7.7.1 Pre-COVID Market Scenario
7.7.2 COVID-19 Impact Recovery Scenarios (V, W, U, L-Shaped Analysis)
7.8 Germany Marine Solar Market Outlook
7.8.1 Germany Market Overview
7.8.2 Pre-COVID Market Scenario
7.8.3 COVID-19 Impact Recovery Scenarios (V, W, U, L-Shaped Analysis)
7.9 UK Marine Solar Market Outlook
7.9.1 UK Market Overview
7.9.2 Pre-COVID Market Scenario
7.9.3 COVID-19 Impact Recovery Scenarios (V, W, U, L-Shaped Analysis)
7.10 France Marine Solar Market Outlook
7.10.1 France Market Overview
7.10.2 Pre-COVID Market Scenario
7.10.3 COVID-19 Impact Recovery Scenarios (V, W, U, L-Shaped Analysis)
7.11 Italy Marine Solar Market Outlook
7.11.1 Italy Market Overview
7.11.2 Pre-COVID Market Scenario
7.11.3 COVID-19 Impact Recovery Scenarios (V, W, U, L-Shaped Analysis)
7.12 Spain Marine Solar Market Outlook
7.12.1 Spain Market Overview
7.12.2 Pre-COVID Market Scenario
7.12.3 COVID-19 Impact Recovery Scenarios (V, W, U, L-Shaped Analysis)
7.13 Rest of Europe Marine Solar Market Outlook
7.13.1 Rest of Europe Market Overview
7.13.2 Pre-COVID Market Scenario
7.13.3 COVID-19 Impact Recovery Scenarios (V, W, U, L-Shaped Analysis)
8 Asia-Pacific Marine Solar Market Outlook
8.1 Asia-Pacific Market Analysis
8.2 Asia-Pacific Market Size Estimation and Forecast
8.2.1 Pre-COVID Market Scenario
8.2.2 COVID-19 Impact Recovery Scenarios (V, W, U, L-Shaped Analysis)
8.3 Asia-Pacific Market Breakdown by Technology
8.3.1 Pre-COVID Market Scenario
8.3.2 COVID-19 Impact Recovery Scenarios (V, W, U, L-Shaped Analysis)
8.4 Asia-Pacific Market Breakdown by Solar Module
8.4.1 Pre-COVID Market Scenario
8.4.2 COVID-19 Impact Recovery Scenarios (V, W, U, L-Shaped Analysis)
8.5 Asia-Pacific Market Breakdown by Component
8.5.1 Pre-COVID Market Scenario
8.5.2 COVID-19 Impact Recovery Scenarios (V, W, U, L-Shaped Analysis)
8.6 Asia-Pacific Market Breakdown by End-User
8.6.1 Pre-COVID Market Scenario
8.6.2 COVID-19 Impact Recovery Scenarios (V, W, U, L-Shaped Analysis)
8.7 Asia-Pacific Market Breakdown by Country
8.7.1 Pre-COVID Market Scenario
8.7.2 COVID-19 Impact Recovery Scenarios (V, W, U, L-Shaped Analysis)
8.8 China Marine Solar Market Outlook
8.8.1 China Market Overview
8.8.2 Pre-COVID Market Scenario
8.8.3 COVID-19 Impact Recovery Scenarios (V, W, U, L-Shaped Analysis)
8.9 India Marine Solar Market Outlook
8.9.1 India Market Overview
8.9.2 Pre-COVID Market Scenario
8.9.3 COVID-19 Impact Recovery Scenarios (V, W, U, L-Shaped Analysis)
8.10 Japan Marine Solar Market Outlook
8.10.1 Japan Market Overview
8.10.2 Pre-COVID Market Scenario
8.10.3 COVID-19 Impact Recovery Scenarios (V, W, U, L-Shaped Analysis)
8.11 South Korea Marine Solar Market Outlook
8.11.1 South Korea Market Overview
8.11.2 Pre-COVID Market Scenario
8.11.3 COVID-19 Impact Recovery Scenarios (V, W, U, L-Shaped Analysis)
8.12 Australia Marine Solar Market Outlook
8.12.1 Australia Market Overview
8.12.2 Pre-COVID Market Scenario
8.12.3 COVID-19 Impact Recovery Scenarios (V, W, U, L-Shaped Analysis)
8.13 Rest of Asia-Pacific Marine Solar Market Outlook
8.13.1 Rest of Asia-Pacific Market Overview
8.13.2 Pre-COVID Market Scenario
8.13.3 COVID-19 Impact Recovery Scenarios (V, W, U, L-Shaped Analysis)
9 LAMEA Marine Solar Market Outlook
9.1 LAMEA Market Analysis
9.2 LAMEA Market Size Estimation and Forecast
9.2.1 Pre-COVID Market Scenario
9.2.2 COVID-19 Impact Recovery Scenarios (V, W, U, L-Shaped Analysis)
9.3 LAMEA Market Breakdown by Technology
9.3.1 Pre-COVID Market Scenario
9.3.2 COVID-19 Impact Recovery Scenarios (V, W, U, L-Shaped Analysis)
9.4 LAMEA Market Breakdown by Solar Module
9.4.1 Pre-COVID Market Scenario
9.4.2 COVID-19 Impact Recovery Scenarios (V, W, U, L-Shaped Analysis)
9.5 LAMEA Market Breakdown by Component
9.5.1 Pre-COVID Market Scenario
9.5.2 COVID-19 Impact Recovery Scenarios (V, W, U, L-Shaped Analysis)
9.6 LAMEA Market Breakdown by End-User
9.6.1 Pre-COVID Market Scenario
9.6.2 COVID-19 Impact Recovery Scenarios (V, W, U, L-Shaped Analysis)
9.7 LAMEA Market Breakdown by Country
9.7.1 Pre-COVID Market Scenario
9.7.2 COVID-19 Impact Recovery Scenarios (V, W, U, L-Shaped Analysis)
9.8 Brazil Marine Solar Market Outlook
9.8.1 Brazil Market Overview
9.8.2 Pre-COVID Market Scenario
9.8.3 COVID-19 Impact Recovery Scenarios (V, W, U, L-Shaped Analysis)
9.9 Saudi Arabia Marine Solar Market Outlook
9.9.1 Saudi Arabia Market Overview
9.9.2 Pre-COVID Market Scenario
9.9.3 COVID-19 Impact Recovery Scenarios (V, W, U, L-Shaped Analysis)
9.10 South Africa Marine Solar Market Outlook
9.10.1 South Africa Market Overview
9.10.2 Pre-COVID Market Scenario
9.10.3 COVID-19 Impact Recovery Scenarios (V, W, U, L-Shaped Analysis)
9.11 Mexico Marine Solar Market Outlook
9.11.1 Mexico Market Overview
9.11.2 Pre-COVID Market Scenario
9.11.3 COVID-19 Impact Recovery Scenarios (V, W, U, L-Shaped Analysis)
9.12 UAE Marine Solar Market Outlook
9.12.1 UAE Market Overview
9.12.2 Pre-COVID Market Scenario
9.13 Rest of LAMEA Marine Solar Market Outlook
9.13.1 Rest of LAMEA Market Overview
9.13.2 Pre-COVID Market Scenario
9.13.3 COVID-19 Impact Recovery Scenarios (V, W, U, L-Shaped Analysis)
10 Competitive Landscape
10.1 Strategic Analysis
10.2.1 Innovative Product Launches
10.2.2 Top 15 Module Producers
10.2.3 Top 15 Cell Producers
10.2.4 Top Polysilicon Wafer Manufacturers
10.2.5 Acquisitions of Start-Ups with Innovative Technology
10.2.6 Agreement and partnerships with Key Players in the Market
10.2.7 Business Expansions by setting up New Facilities and Sales Offices
11 Leading Company Profiles
11.1 China Everbright Greentech Ltd Company
11.1.1 Company Snapshot
11.1.2 Company Overview
11.1.3 Company Financial Profile
11.1.4 Company Product Benchmarking
11.1.5 Company Recent Developments
11.2 Hengdian Group DMEGC Magnetics Co., Ltd. Company
11.2.1 Company Snapshot
11.2.2 Company Overview
11.2.3 Company Financial Profile
11.2.4 Company Product Benchmarking
11.2.5 Company Recent Developments
11.3 Jinko Solar Holding Co., Ltd (ADR) Company
11.3.1 Company Snapshot
11.3.2 Company Overview
11.3.3 Company Financial Profile
11.3.4 Company Product Benchmarking
11.3.5 Company Recent Developments
11.4 Motech Industries Inc. Company
11.4.1 Company Snapshot
11.4.2 Company Overview
11.4.3 Company Financial Profile
11.4.4 Company Product Benchmarking
11.4.5 Company Recent Developments
11.5 Rec Silicon ASA Company
11.5.1 Company Snapshot
11.5.2 Company Overview
11.5.3 Company Financial Profile
11.5.4 Company Product Benchmarking
11.5.5 Company Recent Developments
11.6 Risen Energy Co. Ltd. Company
11.6.1 Company Snapshot
11.6.2 Company Overview
11.6.3 Company Financial Profile
11.6.4 Company Product Benchmarking
11.6.5 Company Recent Developments
11.7 Shenzhen Kingsun Science & Tech Co Ltd Company
11.7.1 Company Snapshot
11.7.2 Company Overview
11.7.3 Company Financial Profile
11.7.4 Company Product Benchmarking
11.7.5 Company Recent Developments
11.8 Shunfeng International Clean Energy Ltd Company
11.8.1 Company Snapshot
11.8.2 Company Overview
11.8.3 Company Financial Profile
11.8.4 Company Product Benchmarking
11.8.5 Company Recent Developments
11.9 Solar World AG Company
11.9.1 Company Snapshot
11.9.2 Company Overview
11.9.3 Company Financial Profile
11.9.4 Company Product Benchmarking
11.9.5 Company Recent Developments
11.10 SunPower Corporation Company
11.10.1 Company Snapshot
11.10.2 Company Overview
11.10.3 Company Financial Profile
11.10.4 Company Product Benchmarking
11.10.5 Company Recent Developments
12 Conclusion & Recommendations
12.1 Recommendations
13 Glossary
List of Tables
Table 1. Global Marine Solar Market Forecast, 2021-2031 (USD Billion, AGR (%), CAGR (%))
Table 2. Global Marine Solar Market Snapshot, 2021 & 2031 (US$ billion, CAGR %)
Table 3. Global Marine Solar Market Forecast, 2021-2031 (USD Billion, AGR (%),CAGR (%))
Table 4. Regional Share Analysis of Thin Film Solar Cell Patents Categorised based on Innovation in Materials, Structure, and Process (South Asia, America, Europe, Rest of the World)
Table 5. Overview of Assignees, Granted Patents, Published Patent Applications and Total Patents Assigned (Assignee, Granted, Published, Total)
Table 6. Other Key Players in Global Solar Cell Market (Name, Corporate Ownership, Website, Country, City)
Table 7. Global Marine Solar Market Forecast, 2021-2031 (USD Billion, AGR (%),CAGR (%))
Table 8. Global Marine Solar Market Forecast, 2021-2031 (USD Billion, AGR (%),CAGR (%)) (V-Shaped Recovery)
Table 9. Global Marine Solar Market Forecast, 2021-2031 (USD Billion, AGR (%),CAGR (%)) (W-Shaped Recovery)
Table 10. Global Marine Solar Market Forecast, 2021-2031 (USD Billion, AGR (%),CAGR (%)) (U-Shaped Recovery)
Table 11. Global Marine Solar Market Forecast, 2021-2031 (USD Billion, AGR (%),CAGR (%)) (L-Shaped Recovery)
Table 12. Global Marine Solar Market by Technology, 2021-2031 (USD Billion, AGR (%), CAGR (%))
Table 13. Global Marine Solar Market by Technology, 2021-2031 (USD Billion, AGR (%), CAGR (%)) (V-Shaped Recovery)
Table 14. Global Marine Solar Market by Technology, 2021-2031 (USD Billion, AGR (%), CAGR (%)) (W-Shaped Recovery)
Table 15. Global Marine Solar Market by Technology, 2021-2031 (USD Billion, AGR (%), CAGR (%)) (U-Shaped Recovery)
Table 16. Global Marine Solar Market by Technology, 2021-2031 (USD Billion, AGR (%), CAGR (%)) (L-Shaped Recovery)
Table 17. Global Marine Solar Market by Solar Module, 2021-2031 (USD Billion, AGR (%), CAGR (%))
Table 18. Global Marine Solar Market by Solar Module, 2021-2031 (USD Billion, AGR (%), CAGR (%)) (V-Shaped Recovery)
Table 19. Global Marine Solar Market by Solar Module, 2021-2031 (USD Billion, AGR (%), CAGR (%)) (W-Shaped Recovery)
Table 20. Global Marine Solar Market by Solar Module, 2021-2031 (USD Billion, AGR (%), CAGR (%)) (U-Shaped Recovery)
Table 21. Global Marine Solar Market by Solar Module, 2021-2031 (USD Billion, AGR (%), CAGR (%)) (L-Shaped Recovery)
Table 22. Global Marine Solar Market by Component, 2021-2031 (USD Billion, AGR (%), CAGR (%))
Table 23. Global Marine Solar Market by Component, 2021-2031 (USD Billion, AGR (%), CAGR (%)) (V-Shaped Recovery)
Table 24. Global Marine Solar Market by Component, 2021-2031 (USD Billion, AGR (%), CAGR (%)) (W-Shaped Recovery)
Table 25. Global Marine Solar Market by Component, 2021-2031 (USD Billion, AGR (%), CAGR (%)) (U-Shaped Recovery)
Table 26. Global Marine Solar Market by Component, 2021-2031 (USD Billion, AGR (%), CAGR (%)) (L-Shaped Recovery)
Table 27. Global Marine Solar Market by End-User, 2021-2031 (USD Billion, AGR (%), CAGR (%))
Table 28. Global Marine Solar Market by End-User, 2021-2031 (USD Billion, AGR (%), CAGR (%)) (V-Shaped Recovery)
Table 29. Global Marine Solar Market by End-User, 2021-2031 (USD Billion, AGR (%), CAGR (%)) (W-Shaped Recovery)
Table 30. Global Marine Solar Market by End-User, 2021-2031 (USD Billion, AGR (%), CAGR (%)) (U-Shaped Recovery)
Table 31. Global Marine Solar Market by End-User, 2021-2031 (USD Billion, AGR (%), CAGR (%)) (L-Shaped Recovery)
Table 32. Global Marine Solar Market by Region, 2021-2031 (USD Billion, AGR (%), CAGR (%))
Table 33. Global Marine Solar Market by Region, 2021-2031 (USD Billion, AGR (%), CAGR (%)) (V-Shaped Recovery)
Table 34. Global Marine Solar Market by Region, 2021-2031 (USD Billion, AGR (%), CAGR (%)) (W-Shaped Recovery)
Table 35. Global Marine Solar Market by Region, 2021-2031 (USD Billion, AGR (%), CAGR (%)) (U-Shaped Recovery)
Table 36. Global Marine Solar Market by Region, 2021-2031 (USD Billion, AGR (%), CAGR (%)) (L-Shaped Recovery)
Table 37. North America Marine Solar Market by Value, 2021-2031 (USD Billion, AGR (%), CAGR (%))
Table 38. North America Marine Solar Market by Value, 2021-2031 (USD Billion, AGR (%), CAGR (%)) (V-Shaped Recovery)
Table 39. North America Marine Solar Market by Value, 2021-2031 (USD Billion, AGR (%), CAGR (%)) (W-Shaped Recovery)
Table 40. North America Marine Solar Market by Value, 2021-2031 (USD Billion, AGR (%), CAGR (%)) (U-Shaped Recovery)
Table 41. North America Marine Solar Market by Value, 2021-2031 (USD Billion, AGR (%), CAGR (%)) (L-Shaped Recovery)
Table 42. North America Marine Solar Market by Technology, 2021-2031 (USD Billion, AGR (%), CAGR (%))
Table 43. North America Marine Solar Market by Technology, 2021-2031 (USD Billion, AGR (%), CAGR (%)) (V-Shaped Recovery)
Table 44. North America Marine Solar Market by Technology, 2021-2031 (USD Billion, AGR (%), CAGR (%)) (W-Shaped Recovery)
Table 45. North America Marine Solar Market by Technology, 2021-2031 (USD Billion, AGR (%), CAGR (%)) (U-Shaped Recovery)
Table 46. North America Marine Solar Market by Technology, 2021-2031 (USD Billion, AGR (%), CAGR (%)) (L-Shaped Recovery)
Table 47. North America Marine Solar Market by Solar Module, 2021-2031 (USD Billion, AGR (%), CAGR (%))
Table 48. North America Marine Solar Market by Solar Module, 2021-2031 (USD Billion, AGR (%), CAGR (%)) (V-Shaped Recovery)
Table 49. North America Marine Solar Market by Solar Module, 2021-2031 (USD Billion, AGR (%), CAGR (%)) (W-Shaped Recovery)
Table 50. North America Marine Solar Market by Solar Module, 2021-2031 (USD Billion, AGR (%), CAGR (%)) (U-Shaped Recovery)
Table 51. North America Marine Solar Market by Solar Module, 2021-2031 (USD Billion, AGR (%), CAGR (%)) (L-Shaped Recovery)
Table 52. North America Marine Solar Market by Component, 2021-2031 (USD Billion, AGR (%), CAGR (%))
Table 53. North America Marine Solar Market by Component, 2021-2031 (USD Billion, AGR (%), CAGR (%)) (V-Shaped Recovery)
Table 54. North America Marine Solar Market by Component, 2021-2031 (USD Billion, AGR (%), CAGR (%)) (W-Shaped Recovery)
Table 55. North America Marine Solar Market by Component, 2021-2031 (USD Billion, AGR (%), CAGR (%)) (U-Shaped Recovery)
Table 56. North America Marine Solar Market by Component, 2021-2031 (USD Billion, AGR (%), CAGR (%)) (L-Shaped Recovery)
Table 57. North America Marine Solar Market by End-User, 2021-2031 (USD Billion, AGR (%), CAGR (%))
Table 58. North America Marine Solar Market by End-User, 2021-2031 (USD Billion, AGR (%), CAGR (%)) (V-Shaped Recovery)
Table 59. North America Marine Solar Market by End-User, 2021-2031 (USD Billion, AGR (%), CAGR (%)) (W-Shaped Recovery)
Table 60. North America Marine Solar Market by End-User, 2021-2031 (USD Billion, AGR (%), CAGR (%)) (U-Shaped Recovery)
Table 61. North America Marine Solar Market by End-User, 2021-2031 (USD Billion, AGR (%), CAGR (%)) (L-Shaped Recovery)
Table 62. US Marine Solar Market by Value, 2021-2031 (USD Billion, AGR (%), CAGR (%))
Table 63. US Marine Solar Market by Value, 2021-2031 (USD Billion, AGR (%), CAGR (%)) (V-Shaped Recovery)
Table 64. US Marine Solar Market by Value, 2021-2031 (USD Billion, AGR (%), CAGR (%)) (W-Shaped Recovery)
Table 65. US Marine Solar Market by Value, 2021-2031 (USD Billion, AGR (%), CAGR (%)) (U-Shaped Recovery)
Table 66. Canada Marine Solar Market by Value, 2021-2031 (USD Billion, AGR (%), CAGR (%))
Table 67. Canada Marine Solar Market by Value, 2021-2031 (USD Billion, AGR (%), CAGR (%)) (V-Shaped Recovery)
Table 68. Canada Marine Solar Market by Value, 2021-2031 (USD Billion, AGR (%), CAGR (%)) (W-Shaped Recovery)
Table 69. Canada Marine Solar Market by Value, 2021-2031 (USD Billion, AGR (%), CAGR (%)) (U-Shaped Recovery)
Table 70. Canada Marine Solar Market by Value, 2021-2031 (USD Billion, AGR (%), CAGR (%)) (L-Shaped Recovery)
Table 71. Europe Marine Solar Market by Value, 2021-2031 (USD Billion, AGR (%), CAGR (%))
Table 72. Europe Marine Solar Market by Value, 2021-2031 (USD Billion, AGR (%), CAGR (%)) (V-Shaped Recovery)
Table 73. Europe Marine Solar Market by Value, 2021-2031 (USD Billion, AGR (%), CAGR (%)) (W-Shaped Recovery)
Table 74. Europe Marine Solar Market by Value, 2021-2031 (USD Billion, AGR (%), CAGR (%)) (U-Shaped Recovery)
Table 75. Europe Marine Solar Market by Value, 2021-2031 (USD Billion, AGR (%), CAGR (%)) (L-Shaped Recovery)
Table 76. Europe Marine Solar Market by Technology, 2021-2031 (USD Billion, AGR (%), CAGR (%))
Table 77. Europe Marine Solar Market by Technology, 2021-2031 (USD Billion, AGR (%), CAGR (%)) (V-Shaped Recovery)
Table 78. Europe Marine Solar Market by Technology, 2021-2031 (USD Billion, AGR (%), CAGR (%)) (W-Shaped Recovery)
Table 79. Europe Marine Solar Market by Technology, 2021-2031 (USD Billion, AGR (%), CAGR (%)) (U-Shaped Recovery)
Table 80. Europe Marine Solar Market by Technology, 2021-2031 (USD Billion, AGR (%), CAGR (%)) (L-Shaped Recovery)
Table 81. Europe Marine Solar Market by Solar Module, 2021-2031 (USD Billion, AGR (%), CAGR (%))
Table 82. Europe Marine Solar Market by Solar Module, 2021-2031 (USD Billion, AGR (%), CAGR (%)) (V-Shaped Recovery)
Table 83. Europe Marine Solar Market by Solar Module, 2021-2031 (USD Billion, AGR (%), CAGR (%)) (W-Shaped Recovery)
Table 84. Europe Marine Solar Market by Solar Module, 2021-2031 (USD Billion, AGR (%), CAGR (%)) (U-Shaped Recovery)
Table 85. Europe Marine Solar Market by Solar Module, 2021-2031 (USD Billion, AGR (%), CAGR (%)) (L-Shaped Recovery)
Table 86. Europe Marine Solar Market by Component, 2021-2031 (USD Billion, AGR (%), CAGR (%))
Table 87. Europe Marine Solar Market by Component, 2021-2031 (USD Billion, AGR (%), CAGR (%)) (V-Shaped Recovery)
Table 88. Europe Marine Solar Market by Component, 2021-2031 (USD Billion, AGR (%), CAGR (%)) (W-Shaped Recovery)
Table 89. Europe Marine Solar Market by Component, 2021-2031 (USD Billion, AGR (%), CAGR (%)) (U-Shaped Recovery)
Table 90. Europe Marine Solar Market by Component, 2021-2031 (USD Billion, AGR (%), CAGR (%)) (L-Shaped Recovery)
Table 91. Europe Marine Solar Market by End-User, 2021-2031 (USD Billion, AGR (%), CAGR (%))
Table 92. Europe Marine Solar Market by End-User, 2021-2031 (USD Billion, AGR (%), CAGR (%)) (V-Shaped Recovery)
Table 93. Europe Marine Solar Market by End-User, 2021-2031 (USD Billion, AGR (%), CAGR (%)) (W-Shaped Recovery)
Table 94. Europe Marine Solar Market by End-User, 2021-2031 (USD Billion, AGR (%), CAGR (%)) (U-Shaped Recovery)
Table 95. Europe Marine Solar Market by End-User, 2021-2031 (USD Billion, AGR (%), CAGR (%)) (L-Shaped Recovery)
Table 96. Germany Marine Solar Market by Value, 2021-2031 (USD Billion, AGR (%), CAGR (%))
Table 97. Germany Marine Solar Market by Value, 2021-2031 (USD Billion, AGR (%), CAGR (%)) (V-Shaped Recovery)
Table 98. Germany Marine Solar Market by Value, 2021-2031 (USD Billion, AGR (%), CAGR (%)) (W-Shaped Recovery)
Table 99. Germany Marine Solar Market by Value, 2021-2031 (USD Billion, AGR (%), CAGR (%)) (U-Shaped Recovery)
Table 100. Germany Marine Solar Market by Value, 2021-2031 (USD Billion, AGR (%), CAGR (%)) (L-Shaped Recovery)
Table 101. UK Marine Solar Market by Value, 2021-2031 (USD Billion, AGR (%), CAGR (%))
Table 102. UK Marine Solar Market by Value, 2021-2031 (USD Billion, AGR (%), CAGR (%)) (V-Shaped Recovery)
Table 103. UK Marine Solar Market by Value, 2021-2031 (USD Billion, AGR (%), CAGR (%)) (W-Shaped Recovery)
Table 104. UK Marine Solar Market by Value, 2021-2031 (USD Billion, AGR (%), CAGR (%)) (U-Shaped Recovery)
Table 105. UK Marine Solar Market by Value, 2021-2031 (USD Billion, AGR (%), CAGR (%)) (L-Shaped Recovery)
Table 106. France Marine Solar Market by Value, 2021-2031 (USD Billion, AGR (%), CAGR (%))
Table 107. France Marine Solar Market by Value, 2021-2031 (USD Billion, AGR (%), CAGR (%)) (V-Shaped Recovery)
Table 108. France Marine Solar Market by Value, 2021-2031 (USD Billion, AGR (%), CAGR (%)) (W-Shaped Recovery)
Table 109. France Marine Solar Market by Value, 2021-2031 (USD Billion, AGR (%), CAGR (%)) (U-Shaped Recovery)
Table 110. France Marine Solar Market by Value, 2021-2031 (USD Billion, AGR (%), CAGR (%)) (L-Shaped Recovery)
Table 111. Italy Marine Solar Market by Value, 2021-2031 (USD Billion, AGR (%), CAGR (%))
Table 112. Italy Marine Solar Market by Value, 2021-2031 (USD Billion, AGR (%), CAGR (%)) (V-Shaped Recovery)
Table 113. Italy Marine Solar Market by Value, 2021-2031 (USD Billion, AGR (%), CAGR (%)) (W-Shaped Recovery)
Table 114. Italy Marine Solar Market by Value, 2021-2031 (USD Billion, AGR (%), CAGR (%)) (U-Shaped Recovery)
Table 115. Italy Marine Solar Market by Value, 2021-2031 (USD Billion, AGR (%), CAGR (%)) (L-Shaped Recovery)
Table 116. Spain Marine Solar Market by Value, 2021-2031 (USD Billion, AGR (%), CAGR (%))
Table 117. Spain Marine Solar Market by Value, 2021-2031 (USD Billion, AGR (%), CAGR (%)) (V-Shaped Recovery)
Table 118. Spain Marine Solar Market by Value, 2021-2031 (USD Billion, AGR (%), CAGR (%)) (W-Shaped Recovery)
Table 119. Spain Marine Solar Market by Value, 2021-2031 (USD Billion, AGR (%), CAGR (%)) (U-Shaped Recovery)
Table 120. Spain Marine Solar Market by Value, 2021-2031 (USD Billion, AGR (%), CAGR (%)) (L-Shaped Recovery)
Table 121. Rest of Europe Marine Solar Market by Value, 2021-2031 (USD Billion, AGR (%), CAGR (%))
Table 122. Rest of Europe Marine Solar Market by Value, 2021-2031 (USD Billion, AGR (%), CAGR (%)) (V-Shaped Recovery)
Table 123. Rest of Europe Marine Solar Market by Value, 2021-2031 (USD Billion, AGR (%), CAGR (%)) (W-Shaped Recovery)
Table 124. Rest of Europe Marine Solar Market by Value, 2021-2031 (USD Billion, AGR (%), CAGR (%)) (U-Shaped Recovery)
Table 125. Rest of Europe Marine Solar Market by Value, 2021-2031 (USD Billion, AGR (%), CAGR (%)) (L-Shaped Recovery)
Table 126. Asia-Pacific Marine Solar Market by Value, 2021-2031 (USD Billion, AGR (%), CAGR (%))
Table 127. Asia-Pacific Marine Solar Market by Value, 2021-2031 (USD Billion, AGR (%), CAGR (%)) (V-Shaped Recovery)
Table 128. Asia-Pacific Marine Solar Market by Value, 2021-2031 (USD Billion, AGR (%), CAGR (%)) (W-Shaped Recovery)
Table 129. Asia-Pacific Marine Solar Market by Value, 2021-2031 (USD Billion, AGR (%), CAGR (%)) (U-Shaped Recovery)
Table 130. Asia-Pacific Marine Solar Market by Value, 2021-2031 (USD Billion, AGR (%), CAGR (%)) (L-Shaped Recovery)
Table 131. Asia-Pacific Marine Solar Market by Technology, 2021-2031 (USD Billion, AGR (%), CAGR (%))
Table 132. Asia-Pacific Marine Solar Market by Technology, 2021-2031 (USD Billion, AGR (%), CAGR (%)) (V-Shaped Recovery)
Table 133. Asia-Pacific Marine Solar Market by Technology, 2021-2031 (USD Billion, AGR (%), CAGR (%)) (W-Shaped Recovery)
Table 134. Asia-Pacific Marine Solar Market by Technology, 2021-2031 (USD Billion, AGR (%), CAGR (%)) (U-Shaped Recovery)
Table 135. Asia-Pacific Marine Solar Market by Technology, 2021-2031 (USD Billion, AGR (%), CAGR (%)) (L-Shaped Recovery)
Table 136. Asia-Pacific Marine Solar Market by Solar Module, 2021-2031 (USD Billion, AGR (%), CAGR (%))
Table 137. Asia-Pacific Marine Solar Market by Solar Module, 2021-2031 (USD Billion, AGR (%), CAGR (%)) (V-Shaped Recovery)
Table 138. Asia-Pacific Marine Solar Market by Solar Module, 2021-2031 (USD Billion, AGR (%), CAGR (%)) (W-Shaped Recovery)
Table 139. Asia-Pacific Marine Solar Market by Solar Module, 2021-2031 (USD Billion, AGR (%), CAGR (%)) (U-Shaped Recovery)
Table 140. Asia-Pacific Marine Solar Market by Solar Module, 2021-2031 (USD Billion, AGR (%), CAGR (%)) (L-Shaped Recovery)
Table 141. Asia-Pacific Marine Solar Market by Component, 2021-2031 (USD Billion, AGR (%), CAGR (%))
Table 142. Asia-Pacific Marine Solar Market by Component, 2021-2031 (USD Billion, AGR (%), CAGR (%)) (V-Shaped Recovery)
Table 143. Asia-Pacific Marine Solar Market by Component, 2021-2031 (USD Billion, AGR (%), CAGR (%)) (W-Shaped Recovery)
Table 144. Asia-Pacific Marine Solar Market by Component, 2021-2031 (USD Billion, AGR (%), CAGR (%)) (U-Shaped Recovery)
Table 145. Asia-Pacific Marine Solar Market by Component, 2021-2031 (USD Billion, AGR (%), CAGR (%)) (L-Shaped Recovery)
Table 146. Asia-Pacific Marine Solar Market by End-User, 2021-2031 (USD Billion, AGR (%), CAGR (%))
Table 147. Asia-Pacific Marine Solar Market by End-User, 2021-2031 (USD Billion, AGR (%), CAGR (%)) (V-Shaped Recovery)
Table 148. Asia-Pacific Marine Solar Market by End-User, 2021-2031 (USD Billion, AGR (%), CAGR (%)) (W-Shaped Recovery)
Table 149. Asia-Pacific Marine Solar Market by End-User, 2021-2031 (USD Billion, AGR (%), CAGR (%)) (U-Shaped Recovery)
Table 150. Asia-Pacific Marine Solar Market by End-User, 2021-2031 (USD Billion, AGR (%), CAGR (%)) (L-Shaped Recovery)
Table 151. China Marine Solar Market by Value, 2021-2031 (USD Billion, AGR (%), CAGR (%))
Table 152. China Marine Solar Market by Value, 2021-2031 (USD Billion, AGR (%), CAGR (%)) (V-Shaped Recovery)
Table 153. China Marine Solar Market by Value, 2021-2031 (USD Billion, AGR (%), CAGR (%)) (W-Shaped Recovery)
Table 154. China Marine Solar Market by Value, 2021-2031 (USD Billion, AGR (%), CAGR (%)) (U-Shaped Recovery)
Table 155. China Marine Solar Market by Value, 2021-2031 (USD Billion, AGR (%), CAGR (%)) (L-Shaped Recovery)
Table 156. India Marine Solar Market by Value, 2021-2031 (USD Billion, AGR (%), CAGR (%))
Table 157. India Marine Solar Market by Value, 2021-2031 (USD Billion, AGR (%), CAGR (%)) (V-Shaped Recovery)
Table 158. India Marine Solar Market by Value, 2021-2031 (USD Billion, AGR (%), CAGR (%)) (W-Shaped Recovery)
Table 159. India Marine Solar Market by Value, 2021-2031 (USD Billion, AGR (%), CAGR (%)) (U-Shaped Recovery)
Table 160. India Marine Solar Market by Value, 2021-2031 (USD Billion, AGR (%), CAGR (%)) (L-Shaped Recovery)
Table 161. Japan Marine Solar Market by Value, 2021-2031 (USD Billion, AGR (%), CAGR (%))
Table 162. Japan Marine Solar Market by Value, 2021-2031 (USD Billion, AGR (%), CAGR (%)) (V-Shaped Recovery)
Table 163. Japan Marine Solar Market by Value, 2021-2031 (USD Billion, AGR (%), CAGR (%)) (W-Shaped Recovery)
Table 164. Japan Marine Solar Market by Value, 2021-2031 (USD Billion, AGR (%), CAGR (%)) (U-Shaped Recovery)
Table 165. Japan Marine Solar Market by Value, 2021-2031 (USD Billion, AGR (%), CAGR (%)) (L-Shaped Recovery)
Table 166. South Korea Marine Solar Market by Value, 2021-2031 (USD Billion, AGR (%), CAGR (%))
Table 167. South Korea Marine Solar Market by Value, 2021-2031 (USD Billion, AGR (%), CAGR (%)) (V-Shaped Recovery)
Table 168. South Korea Marine Solar Market by Value, 2021-2031 (USD Billion, AGR (%), CAGR (%)) (W-Shaped Recovery)
Table 169. South Korea Marine Solar Market by Value, 2021-2031 (USD Billion, AGR (%), CAGR (%)) (U-Shaped Recovery)
Table 170. South Korea Marine Solar Market by Value, 2021-2031 (USD Billion, AGR (%), CAGR (%)) (L-Shaped Recovery)
Table 171. Australia Marine Solar Market by Value, 2021-2031 (USD Billion, AGR (%), CAGR (%))
Table 172. Australia Marine Solar Market by Value, 2021-2031 (USD Billion, AGR (%), CAGR (%)) (V-Shaped Recovery)
Table 173. Australia Marine Solar Market by Value, 2021-2031 (USD Billion, AGR (%), CAGR (%)) (W-Shaped Recovery)
Table 174. Australia Marine Solar Market by Value, 2021-2031 (USD Billion, AGR (%), CAGR (%)) (U-Shaped Recovery)
Table 175. Australia Marine Solar Market by Value, 2021-2031 (USD Billion, AGR (%), CAGR (%)) (L-Shaped Recovery)
Table 176. Rest of Asia-Pacific Marine Solar Market by Value, 2021-2031 (USD Billion, AGR (%), CAGR (%))
Table 177. Rest of Asia-Pacific Marine Solar Market by Value, 2021-2031 (USD Billion, AGR (%), CAGR (%)) (V-Shaped Recovery)
Table 178. Rest of Asia-Pacific Marine Solar Market by Value, 2021-2031 (USD Billion, AGR (%), CAGR (%)) (W-Shaped Recovery)
Table 179. Rest of Asia-Pacific Marine Solar Market by Value, 2021-2031 (USD Billion, AGR (%), CAGR (%)) (U-Shaped Recovery)
Table 180. Rest of Asia-Pacific Marine Solar Market by Value, 2021-2031 (USD Billion, AGR (%), CAGR (%)) (L-Shaped Recovery)
Table 181. LAMEA Marine Solar Market by Value, 2021-2031 (USD Billion, AGR (%), CAGR (%))
Table 182. LAMEA Marine Solar Market by Value, 2021-2031 (USD Billion, AGR (%), CAGR (%)) (V-Shaped Recovery)
Table 183. LAMEA Marine Solar Market by Value, 2021-2031 (USD Billion, AGR (%), CAGR (%)) (W-Shaped Recovery)
Table 184. LAMEA Marine Solar Market by Value, 2021-2031 (USD Billion, AGR (%), CAGR (%)) (U-Shaped Recovery)
Table 185. LAMEA Marine Solar Market by Value, 2021-2031 (USD Billion, AGR (%), CAGR (%)) (L-Shaped Recovery)
Table 186. LAMEA Marine Solar Market by Technology, 2021-2031 (USD Billion, AGR (%), CAGR (%))
Table 187. LAMEA Marine Solar Market by Technology, 2021-2031 (USD Billion, AGR (%), CAGR (%)) (V-Shaped Recovery)
Table 188. LAMEA Marine Solar Market by Technology, 2021-2031 (USD Billion, AGR (%), CAGR (%)) (W-Shaped Recovery)
Table 189. LAMEA Marine Solar Market by Technology, 2021-2031 (USD Billion, AGR (%), CAGR (%)) (U-Shaped Recovery)
Table 190. LAMEA Marine Solar Market by Technology, 2021-2031 (USD Billion, AGR (%), CAGR (%)) (L-Shaped Recovery)
Table 191. LAMEA Marine Solar Market by Solar Module, 2021-2031 (USD Billion, AGR (%), CAGR (%))
Table 192. LAMEA Marine Solar Market by Solar Module, 2021-2031 (USD Billion, AGR (%), CAGR (%)) (V-Shaped Recovery)
Table 193. LAMEA Marine Solar Market by Solar Module, 2021-2031 (USD Billion, AGR (%), CAGR (%)) (W-Shaped Recovery)
Table 194. LAMEA Marine Solar Market by Solar Module, 2021-2031 (USD Billion, AGR (%), CAGR (%)) (U-Shaped Recovery)
Table 195. LAMEA Marine Solar Market by Solar Module, 2021-2031 (USD Billion, AGR (%), CAGR (%)) (L-Shaped Recovery)
Table 196. LAMEA Marine Solar Market by Component, 2021-2031 (USD Billion, AGR (%), CAGR (%))
Table 197. LAMEA Marine Solar Market by Component, 2021-2031 (USD Billion, AGR (%), CAGR (%)) (V-Shaped Recovery)
Table 198. LAMEA Marine Solar Market by Component, 2021-2031 (USD Billion, AGR (%), CAGR (%)) (W-Shaped Recovery)
Table 199. LAMEA Marine Solar Market by Component, 2021-2031 (USD Billion, AGR (%), CAGR (%)) (U-Shaped Recovery)
Table 200. LAMEA Marine Solar Market by Component, 2021-2031 (USD Billion, AGR (%), CAGR (%)) (L-Shaped Recovery)
Table 201. LAMEA Marine Solar Market by End-User, 2021-2031 (USD Billion, AGR (%), CAGR (%))
Table 202. LAMEA Marine Solar Market by End-User, 2021-2031 (USD Billion, AGR (%), CAGR (%)) (V-Shaped Recovery)
Table 203. LAMEA Marine Solar Market by End-User, 2021-2031 (USD Billion, AGR (%), CAGR (%)) (W-Shaped Recovery)
Table 204. LAMEA Marine Solar Market by End-User, 2021-2031 (USD Billion, AGR (%), CAGR (%)) (U-Shaped Recovery)
Table 205. LAMEA Marine Solar Market by End-User, 2021-2031 (USD Billion, AGR (%), CAGR (%)) (L-Shaped Recovery)
Table 206. Brazil Marine Solar Market by Value, 2021-2031 (USD Billion, AGR (%), CAGR (%))
Table 207. Brazil Marine Solar Market by Value, 2021-2031 (USD Billion, AGR (%), CAGR (%)) (V-Shaped Recovery)
Table 208. Brazil Marine Solar Market by Value, 2021-2031 (USD Billion, AGR (%), CAGR (%)) (W-Shaped Recovery)
Table 209. Brazil Marine Solar Market by Value, 2021-2031 (USD Billion, AGR (%), CAGR (%)) (U-Shaped Recovery)
Table 210. Brazil Marine Solar Market by Value, 2021-2031 (USD Billion, AGR (%), CAGR (%)) (U-Shaped Recovery)
Table 211. Saudi Arabia Marine Solar Market by Value, 2021-2031 (USD Billion, AGR (%), CAGR (%))
Table 212. Saudi Arabia Marine Solar Market by Value, 2021-2031 (USD Billion, AGR (%), CAGR (%)) (V-Shaped Recovery)
Table 213. Saudi Arabia Marine Solar Market by Value, 2021-2031 (USD Billion, AGR (%), CAGR (%)) (W-Shaped Recovery)
Table 214. Saudi Arabia Marine Solar Market by Value, 2021-2031 (USD Billion, AGR (%), CAGR (%)) (U-Shaped Recovery)
Table 215. Saudi Arabia Marine Solar Market by Value, 2021-2031 (USD Billion, AGR (%), CAGR (%)) (L-Shaped Recovery)
Table 216. South Africa Marine Solar Market by Value, 2021-2031 (USD Billion, AGR (%), CAGR (%))
Table 217. South Africa Marine Solar Market by Value, 2021-2031 (USD Billion, AGR (%), CAGR (%)) (V-Shaped Recovery)
Table 218. South Africa Marine Solar Market by Value, 2021-2031 (USD Billion, AGR (%), CAGR (%)) (W-Shaped Recovery)
Table 219. South Africa Marine Solar Market by Value, 2021-2031 (USD Billion, AGR (%), CAGR (%)) (U-Shaped Recovery)
Table 220. South Africa Marine Solar Market by Value, 2021-2031 (USD Billion, AGR (%), CAGR (%)) (L-Shaped Recovery)
Table 221. Mexico Marine Solar Market by Value, 2021-2031 (USD Billion, AGR (%), CAGR (%))
Table 222. Mexico Marine Solar Market by Value, 2021-2031 (USD Billion, AGR (%), CAGR (%)) (V-Shaped Recovery)
Table 223. Mexico Marine Solar Market by Value, 2021-2031 (USD Billion, AGR (%), CAGR (%)) (W-Shaped Recovery)
Table 224. Mexico Marine Solar Market by Value, 2021-2031 (USD Billion, AGR (%), CAGR (%)) (U-Shaped Recovery)
Table 225. Mexico Marine Solar Market by Value, 2021-2031 (USD Billion, AGR (%), CAGR (%)) (L-Shaped Recovery)
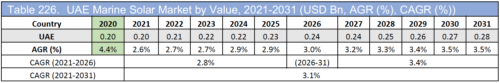
Table 226. UAE Marine Solar Market by Value, 2021-2031 (USD Billion, AGR (%), CAGR (%))
Table 227. UAE Marine Solar Market by Value, 2021-2031 (USD Billion, AGR (%), CAGR (%)) (V-Shaped Recovery)
Table 228. UAE Marine Solar Market by Value, 2021-2031 (USD Billion, AGR (%), CAGR (%)) (W-Shaped Recovery)
Table 229. UAE Marine Solar Market by Value, 2021-2031 (USD Billion, AGR (%), CAGR (%)) (U-Shaped Recovery)
Table 230. UAE Marine Solar Market by Value, 2021-2031 (USD Billion, AGR (%), CAGR (%)) (L-Shaped Recovery)
Table 231. Rest of LAMEA Marine Solar Market by Value, 2021-2031 (USD Billion, AGR (%), CAGR (%))
Table 232. Rest of LAMEA Marine Solar Market by Value, 2021-2031 (USD Billion, AGR (%), CAGR (%)) (V-Shaped Recovery)
Table 233. Rest of LAMEA Marine Solar Market by Value, 2021-2031 (USD Billion, AGR (%), CAGR (%)) (W-Shaped Recovery)
Table 234. Rest of LAMEA Marine Solar Market by Value, 2021-2031 (USD Billion, AGR (%), CAGR (%)) (U-Shaped Recovery)
Table 235. Rest of LAMEA Marine Solar Market by Value, 2021-2031 (USD Billion, AGR (%), CAGR (%)) (L-Shaped Recovery)
Table 236. Top 15 Module Producers (Rank, Company)
Table 237. Top 15 Cell Producers (Rank, Company)
Table 238. Top Polysilicon Wafer Manufacturers (Rank, Company)
Table 239. Top Polysilicon Wafer Manufacturers (Rank, Company)
List of Figure
Figure 1. Global Marine Solar Market Forecast, 2021-2031 (USD Billion, AGR (%))
Figure 2. Global Marine Solar Market Segmentation
Figure 3. Global Marine Solar Market Forecast, 2021-2031 (USD Billion, AGR (%))
Figure 4. Diagram of a typical electrical system for a ship
Figure 5. Energy Generation from Various Sources 2006-2030 (Trillion Wh)
Figure 6. Percentage Share of Renewable Energy in the Global Energy Market 2006-2030
Figure 7. Global Marine Solar Market Forecast, 2021-2031 (USD Billion, AGR (%))
Figure 8. Global Marine Solar Market Forecast, 2021-2031 (USD Billion, AGR (%)) (V-Shaped Recovery)
Figure 9. Global Marine Solar Market Forecast, 2021-2031 (USD Billion, AGR (%)) (W-Shaped Recovery)
Figure 10. Global Marine Solar Market Forecast, 2021-2031 (USD Billion, AGR (%)) (U-Shaped Recovery)
Figure 11. Global Marine Solar Market Forecast, 2021-2031 (USD Billion, AGR (%)) (L-Shaped Recovery)
Figure 12. Global Marine Solar Market Forecast, 2021-2031 (USD Billion, AGR (%))
Figure 13. Global Marine Solar Market Forecast, 2021-2031 (USD Billion, AGR (%))
Figure 14. Global Marine Solar Market Forecast, 2021-2031 (USD Billion, AGR (%))
Figure 15. Global Marine Solar Market Forecast, 2021-2031 (USD Billion, AGR (%))
Figure 16. Global Marine Solar Market by Technology, 2021-2031 (USD Billion, AGR (%))
Figure 17. Global Marine Solar Market by Technology, 2021-2031 (USD Billion, AGR (%)) (V-Shaped Recovery)
Figure 18. Global Marine Solar Market by Technology, 2021-2031 (USD Billion, AGR (%)) (W-Shaped Recovery)
Figure 19. Global Marine Solar Market by Technology, 2021-2031 (USD Billion, AGR (%)) (U-Shaped Recovery)
Figure 20. Global Marine Solar Market by Technology, 2021-2031 (USD Billion, AGR (%)) (L-Shaped Recovery)
Figure 21. Global Marine Solar Market by Solar Module, 2021-2031 (USD Billion, AGR (%))
Figure 22. Global Marine Solar Market by Solar Module, 2021-2031 (USD Billion, AGR (%)) (V-Shaped Recovery)
Figure 23. Global Marine Solar Market by Solar Module, 2021-2031 (USD Billion, AGR (%)) (W-Shaped Recovery)
Figure 24. Global Marine Solar Market by Solar Module, 2021-2031 (USD Billion, AGR (%)) (U-Shaped Recovery)
Figure 25. Global Marine Solar Market by Solar Module, 2021-2031 (USD Billion, AGR (%)) (L-Shaped Recovery)
Figure 26. Global Marine Solar Market by Component, 2021-2031 (USD Billion, AGR (%))
Figure 27. Global Marine Solar Market by Component, 2021-2031 (USD Billion, AGR (%)) (V-Shaped Recovery)
Figure 28. Global Marine Solar Market by Component, 2021-2031 (USD Billion, AGR (%)) (W-Shaped Recovery)
Figure 29. Global Marine Solar Market by Component, 2021-2031 (USD Billion, AGR (%)) (U-Shaped Recovery)
Figure 30. Global Marine Solar Market by Component, 2021-2031 (USD Billion, AGR (%)) (L-Shaped Recovery)
Figure 31. Global Marine Solar Market by End-User, 2021-2031 (USD Billion, AGR (%))
Figure 32. Global Marine Solar Market by End-User, 2021-2031 (USD Billion, AGR (%)) (V-Shaped Recovery)
Figure 33. Global Marine Solar Market by End-User, 2021-2031 (USD Billion, AGR (%)) (W-Shaped Recovery)
Figure 34. Global Marine Solar Market by End-User, 2021-2031 (USD Billion, AGR (%)) (U-Shaped Recovery)
Figure 35. Global Marine Solar Market by End-User, 2021-2031 (USD Billion, AGR (%)) (L-Shaped Recovery)
Figure 36. Global Marine Solar Market by Region, 2021-2031 (USD Billion, AGR (%))
Figure 37. Global Marine Solar Market by Region, 2021-2031 (USD Billion, AGR (%)) (V-Shaped Recovery)
Figure 38. Global Marine Solar Market by Region, 2021-2031 (USD Billion, AGR (%)) (W-Shaped Recovery)
Figure 39. Global Marine Solar Market by Region, 2021-2031 (USD Billion, AGR (%)) (U-Shaped Recovery)
Figure 40. Global Marine Solar Market by Region, 2021-2031 (USD Billion, AGR (%)) (L-Shaped Recovery)
Figure 41. North America Marine Solar Market by Value, 2021-2031 (USD Billion, AGR (%))
Figure 42. North America Marine Solar Market by Value, 2021-2031 (USD Billion, AGR (%)) (V-Shaped Recovery)
Figure 43. North America Marine Solar Market by Value, 2021-2031 (USD Billion, AGR (%)) (W-Shaped Recovery)
Figure 44. North America Marine Solar Market by Value, 2021-2031 (USD Billion, AGR (%)) (U-Shaped Recovery)
Figure 45. North America Marine Solar Market by Value, 2021-2031 (USD Billion, AGR (%)) (L-Shaped Recovery)
Figure 46. North America Marine Solar Market by Technology, 2021-2031 (USD Billion, AGR (%))
Figure 47. North America Marine Solar Market by Technology, 2021-2031 (USD Billion, AGR (%)) (V-Shaped Recovery)
Figure 48. North America Marine Solar Market by Technology, 2021-2031 (USD Billion, AGR (%)) (W-Shaped Recovery)
Figure 49. North America Marine Solar Market by Technology, 2021-2031 (USD Billion, AGR (%)) (U-Shaped Recovery)
Figure 50. North America Marine Solar Market by Technology, 2021-2031 (USD Billion, AGR (%)) (L-Shaped Recovery)
Figure 51. North America Marine Solar Market by Solar Module, 2021-2031 (USD Billion, AGR (%))
Figure 52. North America Marine Solar Market by Solar Module, 2021-2031 (USD Billion, AGR (%)) (V-Shaped Recovery)
Figure 53. North America Marine Solar Market by Solar Module, 2021-2031 (USD Billion, AGR (%)) (W-Shaped Recovery)
Figure 54. North America Marine Solar Market by Solar Module, 2021-2031 (USD Billion, AGR (%)) (U-Shaped Recovery)
Figure 55. North America Marine Solar Market by Solar Module, 2021-2031 (USD Billion, AGR (%)) (L-Shaped Recovery)
Figure 56. North America Marine Solar Market by Component, 2021-2031 (USD Billion, AGR (%))
Figure 57. North America Marine Solar Market by Component, 2021-2031 (USD Billion, AGR (%)) (V-Shaped Recovery)
Figure 58. North America Marine Solar Market by Component, 2021-2031 (USD Billion, AGR (%)) (W-Shaped Recovery)
Figure 59. North America Marine Solar Market by Component, 2021-2031 (USD Billion, AGR (%)) (U-Shaped Recovery)
Figure 60. North America Marine Solar Market by Component, 2021-2031 (USD Billion, AGR (%)) (L-Shaped Recovery)
Figure 61. North America Marine Solar Market by End-User, 2021-2031 (USD Billion, AGR (%))
Figure 62. North America Marine Solar Market by End-User, 2021-2031 (USD Billion, AGR (%)) (V-Shaped Recovery)
Figure 63. North America Marine Solar Market by End-User, 2021-2031 (USD Billion, AGR (%)) (W-Shaped Recovery)
Figure 64. North America Marine Solar Market by End-User, 2021-2031 (USD Billion, AGR (%)) (U-Shaped Recovery)
Figure 65. North America Marine Solar Market by End-User, 2021-2031 (USD Billion, AGR (%)) (L-Shaped Recovery)
Figure 66. North America Marine Solar Market by Country, 2021-2031 (USD Billion, AGR (%))
Figure 67. North America Marine Solar Market by Country, 2021-2031 (USD Billion, AGR (%)) (V-Shaped Recovery)
Figure 68. North America Marine Solar Market by Country, 2021-2031 (USD Billion, AGR (%)) (W-Shaped Recovery)
Figure 69. North America Marine Solar Market by Country, 2021-2031 (USD Billion, AGR (%)) (U-Shaped Recovery)
Figure 70. North America Marine Solar Market by Country, 2021-2031 (USD Billion, AGR (%)) (L-Shaped Recovery)
Figure 71. Europe Marine Solar Market by Value, 2021-2031 (USD Billion, AGR (%))
Figure 72. Europe Marine Solar Market by Value, 2021-2031 (USD Billion, AGR (%)) (V-Shaped Recovery)
Figure 73. Europe Marine Solar Market by Value, 2021-2031 (USD Billion, AGR (%)) (W-Shaped Recovery)
Figure 74. Europe Marine Solar Market by Value, 2021-2031 (USD Billion, AGR (%)) (U-Shaped Recovery)
Figure 75. Europe Marine Solar Market by Value, 2021-2031 (USD Billion, AGR (%)) (L-Shaped Recovery)
Figure 76. Europe Marine Solar Market by Technology, 2021-2031 (USD Billion, AGR (%))
Figure 77. Europe Marine Solar Market by Technology, 2021-2031 (USD Billion, AGR (%)) (V-Shaped Recovery)
Figure 78. Europe Marine Solar Market by Technology, 2021-2031 (USD Billion, AGR (%)) (W-Shaped Recovery)
Figure 79. Europe Marine Solar Market by Technology, 2021-2031 (USD Billion, AGR (%)) (U-Shaped Recovery)
Figure 80. Europe Marine Solar Market by Technology, 2021-2031 (USD Billion, AGR (%)) (L-Shaped Recovery)
Figure 81. Europe Marine Solar Market by Solar Module, 2021-2031 (USD Billion, AGR (%))
Figure 82. Europe Marine Solar Market by Solar Module, 2021-2031 (USD Billion, AGR (%)) (V-Shaped Recovery)
Figure 83. Europe Marine Solar Market by Solar Module, 2021-2031 (USD Billion, AGR (%)) (W-Shaped Recovery)
Figure 84. Europe Marine Solar Market by Solar Module, 2021-2031 (USD Billion, AGR (%)) (U-Shaped Recovery)
Figure 85. Europe Marine Solar Market by Solar Module, 2021-2031 (USD Billion, AGR (%)) (L-Shaped Recovery)
Figure 86. Europe Marine Solar Market by Component, 2021-2031 (USD Billion, AGR (%))
Figure 87. Europe Marine Solar Market by Component, 2021-2031 (USD Billion, AGR (%)) (V-Shaped Recovery)
Figure 88. Europe Marine Solar Market by Component, 2021-2031 (USD Billion, AGR (%)) (W-Shaped Recovery)
Figure 89. Europe Marine Solar Market by Component, 2021-2031 (USD Billion, AGR (%)) (U-Shaped Recovery)
Figure 90. Europe Marine Solar Market by Component, 2021-2031 (USD Billion, AGR (%)) (L-Shaped Recovery)
Figure 91. Europe Marine Solar Market by End-User, 2021-2031 (USD Billion, AGR (%))
Figure 92. Europe Marine Solar Market by End-User, 2021-2031 (USD Billion, AGR (%)) (V-Shaped Recovery)
Figure 93. Europe Marine Solar Market by End-User, 2021-2031 (USD Billion, AGR (%)) (W-Shaped Recovery)
Figure 94. Europe Marine Solar Market by End-User, 2021-2031 (USD Billion, AGR (%)) (U-Shaped Recovery)
Figure 95. Europe Marine Solar Market by End-User, 2021-2031 (USD Billion, AGR (%)) (L-Shaped Recovery)
Figure 96. Europe Marine Solar Market by Country, 2021-2031 (USD Billion, AGR (%))
Figure 97. Europe Marine Solar Market by Country, 2021-2031 (USD Billion, AGR (%)) (V-Shaped Recovery)
Figure 98. Europe Marine Solar Market by Country, 2021-2031 (USD Billion, AGR (%)) (W-Shaped Recovery)
Figure 99. Europe Marine Solar Market by Country, 2021-2031 (USD Billion, AGR (%)) (U-Shaped Recovery)
Figure 100. Europe Marine Solar Market by Country, 2021-2031 (USD Billion, AGR (%)) (L-Shaped Recovery)
Figure 101. Asia-Pacific Marine Solar Market by Value, 2021-2031 (USD Billion, AGR (%))
Figure 102. Asia-Pacific Marine Solar Market by Value, 2021-2031 (USD Billion, AGR (%)) (V-Shaped Recovery)
Figure 103. Asia-Pacific Marine Solar Market by Value, 2021-2031 (USD Billion, AGR (%)) (W-Shaped Recovery)
Figure 104. Asia-Pacific Marine Solar Market by Value, 2021-2031 (USD Billion, AGR (%)) (U-Shaped Recovery)
Figure 105. Asia-Pacific Marine Solar Market by Value, 2021-2031 (USD Billion, AGR (%)) (L-Shaped Recovery)
Figure 106. Asia-Pacific Marine Solar Market by Technology, 2021-2031 (USD Billion, AGR (%))
Figure 107. Asia-Pacific Marine Solar Market by Technology, 2021-2031 (USD Billion, AGR (%)) (V-Shaped Recovery)
Figure 108. Asia-Pacific Marine Solar Market by Technology, 2021-2031 (USD Billion, AGR (%)) (W-Shaped Recovery)
Figure 109. Asia-Pacific Marine Solar Market by Technology, 2021-2031 (USD Billion, AGR (%)) (U-Shaped Recovery)
Figure 110. Asia-Pacific Marine Solar Market by Technology, 2021-2031 (USD Billion, AGR (%)) (L-Shaped Recovery)
Figure 111. Asia-Pacific Marine Solar Market by Solar Module, 2021-2031 (USD Billion, AGR (%))
Figure 112. Asia-Pacific Marine Solar Market by Solar Module, 2021-2031 (USD Billion, AGR (%)) (V-Shaped Recovery)
Figure 113. Asia-Pacific Marine Solar Market by Solar Module, 2021-2031 (USD Billion, AGR (%)) (W-Shaped Recovery)
Figure 114. Asia-Pacific Marine Solar Market by Solar Module, 2021-2031 (USD Billion, AGR (%)) (U-Shaped Recovery)
Figure 115. Asia-Pacific Marine Solar Market by Solar Module, 2021-2031 (USD Billion, AGR (%)) (L-Shaped Recovery)
Figure 116. Asia-Pacific Marine Solar Market by Component, 2021-2031 (USD Billion, AGR (%))
Figure 117. Asia-Pacific Marine Solar Market by Component, 2021-2031 (USD Billion, AGR (%)) (V-Shaped Recovery)
Figure 118. Asia-Pacific Marine Solar Market by Component, 2021-2031 (USD Billion, AGR (%)) (W-Shaped Recovery)
Figure 119. Asia-Pacific Marine Solar Market by Component, 2021-2031 (USD Billion, AGR (%)) (U-Shaped Recovery)
Figure 120. Asia-Pacific Marine Solar Market by Component, 2021-2031 (USD Billion, AGR (%)) (L-Shaped Recovery)
Figure 121. Asia-Pacific Marine Solar Market by End-User, 2021-2031 (USD Billion, AGR (%))
Figure 122. Asia-Pacific Marine Solar Market by End-User, 2021-2031 (USD Billion, AGR (%)) (V-Shaped Recovery)
Figure 123. Asia-Pacific Marine Solar Market by End-User, 2021-2031 (USD Billion, AGR (%)) (W-Shaped Recovery)
Figure 124. Asia-Pacific Marine Solar Market by End-User, 2021-2031 (USD Billion, AGR (%)) (U-Shaped Recovery)
Figure 125. Asia-Pacific Marine Solar Market by End-User, 2021-2031 (USD Billion, AGR (%)) (L-Shaped Recovery)
Figure 126. Asia-Pacific Marine Solar Market by Country, 2021-2031 (USD Billion, AGR (%))
Figure 127. Asia-Pacific Marine Solar Market by Country, 2021-2031 (USD Billion, AGR (%)) (V-Shaped Recovery)
Figure 128. Asia-Pacific Marine Solar Market by Country, 2021-2031 (USD Billion, AGR (%)) (W-Shaped Recovery)
Figure 129. Asia-Pacific Marine Solar Market by Country, 2021-2031 (USD Billion, AGR (%)) (U-Shaped Recovery)
Figure 130. Asia-Pacific Marine Solar Market by Country, 2021-2031 (USD Billion, AGR (%)) (L-Shaped Recovery)
Figure 131. LAMEA Marine Solar Market by Value, 2021-2031 (USD Billion, AGR (%))
Figure 132. LAMEA Marine Solar Market by Value, 2021-2031 (USD Billion, AGR (%)) (V-Shaped Recovery)
Figure 133. LAMEA Marine Solar Market by Value, 2021-2031 (USD Billion, AGR (%)) (W-Shaped Recovery)
Figure 134. LAMEA Marine Solar Market by Value, 2021-2031 (USD Billion, AGR (%)) (U-Shaped Recovery)
Figure 135. LAMEA Marine Solar Market by Value, 2021-2031 (USD Billion, AGR (%)) (L-Shaped Recovery)
Figure 136. LAMEA Marine Solar Market by Technology, 2021-2031 (USD Billion, AGR (%))
Figure 137. LAMEA Marine Solar Market by Technology, 2021-2031 (USD Billion, AGR (%)) (V-Shaped Recovery)
Figure 138. LAMEA Marine Solar Market by Technology, 2021-2031 (USD Billion, AGR (%)) (W-Shaped Recovery)
Figure 139. LAMEA Marine Solar Market by Technology, 2021-2031 (USD Billion, AGR (%)) (U-Shaped Recovery)
Figure 140. LAMEA Marine Solar Market by Technology, 2021-2031 (USD Billion, AGR (%)) (L-Shaped Recovery)
Figure 141. LAMEA Marine Solar Market by Solar Module, 2021-2031 (USD Billion, AGR (%))
Figure 142. LAMEA Marine Solar Market by Solar Module, 2021-2031 (USD Billion, AGR (%)) (V-Shaped Recovery)
Figure 143. LAMEA Marine Solar Market by Solar Module, 2021-2031 (USD Billion, AGR (%)) (W-Shaped Recovery)
Figure 144. LAMEA Marine Solar Market by Solar Module, 2021-2031 (USD Billion, AGR (%)) (U-Shaped Recovery)
Figure 145. LAMEA Marine Solar Market by Solar Module, 2021-2031 (USD Billion, AGR (%)) (L-Shaped Recovery)
Figure 146. LAMEA Marine Solar Market by Component, 2021-2031 (USD Billion, AGR (%))
Figure 147. LAMEA Marine Solar Market by Component, 2021-2031 (USD Billion, AGR (%)) (V-Shaped Recovery)
Figure 148. LAMEA Marine Solar Market by Component, 2021-2031 (USD Billion, AGR (%)) (W-Shaped Recovery)
Figure 149. LAMEA Marine Solar Market by Component, 2021-2031 (USD Billion, AGR (%)) (U-Shaped Recovery)
Figure 150. LAMEA Marine Solar Market by Component, 2021-2031 (USD Billion, AGR (%)) (L-Shaped Recovery)
Figure 151. LAMEA Marine Solar Market by End-User, 2021-2031 (USD Billion, AGR (%))
Figure 152. LAMEA Marine Solar Market by End-User, 2021-2031 (USD Billion, AGR (%)) (V-Shaped Recovery)
Figure 153. LAMEA Marine Solar Market by End-User, 2021-2031 (USD Billion, AGR (%)) (W-Shaped Recovery)
Figure 154. LAMEA Marine Solar Market by End-User, 2021-2031 (USD Billion, AGR (%)) (U-Shaped Recovery)
Figure 155. LAMEA Marine Solar Market by End-User, 2021-2031 (USD Billion, AGR (%)) (L-Shaped Recovery)
Figure 156. LAMEA Marine Solar Market by Country, 2021-2031 (USD Billion, AGR (%))
Figure 157. LAMEA Marine Solar Market by Country, 2021-2031 (USD Billion, AGR (%)) (V-Shaped Recovery)
Figure 158. LAMEA Marine Solar Market by Country, 2021-2031 (USD Billion, AGR (%)) (W-Shaped Recovery)
Figure 159. LAMEA Marine Solar Market by Country, 2021-2031 (USD Billion, AGR (%)) (U-Shaped Recovery)
Figure 160. LAMEA Marine Solar Market by Country, 2021-2031 (USD Billion, AGR (%)) (L-Shaped Recovery)
List of Companies Profiled in the report
China Everbright Greentech Limited
Hengdian Group DMEGC Magnetics Co., Ltd
Jinko Solar Holding Co., Ltd.
Motech Industries Inc.
REC Silicon ASA
Risen Energy Co., Ltd.
Shenzhen Kingsun Science & Technology Co., Ltd
Shunfeng International Clean Energy Ltd
Solar World AG
SunPower Corporation
List of Other Companies Mentioned in the report
Abengoa Solar S.A.
AllEarth Renewables, Inc.
Amelio Solar
Anel Enerji
Anwell Technologies Limited
Array Technologies Inc.
Ascent Solar Technologies Inc
Astronergy
Atsco Solar
Auria
Avancis
Bangkok Solo
Beijing Xiaocheng Company (BXC)
Best Solar
Beyond PV
Boviet Solar Technology Co
Calyxo
Cambridge Display Technology
Canadian Solar
Capital Dynamics
Center for Advanced Molecular Photovoltaics
Changzhou EGing Photovoltaic Technology Co. Ltd.
Chi Mei Energy Corp
China Sunergy
CN Solar Technology Co
DAI HWA
Danish Solar Energy Ltd
DCH Solar GmbH
DEGERenergie GmbH & Co. KG
Dupont Teijin
E-Ton Solar
Enel Green Power México
Enel Green Power Peru
Energia Ercam SL
Energy Conversion Devices
Engie
ENN Solar Energy
EPV Solar
Ersol Solar
Ethiopian Electric Power Corporation (EEP)
First Solar, Inc.
Flexcell (VHF Technologies)
Formosun Solar Corporate
GCL-Poly Energy Holdings Ltd.
General Electric
German Technical Cooperation
Gintech
Global Solar Energy Inc
Grupo Clavijo
GT Advanced Technology
HC Starck
Hemlock Semiconductor
HHV Solar Technologies
HROTE
Infrastructure Development Company Limited (IDCOL)
JA Solar
JVG Thoma
Kaneka Corporation
Kenmos Photovoltaics
Konarka
Kyocera
Lite Array Holdings Limited
Masdar PV
Matsushita Electric
Mecasolar España SL
Mechatron SA
MEMC Electronic Materials
Merck
Mitsubishi Corporation.
Molecular Solar
Moser Baer Photo Voltaic Ltd
Moser Baer Solar Limited
Motech
Nanogram
Nanosolar
NexPower Technology Corp
Ningbo Solar Electric
OCI
Odersun AG
Orion Photovoltaics
Polar Photovoltaic Co.
Powerway Renewable Energy Co
Q-Cells
Qatar Solar Technologies (QSTec)
Qingdao Eternal Electronic Co. Ltd.
Renewable Energy Corp ASA (REC)
Sanyo
Schott Solar
Sharp Corporation
Shell
Shunfeng International Clean Energy Limited
Siemens
Sierra Solar
Signet Solar
SKY Energy International
Solairedirect
Solar Energy Materials Initiative
Solar Frontier K.K.
Solarfun
Solarion AG
SolarWorld
Solibro GmbH
Solyndra
Sontor
SpectraWatt Inc
Stion
Sulfurcell Solartechnik
Sunfilm
SunFlake
SunPower
SunPower Corporation
Suntech Power
SuntechPower
Taiyo Oil Company
Terna Group
ThyssenKrupp
Titan Tracker SL
Tongwei Solar
Trina Solar
Trony Solar Holdings Company Limited
Twin Creeks Technologies
United Solar
Universal Display Corp.
WackerChemie
Wuerth Solar GmbH
Wuxi HaoSolar Technology
X-ELIO
XsunX
Xunlight Corporation
YingliGreen Energy
List of Associations
Asian Development Bank (ADB)
Beijing Xiaocheng Company (BXC)
Delaware University
Development Bank of Japan
Energy Regulatory Commission, Thailand
Ethiopian Electric Power Corporation (EEP)
Indonesia’s Ministry of Energy and Mineral Resources (ESDM)
Infrastructure Development Company Limited (IDCOL)
Institute of Energy Conversion
International Energy Agency (IEA)
Kfw Germany
Metals and Engineering Corporation of Ethiopia (METEC)
National Energy Administration (NEA)
National Public Services Authority (ASEP)
Nigerian Bulk Electricity Trading (NBET)
Princeton University
Senegalese National Renewable Energy Agency (ANER)
The Alternative Energy Development Council (AEDB)
The Danish Parliament
The Department of Rural Development, the Ministry of Agriculture, Livestock and Irrigation (Myanmar)
The Energy Department (DoE)
The German Bundesnetzagentur
The Global Environment Facility
The Government of Ukraine
The Greek Ministry of Environment, Energy and Climate Change (YPEKA)
The International Renewable Energy Agency (IRENA)
The Islamic Development Bank
The Israeli Electricity Authority
The Ministry of Energy of Turkey
The Ministry of Energy, Green Technology and Water
The Ministry of Renewable Energy (MER) of Senegal
The Moroccan Solar Energy Agency (MASEN)
The National Assembly of France
The National Electric Energy Company (Honduras)
The National Energy Policy Commission of Thailand (NEPC)
The Netherlands Statistical Office
The Rural Electrification Authority (REA) of Kenya
The Russian Government
The State Energy and Mining Company of Jujuy (JEMSE)
The State Incentives Database for Renewables and Efficiency (DSIRE)
The Sustainable Energy Association of Singapore (SEAS)
University of California
University of Tokyo
Volta River Authority (VRA)