What is holding you back from greater success in the Plasma Therapy market?
Though Plasma therapy is not new, the gap between plasma’s demand and supply continues to grow. Many plasma therapy companies are unable to make a move and grab this opportunity – why? In this report we have analysed the plasma therapy market to discover the key success areas to grow during this tough crisis. Buy this unique senior level report to find out how to succeed – TODAY.
Our 360+ page report provides 277 tables, 275 charts, and graphs. Read on to discover the most lucrative areas in the global plasma therapy industry and the future market prospects. Our new study lets you assess forecasted sales at overall world market and regional level. See financial results, trends, opportunities, and revenue predictions. Much opportunity remains in this growing plasma therapy market. Buy our report to see how to exploit these opportunities in the global market.
Forecasts to 2031 and other analyses reveal the commercial prospects
• In addition to revenue forecasting to 2031, our new study provides you with recent results, growth rates, and market shares.
• You find original analyses, with business outlooks and developments.
• Discover qualitative analyses (including market dynamics, drivers, opportunities, restraints and challenges), Porter’s Five Forces Analysis, product profiles and commercial developments.
Discover sales predictions for the global plasma therapy market and submarkets
Along with revenue prediction for the overall world market, there are 5 segmentations of the plasma therapy market, with forecasts for 4 product types, 6 applications, 3 sources, 4 end-users each forecasted at a global, regional, and country level, along with COVID-19 impact recovery pattern analysis for all segments.
To access the data contained in this document please email contactus@visiongain.com
Leading companies and the potential for market growth
As per Visiongain analysis, the overall world revenue for plasma therapy will surpass US$816.5 million by 2031. We predict strong revenue growth through to 2031. Our work identifies which organizations hold the greatest potential. Discover their capabilities, progress, and commercial prospects, helping you stay ahead.

What all Segments are Covered in the Report?
Global Plasma Therapy Market by Source (COVID-19 Impact Recovery Analysis Covered)
• Autologous
• Allogenic
• Other Sources
Global Plasma Therapy Market by Application (COVID-19 Impact Recovery Analysis Covered)
• Orthopaedics
• Dermatology
• Dental
• Cardiac Muscle Injury
• Nerve Injury
• Other Applications
Global Plasma Therapy Market by Type (COVID-19 Impact Recovery Analysis Covered)
• Pure PRP
• Leucocyte-rich PRP
• Pure Platelet-rich Fibrin (PRF)
• Leukocyte-rich Fibrin (L-PRF)
Global Plasma Therapy Market by End-User (COVID-19 Impact Recovery Analysis Covered)
• Hospitals
• Clinics & Care Centres
• Research Institutes
• Other End-User
Global Plasma Therapy Market by Region (COVID-19 Impact Recovery Analysis Covered)
• North America
• Europe
• Asia-Pacific
• Latin America
• Middle East
• Africa
Need industry data? Please contact us today.
Which Key Players Are Leading the Global Market and how much share do they hold?
The global market for blood plasma therapy is ascending and has made significant gains in therapeutic treatments. The players in the blood plasma market are striving to tap the opportunities that this market offers. Companies are trying to explore the available prospects by adopting various strategies such as:
• Mergers and acquisitions.
• Product launches.
• Collaborations and partnerships.
Product approval is a major milestone facing all key competitors in the blood plasma therapy market. Several strategies were implemented by key market players between 2015 and April 2019. The threat of transmission of blood-borne diseases can make regulation that ensures the safety and efficacy of blood plasma proteins and blood plasma therapies unavoidable.
How the Plasma Therapy Market report helps you? Buy this report to find answers for below questions and how can help you to stay updated
• What is the current size of the overall global human plasma therapy market? How much will this market be worth from 2021 to 2031?
• How will market shares of the leading national markets change by 2031, and which geographical region will lead the market in 2031?
• Who are the leading companies and what are their activities, results, developments and prospects?
• What are some of the most prominent human plasma therapy currently in development?
• What are the main trends that will affect the world plasma therapy market between 2021 and 2031?
• What are the main strengths, weaknesses, opportunities and threats for the market?
• What are the social, technological, economic and political influences that will shape that industry over the next ten years?
• How will the global plasma therapy market evolve over the forecasted period, 2021 to 2031?
• How will the market shares for each checkpoint inhibitor anti-cancer treatment submarket develop from 2021 to 2031?
• Which therapies can succeed and what revenues could they generate to 2031?
• What will be the main commercial drivers for the market from 2021 to 2031?
• How will market shares of prominent national markets change from 2021, and which countries will lead the market in 2031, achieving highest revenues and fastest growth?
• How will that industry evolve between 2021 and 2031, especially in R&D?
Leading Players Profiled in the Report
• Biotest AG
• CSL Limited
• Grifols International S.A
• China Biologic Products Holdings, Inc.
• Terumo Corporation
• Johnson & Johnson
• Zimmer Biomet Holdings, Inc.
• Stryker Corporation
• Thermogenesis Holdings, Inc.,
• Nuo Therapeutics, Inc.,
Find quantitative and qualitative analyses with independent predictions. Receive information that only our report contains, staying informed with this invaluable business intelligence.
Information found nowhere else
With our newly report title, you are less likely to fall behind in knowledge or miss out on opportunities. See how our work could benefit your research, analyses, and decisions. Visiongain’s study is for everybody needing commercial analyses for the precision cancer diagnostic tests Market and leading companies. You will find data, trends and predictions.
To access the data contained in this document please email contactus@visiongain.com
Buy our report today Plasma Therapy Market Report 2021-2031: Forecasts by Source (Autologous, Allogenic, Other Sources), by Application (Orthopaedics, Dermatology, Dental, Cardiac Muscle Injury, Nerve Injury, Other Applications), by Type (Pure PRP, Leucocyte-rich PRP, Pure Platelet-rich Fibrin (PRF), Leukocyte-rich Fibrin (L-PRF)), by End-user (Hospitals, Clinics & Care Centres, Research Institutes, Other End-user) and Leading National Market Analysis PLUS Analysis of Leading Plasma Therapy Companies AND COVID-19 Recovery Scenarios. Avoid missing out by staying informed – order our report now.
Visiongain is a trading partner with the US Federal Government
CCR Ref number: KD4R6
Do you have any custom requirements we can help you with? Any need for a specific country, geo region, market segment or specific company information? Contact us today, we can discuss your needs and see how we can help: sara.peerun@visiongain.com
1 Report Overview
1.1 Why You Should Buy This Report
1.2 How This Report Delivers
1.3 Key Questions Answered by This Analytical Report Include:
1.4 Who is This Report For?
1.5 Methodology
1.1.1 Primary Research
1.1.2 Secondary Research
1.1.3 Data Sources
1.6 Market Evaluation & Forecasting Methodology
1.7 COIVD-19 Impact Recovery Pattern Analysis
1.1.4 V-Shaped Recovery
1.1.5 U-Shaped Recovery
1.1.6 W-Shaped Recovery
1.1.7 L-Shaped Recovery
1.8 Frequently Asked Questions (FAQ)
1.9 Associated Visiongain Reports
1.10 About Visiongain
2 Executive Summary
3 Blood Plasma Products and Technology Overview
3.1 Introduction to Blood Plasma Products
3.2 Components of Blood Plasma
3.3 Functions of Blood Plasma
3.4 Blood Donation
3.5 Collection and Extraction of Blood Plasma
3.6 Fractionation Methods for Extracting Individual Components from Plasma
3.7 Mode of Delivery for Blood Plasma
3.7.1 Infusion Solutions
3.7.2 Gels
3.7.3 Sprays
3.7.4 Biomedical Sealants
3.8 Government Funding of Blood Donation Facilities
3.9 Government Regulations: FDA, International Regulatory Agencies and Medical Associations
3.10 Clinical Guidelines
3.11 Technology Trends
4 Plasma Therapy Product Pipeline (till September, 2020)
5 Market Drivers, Restraints and Challenges
5.1 Market Dynamics
5.2 Which are the Growth Drivers in the Blood Plasma Market
5.2.1 How Increased Demand for Immunoglobulins in Therapeutic Treatments is Driving the Market?
5.2.2 Is Rising Prevalence of Alpha-1 Antitrypsin Deficiency (AATD) Increasing Demand for Blood Plasma Therapy?
5.2.3 How Increased Geriatric Population Worldwide is Creating Opportunities in the Market?
5.2.4 How Increase in Blood Donations can Help Plasma Therapy Market to Grow?
5.3 Which are the Restraints Factors in the Market?
5.3.1 Increasing Employment of Recombinant Plasma Products in Therapeutic Treatments
5.3.2 Is High Costs Associated with Blood Plasma Therapies Hampering the Growth?
5.3.3 How Stringent Government Regulations and Low Reimbursement Policies are Restraining Market Growth?
5.4 Which are the Opportunities in Global Blood Plasma Market?
5.4.1 Rising Incidence of Haemophilia, Is It Really Driving the Demand?
5.4.2 What are Opportunities in Emerging Nations?
5.5 SWOT Analysis of Blood Plasma Therapy Market
5.5.1 Strengths
5.5.1.1 Ageing Population Driving Need for Plasma Therapies
5.5.1.2 Demand from Emerging Markets Continue
5.5.1.3 Promising R&D Pipeline in the Plasma Therapy Market
5.5.1.4 Increasing awareness of benefits of plasma therapy
5.5.2 Weakness
5.5.2.1 High Costs Associated with Blood Plasma Therapy
5.5.2.2 Barriers to Plasma Therapy Market Entry
5.5.3 Opportunities
5.5.3.1 Constant Improvements in Plasma Technology and Delivery Methods
5.53.2 The Method of Delivery for Plasma Will Be Subject to Innovation Too
5.5.4 Threats
5.5.4.1 Approval Process for New Plasma Therapies Is Overseen by Various Regulatory Bodies
5.5.4.2 Productivity Gap in the Plasma Therapy Market
5.6 Porter’s Five Forces Analysis of Blood Plasma Therapy Market
5.6.1 Bargaining Power of Suppliers
5.6.2 Bargaining Power of Buyers
5.6.3 Threat of New Suppliers
5.6.4 Threat of Substitutes
5.6.5 Competitive Rivalry/Degree of Competition
6 Global Blood Plasma Therapy Market
6.1 Market Value Estimates and Forecast (V, W, U, L Shaped Recovery Analysis)
6.2 Regional Market Value Estimates and Forecast (V, W, U, L Shaped Recovery Analysis)
6.3 Source Market Value Estimates and Forecast (V, W, U, L Shaped Recovery Analysis)
6.3.1 Autologous blood transfusion (ABT)
6.3.2 Allogenic Blood Transfusion (ABT)
6.4 Application Market Value Estimates and Forecast (V, W, U, L Shaped Recovery Analysis)
6.4.1 Orthopaedics
6.4.2 Dermatology
6.4.3 Dental
6.4.4 Cardiac Muscle Injury
6.4.5 Nerve Injury
6.5 Type Market Value Estimates and Forecast (V, W, U, L Shaped Recovery Analysis)
6.5.1 Pure Platelet rich plasma (PRP)
6.5.2 Leucocyte-rich PRP
6.5.3 Pure Platelet-rich Fibrin (PRF)
6.5.4 Leukocyte-rich Fibrin (L-PRF)
6.6 End-User Market Value Estimates and Forecast (V, W, U, L Shaped Recovery Analysis)
6.6.1 Hospitals and Clinics
6.6.2 Research Laboratories
6.6.3 Academic Institutions
6.6.4 Blood Transfusion Centers
7 North America Blood Plasma Therapy Market Analysis
7.1 North America Blood Plasma Therapy Market Size Estimates and Forecast by Value (V, W, U, L Shaped Recovery Analysis)
7.2 North America Blood Plasma Therapy Market Size Estimates and Forecast by Country (V, W, U, L Shaped Recovery Analysis)
7.3 In the US Growing Use Of Albumin In Other Therapeutic Areas Driving the Market
7.3.1 US Plasma Therapy Market Size Estimates and Forecast by Value (V, W, U, L Shaped Recovery Analysis)
7.4 Canada: Treatment Of Chronic Diseases Driving The Market
7.4.1 Canada Blood Plasma Therapy Market Size Estimates and Forecast by Value (V, W, U, L Shaped Recovery Analysis)
7.5 North America Blood Plasma Therapy Market Size Estimates and Forecast by Source (V, W, U, L Shaped Recovery Analysis)
7.6 North America Blood Plasma Therapy Market Size Estimates and Forecast by Application (V, W, U, L Shaped Recovery Analysis)
7.7 North America Blood Plasma Therapy Market Size Estimates and Forecast by Type (V, W, U, L Shaped Recovery Analysis)
7.8 North America Blood Plasma Therapy Market Size Estimates and Forecast by End-User (V, W, U, L Shaped Recovery Analysis)
8 Europe Blood Plasma Therapy Market Analysis
8.1 Europe Blood Plasma Therapy Market Size Estimates and Forecast by Value (V, W, U, L Shaped Recovery Analysis)
8.2 Europe Blood Plasma Therapy Market Size Estimates and Forecast by Country (V, W, U, L Shaped Recovery Analysis)
8.3 Russia: Increasing Prevalence Of Life-Threatening Diseases
8.3.1 Russia Market Size Estimates and Forecast by Value (V, W, U, L Shaped Recovery Analysis)
8.4 Germany: Highest Rates Of Plasma Donations
8.4.1 Germany Blood Plasma Therapy Market Size Estimates and Forecast by Value (V, W, U, L Shaped Recovery Analysis)
8.5 UK: Major Disorders Related To Immunodeficiency Is Driving The Market
8.5.1 UK Blood Plasma Therapy Market Size Estimates and Forecast by Value (V, W, U, L Shaped Recovery Analysis)
8.6 France is a major contributor to the European blood plasma market
8.6.1 France Blood Plasma Therapy Market Size Estimates and Forecast by Value (V, W, U, L Shaped Recovery Analysis)
8.7 Italy Has A Large Market For Blood Plasma Products
8.7.1 Italy Blood Plasma Therapy Market Size Estimates and Forecast by Value (V, W, U, L Shaped Recovery Analysis)
8.8 Rest of Europe Blood Plasma Therapy Market Size Estimates and Forecast by Value (V, W, U, L Shaped Recovery Analysis)
8.9 Europe Blood Plasma Therapy Market Size Estimates and Forecast by Source (V, W, U, L Shaped Recovery Analysis)
8.10 Europe Blood Plasma Therapy Market Size Estimates and Forecast by Application (V, W, U, L Shaped Recovery Analysis)
8.11 Europe Blood Plasma Therapy Market Size Estimates and Forecast by Type (V, W, U, L Shaped Recovery Analysis)
8.12 Europe Blood Plasma Therapy Market Size Estimates and Forecast by End-User (V, W, U, L Shaped Recovery Analysis)
9 Asia-Pacific Blood Plasma Therapy Market Analysis
9.1 Asia-Pacific Blood Plasma Therapy Market Size Estimates and Forecast by Value (V, W, U, L Shaped Recovery Analysis)
9.2 Asia-Pacific Blood Plasma Therapy Market Size Estimates and Forecast by Country (V, W, U, L Shaped Recovery Analysis)
9.3 In Japan Several organizations in Japan ensure the adequacy of blood plasma supplies
9.3.1 Japan Blood Plasma Therapy Market Size Estimates and Forecast by Value (V, W, U, L Shaped Recovery Analysis)
9.4 China To Offer Profitable Opportunities In The Years Ahead
9.4.1 China Blood Plasma Therapy Market Size Estimates and Forecast by Value (V, W, U, L Shaped Recovery Analysis)
9.5 India Is A Lucrative Blood Plasma Products Market
9.5.1 India Blood Plasma Therapy Market Size Estimates and Forecast by Value (V, W, U, L Shaped Recovery Analysis)
9.6 South Korea Is Not Self-Sufficient In Fulfilling Its Demand For Blood Plasma
9.6.1 South Korea Blood Plasma Therapy Market Size Estimates and Forecast by Value (V, W, U, L Shaped Recovery Analysis)
9.7 In Australia Increased Demand For Intravenous Immunoglobulins (IVIg) is Driving the Market
9.7.1 Australia Blood Plasma Therapy Market Size Estimates and Forecast by Value (V, W, U, L Shaped Recovery Analysis)
9.8 Rest of APAC Market Size Estimates and Forecast by Value (V, W, U, L Shaped Recovery Analysis)
9.9 Asia-Pacific Blood Plasma Therapy Market Size Estimates and Forecast by Source (V, W, U, L Shaped Recovery Analysis)
9.10 Asia-Pacific Blood Plasma Therapy Market Size Estimates and Forecast by Application (V, W, U, L Shaped Recovery Analysis)
9.11 Asia-Pacific Blood Plasma Therapy Market Size Estimates and Forecast by Type (V, W, U, L Shaped Recovery Analysis)
9.12 Asia-Pacific Blood Plasma Therapy Market Size Estimates and Forecast by End-User (V, W, U, L Shaped Recovery Analysis)
10 LAMEA Blood Plasma Therapy Market Analysis
10.1 LAMEA Blood Plasma Therapy Market Size Estimates and Forecast by Value (V, W, U, L Shaped Recovery Analysis)
10.2 LAMEA Blood Plasma Therapy Market Size Estimates and Forecast by Country (V, W, U, L Shaped Recovery Analysis)
10.3 Brazil Has the Potential to Expand in Coming Years
10.3.1 Brazil Blood Plasma Therapy Market Size Estimates and Forecast by Value (V, W, U, L Shaped Recovery Analysis)
10.4 Saudi Arabia is Taking the Initiative In The Development Of Healthcare Sectors
10.4.1 Saudi Arabia Blood Plasma Therapy Market Size Estimates and Forecast by Value (V, W, U, L Shaped Recovery Analysis)
10.5 In South Africa An Increase In The Consumption Of Blood Products Driving the Market
10.5.1 South Africa Blood Plasma Therapy Market Size Estimates and Forecast by Value (V, W, U, L Shaped Recovery Analysis)
10.6 Mexico
10.6.1 Mexico Blood Plasma Therapy Market Size Estimates and Forecast by Value (V, W, U, L Shaped Recovery Analysis)
10.7 UAE Provides Essential Novel Blood Plasma Therapies
10.7.1 UAE Blood Plasma Therapy Market Size Estimates and Forecast by Value (V, W, U, L Shaped Recovery Analysis)
10.8 Rest of LAMEA Blood Plasma Therapy Market Size Estimates and Forecast by Value (V, W, U, L Shaped Recovery Analysis)
10.9 LAMEA Blood Plasma Therapy Market Size Estimates and Forecast by Source (V, W, U, L Shaped Recovery Analysis)
10.10 LAMEA Blood Plasma Therapy Market Size Estimates and Forecast by Application (V, W, U, L Shaped Recovery Analysis)
10.11 LAMEA Blood Plasma Therapy Market Size Estimates and Forecast by Type (V, W, U, L Shaped Recovery Analysis)
10.12 LAMEA Blood Plasma Therapy Market Size Estimates and Forecast by End-User (V, W, U, L Shaped Recovery Analysis)
11 Top Company Profiles
11.1 Biotest AG Company
11.1.1 Company Information, 2020
11.1.2 Company Overview
11.1.3 Company Financial Profile, 2015-2019
11.1.4 Company Product Offerings
11.1.5 Company Recent Developments, 2020
11.2 CSL Ltd. Company
11.2.1 Company Information
11.2.2 Company Overview
11.2.3 Company Financial Profile
11.2.4 Company Product Offerings
11.2.5 Company Recent Developments
11.3 Grifols International S.A. Company
11.3.1 Company Information
11.3.2 Company Overview
11.3.3 Company Financial Profile
11.3.4 Company Product Offerings
11.3.5 Company Recent Developments
11.4 China Biologic Products Holdings, Inc Company
11.4.1 Company Information
11.4.2 Company Overview
11.4.3 Company Financial Profile
11.4.4 Company Product Offerings
11.4.5 Company Recent Developments
11.5 Terumo Corporation Company
11.5.1 Company Information
11.5.2 Company Overview
11.5.3 Company Financial Profile
11.5.4 Company Product Offerings
11.5.5 Company Recent Developments
11.6 Johnson & Johnson Medical Device Company
11.6.1 Company Information
11.6.2 Company Overview
11.6.3 Company Financial Profile
11.6.4 Company Product Offerings
11.6.5 Company Recent Developments
11.7 Zimmer Biomet Holdings Inc Company
11.7.1 Company Information
11.7.2 Company Overview
11.7.3 Company Financial Profile
11.7.4 Company Product Offerings
11.7.5 Company Recent Developments
11.8 Stryker Corporation Company
11.8.1 Company Information
11.8.2 Company Overview
11.8.3 Company Financial Profile
11.8.4 Company Product Offerings
11.8.5 Company Recent Developments
11.9 Thermogenesis holdings inc. Company
11.9.1 Company Information
11.9.2 Company Overview
11.9.3 Company Financial Profile
11.9.4 Company Product Offerings
11.9.5 Company Recent Developments
11.10 Nuo Therapeutics, Inc Company
11.10.1 Company Information
11.10.2 Company Overview
11.10.3 Company Financial Profile
11.10.4 Company Product Offerings
11.11 Competitive Landscape of Blood Plasma Market
11.11.1 Major Players and Market Shares
11.12 List of Other Companies
11.13 List of Blood Plasma Related Organizations
12 Conclusion & Recommendations
12 12.1 Concluding Remarks
12 12.2 Recommendation for Industry Players
List of Figures
Figure 6.1 Global Plasma Therapy Market by Value Forecast 2021-2031 (US$ million, AGR %)
Figure 6.2 Global Plasma Therapy Market by Value Forecast 2021-2031 (US$ million, AGR %) (V-Shaped Recovery)
Figure 6.3 Global Plasma Therapy Market by Value Forecast 2021-2031 (US$ million, AGR %) (W-Shaped Recovery)
Figure 6.4 Global Plasma Therapy Market by Value Forecast 2021-2031 (US$ million, AGR %) (U-Shaped Recovery)
Figure 6.5 Global Plasma Therapy Market by Value Forecast 2021-2031 (US$ million, AGR %) (L-Shaped Recovery)
Figure 6.6 Global Plasma Therapy Market by Region Forecast 2021-2031 (US$ million, AGR %)
Figure 6.7 Global Plasma Therapy Market by Region Forecast 2021-2031 (US$ million, AGR %) (V-Shaped Recovery)
Figure 6.8 Global Plasma Therapy Market by Region Forecast 2021-2031 (US$ million, AGR %) (W-Shaped Recovery)
Figure 6.9 Global Plasma Therapy Market by Region Forecast 2021-2031 (US$ million, AGR %) (U-Shaped Recovery)
Figure 6.10 Global Plasma Therapy Market by Region Forecast 2021-2031 (US$ million, AGR %) (L-Shaped Recovery)
Figure 6.11 Global Plasma Therapy Market by Source Forecast 2021-2031 (US$ million, AGR %)
Figure 6.12 Global Plasma Therapy Market by Source Forecast 2021-2031 (US$ million, AGR %) (V-Shaped Recovery)
Figure 6.13 Global Plasma Therapy Market by Source Forecast 2021-2031 (US$ million, AGR %) (W-Shaped Recovery)
Figure 6.14 Global Plasma Therapy Market by Source Forecast 2021-2031 (US$ million, AGR %) (U-Shaped Recovery)
Figure 6.15 Global Plasma Therapy Market by Source Forecast 2021-2031 (US$ million, AGR %) (L-Shaped Recovery)
Figure 6.16 Global Plasma Therapy Market by Application Forecast 2021-2031 (US$ million, AGR %)
Figure 6.17 Global Plasma Therapy Market by Application Forecast 2021-2031 (US$ million, AGR %) (V-Shaped Recovery)
Figure 6.18 Global Plasma Therapy Market by Application Forecast 2021-2031 (US$ million, AGR %) (W-Shaped Recovery)
Figure 6.19 Global Plasma Therapy Market by Application Forecast 2021-2031 (US$ million, AGR %) (U-Shaped Recovery)
Figure 6.20 Global Plasma Therapy Market by Application Forecast 2021-2031 (US$ million, AGR %) (L-Shaped Recovery)
Figure 6.21 Global Plasma Therapy Market by Type Forecast 2021-2031 (US$ million, AGR %)
Figure 6.22 Global Plasma Therapy Market by Type Forecast 2021-2031 (US$ million, AGR %) (V-Shaped Recovery)
Figure 6.23 Global Plasma Therapy Market by Type Forecast 2021-2031 (US$ million, AGR %) (W-Shaped Recovery)
Figure 6.24 Global Plasma Therapy Market by Type Forecast 2021-2031 (US$ million, AGR %) (U-Shaped Recovery)
Figure 6.25 Global Plasma Therapy Market by Type Forecast 2021-2031 (US$ million, AGR %) (L-Shaped Recovery)
Figure 6.26 Global Plasma Therapy Market by End-User Forecast 2021-2031 (US$ million, AGR %)
Figure 6.27 Global Plasma Therapy Market by End-User Forecast 2021-2031 (US$ million, AGR %) (V-Shaped Recovery)
Figure 6.28 Global Plasma Therapy Market by End-User Forecast 2021-2031 (US$ million, AGR %) (W-Shaped Recovery)
Figure 6.29 Global Plasma Therapy Market by End-User Forecast 2021-2031 (US$ million, AGR %) (U-Shaped Recovery)
Figure 6.30 Global Plasma Therapy Market by End-User Forecast 2021-2031 (US$ million, AGR %) (L-Shaped Recovery)
Figure 7.1 North America Plasma Therapy Market by Value Forecast 2021-2031 (US$ million, AGR %)
Figure 7.2 North America Plasma Therapy Market by Value Forecast 2021-2031 (US$ million, AGR %) (V-Shaped Recovery)
Figure 7.3 North America Plasma Therapy Market by Value Forecast 2021-2031 (US$ million, AGR %) (W-Shaped Recovery)
Figure 7.4 North America Plasma Therapy Market by Value Forecast 2021-2031 (US$ million, AGR %) (U-Shaped Recovery)
Figure 7.5 North America Plasma Therapy Market by Value Forecast 2021-2031 (US$ million, AGR %) (L-Shaped Recovery)
Figure 7.6 North America Plasma Therapy Market by Country Forecast 2021-2031 (US$ million, AGR %)
Figure 7.7 North America Plasma Therapy Market by Country Forecast 2021-2031 (US$ million, AGR %) (V-Shaped Recovery)
Figure 7.8 North America Plasma Therapy Market by Country Forecast 2021-2031 (US$ million, AGR %) (W-Shaped Recovery)
Figure 7.9 North America Plasma Therapy Market by Country Forecast 2021-2031 (US$ million, AGR %) (U-Shaped Recovery)
Figure 7.10 North America Plasma Therapy Market by Country Forecast 2021-2031 (US$ million, AGR %) (L-Shaped Recovery)
Figure 7.11 North America Plasma Therapy Market by Source Forecast 2021-2031 (US$ million, AGR %)
Figure 7.12 North America Plasma Therapy Market by Source Forecast 2021-2031 (US$ million, AGR %) (V-Shaped Recovery)
Figure 7.13 North America Plasma Therapy Market by Source Forecast 2021-2031 (US$ million, AGR %) (W-Shaped Recovery)
Figure 7.14 North America Plasma Therapy Market by Source Forecast 2021-2031 (US$ million, AGR %) (U-Shaped Recovery)
Figure 7.15 North America Plasma Therapy Market by Source Forecast 2021-2031 (US$ million, AGR %) (L-Shaped Recovery)
Figure 7.16 North America Plasma Therapy Market by Application Forecast 2021-2031 (US$ million, AGR %)
Figure 7.17 North America Plasma Therapy Market by Application Forecast 2021-2031 (US$ million, AGR %) (V-Shaped Recovery)
Figure 7.18 North America Plasma Therapy Market by Application Forecast 2021-2031 (US$ million, AGR %) (W-Shaped Recovery)
Figure 7.19 North America Plasma Therapy Market by Application Forecast 2021-2031 (US$ million, AGR %) (U-Shaped Recovery)
Figure 7.20 North America Plasma Therapy Market by Application Forecast 2021-2031 (US$ million, AGR %) (L-Shaped Recovery)
Figure 7.21 North America Plasma Therapy Market by Type Forecast 2021-2031 (US$ million, AGR %)
Figure 7.22 North America Plasma Therapy Market by Type Forecast 2021-2031 (US$ million, AGR %) (V-Shaped Recovery)
Figure 7.23 North America Plasma Therapy Market by Type Forecast 2021-2031 (US$ million, AGR %) (W-Shaped Recovery)
Figure 7.24 North America Plasma Therapy Market by Type Forecast 2021-2031 (US$ million, AGR %) (U-Shaped Recovery)
Figure 7.25 North America Plasma Therapy Market by Type Forecast 2021-2031 (US$ million, AGR %) (L-Shaped Recovery)
Figure 7.26 North America Plasma Therapy Market by End-User Forecast 2021-2031 (US$ million, AGR %)
Figure 7.27 North America Plasma Therapy Market by End-User Forecast 2021-2031 (US$ million, AGR %) (V-Shaped Recovery)
Figure 7.28 North America Plasma Therapy Market by End-User Forecast 2021-2031 (US$ million, AGR %) (W-Shaped Recovery)
Figure 7.29 North America Plasma Therapy Market by End-User Forecast 2021-2031 (US$ million, AGR %) (U-Shaped Recovery)
Figure 7.30 North America Plasma Therapy Market by End-User Forecast 2021-2031 (US$ million, AGR %) (L-Shaped Recovery)
Figure 8.1 Europe Plasma Therapy Market by Value Forecast 2021-2031 (US$ million, AGR %)
Figure 8.2 Europe Plasma Therapy Market by Value Forecast 2021-2031 (US$ million, AGR %) (V-Shaped Recovery)
Figure 8.3 Europe Plasma Therapy Market by Value Forecast 2021-2031 (US$ million, AGR %) (W-Shaped Recovery)
Figure 8.4 Europe Plasma Therapy Market by Value Forecast 2021-2031 (US$ million, AGR %) (U-Shaped Recovery)
Figure 8.5 Europe Plasma Therapy Market by Value Forecast 2021-2031 (US$ million, AGR %) (L-Shaped Recovery)
Figure 8.6 Europe Plasma Therapy Market by Country Forecast 2021-2031 (US$ million, AGR %)
Figure 8.7 Europe Plasma Therapy Market by Country Forecast 2021-2031 (US$ million, AGR %) (V-Shaped Recovery)
Figure 8.8 Europe Plasma Therapy Market by Country Forecast 2021-2031 (US$ million, AGR %) (W-Shaped Recovery)
Figure 8.9 Europe Plasma Therapy Market by Country Forecast 2021-2031 (US$ million, AGR %) (U-Shaped Recovery)
Figure 8.10 Europe Plasma Therapy Market by Country Forecast 2021-2031 (US$ million, AGR %) (L-Shaped Recovery)
Figure 8.11 Europe Plasma Therapy Market by Source Forecast 2021-2031 (US$ million, AGR %)
Figure 8.12 Europe Plasma Therapy Market by Source Forecast 2021-2031 (US$ million, AGR %) (V-Shaped Recovery)
Figure 8.13 Europe Plasma Therapy Market by Source Forecast 2021-2031 (US$ million, AGR %) (W-Shaped Recovery)
Figure 8.14 Europe Plasma Therapy Market by Source Forecast 2021-2031 (US$ million, AGR %) (U-Shaped Recovery)
Figure 8.15 Europe Plasma Therapy Market by Source Forecast 2021-2031 (US$ million, AGR %) (L-Shaped Recovery)
Figure 8.16 Europe Plasma Therapy Market by Application Forecast 2021-2031 (US$ million, AGR %)
Figure 8.17 Europe Plasma Therapy Market by Application Forecast 2021-2031 (US$ million, AGR %) (V-Shaped Recovery)
Figure 8.18 Europe Plasma Therapy Market by Application Forecast 2021-2031 (US$ million, AGR %) (W-Shaped Recovery)
Figure 8.19 Europe Plasma Therapy Market by Application Forecast 2021-2031 (US$ million, AGR %) (U-Shaped Recovery)
Figure 8.20 Europe Plasma Therapy Market by Application Forecast 2021-2031 (US$ million, AGR %) (L-Shaped Recovery)
Figure 8.21 Europe Plasma Therapy Market by Type Forecast 2021-2031 (US$ million, AGR %)
Figure 8.22 Europe Plasma Therapy Market by Type Forecast 2021-2031 (US$ million, AGR %) (V-Shaped Recovery)
Figure 8.23 Europe Plasma Therapy Market by Type Forecast 2021-2031 (US$ million, AGR %) (W-Shaped Recovery)
Figure 8.24 Europe Plasma Therapy Market by Type Forecast 2021-2031 (US$ million, AGR %) (U-Shaped Recovery)
Figure 8.25 Europe Plasma Therapy Market by Type Forecast 2021-2031 (US$ million, AGR %) (L-Shaped Recovery)
Figure 8.26 Europe Plasma Therapy Market by End-User Forecast 2021-2031 (US$ million, AGR %)
Figure 8.27 Europe Plasma Therapy Market by End-User Forecast 2021-2031 (US$ million, AGR %) (V-Shaped Recovery)
Figure 8.28 Europe Plasma Therapy Market by End-User Forecast 2021-2031 (US$ million, AGR %) (W-Shaped Recovery)
Figure 8.29 Europe Plasma Therapy Market by End-User Forecast 2021-2031 (US$ million, AGR %) (U-Shaped Recovery)
Figure 8.30 Europe Plasma Therapy Market by End-User Forecast 2021-2031 (US$ million, AGR %) (L-Shaped Recovery)
Figure 9.1 Asia-Pacific Plasma Therapy Market by Value Forecast 2021-2031 (US$ million, AGR %)
Figure 9.2 Asia-Pacific Plasma Therapy Market by Value Forecast 2021-2031 (US$ million, AGR %) (V-Shaped Recovery)
Figure 9.3 Asia-Pacific Plasma Therapy Market by Value Forecast 2021-2031 (US$ million, AGR %) (W-Shaped Recovery)
Figure 9.4 Asia-Pacific Plasma Therapy Market by Value Forecast 2021-2031 (US$ million, AGR %) (U-Shaped Recovery)
Figure 9.5 Asia-Pacific Plasma Therapy Market by Value Forecast 2021-2031 (US$ million, AGR %) (L-Shaped Recovery)
Figure 9.6 Asia-Pacific Plasma Therapy Market by Country Forecast 2021-2031 (US$ million, AGR %)
Figure 9.7 Asia-Pacific Plasma Therapy Market by Country Forecast 2021-2031 (US$ million, AGR %) (V-Shaped Recovery)
Figure 9.8 Asia-Pacific Plasma Therapy Market by Country Forecast 2021-2031 (US$ million, AGR %) (W-Shaped Recovery)
Figure 9.9 Asia-Pacific Plasma Therapy Market by Country Forecast 2021-2031 (US$ million, AGR %) (U-Shaped Recovery)
Figure 9.10 Asia-Pacific Plasma Therapy Market by Country Forecast 2021-2031 (US$ million, AGR %) (L-Shaped Recovery)
Figure 9.11 Asia-Pacific Plasma Therapy Market by Source Forecast 2021-2031 (US$ million, AGR %)
Figure 9.12 Asia-Pacific Plasma Therapy Market by Source Forecast 2021-2031 (US$ million, AGR %) (V-Shaped Recovery)
Figure 9.13 Asia-Pacific Plasma Therapy Market by Source Forecast 2021-2031 (US$ million, AGR %) (W-Shaped Recovery)
Figure 9.14 Asia-Pacific Plasma Therapy Market by Source Forecast 2021-2031 (US$ million, AGR %) (U-Shaped Recovery)
Figure 9.15 Asia-Pacific Plasma Therapy Market by Source Forecast 2021-2031 (US$ million, AGR %) (L-Shaped Recovery)
Figure 9.16 Asia-Pacific Plasma Therapy Market by Application Forecast 2021-2031 (US$ million, AGR %)
Figure 9.17 Asia-Pacific Plasma Therapy Market by Application Forecast 2021-2031 (US$ million, AGR %) (V-Shaped Recovery)
Figure 9.18 Asia-Pacific Plasma Therapy Market by Application Forecast 2021-2031 (US$ million, AGR %) (W-Shaped Recovery)
Figure 9.19 Asia-Pacific Plasma Therapy Market by Application Forecast 2021-2031 (US$ million, AGR %) (U-Shaped Recovery)
Figure 9.20 Asia-Pacific Plasma Therapy Market by Application Forecast 2021-2031 (US$ million, AGR %) (L-Shaped Recovery)
Figure 9.21 Asia-Pacific Plasma Therapy Market by Type Forecast 2021-2031 (US$ million, AGR %)
Figure 9.22 Asia-Pacific Plasma Therapy Market by Type Forecast 2021-2031 (US$ million, AGR %) (V-Shaped Recovery)
Figure 9.23 Asia-Pacific Plasma Therapy Market by Type Forecast 2021-2031 (US$ million, AGR %) (W-Shaped Recovery)
Figure 9.24 Asia-Pacific Plasma Therapy Market by Type Forecast 2021-2031 (US$ million, AGR %) (U-Shaped Recovery)
Figure 9.25 Asia-Pacific Plasma Therapy Market by Type Forecast 2021-2031 (US$ million, AGR %) (L-Shaped Recovery)
Figure 9.26 Asia-Pacific Plasma Therapy Market by End-User Forecast 2021-2031 (US$ million, AGR %)
Figure 9.27 Asia-Pacific Plasma Therapy Market by End-User Forecast 2021-2031 (US$ million, AGR %) (V-Shaped Recovery)
Figure 9.28 Asia-Pacific Plasma Therapy Market by End-User Forecast 2021-2031 (US$ million, AGR %) (W-Shaped Recovery)
Figure 9.29 Asia-Pacific Plasma Therapy Market by End-User Forecast 2021-2031 (US$ million, AGR %) (U-Shaped Recovery)
Figure 9.30 Asia-Pacific Plasma Therapy Market by End-User Forecast 2021-2031 (US$ million, AGR %) (L-Shaped Recovery)
Figure 10.1 LAMEA Plasma Therapy Market by Value Forecast 2021-2031 (US$ million, AGR %)
Figure 10.2 LAMEA Plasma Therapy Market by Value Forecast 2021-2031 (US$ million, AGR %) (V-Shaped Recovery)
Figure 10.3 LAMEA Plasma Therapy Market by Value Forecast 2021-2031 (US$ million, AGR %) (W-Shaped Recovery)
Figure 10.4 LAMEA Plasma Therapy Market by Value Forecast 2021-2031 (US$ million, AGR %) (U-Shaped Recovery)
Figure 10.5 LAMEA Plasma Therapy Market by Value Forecast 2021-2031 (US$ million, AGR %) (L-Shaped Recovery)
Figure 10.6 LAMEA Plasma Therapy Market by Country Forecast 2021-2031 (US$ million, AGR %)
Figure 10.7 LAMEA Plasma Therapy Market by Country Forecast 2021-2031 (US$ million, AGR %) (V-Shaped Recovery)
Figure 10.8 LAMEA Plasma Therapy Market by Country Forecast 2021-2031 (US$ million, AGR %) (W-Shaped Recovery)
Figure 10.9 LAMEA Plasma Therapy Market by Country Forecast 2021-2031 (US$ million, AGR %) (U-Shaped Recovery)
Figure 10.10 LAMEA Plasma Therapy Market by Country Forecast 2021-2031 (US$ million, AGR %) (L-Shaped Recovery)
Figure 10.11 LAMEA Plasma Therapy Market by Source Forecast 2021-2031 (US$ million, AGR %)
Figure 10.12 LAMEA Plasma Therapy Market by Source Forecast 2021-2031 (US$ million, AGR %) (V-Shaped Recovery)
Figure 10.13 LAMEA Plasma Therapy Market by Source Forecast 2021-2031 (US$ million, AGR %) (W-Shaped Recovery)
Figure 10.14 LAMEA Plasma Therapy Market by Source Forecast 2021-2031 (US$ million, AGR %) (U-Shaped Recovery)
Figure 10.15 LAMEA Plasma Therapy Market by Source Forecast 2021-2031 (US$ million, AGR %) (L-Shaped Recovery)
Figure 10.16 LAMEA Plasma Therapy Market by Application Forecast 2021-2031 (US$ million, AGR %)
Figure 10.17 LAMEA Plasma Therapy Market by Application Forecast 2021-2031 (US$ million, AGR %) (V-Shaped Recovery)
Figure 10.18 LAMEA Plasma Therapy Market by Application Forecast 2021-2031 (US$ million, AGR %) (W-Shaped Recovery)
Figure 10.19 LAMEA Plasma Therapy Market by Application Forecast 2021-2031 (US$ million, AGR %) (U-Shaped Recovery)
Figure 10.20 LAMEA Plasma Therapy Market by Application Forecast 2021-2031 (US$ million, AGR %) (L-Shaped Recovery)
Figure 10.21 LAMEA Plasma Therapy Market by Type Forecast 2021-2031 (US$ million, AGR %)
Figure 10.22 LAMEA Plasma Therapy Market by Type Forecast 2021-2031 (US$ million, AGR %) (V-Shaped Recovery)
Figure 10.23 LAMEA Plasma Therapy Market by Type Forecast 2021-2031 (US$ million, AGR %) (W-Shaped Recovery)
Figure 10.24 LAMEA Plasma Therapy Market by Type Forecast 2021-2031 (US$ million, AGR %) (U-Shaped Recovery)
Figure 10.25 LAMEA Plasma Therapy Market by Type Forecast 2021-2031 (US$ million, AGR %) (L-Shaped Recovery)
Figure 10.26 LAMEA Plasma Therapy Market by End-User Forecast 2021-2031 (US$ million, AGR %)
Figure 10.27 LAMEA Plasma Therapy Market by End-User Forecast 2021-2031 (US$ million, AGR %) (V-Shaped Recovery)
Figure 10.28 LAMEA Plasma Therapy Market by End-User Forecast 2021-2031 (US$ million, AGR %) (W-Shaped Recovery)
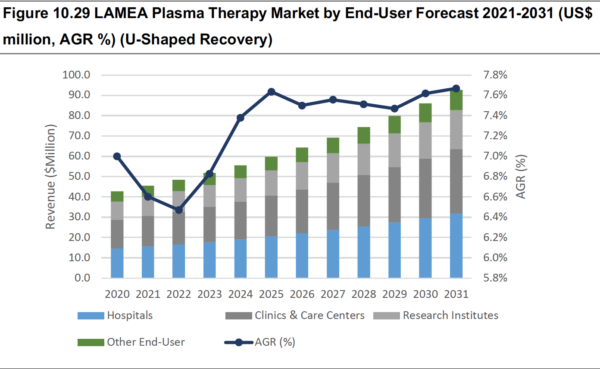
Figure 10.29 LAMEA Plasma Therapy Market by End-User Forecast 2021-2031 (US$ million, AGR %) (U-Shaped Recovery)
Figure 10.30 LAMEA Plasma Therapy Market by End-User Forecast 2021-2031 (US$ million, AGR %) (L-Shaped Recovery)
Figure 11.1 Biotest AG Company: Company Revenue 2015-2019 (US$Mn, AGR %)
Figure 11.2 Biotest AG Company: Company Operating Income 2015-2019 (US$Mn)
Figure 11.3 Biotest AG. Company: Company EBITDA 2015-2019 (US$Mn)
Figure 11.4 Biotest AG. Company: Company Net Income/Loss 2015-2019 (US$Mn)
Figure 11.5 CSL Ltd Company: Company Revenue 2015-2019 (US$Mn, AGR %)
Figure 11.6 CSL Ltd Company: Company Operating Income 2015-2019 (US$Mn)
Figure 11.7 CSL Ltd. Company: Company EBITDA 2015-2019 (US$Mn)
Figure 11.8 CSL Ltd. Company: Company Net Income/Loss 2015-2019 (US$Mn)
Figure 11.9 Grifols S.A Company: Company Revenue 2015-2019 (US$Mn, AGR %)
Figure 11.10 Grifols S.A Company: Company Operating Income 2015-2019 (US$Mn)
Figure 11.11 Grifols S.A. Company: Company EBITDA 2015-2019 (US$Mn)
Figure 11.12 Grifols S.A. Company: Company Net Income/Loss 2015-2019 (US$Mn)
Figure 11.13 China Biologic Products Company: Company Revenue 2015-2019 (US$Mn, AGR %)
Figure 11.14 China Biologic Products Company: Company Operating Income 2015-2019 (US$Mn)
Figure 11.15 China Biologic Products. Company: Company EBITDA 2015-2019 (US$Mn)
Figure 11.16 China Biologic Products. Company: Company Net Income/Loss 2015-2019 (US$Mn)
Figure 11.17 Terumo Corporation Company: Company Revenue 2015-2019 (US$Mn, AGR %)
Figure 11.18 Terumo Corporation Company: Company Operating Income 2015-2019 (US$Mn)
Figure 11.19 Terumo Corporation. Company: Company EBITDA 2015-2019 (US$Mn)
Figure 11.20 Terumo Corporation. Company: Company Net Income/Loss 2015-2019 (US$Mn)
Figure 11.21 J&J Company: Company Revenue 2015-2019 (US$Mn, AGR %)
Figure 11.22 J&J Company: Company Operating Income 2015-2019 (US$Mn)
Figure 11.23 J&J. Company: Company EBITDA 2015-2019 (US$Mn)
Figure 11.24 J&J. Company: Company Net Income/Loss 2015-2019 (US$Mn)
Figure 11.25 Zimmer Biomet Holdings Company: Company Revenue 2015-2019 (US$Mn, AGR %)
Figure 11.26 Zimmer Biomet Holdings Company: Company Operating Income 2015-2019 (US$Mn)
Figure 11.27 Zimmer Biomet Holdings. Company: Company EBITDA 2015-2019 (US$Mn)
Figure 11.28 Zimmer Biomet Holdings. Company: Company Net Income/Loss 2015-2019 (US$Mn)
Figure 11.29 Stryker Corporation Company: Company Revenue 2015-2019 (US$Mn, AGR %)
Figure 11.30 Stryker Corporation Company: Company Operating Income 2015-2019 (US$Mn)
Figure 11.31 Stryker Corporation. Company: Company EBITDA 2015-2019 (US$Mn)
Figure 11.32 Stryker Corporation. Company: Company Net Income/Loss 2015-2019 (US$Mn)
Figure 11.33 Thermogenesis Holdings: Company Revenue 2015-2019 (US$Mn, AGR %)
Figure 11.34 Thermogenesis Holdings: Company Operating Income 2015-2019 (US$Mn)
Figure 11.35 Thermogenesis Holdings: Company EBITDA 2015-2019 (US$Mn)
Figure 11.36 Thermogenesis Holdings: Company Net Income/Loss 2015-2019 (US$Mn)
Figure 11.37 Nuo Therapeutics Company: Company Revenue 2015-2019 (US$Mn, AGR %)
Figure 11.38 Nuo Therapeutics Company: Company Operating Income 2015-2019 (US$Mn)
Figure 11.39 Nuo Therapeutics. Company: Company EBITDA 2015-2019 (US$Mn)
Figure 11.40 Nuo Therapeutics. Company: Company Net Income/Loss 2015-2019 (US$Mn)
List of Tables
Table 2.1 Global Plasma Therapy Market Summary Table
Table 3.1 Blood Plasma Components
Table 3.2 Percentage of Major Proteins Present in Different Fractions After Cohn’s Fractionation Method
Table 3.3 Key Trends in the Global Blood Plasma Market
Table 4.1 China Biologic Product: Company Product Pipeline
Table 4.2 1. Grifols International S.A.: Company Product Pipeline
Table 4.3 Biotest Inc: Company Product Pipeline
Table 4.4 CSL Ltd: Company Product Pipeline
Table 6.1 Porter’s Five Forces Analysis: Global Plasma Therapy Market
Table 6.1 Global Plasma Therapy Market by Value Forecast 2021-2031 (US$ million, AGR %, CAGR %)
Table 6.2 Global Plasma Therapy Market by Value Forecast 2021-2031 (US$ million, AGR %, CAGR %) (V-Shaped Recovery)
Table 6.3 Global Plasma Therapy Market by Value Forecast 2021-2031 (US$ million, AGR %, CAGR %) (W-Shaped Recovery)
Table 6.4 Global Plasma Therapy Market by Value Forecast 2021-2031 (US$ million, AGR %, CAGR %) (U-Shaped Recovery)
Table 6.5 Global Plasma Therapy Market by Value Forecast 2021-2031 (US$ million, AGR %, CAGR %) (L-Shaped Recovery)
Table 6.6 Global Plasma Therapy Market by Region Forecast 2021-2031 (US$ million, AGR %, CAGR %)
Table 6.7 Global Plasma Therapy Market by Region Forecast 2021-2031 (US$ million, AGR %, CAGR %) (V-Shaped Recovery)
Table 6.8 Global Plasma Therapy Market by Region Forecast 2021-2031 (US$ million, AGR %, CAGR %) (W-Shaped Recovery)
Table 6.9 Global Plasma Therapy Market by Region Forecast 2021-2031 (US$ million, AGR %, CAGR %) (U-Shaped Recovery)
Table 6.10 Global Plasma Therapy Market by Region Forecast 2021-2031 (US$ million, AGR %, CAGR %) (L-Shaped Recovery)
Table 6.11 Global Plasma Therapy Market by Source Forecast 2021-2031 (US$ million, AGR %, CAGR %)
Table 6.12 Global Plasma Therapy Market by Source Forecast 2021-2031 (US$ million, AGR %, CAGR %) (V-Shaped Recovery)
Table 6.13 Global Plasma Therapy Market by Source Forecast 2021-2031 (US$ million, AGR %, CAGR %) (W-Shaped Recovery)
Table 6.14 Global Plasma Therapy Market by Source Forecast 2021-2031 (US$ million, AGR %, CAGR %) (U-Shaped Recovery)
Table 6.15 Global Plasma Therapy Market by Source Forecast 2021-2031 (US$ million, AGR %, CAGR %) (L-Shaped Recovery)
Table 6.16 Global Plasma Therapy Market by Application Forecast 2021-2031 (US$ million, AGR %, CAGR %)
Table 6.17 Global Plasma Therapy Market by Application Forecast 2021-2031 (US$ million, AGR %, CAGR %) (V-Shaped Recovery)
Table 6.18 Global Plasma Therapy Market by Application Forecast 2021-2031 (US$ million, AGR %, CAGR %) (W-Shaped Recovery)
Table 6.19 Global Plasma Therapy Market by Application Forecast 2021-2031 (US$ million, AGR %, CAGR %) (U-Shaped Recovery)
Table 6.20 Global Plasma Therapy Market by Application Forecast 2021-2031 (US$ million, AGR %, CAGR %) (L-Shaped Recovery)
Table 6.21 Global Plasma Therapy Market by Type Forecast 2021-2031 (US$ million, AGR %, CAGR %)
Table 6.22 Global Plasma Therapy Market by Type Forecast 2021-2031 (US$ million, AGR %, CAGR %) (V-Shaped Recovery)
Table 6.23 Global Plasma Therapy Market by Type Forecast 2021-2031 (US$ million, AGR %, CAGR %) (W-Shaped Recovery)
Table 6.24 Global Plasma Therapy Market by Type Forecast 2021-2031 (US$ million, AGR %, CAGR %) (U-Shaped Recovery)
Table 6.25 Global Plasma Therapy Market by Type Forecast 2021-2031 (US$ million, AGR %, CAGR %) (L-Shaped Recovery)
Table 6.26 Global Plasma Therapy Market by End-User Forecast 2021-2031 (US$ million, AGR %, CAGR %)
Table 6.27 Global Plasma Therapy Market by End-User Forecast 2021-2031 (US$ million, AGR %, CAGR %) (V-Shaped Recovery)
Table 6.28 Global Plasma Therapy Market by End-User Forecast 2021-2031 (US$ million, AGR %, CAGR %) (W-Shaped Recovery)
Table 6.29 Global Plasma Therapy Market by End-User Forecast 2021-2031 (US$ million, AGR %, CAGR %) (U-Shaped Recovery)
Table 6.30 Global Plasma Therapy Market by End-User Forecast 2021-2031 (US$ million, AGR %, CAGR %) (L-Shaped Recovery)
Table 7.1 North America Plasma Therapy Market by Value Forecast 2021-2031 (US$ million, AGR %, CAGR %)
Table 7.2 North America Plasma Therapy Market by Value Forecast 2021-2031 (US$ million, AGR %, CAGR %) (V-Shaped Recovery)
Table 7.3 North America Plasma Therapy Market by Value Forecast 2021-2031 (US$ million, AGR %, CAGR %) (W-Shaped Recovery)
Table 7.4 North America Plasma Therapy Market by Value Forecast 2021-2031 (US$ million, AGR %, CAGR %) (U-Shaped Recovery)
Table 7.5 North America Plasma Therapy Market by Value Forecast 2021-2031 (US$ million, AGR %, CAGR %) (L-Shaped Recovery)
Table 7.6 US Plasma Therapy Market by Value Forecast 2021-2031 (US$ million, AGR %, CAGR %)
Table 7.7 US Plasma Therapy Market by Value Forecast 2021-2031 (US$ million, AGR %, CAGR %) (V-Shaped Recovery)
Table 7.8 US Plasma Therapy Market by Value Forecast 2021-2031 (US$ million, AGR %, CAGR %) (W-Shaped Recovery)
Table 7.9 US Plasma Therapy Market by Value Forecast 2021-2031 (US$ million, AGR %, CAGR %) (U-Shaped Recovery)
Table 7.10 US Plasma Therapy Market by Value Forecast 2021-2031 (US$ million, AGR %, CAGR %) (L-Shaped Recovery)
Table 7.11 Canada Plasma Therapy Market by Value Forecast 2021-2031 (US$ million, AGR %, CAGR %)
Table 7.12 Canada Plasma Therapy Market by Value Forecast 2021-2031 (US$ million, AGR %, CAGR %) (V-Shaped Recovery)
Table 7.13 Canada Plasma Therapy Market by Value Forecast 2021-2031 (US$ million, AGR %, CAGR %) (W-Shaped Recovery)
Table 7.14 Canada Plasma Therapy Market by Value Forecast 2021-2031 (US$ million, AGR %, CAGR %) (U-Shaped Recovery)
Table 7.15 Canada Plasma Therapy Market by Value Forecast 2021-2031 (US$ million, AGR %, CAGR %) (L-Shaped Recovery)
Table 7.16 North America Plasma Therapy Market by Source Forecast 2021-2031 (US$ million, AGR %, CAGR %)
Table 7.17 North America Plasma Therapy Market by Source Forecast 2021-2031 (US$ million, AGR %, CAGR %) (V-Shaped Recovery)
Table 7.18 North America Plasma Therapy Market by Source Forecast 2021-2031 (US$ million, AGR %, CAGR %) (W-Shaped Recovery)
Table 7.19 North America Plasma Therapy Market by Source Forecast 2021-2031 (US$ million, AGR %, CAGR %) (U-Shaped Recovery)
Table 7.20 North America Plasma Therapy Market by Source Forecast 2021-2031 (US$ million, AGR %, CAGR %) (L-Shaped Recovery)
Table 7.21 North America Plasma Therapy Market by Application Forecast 2021-2031 (US$ million, AGR %, CAGR %)
Table 7.22 North America Plasma Therapy Market by Application Forecast 2021-2031 (US$ million, AGR %, CAGR %) (V-Shaped Recovery)
Table 7.23 North America Plasma Therapy Market by Application Forecast 2021-2031 (US$ million, AGR %, CAGR %) (W-Shaped Recovery)
Table 7.24 North America Plasma Therapy Market by Application Forecast 2021-2031 (US$ million, AGR %, CAGR %) (U-Shaped Recovery)
Table 7.25 North America Plasma Therapy Market by Application Forecast 2021-2031 (US$ million, AGR %, CAGR %) (L-Shaped Recovery)
Table 7.26 North America Plasma Therapy Market by Type Forecast 2021-2031 (US$ million, AGR %, CAGR %)
Table 7.27 North America Plasma Therapy Market by Type Forecast 2021-2031 (US$ million, AGR %, CAGR %) (V-Shaped Recovery)
Table 7.28 North America Plasma Therapy Market by Type Forecast 2021-2031 (US$ million, AGR %, CAGR %) (W-Shaped Recovery)
Table 7.29 North America Plasma Therapy Market by Type Forecast 2021-2031 (US$ million, AGR %, CAGR %) (U-Shaped Recovery)
Table 7.30 North America Plasma Therapy Market by Type Forecast 2021-2031 (US$ million, AGR %, CAGR %) (L-Shaped Recovery)
Table 7.31 North America Plasma Therapy Market by End-User Forecast 2021-2031 (US$ million, AGR %, CAGR %)
Table 7.32 North America Plasma Therapy Market by End-User Forecast 2021-2031 (US$ million, AGR %, CAGR %) (V-Shaped Recovery)
Table 7.33 North America Plasma Therapy Market by End-User Forecast 2021-2031 (US$ million, AGR %, CAGR %) (W-Shaped Recovery)
Table 7.34 North America Plasma Therapy Market by End-User Forecast 2021-2031 (US$ million, AGR %, CAGR %) (U-Shaped Recovery)
Table 7.35 North America Plasma Therapy Market by End-User Forecast 2021-2031 (US$ million, AGR %, CAGR %) (L-Shaped Recovery)
Table 8.1 Europe Plasma Therapy Market by Value Forecast 2021-2031 (US$ million, AGR %, CAGR %)
Table 8.2 Europe Plasma Therapy Market by Value Forecast 2021-2031 (US$ million, AGR %, CAGR %) (V-Shaped Recovery)
Table 8.3 Europe Plasma Therapy Market by Value Forecast 2021-2031 (US$ million, AGR %, CAGR %) (W-Shaped Recovery)
Table 8.4 Europe Plasma Therapy Market by Value Forecast 2021-2031 (US$ million, AGR %, CAGR %) (U-Shaped Recovery)
Table 8.5 Europe Plasma Therapy Market by Value Forecast 2021-2031 (US$ million, AGR %, CAGR %) (L-Shaped Recovery)
Table 8.6 Russia Plasma Therapy Market by Value Forecast 2021-2031 (US$ million, AGR %, CAGR %)
Table 8.7 Russia Plasma Therapy Market by Value Forecast 2021-2031 (US$ million, AGR %, CAGR %) (V-Shaped Recovery)
Table 8.8 Russia Plasma Therapy Market by Value Forecast 2021-2031 (US$ million, AGR %, CAGR %) (W-Shaped Recovery)
Table 8.9 Russia Plasma Therapy Market by Value Forecast 2021-2031 (US$ million, AGR %, CAGR %) (U-Shaped Recovery)
Table 8.10 Russia Plasma Therapy Market by Value Forecast 2021-2031 (US$ million, AGR %, CAGR %) (L-Shaped Recovery)
Table 8.11 Germany Plasma Therapy Market by Value Forecast 2021-2031 (US$ million, AGR %, CAGR %)
Table 8.12 Germany Plasma Therapy Market by Value Forecast 2021-2031 (US$ million, AGR %, CAGR %) (V-Shaped Recovery)
Table 8.13 Germany Plasma Therapy Market by Value Forecast 2021-2031 (US$ million, AGR %, CAGR %) (W-Shaped Recovery)
Table 8.14 Germany Plasma Therapy Market by Value Forecast 2021-2031 (US$ million, AGR %, CAGR %) (U-Shaped Recovery)
Table 8.15 Germany Plasma Therapy Market by Value Forecast 2021-2031 (US$ million, AGR %, CAGR %) (L-Shaped Recovery)
Table 8.16 UK Plasma Therapy Market by Value Forecast 2021-2031 (US$ million, AGR %, CAGR %)
Table 8.17 UK Plasma Therapy Market by Value Forecast 2021-2031 (US$ million, AGR %, CAGR %) (V-Shaped Recovery)
Table 8.18 UK Plasma Therapy Market by Value Forecast 2021-2031 (US$ million, AGR %, CAGR %) (W-Shaped Recovery)
Table 8.19 UK Plasma Therapy Market by Value Forecast 2021-2031 (US$ million, AGR %, CAGR %) (U-Shaped Recovery)
Table 8.20 UK Plasma Therapy Market by Value Forecast 2021-2031 (US$ million, AGR %, CAGR %) (L-Shaped Recovery)
Table 8.21 France Plasma Therapy Market by Value Forecast 2021-2031 (US$ million, AGR %, CAGR %)
Table 8.22 France Plasma Therapy Market by Value Forecast 2021-2031 (US$ million, AGR %, CAGR %) (V-Shaped Recovery)
Table 8.23 France Plasma Therapy Market by Value Forecast 2021-2031 (US$ million, AGR %, CAGR %) (W-Shaped Recovery)
Table 8.24 France Plasma Therapy Market by Value Forecast 2021-2031 (US$ million, AGR %, CAGR %) (U-Shaped Recovery)
Table 8.25 France Plasma Therapy Market by Value Forecast 2021-2031 (US$ million, AGR %, CAGR %) (L-Shaped Recovery)
Table 8.26 Italy Plasma Therapy Market by Value Forecast 2021-2031 (US$ million, AGR %, CAGR %)
Table 8.27 Italy Plasma Therapy Market by Value Forecast 2021-2031 (US$ million, AGR %, CAGR %) (V-Shaped Recovery)
Table 8.28 Italy Plasma Therapy Market by Value Forecast 2021-2031 (US$ million, AGR %, CAGR %) (W-Shaped Recovery)
Table 8.29 Italy Plasma Therapy Market by Value Forecast 2021-2031 (US$ million, AGR %, CAGR %) (U-Shaped Recovery)
Table 8.30 Italy Plasma Therapy Market by Value Forecast 2021-2031 (US$ million, AGR %, CAGR %) (L-Shaped Recovery)
Table 8.31 Rest of Europe Plasma Therapy Market by Value Forecast 2021-2031 (US$ million, AGR %, CAGR %)
Table 8.32 Rest of Europe Plasma Therapy Market by Value Forecast 2021-2031 (US$ million, AGR %, CAGR %) (V-Shaped Recovery)
Table 8.33 Rest of Europe Plasma Therapy Market by Value Forecast 2021-2031 (US$ million, AGR %, CAGR %) (W-Shaped Recovery)
Table 8.34 Rest of Europe Plasma Therapy Market by Value Forecast 2021-2031 (US$ million, AGR %, CAGR %) (U-Shaped Recovery)
Table 8.35 Rest of Europe Plasma Therapy Market by Value Forecast 2021-2031 (US$ million, AGR %, CAGR %) (L-Shaped Recovery)
Table 8.36 Europe Plasma Therapy Market by Source Forecast 2021-2031 (US$ million, AGR %, CAGR %)
Table 8.37 Europe Plasma Therapy Market by Source Forecast 2021-2031 (US$ million, AGR %, CAGR %) (V-Shaped Recovery)
Table 8.38 Europe Plasma Therapy Market by Source Forecast 2021-2031 (US$ million, AGR %, CAGR %) (W-Shaped Recovery)
Table 8.39 Europe Plasma Therapy Market by Source Forecast 2021-2031 (US$ million, AGR %, CAGR %) (U-Shaped Recovery)
Table 8.40 Europe Plasma Therapy Market by Source Forecast 2021-2031 (US$ million, AGR %, CAGR %) (L-Shaped Recovery)
Table 8.41 Europe Plasma Therapy Market by Application Forecast 2021-2031 (US$ million, AGR %, CAGR %)
Table 8.42 Europe Plasma Therapy Market by Application Forecast 2021-2031 (US$ million, AGR %, CAGR %) (V-Shaped Recovery)
Table 8.43 Europe Plasma Therapy Market by Application Forecast 2021-2031 (US$ million, AGR %, CAGR %) (W-Shaped Recovery)
Table 8.44 Europe Plasma Therapy Market by Application Forecast 2021-2031 (US$ million, AGR %, CAGR %) (U-Shaped Recovery)
Table 8.45 Europe Plasma Therapy Market by Application Forecast 2021-2031 (US$ million, AGR %, CAGR %) (L-Shaped Recovery)
Table 8.46 Europe Plasma Therapy Market by Type Forecast 2021-2031 (US$ million, AGR %, CAGR %)
Table 8.47 Europe Plasma Therapy Market by Type Forecast 2021-2031 (US$ million, AGR %, CAGR %) (V-Shaped Recovery)
Table 8.48 Europe Plasma Therapy Market by Type Forecast 2021-2031 (US$ million, AGR %, CAGR %) (W-Shaped Recovery)
Table 8.49 Europe Plasma Therapy Market by Type Forecast 2021-2031 (US$ million, AGR %, CAGR %) (U-Shaped Recovery)
Table 8.50 Europe Plasma Therapy Market by Type Forecast 2021-2031 (US$ million, AGR %, CAGR %) (L-Shaped Recovery)
Table 8.51 Europe Plasma Therapy Market by End-User Forecast 2021-2031 (US$ million, AGR %, CAGR %)
Table 8.52 Europe Plasma Therapy Market by End-User Forecast 2021-2031 (US$ million, AGR %, CAGR %) (V-Shaped Recovery)
Table 8.53 Europe Plasma Therapy Market by End-User Forecast 2021-2031 (US$ million, AGR %, CAGR %) (W-Shaped Recovery)
Table 8.54 Europe Plasma Therapy Market by End-User Forecast 2021-2031 (US$ million, AGR %, CAGR %) (U-Shaped Recovery)
Table 8.55 Europe Plasma Therapy Market by End-User Forecast 2021-2031 (US$ million, AGR %, CAGR %) (L-Shaped Recovery)
Table 9.1 Asia-Pacific Plasma Therapy Market by Value Forecast 2021-2031 (US$ million, AGR %, CAGR %)
Table 9.2 Asia-Pacific Plasma Therapy Market by Value Forecast 2021-2031 (US$ million, AGR %, CAGR %) (V-Shaped Recovery)
Table 9.3 Asia-Pacific Plasma Therapy Market by Value Forecast 2021-2031 (US$ million, AGR %, CAGR %) (W-Shaped Recovery)
Table 9.4 Asia-Pacific Plasma Therapy Market by Value Forecast 2021-2031 (US$ million, AGR %, CAGR %) (U-Shaped Recovery)
Table 9.5 Asia-Pacific Plasma Therapy Market by Value Forecast 2021-2031 (US$ million, AGR %, CAGR %) (L-Shaped Recovery)
Table 9.6 Japan Plasma Therapy Market by Value Forecast 2021-2031 (US$ million, AGR %, CAGR %)
Table 9.7 Japan Plasma Therapy Market by Value Forecast 2021-2031 (US$ million, AGR %, CAGR %) (V-Shaped Recovery)
Table 9.8 Japan Plasma Therapy Market by Value Forecast 2021-2031 (US$ million, AGR %, CAGR %) (W-Shaped Recovery)
Table 9.9 Japan Plasma Therapy Market by Value Forecast 2021-2031 (US$ million, AGR %, CAGR %) (U-Shaped Recovery)
Table 9.10 Japan Plasma Therapy Market by Value Forecast 2021-2031 (US$ million, AGR %, CAGR %) (L-Shaped Recovery)
Table 9.11 China Plasma Therapy Market by Value Forecast 2021-2031 (US$ million, AGR %, CAGR %)
Table 9.12 China Plasma Therapy Market by Value Forecast 2021-2031 (US$ million, AGR %, CAGR %) (V-Shaped Recovery)
Table 9.13 China Plasma Therapy Market by Value Forecast 2021-2031 (US$ million, AGR %, CAGR %) (W-Shaped Recovery)
Table 9.14 China Plasma Therapy Market by Value Forecast 2021-2031 (US$ million, AGR %, CAGR %) (U-Shaped Recovery)
Table 9.15 China Plasma Therapy Market by Value Forecast 2021-2031 (US$ million, AGR %, CAGR %) (L-Shaped Recovery)
Table 9.16 India Plasma Therapy Market by Value Forecast 2021-2031 (US$ million, AGR %, CAGR %)
Table 9.17 India Plasma Therapy Market by Value Forecast 2021-2031 (US$ million, AGR %, CAGR %) (V-Shaped Recovery)
Table 9.18 India Plasma Therapy Market by Value Forecast 2021-2031 (US$ million, AGR %, CAGR %) (W-Shaped Recovery)
Table 9.19 India Plasma Therapy Market by Value Forecast 2021-2031 (US$ million, AGR %, CAGR %) (U-Shaped Recovery)
Table 9.20 India Plasma Therapy Market by Value Forecast 2021-2031 (US$ million, AGR %, CAGR %) (L-Shaped Recovery)
Table 9.21 South Korea Plasma Therapy Market by Value Forecast 2021-2031 (US$ million, AGR %, CAGR %)
Table 9.22 South Korea Plasma Therapy Market by Value Forecast 2021-2031 (US$ million, AGR %, CAGR %) (V-Shaped Recovery)
Table 9.23 South Korea Plasma Therapy Market by Value Forecast 2021-2031 (US$ million, AGR %, CAGR %) (W-Shaped Recovery)
Table 9.24 South Korea Plasma Therapy Market by Value Forecast 2021-2031 (US$ million, AGR %, CAGR %) (U-Shaped Recovery)
Table 9.25 South Korea Plasma Therapy Market by Value Forecast 2021-2031 (US$ million, AGR %, CAGR %) (L-Shaped Recovery)
Table 9.26 Australia Plasma Therapy Market by Value Forecast 2021-2031 (US$ million, AGR %, CAGR %)
Table 9.27 Australia Plasma Therapy Market by Value Forecast 2021-2031 (US$ million, AGR %, CAGR %) (V-Shaped Recovery)
Table 9.28 Australia Plasma Therapy Market by Value Forecast 2021-2031 (US$ million, AGR %, CAGR %) (W-Shaped Recovery)
Table 9.29 Australia Plasma Therapy Market by Value Forecast 2021-2031 (US$ million, AGR %, CAGR %) (U-Shaped Recovery)
Table 9.30 Australia Plasma Therapy Market by Value Forecast 2021-2031 (US$ million, AGR %, CAGR %) (L-Shaped Recovery)
Table 9.31 Rest of Asia-Pacific Plasma Therapy Market by Value Forecast 2021-2031 (US$ million, AGR %, CAGR %)
Table 9.32 Rest of Asia-Pacific Plasma Therapy Market by Value Forecast 2021-2031 (US$ million, AGR %, CAGR %) (V-Shaped Recovery)
Table 9.33 Rest of Asia-Pacific Plasma Therapy Market by Value Forecast 2021-2031 (US$ million, AGR %, CAGR %) (W-Shaped Recovery)
Table 9.34 Rest of Asia-Pacific Plasma Therapy Market by Value Forecast 2021-2031 (US$ million, AGR %, CAGR %) (U-Shaped Recovery)
Table 9.35 Rest of Asia-Pacific Plasma Therapy Market by Value Forecast 2021-2031 (US$ million, AGR %, CAGR %) (L-Shaped Recovery)
Table 9.36 Asia-Pacific Plasma Therapy Market by Source Forecast 2021-2031 (US$ million, AGR %, CAGR %)
Table 9.37 Asia-Pacific Plasma Therapy Market by Source Forecast 2021-2031 (US$ million, AGR %, CAGR %) (V-Shaped Recovery)
Table 9.38 Asia-Pacific Plasma Therapy Market by Source Forecast 2021-2031 (US$ million, AGR %, CAGR %) (W-Shaped Recovery)
Table 9.39 Asia-Pacific Plasma Therapy Market by Source Forecast 2021-2031 (US$ million, AGR %, CAGR %) (U-Shaped Recovery)
Table 9.40 Asia-Pacific Plasma Therapy Market by Source Forecast 2021-2031 (US$ million, AGR %, CAGR %) (L-Shaped Recovery)
Table 9.41 Asia-Pacific Plasma Therapy Market by Application Forecast 2021-2031 (US$ million, AGR %, CAGR %)
Table 9.42 Asia-Pacific Plasma Therapy Market by Application Forecast 2021-2031 (US$ million, AGR %, CAGR %) (V-Shaped Recovery)
Table 9.43 Asia-Pacific Plasma Therapy Market by Application Forecast 2021-2031 (US$ million, AGR %, CAGR %) (W-Shaped Recovery)
Table 9.44 Asia-Pacific Plasma Therapy Market by Application Forecast 2021-2031 (US$ million, AGR %, CAGR %) (U-Shaped Recovery)
Table 9.45 Asia-Pacific Plasma Therapy Market by Application Forecast 2021-2031 (US$ million, AGR %, CAGR %) (L-Shaped Recovery)
Table 9.46 Asia-Pacific Plasma Therapy Market by Type Forecast 2021-2031 (US$ million, AGR %, CAGR %)
Table 9.47 Asia-Pacific Plasma Therapy Market by Type Forecast 2021-2031 (US$ million, AGR %, CAGR %) (V-Shaped Recovery)
Table 9.48 Asia-Pacific Plasma Therapy Market by Type Forecast 2021-2031 (US$ million, AGR %, CAGR %) (W-Shaped Recovery)
Table 9.49 Asia-Pacific Plasma Therapy Market by Type Forecast 2021-2031 (US$ million, AGR %, CAGR %) (U-Shaped Recovery)
Table 9.50 Asia-Pacific Plasma Therapy Market by Type Forecast 2021-2031 (US$ million, AGR %, CAGR %) (L-Shaped Recovery)
Table 9.51 Asia-Pacific Plasma Therapy Market by End-User Forecast 2021-2031 (US$ million, AGR %, CAGR %)
Table 9.52 Asia-Pacific Plasma Therapy Market by End-User Forecast 2021-2031 (US$ million, AGR %, CAGR %) (V-Shaped Recovery)
Table 9.53 Asia-Pacific Plasma Therapy Market by End-User Forecast 2021-2031 (US$ million, AGR %, CAGR %) (W-Shaped Recovery)
Table 9.54 Asia-Pacific Plasma Therapy Market by End-User Forecast 2021-2031 (US$ million, AGR %, CAGR %) (U-Shaped Recovery)
Table 9.55 Asia-Pacific Plasma Therapy Market by End-User Forecast 2021-2031 (US$ million, AGR %, CAGR %) (L-Shaped Recovery)
Table 10.1 LAMEA Plasma Therapy Market by Value Forecast 2021-2031 (US$ million, AGR %, CAGR %)
Table 10.2 LAMEA Plasma Therapy Market by Value Forecast 2021-2031 (US$ million, AGR %, CAGR %) (V-Shaped Recovery)
Table 10.3 LAMEA Plasma Therapy Market by Value Forecast 2021-2031 (US$ million, AGR %, CAGR %) (W-Shaped Recovery)
Table 10.4 LAMEA Plasma Therapy Market by Value Forecast 2021-2031 (US$ million, AGR %, CAGR %) (U-Shaped Recovery)
Table 10.5 LAMEA Plasma Therapy Market by Value Forecast 2021-2031 (US$ million, AGR %, CAGR %) (L-Shaped Recovery)
Table 10.6 Brazil Plasma Therapy Market by Value Forecast 2021-2031 (US$ million, AGR %, CAGR %)
Table 10.7 Brazil Plasma Therapy Market by Value Forecast 2021-2031 (US$ million, AGR %, CAGR %) (V-Shaped Recovery)
Table 10.8 Brazil Plasma Therapy Market by Value Forecast 2021-2031 (US$ million, AGR %, CAGR %) (W-Shaped Recovery)
Table 10.9 Brazil Plasma Therapy Market by Value Forecast 2021-2031 (US$ million, AGR %, CAGR %) (U-Shaped Recovery)
Table 10.10 Brazil Plasma Therapy Market by Value Forecast 2021-2031 (US$ million, AGR %, CAGR %) (L-Shaped Recovery)
Table 10.11 Saudi Arabia Plasma Therapy Market by Value Forecast 2021-2031 (US$ million, AGR %, CAGR %)
Table 10.12 Saudi Arabia Plasma Therapy Market by Value Forecast 2021-2031 (US$ million, AGR %, CAGR %) (V-Shaped Recovery)
Table 10.13 Saudi Arabia Plasma Therapy Market by Value Forecast 2021-2031 (US$ million, AGR %, CAGR %) (W-Shaped Recovery)
Table 10.14 Saudi Arabia Plasma Therapy Market by Value Forecast 2021-2031 (US$ million, AGR %, CAGR %) (U-Shaped Recovery)
Table 10.15 Saudi Arabia Plasma Therapy Market by Value Forecast 2021-2031 (US$ million, AGR %, CAGR %) (L-Shaped Recovery)
Table 10.16 South Africa Plasma Therapy Market by Value Forecast 2021-2031 (US$ million, AGR %, CAGR %)
Table 10.17 South Africa Plasma Therapy Market by Value Forecast 2021-2031 (US$ million, AGR %, CAGR %) (V-Shaped Recovery)
Table 10.18 South Africa Plasma Therapy Market by Value Forecast 2021-2031 (US$ million, AGR %, CAGR %) (W-Shaped Recovery)
Table 10.19 South Africa Plasma Therapy Market by Value Forecast 2021-2031 (US$ million, AGR %, CAGR %) (U-Shaped Recovery)
Table 10.20 South Africa Plasma Therapy Market by Value Forecast 2021-2031 (US$ million, AGR %, CAGR %) (L-Shaped Recovery)
Table 10.21 Mexico Plasma Therapy Market by Value Forecast 2021-2031 (US$ million, AGR %, CAGR %)
Table 10.22 Mexico Plasma Therapy Market by Value Forecast 2021-2031 (US$ million, AGR %, CAGR %) (V-Shaped Recovery)
Table 10.23 Mexico Plasma Therapy Market by Value Forecast 2021-2031 (US$ million, AGR %, CAGR %) (W-Shaped Recovery)
Table 10.24 Mexico Plasma Therapy Market by Value Forecast 2021-2031 (US$ million, AGR %, CAGR %) (U-Shaped Recovery)
Table 10.25 Mexico Plasma Therapy Market by Value Forecast 2021-2031 (US$ million, AGR %, CAGR %) (L-Shaped Recovery)
Table 10.26 UAE Plasma Therapy Market by Value Forecast 2021-2031 (US$ million, AGR %, CAGR %)
Table 10.27 UAE Plasma Therapy Market by Value Forecast 2021-2031 (US$ million, AGR %, CAGR %) (V-Shaped Recovery)
Table 10.28 UAE Plasma Therapy Market by Value Forecast 2021-2031 (US$ million, AGR %, CAGR %) (W-Shaped Recovery)
Table 10.29 UAE Plasma Therapy Market by Value Forecast 2021-2031 (US$ million, AGR %, CAGR %) (U-Shaped Recovery)
Table 10.30 UAE Plasma Therapy Market by Value Forecast 2021-2031 (US$ million, AGR %, CAGR %) (L-Shaped Recovery)
Table 10.31 Rest of LAMEA Plasma Therapy Market by Value Forecast 2021-2031 (US$ million, AGR %, CAGR %)
Table 10.32 Rest of LAMEA Plasma Therapy Market by Value Forecast 2021-2031 (US$ million, AGR %, CAGR %) (V-Shaped Recovery)
Table 10.33 Rest of LAMEA Plasma Therapy Market by Value Forecast 2021-2031 (US$ million, AGR %, CAGR %) (W-Shaped Recovery)
Table 10.34 Rest of LAMEA Plasma Therapy Market by Value Forecast 2021-2031 (US$ million, AGR %, CAGR %) (U-Shaped Recovery)
Table 10.35 Rest of LAMEA Plasma Therapy Market by Value Forecast 2021-2031 (US$ million, AGR %, CAGR %) (L-Shaped Recovery)
Table 10.36 LAMEA Plasma Therapy Market by Source Forecast 2021-2031 (US$ million, AGR %, CAGR %)
Table 10.37 LAMEA Plasma Therapy Market by Source Forecast 2021-2031 (US$ million, AGR %, CAGR %) (V-Shaped Recovery)
Table 10.38 LAMEA Plasma Therapy Market by Source Forecast 2021-2031 (US$ million, AGR %, CAGR %) (W-Shaped Recovery)
Table 10.39 LAMEA Plasma Therapy Market by Source Forecast 2021-2031 (US$ million, AGR %, CAGR %) (U-Shaped Recovery)
Table 10.40 LAMEA Plasma Therapy Market by Source Forecast 2021-2031 (US$ million, AGR %, CAGR %) (L-Shaped Recovery)
Table 10.41 LAMEA Plasma Therapy Market by Application Forecast 2021-2031 (US$ million, AGR %, CAGR %)
Table 10.42 LAMEA Plasma Therapy Market by Application Forecast 2021-2031 (US$ million, AGR %, CAGR %) (V-Shaped Recovery)
Table 10.43 LAMEA Plasma Therapy Market by Application Forecast 2021-2031 (US$ million, AGR %, CAGR %) (W-Shaped Recovery)
Table 10.44 LAMEA Plasma Therapy Market by Application Forecast 2021-2031 (US$ million, AGR %, CAGR %) (U-Shaped Recovery)
Table 10.45 LAMEA Plasma Therapy Market by Application Forecast 2021-2031 (US$ million, AGR %, CAGR %) (L-Shaped Recovery)
Table 10.46 LAMEA Plasma Therapy Market by Type Forecast 2021-2031 (US$ million, AGR %, CAGR %)
Table 10.47 LAMEA Plasma Therapy Market by Type Forecast 2021-2031 (US$ million, AGR %, CAGR %) (V-Shaped Recovery)
Table 10.48 LAMEA Plasma Therapy Market by Type Forecast 2021-2031 (US$ million, AGR %, CAGR %) (W-Shaped Recovery)
Table 10.49 LAMEA Plasma Therapy Market by Type Forecast 2021-2031 (US$ million, AGR %, CAGR %) (U-Shaped Recovery)
Table 10.50 LAMEA Plasma Therapy Market by Type Forecast 2021-2031 (US$ million, AGR %, CAGR %) (L-Shaped Recovery)
Table 10.51 LAMEA Plasma Therapy Market by End-User Forecast 2021-2031 (US$ million, AGR %, CAGR %)
Table 10.52 LAMEA Plasma Therapy Market by End-User Forecast 2021-2031 (US$ million, AGR %, CAGR %) (V-Shaped Recovery)
Table 10.53 LAMEA Plasma Therapy Market by End-User Forecast 2021-2031 (US$ million, AGR %, CAGR %) (W-Shaped Recovery)
Table 10.54 LAMEA Plasma Therapy Market by End-User Forecast 2021-2031 (US$ million, AGR %, CAGR %) (U-Shaped Recovery)
Table 10.55 LAMEA Plasma Therapy Market by End-User Forecast 2021-2031 (US$ million, AGR %, CAGR %) (L-Shaped Recovery)
Table 11.1 Biotest AG: Company Information
Table 11.2 Biotest AG Company: Company Revenue 2015-2019 (US$Mn, AGR %)
Table 11.3 Biotest AG: Company Product and Service Offerings
Table 11.4 Biotest AG: Company Recent Developments till Sept,2020
Table 11.5 CSL Ltd: Company Information
Table 11.6 CSL Ltd Company: Company Revenue 2015-2019 (US$Mn, AGR %)
Table 11.7 CSL Ltd: Company Product and Service Offerings
Table 11.8 CSL Ltd: Company Recent Developments till Sept,2020
Table 11.9 Grifols International S.A: Company Information
Table 11.10 Grifols S.A Company: Company Revenue 2015-2019 (US$Mn, AGR %)
Table 11.11 Grifols S.A: Company Product and Service Offerings
Table 11.12 Grifols S.A: Company Recent Developments till Sept,2020
Table 11.13 China Biologic Products: Company Information
Table 11.14 China Biologic Products Company: Company Revenue 2015-2019 (US$Mn, AGR %)
Table 11.15 China Biologic Products: Company Product and Service Offerings
Table 11.16 China Biologic Products: Company Recent Developments till Sept,2020
Table 11.17 Terumo Corporation: Company Information
Table 11.18 Terumo Corporation Company: Company Revenue 2015-2019 (US$Mn, AGR %)
Table 11.19 Terumo Corporation: Company Product and Service Offerings
Table 11.20 Terumo Corporation: Company Recent Developments till Sept,2020
Table 11.21 J&J: Company Information
Table 11.22 J&J Company: Company Revenue 2015-2019 (US$Mn, AGR %)
Table 11.23 J&J: Company Product and Service Offerings
Table 11.24 J&J: Company Recent Developments till Sept,2020
Table 11.25 Zimmer Biomet Holdings Inc: Company Information
Table 11.26 Zimmer Biomet Holdings Company: Company Revenue 2015-2019 (US$Mn, AGR %)
Table 11.27 Zimmer Biomet Holdings: Company Product and Service Offerings
Table 11.28 Zimmer Biomet Holdings: Company Recent Developments till Sept,2020
Table 11.29 Stryker Corporation: Company Information
Table 11.30 Stryker Corporation Company: Company Revenue 2015-2019 (US$Mn, AGR %)
Table 11.31 Stryker Corporation: Company Product and Service Offerings
Table 11.32 Stryker Corporation: Company Recent Developments till Sept,2020
Table 11.33 Thermogenesis Holdings: Company Information
Table 11.34 Thermogenesis Holdings: Company Revenue 2015-2019 (US$Mn, AGR %)
Table 11.35 Thermogenesis Holdings: Company Product and Service Offerings
Table 11.36 Thermogenesis Holdings: Company Recent Developments till Sept,2020
Table 11.37 Nuo Therapeutics: Company Information
Table 11.38 Nuo Therapeutics Company: Company Revenue 2015-2019 (US$Mn, AGR %)
Table 11.39 Nuo Therapeutics: Company Product and Service Offerings
List of Companies Profiled
Biotest AG
China Biologic Products Holdings, Inc.
CSL Limited
Grifols International S.A
Johnson & Johnson
Nuo Therapeutics, Inc.,
Stryker Corporation
Terumo Corporation
Thermogenesis Holdings, Inc.,
Zimmer Biomet Holdings, Inc.
List of Other Companies
AABB
Alexion Pharmaceuticals
America’s Blood Centers
American Red Cross
Asahi Kasei Pharma America
Australian Red Cross
Baxalta
BAXALTA Gmbh
Bayer
Biomarin Pharmaceutical
Bioverativ Therapeutics
Bluebird Bio
Canadian Plasma Resources
Csl Behring
Erytech Pharma
Ethicon
Fresenius Kabi
Genentech
Gigagen
Global Blood Therapeutics
Grifols
Immucor GTI Diagnostics
IPFA
Japan Blood Products Org
Jeffrey Modell Foundation
Km Biologics
NIHON PHARMA
Novo Nordisk
PFIZER
Ppta
Prometic Life Sciences
Prometic Plasma Resources
Roche
Sanofi
Spark Therapeutics
Swedish Orphan Biovitrum
Takeda
VERSITI
List of Organizations Mentioned in the Report
Belgium Red Cross Central Fractionation Facility
Canadian Blood Agency
Canadian Blood Services (CBS)
Center for Biologics Evaluation and Research (CBER)
Chemo-Sero Therapeutic Research Institute (Kaketsuken)
Food and Drug Administration (FDA)
Japan Blood Products Organization
Japanese Red Cross Society (JRCS)
National Bioproducts Institute
National Blood Service (NBS)
National Genetics Institute
National Health Service (NHS)
New Zealand Blood Service
Sanquin Blood Supply Foundation
Southern Blood Services
The Plasma Protein Therapeutics Association (PPTA)
University of Massachusetts Medical School
World Health Organizations (WHO)