This report is intended to provide an in-depth analysis of the latest trends prevailing in the cancer biologics market and its growth and development in the next decade. The changing demographics of the world population, increasing cancer prevalence, developing healthcare infrastructure, emerging economies, consumer spending behaviour, per capita income, macroeconomic factors, rising GDPs, and the reformation in laws and regulations are trend setting factors, which will affect the market.
Why Cancer Biologics Market is Growing?
The main drivers for the growth include technological advancements in the development of novel biomarkers, rising preference for minimally or less invasive surgeries, increasing cancer awareness leading to growth in cancer cases, and growing disposable income in emerging economies. Moreover, rising number of pre-screening programs for cancer detection using liquid biopsy are expected to provide new market opportunities for cancer biologics in near future.
What are the Market Driving Factors?
• Rising Cancer Prevalence Worldwide
• Increasing Ageing Population in Developed as well as Developing Economies
Key Challenges for Cancer Biologics Market
• Shortage of Skilled Workforce in the Biopharmaceutical Industry
• High Cost Associated with Biopharmaceutical Drug Manufacturing
What are the Market Opportunities?
• Increasing R&D Spending of Biopharmaceutical Companies
• Future Perspective in Oncology Industry
Why you Should buy this Report?
Apart from market estimation and forecast to 2031 the report covers below mentioned important factors to offer in-depth analysis of cancer biologics industry
• SWOT Analysis
• Porter’s Five Forces Model
• European Oncology Market Trends
• Global Oncology Spending, 2016 – 2031
• Disease Prevalence and Incidence in Europe by Country
• EMA Approved Biologics in Oncology
• Biosimilars and R&D Biologics in Development
This report includes data analysis and invaluable insight into how COVID-19 will affect your industry. Access this report today.
To access the data contained in this document please email contactus@visiongain.com
What are the Leading Companies Operating in the Market?
• AbbVie Inc
• F.Hoffman La Roche
• GlaxoSmithKline
• Eli Lilly and Company
• Amgen
• Johnson & Johnson
• Merck & Co.
• Pfizer

Market Segmentation and Scope
Cancer Biologics Market by Treatment
• Chemotherapy
• Targeted Therapy
• Immunotherapy
• Hormonal Therapy
• Others
Cancer Biologics Market by Indication
• Breast cancer
• Cervical cancer
• Colon and rectal cancer
• Gastric cancer
• Lung cancer
• Ovarian cancer
• Renal cell cancer
• Melanoma
Cancer Biologics Market by Biologic Drug
• Bevacizumab
• Trastuzumab
• Trastuzumab emtansine
• Pertuzumab
• Rituximab
• Cetuximab
• Panitumumab
• Ramucirumab
• Necitumumab
• Pembrolizumab
• Atezolizumab
• Durvalumab
• Nivolumab
• Ipilimumab
Cancer Biologics Market by End User
• Hospitals
• Specialty Clinics
• Cancer and Radiation Therapy Centers
Europe Cancer Biologics Market
• UK Cancer Biologics Market
• Germany Cancer Biologics Market
• France Cancer Biologics Market
• Italy Cancer Biologics Market
• Spain Cancer Biologics Market
• Portugal Cancer Biologics Market
• Poland Cancer Biologics Market
• Hungary Cancer Biologics Market
• Czech Republic Cancer Biologics Market
• Slovakia Cancer Biologics Market
• Slovenia Cancer Biologics Market
• Romania Cancer Biologics Market
• Bulgaria Cancer Biologics Market
• Croatia Cancer Biologics Market
• Baltic States Cancer Biologics Market
• Serbia Cancer Biologics Market
To access the data contained in this document please email contactus@visiongain.com
Buy our report today Cancer Biologics Market Report 2021-2031: Forecasts by Treatment (Chemotherapy, Targeted Therapy, Immunotherapy, Hormonal Therapy, Others), by Indication (Breast Cancer, Cervical Cancer, Colon and Rectal Cancer, Gastric Cancer, Lung Cancer, Ovarian Cancer, Renal Cell Cancer, Melanoma), by Biologic Drugs (Bevacizumab, Trastuzumab, Trastuzumab Emtansine, Pertuzumab, Rituximab, Cetuximab, Panitumumab, Ramucirumab, Necitumumab, Pembrolizumab, Atezolizumab, Durvalumab, Nivolumab, Ipilimumab), by End-user (Hospitals, Specialty Clinics, Cancer and Radiation Therapy Centers) AND Regional and Leading National Market Analysis PLUS Analysis of Leading Cancer Biologics Companies AND COVID-19 Recovery Scenarios. Avoid missing out by staying informed – order our report now.
Visiongain is a trading partner with the US Federal Government
CCR Ref number: KD4R6
Do you have any custom requirements we can help you with? Any need for a specific country, geo region, market segment or specific company information? Contact us today, we can discuss your needs and see how we can help: sara.peerun@visiongain.com
1. Report Overview
1.1. Global Cancer Biologics Market Overview
1.2. Why You Should Read This Report
1.3. How This Report Delivers
1.4. Key Questions Answered by This Analytical Report
1.5. Who Is This Report For?
1.6. Methodology
1.6.1. Primary Research
1.6.2. Secondary Research
1.6.3. Market Evaluation & Forecasting Methodology
1.7. Frequently Asked Questions (FAQ)
1.8. Associated Visiongain Reports
1.9. About Visiongain
2. Introduction to the Cancer Biologics Market
2.1. Cancer Biologics Market Definition
2.2. Treatments used in Cancer Biologics Industry
2.2.1. Chemotherapy
2.2.2. Targeted Therapy
2.2.2.1. Monoclonal Antibodies
2.2.2.2. Small-Molecule Drugs
2.2.3. Immunotherapy
2.2.4. Hormonal Therapy
2.3. Cancer Biologics Industry by Indication
2.3.1. Breast Cancer
2.3.2. Cervical Cancer
2.3.3. Colon and Rectal Cancer
2.3.4. Gastric Cancer
2.3.5. Lung Cancer
2.3.6. Ovarian Cancer
2.3.7. Renal Cell Cancer
2.3.8. Melanoma
3. Cancer Biologics Market Overview
3.1. Global Oncology Spending Market Size, Market Analysis and Forecast, 2016-2031
3.2. Global and Regional Cancer Biologics Market, 2021-2031
3.3. Market Dynamics
3.3.1. Market Drivers
3.3.1.1. Rising Cancer Prevalence Worldwide
3.3.1.2. Increasing Ageing Population in Developed as well as Developing Economies
3.3.2. Market Restraints/Challenges
3.3.2.1. Shortage of Skilled Workforce in the Biopharmaceutical Industry
3.3.2.2. High Cost Associated with Biopharmaceutical Drug Manufacturing
3.3.3. Opportunities
3.3.3.1. Increasing R&D Spending of Biopharmaceutical Companies
3.3.3.2. Future Perspective in Oncology Industry
3.4. Cancer Biologics Market: SWOT Analysis
3.5. Cancer Biologics Market: Porter’s Five Forces Model
3.5.1. Bargaining Power of Buyers
3.5.2. Bargaining Power of Suppliers
3.5.3. Threats of New Entrants
3.5.4. Threats of Substitutes
3.5.5. Competitive Rivalry
3.6. European Oncology Market Trends
3.7. Disease Prevalence and Incidence in Europe
3.7.1. Germany Cancer Incidence and Mortality
3.7.2. UK Cancer Incidence and Mortality
3.7.3. France Cancer Incidence and Mortality
3.7.4. Italy Cancer Incidence and Mortality
3.7.5. Spain Cancer Incidence and Mortality
3.7.6. Portugal Cancer Incidence and Mortality
3.7.7. Poland Cancer Incidence and Mortality
3.7.8. Hungary Cancer Incidence and Mortality
3.7.9. Czech Republic Cancer Incidence and Mortality
3.7.10. Slovakia Cancer Incidence and Mortality
3.7.11. Slovenia Cancer Incidence and Mortality
3.7.12. Romania Cancer Incidence and Mortality
3.7.13. Bulgaria Cancer Incidence and Mortality
3.7.14. Croatia Cancer Incidence and Mortality
3.7.15. Serbia Cancer Incidence and Mortality
3.8. Prescription Distribution of Bevacizumab and Trastuzumab
3.8.1. Prescription Distribution of Bevacizumab
3.8.1.1. Metastatic Colorectal Cancer
3.8.1.2. First-Line Non-Squamous Non–Small Cell Lung Cancer
3.8.1.3. Recurrent Glioblastoma
3.8.1.4. Metastatic Renal Cell Carcinoma
3.8.1.5. Persistent, Recurrent, Or Metastatic Cervical Cancer
3.8.1.6. Epithelial Ovarian, Fallopian Tube, Or Primary Peritoneal Cancer
3.8.1.7. Hepatocellular Carcinoma
3.8.2. Prescription Distribution of Trastuzumab
3.8.2.1. Adjuvant Breast Cancer
3.8.2.2. Metastatic Breast Cancer
3.8.2.3. Metastatic Gastric Cancer
3.9. EMA Approval, Loss of Exclusivity and Introduction of Biosimilars Impact Analysis
3.10. Patient drop-out rate
3.11. Oncologist Perceptions on Biosimilars
3.12. Barriers to Biologic Treatments and Expected Impact of Cheaper Options on the Market
3.13. Biosimilars and R&D Biologics in Development
4. Global Cancer Biologics Market Analysis and Forecast 2021-2031, by Treatment Type
4.1. Chemotherapy Market Size
4.1.1. Side Effects of Chemotherapy
4.1.2. Cancer Biologics Market Outlook for Chemotherapy: Recovery Scenarios (V, U, L, W)
4.2. Targeted Therapy Market Size
4.2.1. Examples of Targeted Therapies
4.2.2. Targeted Therapies Approved for Specific Types of Cancer
4.2.3. Cancer Biologics Market Outlook for Targeted Therapy: Recovery Scenarios (V, U, L, W)
4.2.4. Tyrosine kinase inhibitors (small molecules) / mTOR, BRAF, etc. receptor targeted agents
4.2.5. Monoclonal antibodies / mAbs (VEGF, HER, DP1, etc. receptor targeted agents)
4.2.6. Antibody-drug conjugates – with mAbs or with a small molecule
4.3. Immunotherapy Market Size
4.3.1. What Does Immunotherapy Treat?
4.3.2. Types of Immunotherapy
4.3.3. Cancer Biologics Market Outlook for Immunotherapy: Recovery Scenarios (V, U, L, W)
4.4. Hormonal Therapy Market Size
4.4.1. Hormone Therapy for Breast Cancer
4.4.2. Hormone Therapy Drugs for Breast Cancer
4.4.3. Breast Cancer and Tamoxifen
4.4.4. Cancer Biologics Market Outlook for Hormonal Therapy: Recovery Scenarios (V, U, L, W)
4.5. Other Treatments Market Size
4.5.1. Are there Vaccines that Prevent Cancer?
4.5.2. Cancer Biologics Market Outlook for Other Treatments: Recovery Scenarios (V, U, L, W)
5. Global Cancer Biologics Market Analysis and Forecast 2021-2031, by Indication
5.1. Breast Cancer Market Size
5.1.1. Node Preservation Reduces Lymphedema Cases
5.1.2. Genomic Testing Minimizes Chemotherapy Exposure
5.1.3. Oral Option for Targeted Therapy
5.1.4. Breast Cancer Statistics, 2020
5.1.5. Cancer Biologics Market Outlook for Breast Cancer: Recovery Scenarios (V, U, L, W)
5.2. Cervical Cancer Market Size
5.2.1. Cancer Biologics Market Outlook for Cervical Cancer: Recovery Scenarios (V, U, L, W)
5.3. Colon and Rectal Cancer Market Size
5.3.1. Drugs Approved for Colon Cancer
5.3.2. Drugs Combinations Used in Colon Cancer
5.3.3. Drugs Approved for Rectal Cancer
5.3.4. Drugs Combinations Used in Rectal Cancer
5.3.5. Cancer Biologics Market Outlook for Colon and Rectal Cancer: Recovery Scenarios (V, U, L, W)
5.4. Gastric Cancer Market Size
5.4.1. Drugs Approved for Gastric Cancer
5.4.2. Drugs Combinations Used in Gastric Cancer
5.4.3. Drugs Approved for Gastroenteropancreatic Neuroendocrine Tumors
5.4.4. Cancer Biologics Market Outlook for Gastric Cancer: Recovery Scenarios (V, U, L, W)
5.5. Lung Cancer Market Size
5.5.1. Drugs Approved for Non-Small Cell Lung Cancer
5.5.2. Drug Combinations Used to Treat Non-Small Cell Lung Cancer
5.5.3. Drugs Approved for Small Cell Lung Cancer
5.5.4. Cancer Biologics Market Outlook for Lung Cancer: Recovery Scenarios (V, U, L, W)
5.6. Ovarian Cancer Market Size
5.6.1. Available Treatments for Ovarian Cancer
5.6.2. What New Treatment Options are Under Development?
5.6.3. Cancer Biologics Market Outlook for Ovarian Cancer: Recovery Scenarios (V, U, L, W)
5.7. Renal Cell Cancer Market Size
5.7.1. Cancer Biologics Market Outlook for Renal Cell Cancer: Recovery Scenarios (V, U, L, W)
5.8. Melanoma Market Size
5.8.1. Drugs Approved for Melanoma
5.8.2. Cancer Biologics Market Outlook for Melanoma: Recovery Scenarios (V, U, L, W)
5.9. Other Indications Market Size
5.9.1. Cancer Biologics Market Outlook for Other Indications: Recovery Scenarios (V, U, L, W)
6. Global Cancer Biologics Market Analysis and Forecast 2021-2031, by Biologic Drugs
6.1. Bevacizumab Market Size
6.1.1. Bevacizumab Similar Biologic Launched in India
6.1.2. Cancer Biologics Market Outlook for Bevacizumab: Recovery Scenarios (V, U, L, W)
6.2. Trastuzumab Market Size
6.2.1. Cancer Biologics Market Outlook for Trastuzumab: Recovery Scenarios (V, U, L, W)
6.3. Trastuzumab emtansine Market Size
6.3.1. Cancer Biologics Market Outlook for Trastuzumab emtansine: Recovery Scenarios (V, U, L, W)
6.4. Pertuzumab Market Size
6.4.1. FDA Accepted Roche’s Biologics License Application
6.4.2. Cancer Biologics Market Outlook for Pertuzumab: Recovery Scenarios (V, U, L, W)
6.5. Rituximab Market Size
6.5.1. Cancer Biologics Market Outlook for Rituximab: Recovery Scenarios (V, U, L, W)
6.6. Cetuximab Market Size
6.6.1. Cancer Biologics Market Outlook for Cetuximab: Recovery Scenarios (V, U, L, W)
6.7. Panitumumab Market Size
6.7.1. Cancer Biologics Market Outlook for Panitumumab: Recovery Scenarios (V, U, L, W)
6.8. Ramucirumab Market Size
6.8.1. Cancer Biologics Market Outlook for Ramucirumab: Recovery Scenarios (V, U, L, W)
6.9. Necitumumab Market Size
6.9.1. Role of Necitumumab in the Treatment of Non–Small Cell Lung Cancer (NSCLC)?
6.9.2. Cancer Biologics Market Outlook for Necitumumab: Recovery Scenarios (V, U, L, W)
6.10. Pembrolizumab Market Size
6.10.1. What Pembrolizumab Is Used For:
6.10.2. Cancer Biologics Market Outlook for Pembrolizumab: Recovery Scenarios (V, U, L, W)
6.11. Atezolizumab Market Size
6.11.1. Atezolizumab Drug Used in below Indiactions
6.11.2. Cancer Biologics Market Outlook for Atezolizumab: Recovery Scenarios (V, U, L, W)
6.12. Durvalumab Market Size
6.12.1. FDA Approved Durvalumab for Extensive-Stage Small Cell Lung Cancer
6.12.2. Cancer Biologics Market Outlook for Durvalumab: Recovery Scenarios (V, U, L, W)
6.13. Nivolumab Market Size
6.13.1. FDA to Review Additional GI Cancer Indications for Nivolumab
6.13.2. Cancer Biologics Market Outlook for Nivolumab: Recovery Scenarios (V, U, L, W)
6.14. Ipilimumab Market Size
6.14.1. Cancer Biologics Market Outlook for Ipilimumab: Recovery Scenarios (V, U, L, W)
7. Global Cancer Biologics Market Analysis and Forecast 2021-2031, by End User
7.1. Hospitals Market Size
7.1.1. Cancer Biologics Market Outlook for Hospitals: Recovery Scenarios (V, U, L, W)
7.2. Specialty Clinics Market Size
7.2.1. Cancer Biologics Market Outlook for Specialty Clinics: Recovery Scenarios (V, U, L, W)
7.3. Cancer and Radiation Therapy Centers Market Size
7.3.1. How is the Cancer Research Institute Involved in the Development of Immunotherapy?
7.3.2. Cancer Biologics Market Outlook for Cancer and Radiation Therapy Centers: Recovery Scenarios (V, U, L, W)
8. Europe Cancer Biologics Market Analysis and Forecast, 2021-2031
8.1. Europe Cancer Biologics Market Size
8.1.1. Europe Cancer Biologics Market Outlook: Recovery Scenarios (V, U, L, W)
8.2. UK Cancer Biologics Market Size
8.3. Germany Cancer Biologics Market Size
8.4. France Cancer Biologics Market Size
8.5. Italy Cancer Biologics Market Size
8.6. Spain Cancer Biologics Market Size
8.7. Portugal Cancer Biologics Market Size
8.8. Poland Cancer Biologics Market Size
8.9. Hungary Cancer Biologics Market Size
8.10. Czech Republic Cancer Biologics Market Size
8.11. Slovakia Cancer Biologics Market Size
8.12. Slovenia Cancer Biologics Market Size
8.13. Romania Cancer Biologics Market Size
8.14. Bulgaria Cancer Biologics Market Size
8.15. Croatia Cancer Biologics Market Size
8.16. Baltic States Cancer Biologics Market Size
8.17. Serbia Cancer Biologics Market Size
8.18. Rest of Europe Cancer Biologics Market Size
9. Company Profiles
9.1. AbbVie Inc.
9.1.1. AbbVie Inc. Snapshot
9.1.2. Company Overview
9.1.3. Product Offerings
9.1.4. AbbVie Inc.: Recent Initiatives, 2017 – 2020
9.1.5. Financial Performance (2015 – 2019)
9.1.5.1. Net Revenue (2015 – 2019)
9.1.5.2. Gross Profit (2015 – 2019)
9.1.5.3. Geographical Revenue, 2019
9.2. F.Hoffman La Roche
9.2.1. F.Hoffman La Roche Snapshot
9.2.2. Company Overview
9.2.3. Product Offerings
9.2.4. F.Hoffman La Roche: Recent Initiatives, 2017 – 2020
9.2.5. Financial Performance (2015 – 2019)
9.2.5.1. Net Revenue (2015 – 2019)
9.2.5.2. Gross Profit (2015 – 2019)
9.2.5.3. Geographical Revenue, 2019
9.3. GlaxoSmithKline
9.3.1. GlaxoSmithKline Snapshot
9.3.2. Company Overview
9.3.3. Product Offerings
9.3.4. GlaxoSmithKline: Recent Initiatives, 2017 – 2020
9.3.5. Financial Performance (2015 – 2019)
9.3.5.1. Net Revenue (2015 – 2019)
9.3.5.2. Gross Profit (2015 – 2019)
9.3.5.3. Geographical Revenue, 2019
9.4. Eli Lilly and Company
9.4.1. Eli Lilly and Company Snapshot
9.4.2. Company Overview
9.4.3. Product Offerings
9.4.4. Eli Lilly and Company: Recent Initiatives, 2017 – 2020
9.4.5. Financial Performance (2015 – 2019)
9.4.5.1. Net Revenue (2015 – 2019)
9.4.5.2. Gross Profit (2015 – 2019)
9.4.5.3. Geographical Revenue, 2019
9.5. Amgen
9.5.1. Amgen Snapshot
9.5.2. Company Overview
9.5.3. Product Offerings
9.5.4. Amgen: Recent Initiatives, 2017 – 2020
9.5.5. Financial Performance (2015 – 2019)
9.5.5.1. Net Revenue (2015 – 2019)
9.5.5.2. Gross Profit (2015 – 2019)
9.5.5.3. Geographical Revenue, 2019
9.6. Johnson & Johnson
9.6.1. Johnson & Johnson Snapshot
9.6.2. Company Overview
9.6.3. Product Offerings
9.6.4. Johnson & Johnson: Recent Initiatives, 2017 – 2020
9.6.5. Financial Performance (2015 – 2019)
9.6.5.1. Net Revenue (2015 – 2019)
9.6.5.2. Gross Profit (2015 – 2019)
9.6.5.3. Geographical Revenue, 2019
9.7. Merck & Co.
9.7.1. Merck & Co. Snapshot
9.7.2. Company Overview
9.7.3. Product Offerings
9.7.4. Merck & Co.: Recent Initiatives, 2017 – 2020
9.7.5. Financial Performance (2015 – 2019)
9.7.5.1. Net Revenue (2015 – 2019)
9.7.5.2. Gross Profit (2015 – 2019)
9.7.5.3. Geographical Revenue, 2019
9.8. Pfizer
9.8.1. Pfizer Snapshot
9.8.2. Company Overview
9.8.3. Product Offerings
9.8.4. Pfizer: Recent Initiatives, 2017 – 2020
9.8.5. Financial Performance (2015 – 2019)
9.8.5.1. Net Revenue (2015 – 2019)
9.8.5.2. Gross Profit (2015 – 2019)
9.8.5.3. Geographical Revenue, 2019
9.9. Other Notable Players
9.10. List of Companies Mentioned in this Report
10. Conclusion
10.1. Concluding Remarks
11. Glossary
List of Figures
Figure 1 Cancer Biologics: Market Segmentation and Scope
Figure 2 Global Oncology Spending Market Value Forecast, 2016 – 2031 (USD Billion)
Figure 3 Global Oncology Spending Market Share by Region, 2020 (%)
Figure 4 Global Cancer Biologics Market Share by Region, 2020 (%)
Figure 5 Worldwide Cancer Death by Age, 2019 (%)
Figure 6 Share of population with Cancer, 2019 (%)
Figure 7 Ageing Population Estimates 2010 - 2050
Figure 8 Research & Development Spending as a Percent of Revenue by Biopharmaceutical Companies, 2019 (%)
Figure 9 Cancer Biologics Industry: Porter’s Five Forces Model
Figure 10 Germany: Estimated Incidence by Cancer, 2020 (%)
Figure 11 Germany: Estimated Mortality by Cancer, 2020 (%)
Figure 12 UK: Estimated Incidence by Cancer, 2020 (%)
Figure 13 UK: Estimated Mortality by Cancer, 2020 (%)
Figure 14 France: Estimated Incidence by Cancer, 2020 (%)
Figure 15 France: Estimated Mortality by Cancer, 2020 (%)
Figure 16 Italy: Estimated Incidence by Cancer, 2020 (%)
Figure 17 Italy: Estimated Mortality by Cancer, 2020 (%)
Figure 18 Spain: Estimated Incidence by Cancer, 2020 (%)
Figure 19 Spain: Estimated Mortality by Cancer, 2020 (%)
Figure 20 Portugal: Estimated Incidence by Cancer, 2020 (%)
Figure 21 Portugal: Estimated Mortality by Cancer, 2020 (%)
Figure 22 Poland: Estimated Incidence by Cancer, 2020 (%)
Figure 23 Poland: Estimated Mortality by Cancer, 2020 (%)
Figure 24 Hungary: Estimated Incidence by Cancer, 2020 (%)
Figure 25 Hungary: Estimated Mortality by Cancer, 2020 (%)
Figure 26 Czech Republic: Estimated Incidence by Cancer, 2020 (%)
Figure 27 Czech Republic: Estimated Mortality by Cancer, 2020 (%)
Figure 28 Slovakia: Estimated Incidence by Cancer, 2020 (%)
Figure 29 Slovakia: Estimated Mortality by Cancer, 2020 (%)
Figure 30 Slovenia: Estimated Incidence by Cancer, 2020 (%)
Figure 31 Slovenia: Estimated Mortality by Cancer, 2020 (%)
Figure 32 Romania: Estimated Incidence by Cancer, 2020 (%)
Figure 33 Romania: Estimated Mortality by Cancer, 2020 (%)
Figure 34 Bulgaria: Estimated Incidence by Cancer, 2020 (%)
Figure 35 Bulgaria: Estimated Mortality by Cancer, 2020 (%)
Figure 36 Croatia: Estimated Incidence by Cancer, 2020 (%)
Figure 37 Croatia: Estimated Mortality by Cancer, 2020 (%)
Figure 38 Serbia: Estimated Incidence by Cancer, 2020 (%)
Figure 39 Serbia: Estimated Mortality by Cancer, 2020 (%)
Figure 40 Cancer Biologics for Chemotherapy Market Value Forecast, 2021 – 2031 (USD Billion, AGR %)
Figure 41 Cancer Biologics for Chemotherapy Market Value Forecast, 2021 – 2031 (USD Billion, AGR %): V Shaped Recovery
Figure 42 Cancer Biologics for Chemotherapy Market Value Forecast, 2021 – 2031 (USD Billion, AGR %): U Shaped Recovery
Figure 43 Cancer Biologics for Chemotherapy Market Value Forecast, 2021 – 2031 (USD Billion, AGR %): L Shaped Recovery
Figure 44 Cancer Biologics for Chemotherapy Market Value Forecast, 2021 – 2031 (USD Billion, AGR %): W Shaped Recovery
Figure 45 Cancer Biologics for Targeted Therapy Market Value Forecast, 2021 – 2031 (USD Billion, AGR %)
Figure 46 Cancer Biologics for Targeted Therapy Market Value Forecast, 2021 – 2031 (USD Billion, AGR %): V Shaped Recovery
Figure 47 Cancer Biologics for Targeted Therapy Market Value Forecast, 2021 – 2031 (USD Billion, AGR %): U Shaped Recovery
Figure 48 Cancer Biologics for Targeted Therapy Market Value Forecast, 2021 – 2031 (USD Billion, AGR %): L Shaped Recovery
Figure 49 Cancer Biologics for Targeted Therapy Market Value Forecast, 2021 – 2031 (USD Billion, AGR %): W Shaped Recovery
Figure 50 Cancer Biologics for Immunotherapy Market Value Forecast, 2021 – 2031 (USD Billion, AGR %)
Figure 51 Cancer Biologics for Immunotherapy Market Value Forecast, 2021 – 2031 (USD Billion, AGR %): V Shaped Recovery
Figure 52 Cancer Biologics for Immunotherapy Market Value Forecast, 2021 – 2031 (USD Billion, AGR %): U Shaped Recovery
Figure 53 Cancer Biologics for Immunotherapy Market Value Forecast, 2021 – 2031 (USD Billion, AGR %): L Shaped Recovery
Figure 54 Cancer Biologics for Immunotherapy Market Value Forecast, 2021 – 2031 (USD Billion, AGR %): W Shaped Recovery
Figure 55 Cancer Biologics for Hormonal Therapy Market Value Forecast, 2021 – 2031 (USD Billion, AGR %)
Figure 56 Cancer Biologics for Hormonal Therapy Market Value Forecast, 2021 – 2031 (USD Billion, AGR %): V Shaped Recovery
Figure 57 Cancer Biologics for Hormonal Therapy Market Value Forecast, 2021 – 2031 (USD Billion, AGR %): U Shaped Recovery
Figure 58 Cancer Biologics for Hormonal Therapy Market Value Forecast, 2021 – 2031 (USD Billion, AGR %): L Shaped Recovery
Figure 59 Cancer Biologics for Hormonal Therapy Market Value Forecast, 2021 – 2031 (USD Billion, AGR %): W Shaped Recovery
Figure 60 Cancer Biologics for Other Treatments Market Value Forecast, 2021 – 2031 (USD Billion, AGR %)
Figure 61 Cancer Biologics for Other Treatments Market Value Forecast, 2021 – 2031 (USD Billion, AGR %): V Shaped Recovery
Figure 62 Cancer Biologics for Other Treatments Market Value Forecast, 2021 – 2031 (USD Billion, AGR %): U Shaped Recovery
Figure 63 Cancer Biologics for Other Treatments Market Value Forecast, 2021 – 2031 (USD Billion, AGR %): L Shaped Recovery
Figure 64 Cancer Biologics for Other Treatments Market Value Forecast, 2021 – 2031 (USD Billion, AGR %): W Shaped Recovery
Figure 65 Cancer Biologics for Breast Cancer Market Value Forecast, 2021 – 2031 (USD Billion, AGR %)
Figure 66 Cancer Biologics for Breast Cancer Market Value Forecast, 2021 – 2031 (USD Billion, AGR %): V Shaped Recovery
Figure 67 Cancer Biologics for Breast Cancer Market Value Forecast, 2021 – 2031 (USD Billion, AGR %): U Shaped Recovery
Figure 68 Cancer Biologics for Breast Cancer Market Value Forecast, 2021 – 2031 (USD Billion, AGR %): L Shaped Recovery
Figure 69 Cancer Biologics for Breast Cancer Market Value Forecast, 2021 – 2031 (USD Billion, AGR %): W Shaped Recovery
Figure 70 Cancer Biologics for Cervical Cancer Market Value Forecast, 2021 – 2031 (USD Billion, AGR %)
Figure 71 Cancer Biologics for Cervical Cancer Market Value Forecast, 2021 – 2031 (USD Billion, AGR %): V Shaped Recovery
Figure 72 Cancer Biologics for Cervical Cancer Market Value Forecast, 2021 – 2031 (USD Billion, AGR %): U Shaped Recovery
Figure 73 Cancer Biologics for Cervical Cancer Market Value Forecast, 2021 – 2031 (USD Billion, AGR %): L Shaped Recovery
Figure 74 Cancer Biologics for Cervical Cancer Market Value Forecast, 2021 – 2031 (USD Billion, AGR %): W Shaped Recovery
Figure 75 Cancer Biologics for Colon and Rectal Cancer Market Value Forecast, 2021 – 2031 (USD Billion, AGR %)
Figure 76 Cancer Biologics for Colon and Rectal Cancer Market Value Forecast, 2021 – 2031 (USD Billion, AGR %): V Shaped Recovery
Figure 77 Cancer Biologics for Colon and Rectal Cancer Market Value Forecast, 2021 – 2031 (USD Billion, AGR %): U Shaped Recovery
Figure 78 Cancer Biologics for Colon and Rectal Cancer Market Value Forecast, 2021 – 2031 (USD Billion, AGR %): L Shaped Recovery
Figure 79 Cancer Biologics for Colon and Rectal Cancer Market Value Forecast, 2021 – 2031 (USD Billion, AGR %): W Shaped Recovery
Figure 80 Cancer Biologics for Gastric Cancer Market Value Forecast, 2021 – 2031 (USD Billion, AGR %)
Figure 81 Cancer Biologics for Gastric Cancer Market Value Forecast, 2021 – 2031 (USD Billion, AGR %): V Shaped Recovery
Figure 82 Cancer Biologics for Gastric Cancer Market Value Forecast, 2021 – 2031 (USD Billion, AGR %): U Shaped Recovery
Figure 83 Cancer Biologics for Gastric Cancer Market Value Forecast, 2021 – 2031 (USD Billion, AGR %): L Shaped Recovery
Figure 84 Cancer Biologics for Gastric Cancer Market Value Forecast, 2021 – 2031 (USD Billion, AGR %): W Shaped Recovery
Figure 85 Cancer Biologics for Lung Cancer Market Value Forecast, 2021 – 2031 (USD Billion, AGR %)
Figure 86 Cancer Biologics for Lung Cancer Market Value Forecast, 2021 – 2031 (USD Billion, AGR %): V Shaped Recovery
Figure 87 Cancer Biologics for Lung Cancer Market Value Forecast, 2021 – 2031 (USD Billion, AGR %): U Shaped Recovery
Figure 88 Cancer Biologics for Lung Cancer Market Value Forecast, 2021 – 2031 (USD Billion, AGR %): L Shaped Recovery
Figure 89 Cancer Biologics for Lung Cancer Market Value Forecast, 2021 – 2031 (USD Billion, AGR %): W Shaped Recovery
Figure 90 Cancer Biologics for Ovarian Cancer Market Value Forecast, 2021 – 2031 (USD Billion, AGR %)
Figure 91 Cancer Biologics for Ovarian Cancer Market Value Forecast, 2021 – 2031 (USD Billion, AGR %): V Shaped Recovery
Figure 92 Cancer Biologics for Ovarian Cancer Market Value Forecast, 2021 – 2031 (USD Billion, AGR %): U Shaped Recovery
Figure 93 Cancer Biologics for Ovarian Cancer Market Value Forecast, 2021 – 2031 (USD Billion, AGR %): L Shaped Recovery
Figure 94 Cancer Biologics for Ovarian Cancer Market Value Forecast, 2021 – 2031 (USD Billion, AGR %): W Shaped Recovery
Figure 95 Cancer Biologics for Renal Cell Cancer Market Value Forecast, 2021 – 2031 (USD Billion, AGR %)
Figure 96 Cancer Biologics for Renal Cell Cancer Market Value Forecast, 2021 – 2031 (USD Billion, AGR %): V Shaped Recovery
Figure 97 Cancer Biologics for Renal Cell Cancer Market Value Forecast, 2021 – 2031 (USD Billion, AGR %): U Shaped Recovery
Figure 98 Cancer Biologics for Renal Cell Cancer Market Value Forecast, 2021 – 2031 (USD Billion, AGR %): L Shaped Recovery
Figure 99 Cancer Biologics for Renal Cell Cancer Market Value Forecast, 2021 – 2031 (USD Billion, AGR %): W Shaped Recovery
Figure 100 Cancer Biologics for Melanoma Market Value Forecast, 2021 – 2031 (USD Billion, AGR %)
Figure 101 Cancer Biologics for Melanoma Market Value Forecast, 2021 – 2031 (USD Billion, AGR %): V Shaped Recovery
Figure 102 Cancer Biologics for Melanoma Market Value Forecast, 2021 – 2031 (USD Billion, AGR %): U Shaped Recovery
Figure 103 Cancer Biologics for Melanoma Market Value Forecast, 2021 – 2031 (USD Billion, AGR %): L Shaped Recovery
Figure 104 Cancer Biologics for Melanoma Market Value Forecast, 2021 – 2031 (USD Billion, AGR %): W Shaped Recovery
Figure 105 Cancer Biologics for Other Indications Market Value Forecast, 2021 – 2031 (USD Billion, AGR %)
Figure 106 Cancer Biologics for Other Indications Market Value Forecast, 2021 – 2031 (USD Billion, AGR %): V Shaped Recovery
Figure 107 Cancer Biologics for Other Indications Market Value Forecast, 2021 – 2031 (USD Billion, AGR %): U Shaped Recovery
Figure 108 Cancer Biologics for Other Indications Market Value Forecast, 2021 – 2031 (USD Billion, AGR %): L Shaped Recovery
Figure 109 Cancer Biologics for Other Indications Market Value Forecast, 2021 – 2031 (USD Billion, AGR %): W Shaped Recovery
Figure 110 Cancer Biologics for Bevacizumab Market Value Forecast, 2021 – 2031 (USD Billion, AGR %)
Figure 111 Cancer Biologics for Bevacizumab Market Value Forecast, 2021 – 2031 (USD Billion, AGR %): V Shaped Recovery
Figure 112 Cancer Biologics for Bevacizumab Market Value Forecast, 2021 – 2031 (USD Billion, AGR %): U Shaped Recovery
Figure 113 Cancer Biologics for Bevacizumab Market Value Forecast, 2021 – 2031 (USD Billion, AGR %): L Shaped Recovery
Figure 114 Cancer Biologics for Bevacizumab Market Value Forecast, 2021 – 2031 (USD Billion, AGR %): W Shaped Recovery
Figure 115 Cancer Biologics for Trastuzumab Market Value Forecast, 2021 – 2031 (USD Billion, AGR %)
Figure 116 Cancer Biologics for Trastuzumab Market Value Forecast, 2021 – 2031 (USD Billion, AGR %): V Shaped Recovery
Figure 117 Cancer Biologics for Trastuzumab Market Value Forecast, 2021 – 2031 (USD Billion, AGR %): U Shaped Recovery
Figure 118 Cancer Biologics for Trastuzumab Market Value Forecast, 2021 – 2031 (USD Billion, AGR %): L Shaped Recovery
Figure 119 Cancer Biologics for Trastuzumab Market Value Forecast, 2021 – 2031 (USD Billion, AGR %): W Shaped Recovery
Figure 120 Cancer Biologics for Trastuzumab emtansine Market Value Forecast, 2021 – 2031 (USD Billion, AGR %)
Figure 121 Cancer Biologics for Trastuzumab emtansine Market Value Forecast, 2021 – 2031 (USD Billion, AGR %): V Shaped Recovery
Figure 122 Cancer Biologics for Trastuzumab emtansine Market Value Forecast, 2021 – 2031 (USD Billion, AGR %): U Shaped Recovery
Figure 123 Cancer Biologics for Trastuzumab emtansine Market Value Forecast, 2021 – 2031 (USD Billion, AGR %): L Shaped Recovery
Figure 124 Cancer Biologics for Trastuzumab emtansine Market Value Forecast, 2021 – 2031 (USD Billion, AGR %): W Shaped Recovery
Figure 125 Cancer Biologics for Pertuzumab Market Value Forecast, 2021 – 2031 (USD Billion, AGR %)
Figure 126 Cancer Biologics for Pertuzumab Market Value Forecast, 2021 – 2031 (USD Billion, AGR %): V Shaped Recovery
Figure 127 Cancer Biologics for Pertuzumab Market Value Forecast, 2021 – 2031 (USD Billion, AGR %): U Shaped Recovery
Figure 128 Cancer Biologics for Pertuzumab Market Value Forecast, 2021 – 2031 (USD Billion, AGR %): L Shaped Recovery
Figure 129 Cancer Biologics for Pertuzumab Market Value Forecast, 2021 – 2031 (USD Billion, AGR %): W Shaped Recovery
Figure 130 Cancer Biologics for Rituximab Market Value Forecast, 2021 – 2031 (USD Billion, AGR %)
Figure 131 Cancer Biologics for Rituximab Market Value Forecast, 2021 – 2031 (USD Billion, AGR %): V Shaped Recovery
Figure 132 Cancer Biologics for Rituximab Market Value Forecast, 2021 – 2031 (USD Billion, AGR %): U Shaped Recovery
Figure 133 Cancer Biologics for Rituximab Market Value Forecast, 2021 – 2031 (USD Billion, AGR %): L Shaped Recovery
Figure 134 Cancer Biologics for Rituximab Market Value Forecast, 2021 – 2031 (USD Billion, AGR %): W Shaped Recovery
Figure 135 Cancer Biologics for Cetuximab Market Value Forecast, 2021 – 2031 (USD Billion, AGR %)
Figure 136 Cancer Biologics for Cetuximab Market Value Forecast, 2021 – 2031 (USD Billion, AGR %): V Shaped Recovery
Figure 137 Cancer Biologics for Cetuximab Market Value Forecast, 2021 – 2031 (USD Billion, AGR %): U Shaped Recovery
Figure 138 Cancer Biologics for Cetuximab Market Value Forecast, 2021 – 2031 (USD Billion, AGR %): L Shaped Recovery
Figure 139 Cancer Biologics for Cetuximab Market Value Forecast, 2021 – 2031 (USD Billion, AGR %): W Shaped Recovery
Figure 140 Cancer Biologics for Panitumumab Market Value Forecast, 2021 – 2031 (USD Billion, AGR %)
Figure 141 Cancer Biologics for Panitumumab Market Value Forecast, 2021 – 2031 (USD Billion, AGR %): V Shaped Recovery
Figure 142 Cancer Biologics for Panitumumab Market Value Forecast, 2021 – 2031 (USD Billion, AGR %): U Shaped Recovery
Figure 143 Cancer Biologics for Panitumumab Market Value Forecast, 2021 – 2031 (USD Billion, AGR %): L Shaped Recovery
Figure 144 Cancer Biologics for Panitumumab Market Value Forecast, 2021 – 2031 (USD Billion, AGR %): W Shaped Recovery
Figure 145 Cancer Biologics for Ramucirumab Market Value Forecast, 2021 – 2031 (USD Billion, AGR %)
Figure 146 Cancer Biologics for Ramucirumab Market Value Forecast, 2021 – 2031 (USD Billion, AGR %): V Shaped Recovery
Figure 147 Cancer Biologics for Ramucirumab Market Value Forecast, 2021 – 2031 (USD Billion, AGR %): U Shaped Recovery
Figure 148 Cancer Biologics for Ramucirumab Market Value Forecast, 2021 – 2031 (USD Billion, AGR %): L Shaped Recovery
Figure 149 Cancer Biologics for Ramucirumab Market Value Forecast, 2021 – 2031 (USD Billion, AGR %): W Shaped Recovery
Figure 150 Cancer Biologics for Necitumumab Market Value Forecast, 2021 – 2031 (USD Billion, AGR %)
Figure 151 Cancer Biologics for Necitumumab Market Value Forecast, 2021 – 2031 (USD Billion, AGR %): V Shaped Recovery
Figure 152 Cancer Biologics for Necitumumab Market Value Forecast, 2021 – 2031 (USD Billion, AGR %): U Shaped Recovery
Figure 153 Cancer Biologics for Necitumumab Market Value Forecast, 2021 – 2031 (USD Billion, AGR %): L Shaped Recovery
Figure 154 Cancer Biologics for Necitumumab Market Value Forecast, 2021 – 2031 (USD Billion, AGR %): W Shaped Recovery
Figure 155 Cancer Biologics for Pembrolizumab Market Value Forecast, 2021 – 2031 (USD Billion, AGR %)
Figure 156 Cancer Biologics for Pembrolizumab Market Value Forecast, 2021 – 2031 (USD Billion, AGR %): V Shaped Recovery
Figure 157 Cancer Biologics for Pembrolizumab Market Value Forecast, 2021 – 2031 (USD Billion, AGR %): U Shaped Recovery
Figure 158 Cancer Biologics for Pembrolizumab Market Value Forecast, 2021 – 2031 (USD Billion, AGR %): L Shaped Recovery
Figure 159 Cancer Biologics for Pembrolizumab Market Value Forecast, 2021 – 2031 (USD Billion, AGR %): W Shaped Recovery
Figure 160 Cancer Biologics for Atezolizumab Market Value Forecast, 2021 – 2031 (USD Billion, AGR %)
Figure 161 Cancer Biologics for Atezolizumab Market Value Forecast, 2021 – 2031 (USD Billion, AGR %): V Shaped Recovery
Figure 162 Cancer Biologics for Atezolizumab Market Value Forecast, 2021 – 2031 (USD Billion, AGR %): U Shaped Recovery
Figure 163 Cancer Biologics for Atezolizumab Market Value Forecast, 2021 – 2031 (USD Billion, AGR %): L Shaped Recovery
Figure 164 Cancer Biologics for Atezolizumab Market Value Forecast, 2021 – 2031 (USD Billion, AGR %): W Shaped Recovery
Figure 165 Cancer Biologics for Durvalumab Market Value Forecast, 2021 – 2031 (USD Billion, AGR %)
Figure 166 Cancer Biologics for Durvalumab Market Value Forecast, 2021 – 2031 (USD Billion, AGR %): V Shaped Recovery
Figure 167 Cancer Biologics for Durvalumab Market Value Forecast, 2021 – 2031 (USD Billion, AGR %): U Shaped Recovery
Figure 168 Cancer Biologics for Durvalumab Market Value Forecast, 2021 – 2031 (USD Billion, AGR %): L Shaped Recovery
Figure 169 Cancer Biologics for Durvalumab Market Value Forecast, 2021 – 2031 (USD Billion, AGR %): W Shaped Recovery
Figure 170 Cancer Biologics for Nivolumab Market Value Forecast, 2021 – 2031 (USD Billion, AGR %)
Figure 171 Cancer Biologics for Nivolumab Market Value Forecast, 2021 – 2031 (USD Billion, AGR %): V Shaped Recovery
Figure 172 Cancer Biologics for Nivolumab Market Value Forecast, 2021 – 2031 (USD Billion, AGR %): U Shaped Recovery
Figure 173 Cancer Biologics for Nivolumab Market Value Forecast, 2021 – 2031 (USD Billion, AGR %): L Shaped Recovery
Figure 174 Cancer Biologics for Nivolumab Market Value Forecast, 2021 – 2031 (USD Billion, AGR %): W Shaped Recovery
Figure 175 Cancer Biologics for Ipilimumab Market Value Forecast, 2021 – 2031 (USD Billion, AGR %)
Figure 176 Cancer Biologics for Ipilimumab Market Value Forecast, 2021 – 2031 (USD Billion, AGR %): V Shaped Recovery
Figure 177 Cancer Biologics for Ipilimumab Market Value Forecast, 2021 – 2031 (USD Billion, AGR %): U Shaped Recovery
Figure 178 Cancer Biologics for Ipilimumab Market Value Forecast, 2021 – 2031 (USD Billion, AGR %): L Shaped Recovery
Figure 179 Cancer Biologics for Ipilimumab Market Value Forecast, 2021 – 2031 (USD Billion, AGR %): W Shaped Recovery
Figure 180 Cancer Biologics for Hospitals Market Value Forecast, 2021 – 2031 (USD Billion, AGR %)
Figure 181 Cancer Biologics for Hospitals Market Value Forecast, 2021 – 2031 (USD Billion, AGR %): V Shaped Recovery
Figure 182 Cancer Biologics for Hospitals Market Value Forecast, 2021 – 2031 (USD Billion, AGR %): U Shaped Recovery
Figure 183 Cancer Biologics for Hospitals Market Value Forecast, 2021 – 2031 (USD Billion, AGR %): L Shaped Recovery
Figure 184 Cancer Biologics for Hospitals Market Value Forecast, 2021 – 2031 (USD Billion, AGR %): W Shaped Recovery
Figure 185 Cancer Biologics for Specialty Clinics Market Value Forecast, 2021 – 2031 (USD Billion, AGR %)
Figure 186 Cancer Biologics for Specialty Clinics Market Value Forecast, 2021 – 2031 (USD Billion, AGR %): V Shaped Recovery
Figure 187 Cancer Biologics for Specialty Clinics Market Value Forecast, 2021 – 2031 (USD Billion, AGR %): U Shaped Recovery
Figure 188 Cancer Biologics for Specialty Clinics Market Value Forecast, 2021 – 2031 (USD Billion, AGR %): L Shaped Recovery
Figure 189 Cancer Biologics for Specialty Clinics Market Value Forecast, 2021 – 2031 (USD Billion, AGR %): W Shaped Recovery
Figure 190 Cancer Biologics for Cancer and Radiation Therapy Centers Market Value Forecast, 2021 – 2031 (USD Billion, AGR %)
Figure 191 Cancer Biologics for Cancer and Radiation Therapy Centers Market Value Forecast, 2021 – 2031 (USD Billion, AGR %): V Shaped Recovery
Figure 192 Cancer Biologics for Cancer and Radiation Therapy Centers Market Value Forecast, 2021 – 2031 (USD Billion, AGR %): U Shaped Recovery
Figure 193 Cancer Biologics for Cancer and Radiation Therapy Centers Market Value Forecast, 2021 – 2031 (USD Billion, AGR %): L Shaped Recovery
Figure 194 Cancer Biologics for Cancer and Radiation Therapy Centers Market Value Forecast, 2021 – 2031 (USD Billion, AGR %): W Shaped Recovery
Figure 195 Europe Cancer Biologics Market Value Forecast, 2021 – 2031 (USD Billion, AGR %)
Figure 196 Europe Cancer Biologics Market Value Forecast, 2021 – 2031 (USD Billion, AGR %): V Shaped Recovery
Figure 197 Europe Cancer Biologics Market Value Forecast, 2021 – 2031 (USD Billion, AGR %): U Shaped Recovery
Figure 198 Europe Cancer Biologics Market Value Forecast, 2021 – 2031 (USD Billion, AGR %): L Shaped Recovery
Figure 199 Europe Cancer Biologics Market Value Forecast, 2021 – 2031 (USD Billion, AGR %): W Shaped Recovery
Figure 200 UK Cancer Biologics Market Value Forecast, 2021 – 2031 (USD Billion, AGR %)
Figure 201 Germany Cancer Biologics Market Value Forecast, 2021 – 2031 (USD Billion, AGR %)
Figure 202 France Cancer Biologics Market Value Forecast, 2021 – 2031 (USD Billion, AGR %)
Figure 203 Italy Cancer Biologics Market Value Forecast, 2021 – 2031 (USD Billion, AGR %)
Figure 204 Spain Cancer Biologics Market Value Forecast, 2021 – 2031 (USD Billion, AGR %)
Figure 205 Portugal Cancer Biologics Market Value Forecast, 2021 – 2031 (USD Billion, AGR %)
Figure 206 Poland Cancer Biologics Market Value Forecast, 2021 – 2031 (USD Billion, AGR %)
Figure 207 Hungary Cancer Biologics Market Value Forecast, 2021 – 2031 (USD Billion, AGR %)
Figure 208 Czech Republic Cancer Biologics Market Value Forecast, 2021 – 2031 (USD Billion, AGR %)
Figure 209 Slovakia Cancer Biologics Market Value Forecast, 2021 – 2031 (USD Billion, AGR %)
Figure 210 Slovenia Cancer Biologics Market Value Forecast, 2021 – 2031 (USD Billion, AGR %)
Figure 211 Romania Cancer Biologics Market Value Forecast, 2021 – 2031 (USD Billion, AGR %)
Figure 212 Bulgaria Cancer Biologics Market Value Forecast, 2021 – 2031 (USD Billion, AGR %)
Figure 213 Croatia Cancer Biologics Market Value Forecast, 2021 – 2031 (USD Billion, AGR %)
Figure 214 Baltic States Cancer Biologics Market Value Forecast, 2021 – 2031 (USD Billion, AGR %)
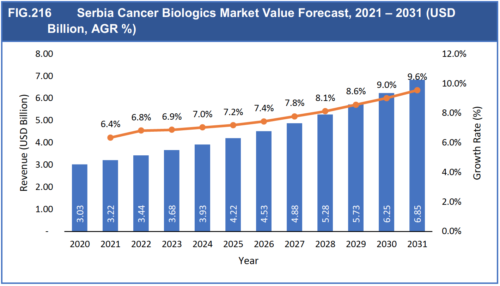
Figure 215 Serbia Cancer Biologics Market Value Forecast, 2021 – 2031 (USD Billion, AGR %)
Figure 216 Serbia Cancer Biologics Market Value Forecast, 2021 – 2031 (USD Billion, AGR %)
Figure 217 AbbVie Inc.: Net Revenue 2015 – 2019, (USD Million, AGR %)
Figure 218 AbbVie Inc.: Gross Profit 2015 – 2019, (USD Million, AGR %)
Figure 219 AbbVie Inc.: Geographical Revenue, 2019 (USD Million)
Figure 220 F.Hoffman La Roche: Net Revenue 2015 – 2019, (USD Million, AGR %)
Figure 221 F.Hoffman La Roche: Gross Profit 2015 – 2019, (USD Million, AGR %)
Figure 222 F.Hoffman La Roche: Geographical Revenue, 2019 (USD Million)
Figure 223 GlaxoSmithKline: Net Revenue 2015 – 2019, (USD Million, AGR %)
Figure 224 GlaxoSmithKline: Gross Profit 2015 – 2019, (USD Million, AGR %)
Figure 225 GlaxoSmithKline: Geographical Revenue, 2019 (USD Million)
Figure 226 Eli Lilly and Company: Net Revenue 2015 – 2019, (USD Million, AGR %)
Figure 227 Eli Lilly and Company: Gross Profit 2015 – 2019, (USD Million, AGR %)
Figure 228 Eli Lilly and Company: Geographical Revenue, 2019 (USD Million)
Figure 229 Amgen: Net Revenue 2015 – 2019, (USD Million, AGR %)
Figure 230 Amgen: Gross Profit 2015 – 2019, (USD Million, AGR %)
Figure 231 Amgen: Geographical Revenue, 2019 (USD Million)
Figure 232 Johnson & Johnson: Net Revenue 2015 – 2019, (USD Million, AGR %)
Figure 233 Johnson & Johnson: Gross Profit 2015 – 2019, (USD Million, AGR %)
Figure 234 Johnson & Johnson: Geographical Revenue, 2019 (USD Million)
Figure 235 Merck & Co.: Net Revenue 2015 – 2019, (USD Million, AGR %)
Figure 236 Merck & Co.: Gross Profit 2015 – 2019, (USD Million, AGR %)
Figure 237 Merck & Co.: Geographical Revenue, 2019 (USD Million)
Figure 238 Pfizer: Net Revenue 2015 – 2019, (USD Million, AGR %)
Figure 239 Pfizer: Gross Profit 2015 – 2019, (USD Million, AGR %)
Figure 240 Pfizer: Geographical Revenue, 2019 (USD Million)
List of Tables
Table 1 Cancer Biologics Market, 2021-2031 (USD Billion)
Table 2 Cancer Biologics Market: SWOT Analysis
Table 3 EMA Approved Biosimilars in Oncology
Table 4 FDA Approved Biosimilars in Oncology
Table 5 Cancer Biologics Market for Chemotherapy, 2021-2031 (USD Billion, AGR %, CAGR %)
Table 6 Cancer Biologics Market for Chemotherapy, 2021-2031 (USD Billion, AGR %, CAGR %): V Shaped Recovery
Table 7 Cancer Biologics Market for Chemotherapy, 2021-2031 (USD Billion, AGR %, CAGR %): U Shaped Recovery
Table 8 Cancer Biologics Market for Chemotherapy, 2021-2031 (USD Billion, AGR %, CAGR %): L Shaped Recovery
Table 9 Cancer Biologics Market for Chemotherapy, 2021-2031 (USD Billion, AGR %, CAGR %): W Shaped Recovery
Table 10 Cancer Biologics Market for Targeted Therapy, 2021-2031 (USD Billion, AGR %, CAGR %)
Table 11 Cancer Biologics Market for Targeted Therapy, 2021-2031 (USD Billion, AGR %, CAGR %): V Shaped Recovery
Table 12 Cancer Biologics Market for Targeted Therapy, 2021-2031 (USD Billion, AGR %, CAGR %): U Shaped Recovery
Table 13 Cancer Biologics Market for Targeted Therapy, 2021-2031 (USD Billion, AGR %, CAGR %): L Shaped Recovery
Table 14 Cancer Biologics Market for Targeted Therapy, 2021-2031 (USD Billion, AGR %, CAGR %): W Shaped Recovery
Table 15 US FDA-Approved Monoclonal Antibody on the Market
Table 16 Cancer Biologics Market for Immunotherapy, 2021-2031 (USD Billion, AGR %, CAGR %)
Table 17 Cancer Biologics Market for Immunotherapy, 2021-2031 (USD Billion, AGR %, CAGR %): V Shaped Recovery
Table 18 Cancer Biologics Market for Immunotherapy, 2021-2031 (USD Billion, AGR %, CAGR %): U Shaped Recovery
Table 19 Cancer Biologics Market for Immunotherapy, 2021-2031 (USD Billion, AGR %, CAGR %): L Shaped Recovery
Table 20 Cancer Biologics Market for Immunotherapy, 2021-2031 (USD Billion, AGR %, CAGR %): W Shaped Recovery
Table 21 Cancer Biologics Market for Hormonal Therapy, 2021-2031 (USD Billion, AGR %, CAGR %)
Table 22 Cancer Biologics Market for Hormonal Therapy, 2021-2031 (USD Billion, AGR %, CAGR %): V Shaped Recovery
Table 23 Cancer Biologics Market for Hormonal Therapy, 2021-2031 (USD Billion, AGR %, CAGR %): U Shaped Recovery
Table 24 Cancer Biologics Market for Hormonal Therapy, 2021-2031 (USD Billion, AGR %, CAGR %): L Shaped Recovery
Table 25 Cancer Biologics Market for Hormonal Therapy, 2021-2031 (USD Billion, AGR %, CAGR %): W Shaped Recovery
Table 26 Cancer Biologics Market for Other Treatments, 2021-2031 (USD Billion, AGR %, CAGR %)
Table 27 Cancer Biologics Market for Other Treatments, 2021-2031 (USD Billion, AGR %, CAGR %): V Shaped Recovery
Table 28 Cancer Biologics Market for Other Treatments, 2021-2031 (USD Billion, AGR %, CAGR %): U Shaped Recovery
Table 29 Cancer Biologics Market for Other Treatments, 2021-2031 (USD Billion, AGR %, CAGR %): L Shaped Recovery
Table 30 Cancer Biologics Market for Other Treatments, 2021-2031 (USD Billion, AGR %, CAGR %): W Shaped Recovery
Table 31 Cancer Biologics Market for Breast Cancer, 2021-2031 (USD Billion, AGR %, CAGR %)
Table 32 Cancer Biologics Market for Breast Cancer, 2021-2031 (USD Billion, AGR %, CAGR %): V Shaped Recovery
Table 33 Cancer Biologics Market for Breast Cancer, 2021-2031 (USD Billion, AGR %, CAGR %): U Shaped Recovery
Table 34 Cancer Biologics Market for Breast Cancer, 2021-2031 (USD Billion, AGR %, CAGR %): L Shaped Recovery
Table 35 Cancer Biologics Market for Breast Cancer, 2021-2031 (USD Billion, AGR %, CAGR %): W Shaped Recovery
Table 36 Cancer Biologics Market for Cervical Cancer, 2021-2031 (USD Billion, AGR %, CAGR %)
Table 37 Cancer Biologics Market for Cervical Cancer, 2021-2031 (USD Billion, AGR %, CAGR %): V Shaped Recovery
Table 38 Cancer Biologics Market for Cervical Cancer, 2021-2031 (USD Billion, AGR %, CAGR %): U Shaped Recovery
Table 39 Cancer Biologics Market for Cervical Cancer, 2021-2031 (USD Billion, AGR %, CAGR %): L Shaped Recovery
Table 40 Cancer Biologics Market for Cervical Cancer, 2021-2031 (USD Billion, AGR %, CAGR %): W Shaped Recovery
Table 41 Cancer Biologics Market for Colon and Rectal Cancer, 2021-2031 (USD Billion, AGR %, CAGR %)
Table 42 Cancer Biologics Market for Colon and Rectal Cancer, 2021-2031 (USD Billion, AGR %, CAGR %): V Shaped Recovery
Table 43 Cancer Biologics Market for Colon and Rectal Cancer, 2021-2031 (USD Billion, AGR %, CAGR %): U Shaped Recovery
Table 44 Cancer Biologics Market for Colon and Rectal Cancer, 2021-2031 (USD Billion, AGR %, CAGR %): L Shaped Recovery
Table 45 Cancer Biologics Market for Colon and Rectal Cancer, 2021-2031 (USD Billion, AGR %, CAGR %): W Shaped Recovery
Table 46 Cancer Biologics Market for Gastric Cancer, 2021-2031 (USD Billion, AGR %, CAGR %)
Table 47 Cancer Biologics Market for Gastric Cancer, 2021-2031 (USD Billion, AGR %, CAGR %): V Shaped Recovery
Table 48 Cancer Biologics Market for Gastric Cancer, 2021-2031 (USD Billion, AGR %, CAGR %): U Shaped Recovery
Table 49 Cancer Biologics Market for Gastric Cancer, 2021-2031 (USD Billion, AGR %, CAGR %): L Shaped Recovery
Table 50 Cancer Biologics Market for Gastric Cancer, 2021-2031 (USD Billion, AGR %, CAGR %): W Shaped Recovery
Table 51 Cancer Biologics Market for Lung Cancer, 2021-2031 (USD Billion, AGR %, CAGR %)
Table 52 Cancer Biologics Market for Lung Cancer, 2021-2031 (USD Billion, AGR %, CAGR %): V Shaped Recovery
Table 53 Cancer Biologics Market for Lung Cancer, 2021-2031 (USD Billion, AGR %, CAGR %): U Shaped Recovery
Table 54 Cancer Biologics Market for Lung Cancer, 2021-2031 (USD Billion, AGR %, CAGR %): L Shaped Recovery
Table 55 Cancer Biologics Market for Lung Cancer, 2021-2031 (USD Billion, AGR %, CAGR %): W Shaped Recovery
Table 56 Cancer Biologics Market for Ovarian Cancer, 2021-2031 (USD Billion, AGR %, CAGR %)
Table 57 Cancer Biologics Market for Ovarian Cancer, 2021-2031 (USD Billion, AGR %, CAGR %): V Shaped Recovery
Table 58 Cancer Biologics Market for Ovarian Cancer, 2021-2031 (USD Billion, AGR %, CAGR %): U Shaped Recovery
Table 59 Cancer Biologics Market for Ovarian Cancer, 2021-2031 (USD Billion, AGR %, CAGR %): L Shaped Recovery
Table 60 Cancer Biologics Market for Ovarian Cancer, 2021-2031 (USD Billion, AGR %, CAGR %): W Shaped Recovery
Table 61 Cancer Biologics Market for Renal Cell Cancer, 2021-2031 (USD Billion, AGR %, CAGR %)
Table 62 Cancer Biologics Market for Renal Cell Cancer, 2021-2031 (USD Billion, AGR %, CAGR %): V Shaped Recovery
Table 63 Cancer Biologics Market for Renal Cell Cancer, 2021-2031 (USD Billion, AGR %, CAGR %): U Shaped Recovery
Table 64 Cancer Biologics Market for Renal Cell Cancer, 2021-2031 (USD Billion, AGR %, CAGR %): L Shaped Recovery
Table 65 Cancer Biologics Market for Renal Cell Cancer, 2021-2031 (USD Billion, AGR %, CAGR %): W Shaped Recovery
Table 66 Cancer Biologics Market for Melanoma, 2021-2031 (USD Billion, AGR %, CAGR %)
Table 67 Cancer Biologics Market for Melanoma, 2021-2031 (USD Billion, AGR %, CAGR %): V Shaped Recovery
Table 68 Cancer Biologics Market for Melanoma, 2021-2031 (USD Billion, AGR %, CAGR %): U Shaped Recovery
Table 69 Cancer Biologics Market for Melanoma, 2021-2031 (USD Billion, AGR %, CAGR %): L Shaped Recovery
Table 70 Cancer Biologics Market for Melanoma, 2021-2031 (USD Billion, AGR %, CAGR %): W Shaped Recovery
Table 71 Cancer Biologics Market for Other Indications, 2021-2031 (USD Billion, AGR %, CAGR %)
Table 72 Cancer Biologics Market for Other Indications, 2021-2031 (USD Billion, AGR %, CAGR %): V Shaped Recovery
Table 73 Cancer Biologics Market for Other Indications, 2021-2031 (USD Billion, AGR %, CAGR %): U Shaped Recovery
Table 74 Cancer Biologics Market for Other Indications, 2021-2031 (USD Billion, AGR %, CAGR %): L Shaped Recovery
Table 75 Cancer Biologics Market for Other Indications, 2021-2031 (USD Billion, AGR %, CAGR %): W Shaped Recovery
Table 76 Cancer Biologics Market for Bevacizumab, 2021-2031 (USD Billion, AGR %, CAGR %)
Table 77 Cancer Biologics Market for Bevacizumab, 2021-2031 (USD Billion, AGR %, CAGR %): V Shaped Recovery
Table 78 Cancer Biologics Market for Bevacizumab, 2021-2031 (USD Billion, AGR %, CAGR %): U Shaped Recovery
Table 79 Cancer Biologics Market for Bevacizumab, 2021-2031 (USD Billion, AGR %, CAGR %): L Shaped Recovery
Table 80 Cancer Biologics Market for Bevacizumab, 2021-2031 (USD Billion, AGR %, CAGR %): W Shaped Recovery
Table 81 Cancer Biologics Market for Trastuzumab, 2021-2031 (USD Billion, AGR %, CAGR %)
Table 82 Cancer Biologics Market for Trastuzumab, 2021-2031 (USD Billion, AGR %, CAGR %): V Shaped Recovery
Table 83 Cancer Biologics Market for Trastuzumab, 2021-2031 (USD Billion, AGR %, CAGR %): U Shaped Recovery
Table 84 Cancer Biologics Market for Trastuzumab, 2021-2031 (USD Billion, AGR %, CAGR %): L Shaped Recovery
Table 85 Cancer Biologics Market for Trastuzumab, 2021-2031 (USD Billion, AGR %, CAGR %): W Shaped Recovery
Table 86 Cancer Biologics Market for Trastuzumab emtansine, 2021-2031 (USD Billion, AGR %, CAGR %)
Table 87 Cancer Biologics Market for Trastuzumab emtansine, 2021-2031 (USD Billion, AGR %, CAGR %): V Shaped Recovery
Table 88 Cancer Biologics Market for Trastuzumab emtansine, 2021-2031 (USD Billion, AGR %, CAGR %): U Shaped Recovery
Table 89 Cancer Biologics Market for Trastuzumab emtansine, 2021-2031 (USD Billion, AGR %, CAGR %): L Shaped Recovery
Table 90 Cancer Biologics Market for Trastuzumab emtansine, 2021-2031 (USD Billion, AGR %, CAGR %): W Shaped Recovery
Table 91 Cancer Biologics Market for Pertuzumab, 2021-2031 (USD Billion, AGR %, CAGR %)
Table 92 Cancer Biologics Market for Pertuzumab, 2021-2031 (USD Billion, AGR %, CAGR %): V Shaped Recovery
Table 93 Cancer Biologics Market for Pertuzumab, 2021-2031 (USD Billion, AGR %, CAGR %): U Shaped Recovery
Table 94 Cancer Biologics Market for Pertuzumab, 2021-2031 (USD Billion, AGR %, CAGR %): L Shaped Recovery
Table 95 Cancer Biologics Market for Pertuzumab, 2021-2031 (USD Billion, AGR %, CAGR %): W Shaped Recovery
Table 96 Cancer Biologics Market for Rituximab, 2021-2031 (USD Billion, AGR %, CAGR %)
Table 97 Cancer Biologics Market for Rituximab, 2021-2031 (USD Billion, AGR %, CAGR %): V Shaped Recovery
Table 98 Cancer Biologics Market for Rituximab, 2021-2031 (USD Billion, AGR %, CAGR %): U Shaped Recovery
Table 99 Cancer Biologics Market for Rituximab, 2021-2031 (USD Billion, AGR %, CAGR %): L Shaped Recovery
Table 100 Cancer Biologics Market for Rituximab, 2021-2031 (USD Billion, AGR %, CAGR %): W Shaped Recovery
Table 101 Cancer Biologics Market for Cetuximab, 2021-2031 (USD Billion, AGR %, CAGR %)
Table 102 Cancer Biologics Market for Cetuximab, 2021-2031 (USD Billion, AGR %, CAGR %): V Shaped Recovery
Table 103 Cancer Biologics Market for Cetuximab, 2021-2031 (USD Billion, AGR %, CAGR %): U Shaped Recovery
Table 104 Cancer Biologics Market for Cetuximab, 2021-2031 (USD Billion, AGR %, CAGR %): L Shaped Recovery
Table 105 Cancer Biologics Market for Cetuximab, 2021-2031 (USD Billion, AGR %, CAGR %): W Shaped Recovery
Table 106 Cancer Biologics Market for Panitumumab, 2021-2031 (USD Billion, AGR %, CAGR %)
Table 107 Cancer Biologics Market for Panitumumab, 2021-2031 (USD Billion, AGR %, CAGR %): V Shaped Recovery
Table 108 Cancer Biologics Market for Panitumumab, 2021-2031 (USD Billion, AGR %, CAGR %): U Shaped Recovery
Table 109 Cancer Biologics Market for Panitumumab, 2021-2031 (USD Billion, AGR %, CAGR %): L Shaped Recovery
Table 110 Cancer Biologics Market for Panitumumab, 2021-2031 (USD Billion, AGR %, CAGR %): W Shaped Recovery
Table 111 Cancer Biologics Market for Ramucirumab, 2021-2031 (USD Billion, AGR %, CAGR %)
Table 112 Cancer Biologics Market for Ramucirumab, 2021-2031 (USD Billion, AGR %, CAGR %): V Shaped Recovery
Table 113 Cancer Biologics Market for Ramucirumab, 2021-2031 (USD Billion, AGR %, CAGR %): U Shaped Recovery
Table 114 Cancer Biologics Market for Ramucirumab, 2021-2031 (USD Billion, AGR %, CAGR %): L Shaped Recovery
Table 115 Cancer Biologics Market for Ramucirumab, 2021-2031 (USD Billion, AGR %, CAGR %): W Shaped Recovery
Table 116 Cancer Biologics Market for Necitumumab, 2021-2031 (USD Billion, AGR %, CAGR %)
Table 117 Cancer Biologics Market for Necitumumab, 2021-2031 (USD Billion, AGR %, CAGR %): V Shaped Recovery
Table 118 Cancer Biologics Market for Necitumumab, 2021-2031 (USD Billion, AGR %, CAGR %): U Shaped Recovery
Table 119 Cancer Biologics Market for Necitumumab, 2021-2031 (USD Billion, AGR %, CAGR %): L Shaped Recovery
Table 120 Cancer Biologics Market for Necitumumab, 2021-2031 (USD Billion, AGR %, CAGR %): W Shaped Recovery
Table 121 Cancer Biologics Market for Pembrolizumab, 2021-2031 (USD Billion, AGR %, CAGR %)
Table 122 Cancer Biologics Market for Pembrolizumab, 2021-2031 (USD Billion, AGR %, CAGR %): V Shaped Recovery
Table 123 Cancer Biologics Market for Pembrolizumab, 2021-2031 (USD Billion, AGR %, CAGR %): U Shaped Recovery
Table 124 Cancer Biologics Market for Pembrolizumab, 2021-2031 (USD Billion, AGR %, CAGR %): L Shaped Recovery
Table 125 Cancer Biologics Market for Pembrolizumab, 2021-2031 (USD Billion, AGR %, CAGR %): W Shaped Recovery
Table 126 Cancer Biologics Market for Atezolizumab, 2021-2031 (USD Billion, AGR %, CAGR %)
Table 127 Cancer Biologics Market for Atezolizumab, 2021-2031 (USD Billion, AGR %, CAGR %): V Shaped Recovery
Table 128 Cancer Biologics Market for Atezolizumab, 2021-2031 (USD Billion, AGR %, CAGR %): U Shaped Recovery
Table 129 Cancer Biologics Market for Atezolizumab, 2021-2031 (USD Billion, AGR %, CAGR %): L Shaped Recovery
Table 130 Cancer Biologics Market for Atezolizumab, 2021-2031 (USD Billion, AGR %, CAGR %): W Shaped Recovery
Table 131 Cancer Biologics Market for Durvalumab, 2021-2031 (USD Billion, AGR %, CAGR %)
Table 132 Cancer Biologics Market for Durvalumab, 2021-2031 (USD Billion, AGR %, CAGR %): V Shaped Recovery
Table 133 Cancer Biologics Market for Durvalumab, 2021-2031 (USD Billion, AGR %, CAGR %): U Shaped Recovery
Table 134 Cancer Biologics Market for Durvalumab, 2021-2031 (USD Billion, AGR %, CAGR %): L Shaped Recovery
Table 135 Cancer Biologics Market for Durvalumab, 2021-2031 (USD Billion, AGR %, CAGR %): W Shaped Recovery
Table 136 Cancer Biologics Market for Nivolumab, 2021-2031 (USD Billion, AGR %, CAGR %)
Table 137 Cancer Biologics Market for Nivolumab, 2021-2031 (USD Billion, AGR %, CAGR %): V Shaped Recovery
Table 138 Cancer Biologics Market for Nivolumab, 2021-2031 (USD Billion, AGR %, CAGR %): U Shaped Recovery
Table 139 Cancer Biologics Market for Nivolumab, 2021-2031 (USD Billion, AGR %, CAGR %): L Shaped Recovery
Table 140 Cancer Biologics Market for Nivolumab, 2021-2031 (USD Billion, AGR %, CAGR %): W Shaped Recovery
Table 141 Cancer Biologics Market for Ipilimumab, 2021-2031 (USD Billion, AGR %, CAGR %)
Table 142 Cancer Biologics Market for Ipilimumab, 2021-2031 (USD Billion, AGR %, CAGR %): V Shaped Recovery
Table 143 Cancer Biologics Market for Ipilimumab, 2021-2031 (USD Billion, AGR %, CAGR %): U Shaped Recovery
Table 144 Cancer Biologics Market for Ipilimumab, 2021-2031 (USD Billion, AGR %, CAGR %): L Shaped Recovery
Table 145 Cancer Biologics Market for Ipilimumab, 2021-2031 (USD Billion, AGR %, CAGR %): W Shaped Recovery
Table 146 Cancer Biologics Market for Hospitals, 2021-2031 (USD Billion, AGR %, CAGR %)
Table 147 Cancer Biologics Market for Hospitals, 2021-2031 (USD Billion, AGR %, CAGR %): V Shaped Recovery
Table 148 Cancer Biologics Market for Hospitals, 2021-2031 (USD Billion, AGR %, CAGR %): U Shaped Recovery
Table 149 Cancer Biologics Market for Hospitals, 2021-2031 (USD Billion, AGR %, CAGR %): L Shaped Recovery
Table 150 Cancer Biologics Market for Hospitals, 2021-2031 (USD Billion, AGR %, CAGR %): W Shaped Recovery
Table 151 Cancer Biologics Market for Specialty Clinics, 2021-2031 (USD Billion, AGR %, CAGR %)
Table 152 Cancer Biologics Market for Specialty Clinics, 2021-2031 (USD Billion, AGR %, CAGR %): V Shaped Recovery
Table 153 Cancer Biologics Market for Specialty Clinics, 2021-2031 (USD Billion, AGR %, CAGR %): U Shaped Recovery
Table 154 Cancer Biologics Market for Specialty Clinics, 2021-2031 (USD Billion, AGR %, CAGR %): L Shaped Recovery
Table 155 Cancer Biologics Market for Specialty Clinics, 2021-2031 (USD Billion, AGR %, CAGR %): W Shaped Recovery
Table 156 Cancer Biologics Market for Cancer and Radiation Therapy Centers, 2021-2031 (USD Billion, AGR %, CAGR %)
Table 157 Cancer Biologics Market for Cancer and Radiation Therapy Centers, 2021-2031 (USD Billion, AGR %, CAGR %): V Shaped Recovery
Table 158 Cancer Biologics Market for Cancer and Radiation Therapy Centers, 2021-2031 (USD Billion, AGR %, CAGR %): U Shaped Recovery
Table 159 Cancer Biologics Market for Cancer and Radiation Therapy Centers, 2021-2031 (USD Billion, AGR %, CAGR %): L Shaped Recovery
Table 160 Cancer Biologics Market for Cancer and Radiation Therapy Centers, 2021-2031 (USD Billion, AGR %, CAGR %): W Shaped Recovery
Table 161 Europe Cancer Biologics Market, 2021-2031 (USD Billion, AGR %, CAGR %)
Table 162 Europe Cancer Biologics Market, 2021-2031 (USD Billion, AGR %, CAGR %): V Shaped Recovery
Table 163 Europe Cancer Biologics Market, 2021-2031 (USD Billion, AGR %, CAGR %): U Shaped Recovery
Table 164 Europe Cancer Biologics Market, 2021-2031 (USD Billion, AGR %, CAGR %): L Shaped Recovery
Table 165 Europe Cancer Biologics Market, 2021-2031 (USD Billion, AGR %, CAGR %): W Shaped Recovery
Table 166 UK Cancer Biologics Market, 2021-2031 (USD Billion, AGR %, CAGR %)
Table 167 Germany Cancer Biologics Market, 2021-2031 (USD Billion, AGR %, CAGR %)
Table 168 France Cancer Biologics Market, 2021-2031 (USD Billion, AGR %, CAGR %)
Table 169 Italy Cancer Biologics Market, 2021-2031 (USD Billion, AGR %, CAGR %)
Table 170 Spain Cancer Biologics Market, 2021-2031 (USD Billion, AGR %, CAGR %)
Table 171 Portugal Cancer Biologics Market, 2021-2031 (USD Billion, AGR %, CAGR %)
Table 172 Poland Cancer Biologics Market, 2021-2031 (USD Billion, AGR %, CAGR %)
Table 173 Hungary Cancer Biologics Market, 2021-2031 (USD Billion, AGR %, CAGR %)
Table 174 Czech Republic Cancer Biologics Market, 2021-2031 (USD Billion, AGR %, CAGR %)
Table 175 Slovakia Cancer Biologics Market, 2021-2031 (USD Billion, AGR %, CAGR %)
Table 176 Slovenia Cancer Biologics Market, 2021-2031 (USD Billion, AGR %, CAGR %)
Table 177 Romania Cancer Biologics Market, 2021-2031 (USD Billion, AGR %, CAGR %)
Table 178 Bulgaria Cancer Biologics Market, 2021-2031 (USD Billion, AGR %, CAGR %)
Table 179 Croatia Cancer Biologics Market, 2021-2031 (USD Billion, AGR %, CAGR %)
Table 180 Baltic States Cancer Biologics Market, 2021-2031 (USD Billion, AGR %, CAGR %)
Table 181 Serbia Cancer Biologics Market, 2021-2031 (USD Billion, AGR %, CAGR %)
Table 182 Serbia Cancer Biologics Market, 2021-2031 (USD Billion, AGR %, CAGR %)
Table 183 AbbVie Inc.: Headquarter, Founded, Employees, Company Type, Website, Business Segment
Table 184 AbbVie Inc.: Product Offerings
Table 185 AbbVie Inc.: Recent Initiatives, 2017 – 2020
Table 186 F.Hoffman La Roche: Headquarter, Founded, Employees, Company Type, Website, Business Segment
Table 187 F.Hoffman La Roche: Product Offerings
Table 188 F.Hoffman La Roche: Recent Initiatives, 2017 – 2020
Table 189 GlaxoSmithKline: Headquarter, Founded, Employees, Company Type, Website, Business Segment
Table 190 GlaxoSmithKline: Product Offerings
Table 191 GlaxoSmithKline: Recent Initiatives, 2017 – 2020
Table 192 Eli Lilly and Company: Headquarter, Founded, Employees, Company Type, Website, Business Segment
Table 193 Eli Lilly and Company: Product Offerings
Table 194 Eli Lilly and Company: Recent Initiatives, 2017 – 2020
Table 195 Amgen: Headquarter, Founded, Employees, Company Type, Website, Business Segment
Table 196 Amgen: Product Offerings
Table 197 Amgen: Recent Initiatives, 2017 – 2020
Table 198 Johnson & Johnson: Headquarter, Founded, Employees, Company Type, Website, Business Segment
Table 199 Johnson & Johnson: Product Offerings
Table 200 Johnson & Johnson: Recent Initiatives, 2017 – 2020
Table 201 Merck & Co.: Headquarter, Founded, Employees, Company Type, Website, Business Segment
Table 202 Merck & Co.: Product Offerings
Table 203 Merck & Co.: Recent Initiatives, 2017 – 2020
Table 204 Pfizer: Headquarter, Founded, Employees, Company Type, Website, Business Segment
Table 205 Pfizer: Product Offerings
Table 206 Pfizer: Recent Initiatives, 2017 – 2020
Table 207 Other Notable Players in Cancer Biologics and Therapeutics Industry
Companies Profiled in the Report
AbbVie Inc
Amgen
Eli Lilly and Company
F.Hoffman La Roche
GlaxoSmithKline
Johnson & Johnson
Merck & Co.
Pfizer
List of Companies Mentioned in the Report
Abbvie
Abz-Pharma GmbH
Accord Healthcare Ltd
Alexion Pharmaceuticals Inc
Amgen
Apotex Europe Bv
AstraZeneca
Berlex Inc
Biocon
Biogen Inc
BioPartners GmbH
Boehringer Ingelheim
Bristol-Myers Squibb
Celgene
Celltech, UCB.
Celltrion Healthcare Hungary Kft.
Centocor Ortho Biotech Products LP
Chugai Pharmaceutical Co., Ltd
Coherus Biosciences
Dyax Corp.
Genmab A/S
Genzyme Corp.
Guardant Health
Hexal Ag
Hospira UK Limited
Janssen Biotech Inc
Kyowa Hakko Kirin
Medarex
Medice Arzneimittel Putter GmbH & Co. Kg
MedImmune
Merck
Millennium Pharmaceuticals Inc
MSD
Mylan
Novartis
NovImmmune
Pfizer
Qiagen
Ratiopharm GmbH
Ratiopharm GmbH
Regeneron Pharmaceuticals
Roche
Samsung Bioepis
Sandoz GmbH
Sanofi
Stada Arzneimittel Ag
Sysmex Inostics
Taimed Biologics
Teva GmbH
United Therapeutics Corporation
Wyeth Pharmaceuticals
List of Organizations Mentioned in the Report
American Cancer Society
Angeles Clinic and Research Institute
British Columbia Cancer Agency
Cancer Research Institute
Croatian government
Department of Anatomic Pathology and the Department of Medical Oncology
Drug Controller General of India
European Medicines Agency
European Union
Food and Drug Administration
Government of Romania
Hospital Clínic
Institut Gustave Roussy (Villejuif, France)
National Cancer Institute (NCI)
Netherlands Cancer Institute (Amsterdam)
Organization for Economic Co-operation and Development
Serbian government
Spanish National Cancer Research Center (CNIO)
The Christie Hospital (NHS Foundation Trust)
The Cyclotron Centre Bronowice (CCB)
The National Institutes of Health
The Paula Stradinja University Hospital
United Nations
University of Leeds in the United Kingdom
University of Texas Southwestern Medical Center
World Health Organization