Plasma Protein Therapeutics Market, 2022 to 2032- our new study reveals the latest industry trends, R&D progress, and predicted revenues
Increase of Blood Donations to Fuel Demand Across Low and Middle Income Countries
Due to the worldwide initiatives, a rise in voluntary, unpaid blood donations from low- and middle-income countries has been noted to fulfil the unmet need for red blood cell concentrates. In high-income nations, however, demand for red blood cells has been steadily declining, and with global economic advancements, this trend is anticipated to continue. As a result, it seems that the quantity of recovered plasma accessible for plasma fractionation is diminishing.
COVID-19 Disruption Hampering the Industry’s Ability to Keep Pace with Growing Patient Pool
Plasma products are made possible by a meticulously designed, complicated system of willing donors, donation facilities, worldwide manufacturing networks, and pharmaceutical product distribution routes, which is generally reliable under normal conditions. The situation has become complicated with the outbreak of the coronavirus disease pandemic. The pandemic had a substantial influence on the well-developed and balanced system of plasma procurement beginning in early 2020, greatly impeding the industry’s capacity to keep up with expanding patient demand for these life-changing medications.
Discover how to stay ahead
Our 220+ page report provides 180+ tables and charts/graphs. Read on to discover the most lucrative areas in the industry and the future market prospects. Our new study lets you assess forecasted sales at the overall world market and regional level. See financial results, trends, opportunities, and revenue predictions. Much opportunity remains in this growing Plasma Protein Therapeutics Market. See how to exploit the opportunities.
Forecasts to 2032 and other analyses reveal the commercial prospects
• In addition to revenue forecasting to 2032, our new study provides you with recent results, growth rates, and market shares.
• You find original analyses, with business outlooks and developments.
• Discover qualitative analyses (including market dynamics, drivers, opportunities, restraints, and challenges), PEST Analysis, Porter’s Five Forces, SWOT Analysis, product profiles, and commercial developments.
Discover sales predictions for the world market and sub-markets
Product
• Immunoglobulins
• Albumin
• Coagulation Factors
• C1-Esterase Inhibitor (C1-INH)
• Other Products
Applications
• Hemophilia
• Primary Immunodeficiency Disorder (PID)
• Idiopathic Thrombocytopenic Purpura (ITP)
• Secondary Immunodeficiency
• Hereditary Angioedema
• Others
Region
• North America
• Europe
• Asia Pacific
• Latin America
• MEA

In addition to the revenue predictions for the overall world market and segments, you will also find revenue forecasts for 5 regional and 20 leading national markets:
By Region
North America
• U.S.
• Canada
Europe
• Germany
• France
• UK
• Italy
• Spain
• Rest of Europe
Asia Pacific
• China
• Japan
• India
• Australia
• South Korea
• Rest of Asia Pacific
Latin America
• Brazil
• Mexico
• Rest of Latin America
Middle East & Africa
• GCC
• South Africa
• Rest of Middle East & Africa
Need industry data? Please contact us today.
Leading companies and the potential for market growth
Overall world revenue for Plasma Protein Therapeutics Market will surpass US$28 billion in 2022, our work calculates. We predict strong revenue growth through 2032. Our work identifies which organizations hold the greatest potential. Discover their capabilities, progress, and commercial prospects, helping you stay ahead.
How the Plasma Protein Therapeutics Market report helps you
In summary, our 220+ page report provides you with the following knowledge:
• Revenue forecasts to 2032 for Plasma Protein Therapeutics Market, with forecasts for 5 segmentations of the plasma protein therapeutics market, with forecasts for product and applications sub-segments each forecasted at a global and regional level– discover the industry’s prospects, finding the most lucrative places for investments and revenues
• Revenue forecasts to 2032 for five regional and 20 key national markets– See forecasts for the Plasma Protein Therapeutics Market in North America, Europe, Asia Pacific, and Rest of the World. These regional markets have been further bifurcated by countries including the US, Canada, Brazil, Mexico, Germany, France, UK, Italy, Spain, China, India, Japan, Australia, South Korea, among other prominent economies.
• Prospects for established firms and those seeking to enter the market– including company profiles for 9 of the companies involved in the Plasma Protein Therapeutics Market. Some of the companies profiled in this report include ADMA Biologics Inc., Bio Products Laboratory Ltd., Biotest AG, China Biologic Products Holdings Inc., CSL Behring, Grifols SA, Kedrion SpA, Octapharma USA Inc., and Takeda Pharmaceutical Company Ltd, among other prominent players.
Find quantitative and qualitative analyses with independent predictions. Receive information that only our report contains, staying informed with this invaluable business intelligence.
Information found nowhere else
With our newly report title, you are less likely to fall behind in knowledge or miss out on opportunities. See how our work could benefit your research, analyses, and decisions. Visiongain’s study is for everybody needing commercial analyses for the Plasma Protein Therapeutics Market and leading companies. You will find data, trends, and predictions.
To access the data contained in this document please email contactus@visiongain.com
Buy our report today Plasma Protein Therapeutics Market Report 2022-2032: Forecasts by Product (Immunoglobulins, Albumin, Coagulation Factors, C1-Esterase Inhibitor (C1-INH), Other), by Application (Hemophilia, Primary Immunodeficiency Disorder (PID), Idiopathic Thrombocytopenic Purpura (ITP), Secondary Immunodeficiency, Hereditary Angioedema, Others) AND Regional and Leading National Market Analysis PLUS Analysis of Leading Companies AND COVID-19 Recovery Scenarios. Avoid missing out by staying informed – order our report now.
Visiongain is a trading partner with the US Federal Government
CCR Ref number: KD4R6
Do you have any custom requirements we can help you with? Any need for a specific country, geo region, market segment or specific company information? Contact us today, we can discuss your needs and see how we can help: contactus@visiongain.com
1. Report Overview
1.1 Introduction to Plasma Protein Therapeutics Market
1.2 Plasma Protein Therapeutics Market Definition
1.3 Why You Should Read This Report
1.4 What This Report Delivers
1.5 Key Questions Answered by this Analytical Report Include:
1.6 Who is This Report For?
1.7 Methodology
1.7.1 COVID-19 Impact: Recovery Scenarios
1.7.2 Market Evaluation & Forecasting Methodology
1.8 Frequently Asked Questions (FAQs)
1.9 Associated Visiongain Reports
1.10 About Visiongain
2 Executive Summary
2.1 Segmental Analysis, 2022
2.2 Regional Analysis, 2022
3 Global Plasma Protein Therapeutics Market Dynamics
3.1 COVID-19 Impact on the Plasma Protein Therapeutics Market
3.2 Current Trends in the Plasma Protein Therapeutics Market
3.3 Market Driving Factors
3.3.1 Increase Life Expectancy
3.3.2 Provides Genomic Gains and Healthcare Savings
3.3.3 Rising Demand for Immunoglobulins (IG)
3.3.4 Growing Investments in Innovation
3.4 Market Restraining Factors
3.4.1 Stringent Regulations to Hamper Market Growth
3.4.2 Demand for Plasma Therapies Outpacing Supply of Plasma
3.4.3 Lack of Awareness
3.4.4 COVID-19 Has Expanded the Gap Between Plasma Supply and Demand
3.5 Opportunities in the Global Market
3.5.1 Rising Incidence of Haemophilia
3.5.2 Opportunities in Emerging Economies
3.6 Porter’s Five Forces Analysis
3.6.1 Bargaining Power of Suppliers
3.6.2 Bargaining Power of Buyers
3.6.3 Threat of New Entrants
3.6.4 Threat of Substitutes
3.6.5 Competitive Rivalry
3.7 SWOT Analysis
3.7.1 Strengths
3.7.2 Weaknesses
3.7.3 Opportunities
3.7.4 Threats
4 Global Plasma Protein Therapeutics Market Analysis by Product
4.1 Segment Overview
4.2 Immunoglobulins
4.3 Albumin
4.4 Coagulation Factors
4.5 C1-Esterase Inhibitor (C1-INH)
4.6 Global Market Size Estimation and Forecast by Product
4.6.1 Pre-COVID-19 Market Scenario
4.6.2 Post-COVID-19 Market Scenarios (V, U, W, L Shaped Recovery Analysis
5 Global Plasma Protein Therapeutics Market Analysis by Applications
5.1 Segment Overview
5.2 Hemophilia
5.3 Primary Immunodeficiency Disorder (PID)
5.4 Idiopathic Thrombocytopenic Purpura (ITP)
5.5 Secondary Immunodeficiency
5.6 Hereditary Angioedema
5.7 Global Market Size Estimation and Forecast by Applications
5.7.1 Pre-COVID-19 Market Scenario
5.7.2 Post-COVID-19 Market Scenarios (V, U, W, L Shaped Recovery Analysis
6 Regional and Leading National Plasma Protein Therapeutics Market Forecasts 2022-2032
6.1 Global Plasma Protein Therapeutics Market by Region Forecast 2022-2032
6.2 COVID-19 Impact Recovery Scenarios (V, U, W, L)
7 North America Plasma Protein Therapeutics Market
7.1 Regional Overview
7.2 North America Plasma Protein Therapeutics Market by Country, Forecast 2022-2032
7.3 North America Plasma Protein Therapeutics Market Forecast by Product
7.4 North America Plasma Protein Therapeutics Market Forecast by Applications
7.5 U.S.
7.5.1 U.S. FDA Clears Terumo Blood and Cell Technologies' New Plasma Collection Technology
7.5.2 U.S. Plasma Protein Therapeutics Market Revenue, 2022-2032
7.6 Canada
7.6.1 Introduction
7.6.2 Canada Plasma Protein Therapeutics Market Revenue, 2022-2032
7.7 Post-COVID-19 Recovery Scenarios by Country
8 Europe Plasma Protein Therapeutics Market
8.1 Regional Overview
8.2 Europe Plasma Protein Therapeutics Market by Country, Forecast 2022-2032
8.3 Europe Plasma Protein Therapeutics Market Forecast by Product
8.4 Europe Plasma Protein Therapeutics Market Forecast by Applications
8.5 Germany
8.5.1 Plasma Donors Donate More Than Whole-Blood Donors
8.5.2 Germany Plasma Protein Therapeutics Market Revenue, 2022-2032
8.6 UK
8.6.1 UK Plasma Ban Lifted
8.6.2 UK Plasma Protein Therapeutics Market Revenue, 2022-2032
8.7 France
8.7.1 Versatile Policy to Process & Manufacture Therapeutic Plasma
8.7.2 France Plasma Protein Therapeutics Market Revenue, 2022-2032
8.8 Italy
8.8.1 Market Analysis
8.8.2 Italy Plasma Protein Therapeutics Market Revenue, 2022-2032
8.9 Spain
8.9.1 Spain Plasma Protein Therapeutics Market Revenue, 2022-2032
8.10 Rest of Europe
8.10.1 Rest of Europe Plasma Protein Therapeutics Market Revenue, 2022-2032
8.11 Post-COVID-19 Recovery Scenarios by Country
9 Asia Pacific Plasma Protein Therapeutics Market
9.1 Regional Overview
9.2 Asia Pacific Plasma Protein Therapeutics Market by Country, Forecast 2022-2032
9.3 Asia Pacific Plasma Protein Therapeutics Market Forecast by Product
9.4 Asia Pacific Plasma Protein Therapeutics Market Forecast by Applications
9.5 Japan Plasma Protein Therapeutics Market Forecast, 2022-2032
9.5.1 Market Analysis
9.5.2 Japan Plasma Protein Therapeutics Market Revenue, 2022-2032
9.6 China Plasma Protein Therapeutics Market Forecast, 2022-2032
9.6.1 Market Analysis
9.6.2 China Plasma Protein Therapeutics Market Revenue, 2022-2032
9.7 India Plasma Protein Therapeutics Market Forecast, 2022-2032
9.7.1 Market Analysis
9.7.2 India Plasma Protein Therapeutics Market Revenue, 2022-2032
9.8 Australia Plasma Protein Therapeutics Market Forecast, 2022-2032
9.8.1 Australia Plasma Protein Therapeutics Market Revenue, 2022-2032
9.9 South Korea Plasma Protein Therapeutics Market Forecast, 2022-2032
9.9.1 Market Analysis
9.9.2 South Korea Plasma Protein Therapeutics Market Revenue, 2022-2032
9.10 Rest of Asia Pacific Plasma Protein Therapeutics Market Forecast, 2022-2032
9.10.1 Rest of Asia Pacific Plasma Protein Therapeutics Market Revenue, 2022-2032
9.11 Post-COVID-19 Recovery Scenarios by Country
10 Latin America Plasma Protein Therapeutics Market
10.1 Regional Overview
10.2 Latin America Plasma Protein Therapeutics Market by Country, Forecast 2022-2032
10.3 Latin America Plasma Protein Therapeutics Market Forecast by Product
10.4 Latin America Plasma Protein Therapeutics Market Forecast by Applications
10.5 Brazil Plasma Protein Therapeutics Market Forecast, 2022-2032
10.5.1 Market Analysis
10.5.2 Brazil Plasma Protein Therapeutics Market Revenue, 2022-2032
10.6 Mexico Plasma Protein Therapeutics Market Forecast, 2022-2032
10.6.1 CSL Behring and Grifols to appeal US Border Patrol’s Ban on Mexican Plasma Donations
10.6.2 Mexico Plasma Protein Therapeutics Market Revenue, 2022-2032
10.7 Rest of Latin America Plasma Protein Therapeutics Market Forecast, 2022-2032
10.7.1 Rest of Latin America Plasma Protein Therapeutics Market Revenue, 2022-2032
10.8 Post-COVID-19 Recovery Scenarios by Country
11 Middle East and Africa Plasma Protein Therapeutics Market
11.1 Market Overview
11.2 Middle East and Africa Plasma Protein Therapeutics Market by Country, Forecast 2022-2032
11.3 Middle East and Africa Plasma Protein Therapeutics Market Forecast by Product
11.4 Middle East and Africa Plasma Protein Therapeutics Market Forecast by Applications
11.5 GCC Plasma Protein Therapeutics Market Forecast, 2022-2032
11.5.1 GCC Plasma Protein Therapeutics Market Revenue, 2022-2032
11.6 South Africa Plasma Protein Therapeutics Market Forecast, 2022-2032
11.6.1 South Africa Plasma Protein Therapeutics Market Revenue, 2022-2032
11.7 Rest of Middle East and Africa Plasma Protein Therapeutics Market Forecast, 2022-2032
11.7.1 Rest of Middle East and Africa Plasma Protein Therapeutics Market Revenue, 2022-2032
11.8 Post-COVID-19 Recovery Scenarios by Country
12 Company Profiles
12.1 ADMA Biologics, Inc.
12.1.1 Company Snapshot
12.1.2 Company Overview
12.1.3 Financial Analysis
12.1.4 Product Benchmarking
12.1.5 Recent Developments
12.2 Bio Products Laboratory Ltd.
12.2.1 Company Snapshot
12.2.2 Company Overview
12.2.3 Product Benchmarking
12.2.4 Recent Developments
12.3 Biotest AG
12.3.1 Company Snapshot
12.3.2 Company Overview
12.3.3 Financial Analysis
12.3.4 Product Benchmarking
12.3.5 Recent Developments
12.4 China Biologic Products Holdings Inc.
12.4.1 Company Snapshot
12.4.2 Company Overview
12.4.3 Product Benchmarking
12.4.4 Recent Developments
12.5 CSL Behring
12.5.1 Company Snapshot
12.5.2 Company Overview
12.5.3 Financial Analysis
12.5.4 Product Benchmarking
12.5.5 Recent Developments
12.6 Grifols SA
12.6.1 Company Snapshot
12.6.2 Company Overview
12.6.3 Financial Analysis
12.6.4 Product Benchmarking
12.6.5 Recent Developments
12.7 Kedrion SpA
12.7.1 Company Snapshot
12.7.2 Company Overview
12.7.3 Financial Analysis
12.7.4 Product Benchmarking
12.8 Octapharma AG
12.8.1 Company Snapshot
12.8.2 Company Overview
12.8.3 Product Benchmarking
12.8.4 Recent Developments
12.9 Takeda Pharmaceutical Company Ltd
12.9.1 Company Snapshot
12.9.2 Company Overview
12.9.3 Financial Analysis
12.9.4 Product Benchmarking
12.9.5 Recent Developments
13 Conclusion and Recommendations
13.1 Concluding Remarks
13.2 Recommendations
List of Tables
Table 1 Global Plasma Protein Therapeutics Market Snapshot, 2022 & 2032 (US$ billion, CAGR %)
Table 2 Global Plasma Protein Therapeutics Market Forecast by Product, 2022-2032 (US$ mn, AGR%, CAGR%)
Table 3 Global Plasma Protein Therapeutics Market Forecast by Product, 2022-2032 (US$ mn, AGR%, CAGR%): "V" Shaped Recovery
Table 4 Global Plasma Protein Therapeutics Market Forecast by Product, 2022-2032 (US$ mn, AGR%, CAGR%): "U" Shaped Recovery
Table 5 Global Plasma Protein Therapeutics Market Forecast by Product, 2022-2032 (US$ mn, AGR%, CAGR%): "W" Shaped Recovery
Table 6 Global Plasma Protein Therapeutics Market Forecast by Product, 2022-2032 (US$ mn, AGR%, CAGR%): "L" Shaped Recovery
Table 7 Global Plasma Protein Therapeutics Market Forecast by Application, 2022-2032 (US$ mn, AGR%, CAGR%)
Table 8 Global Plasma Protein Therapeutics Market Forecast by Application, 2022-2032 (US$ mn, AGR%, CAGR%): "V" Shaped Recovery
Table 9 Global Plasma Protein Therapeutics Market Forecast by Application, 2022-2032 (US$ mn, AGR%, CAGR%): "U" Shaped Recovery
Table 10 Global Plasma Protein Therapeutics Market Forecast by Application, 2022-2032 (US$ mn, AGR%, CAGR%): "W" Shaped Recovery
Table 11 Global Plasma Protein Therapeutics Market Forecast by Application, 2022-2032 (US$ mn, AGR%, CAGR%): "L" Shaped Recovery
Table 12 Global Plasma Protein Therapeutics Market Forecast by Region, 2022-2032 (US$ mn, AGR%, CAGR%)
Table 13 Global Plasma Protein Therapeutics Market Forecast by Region, 2022-2032 (US$ mn, AGR%, CAGR%): "V" Shaped Recovery
Table 14 Global Plasma Protein Therapeutics Market Forecast by Region, 2022-2032 (US$ mn, AGR%, CAGR%): "U" Shaped Recovery
Table 15 Global Plasma Protein Therapeutics Market Forecast by Region, 2022-2032 (US$ mn, AGR%, CAGR%): "W" Shaped Recovery
Table 16 Global Plasma Protein Therapeutics Market Forecast by Region, 2022-2032 (US$ mn, AGR%, CAGR%): "L" Shaped Recovery
Table 17 North America Plasma Protein Therapeutics Market Forecast by Country, 2022-2032 (US$ mn, AGR%, CAGR%)
Table 18 North America Plasma Protein Therapeutics Market Forecast by Product, 2022-2032 (US$ mn, AGR%, CAGR%)
Table 19 North America Plasma Protein Therapeutics Market Forecast by Application, 2022-2032 (US$ mn, AGR%, CAGR%)
Table 20 U.S. Plasma Protein Therapeutics Market Forecast, 2022-2032 (US$ mn, AGR%, CAGR%)
Table 21 Canada Plasma Protein Therapeutics Market Forecast, 2022-2032 (US$ mn, AGR%, CAGR%)
Table 22 North America Plasma Protein Therapeutics Market Forecast by Country, 2022-2032 (US$ mn, AGR%, CAGR%): "V" Shaped Recovery
Table 23 North America Plasma Protein Therapeutics Market Forecast by Country, 2022-2032 (US$ mn, AGR%, CAGR%): "U" Shaped Recovery
Table 24 North America Plasma Protein Therapeutics Market Forecast by Country, 2022-2032 (US$ mn, AGR%, CAGR%): "W" Shaped Recovery
Table 25 North America Plasma Protein Therapeutics Market Forecast by Country, 2022-2032 (US$ mn, AGR%, CAGR%): "L" Shaped Recovery
Table 26 Europe Plasma Protein Therapeutics Market Forecast by Country, 2022-2032 (US$ mn, AGR%, CAGR%)
Table 27 Europe Plasma Protein Therapeutics Market Forecast by Product, 2022-2032 (US$ mn, AGR%, CAGR%)
Table 28 Europe Plasma Protein Therapeutics Market Forecast by Application, 2022-2032 (US$ mn, AGR%, CAGR%)
Table 29 Germany Plasma Protein Therapeutics Market Forecast, 2022-2032 (US$ mn, AGR%, CAGR%)
Table 30 UK Plasma Protein Therapeutics Market Forecast, 2022-2032 (US$ mn, AGR%, CAGR%)
Table 31 France Plasma Protein Therapeutics Market Forecast, 2022-2032 (US$ mn, AGR%, CAGR%)
Table 32 Italy Plasma Protein Therapeutics Market Forecast, 2022-2032 (US$ mn, AGR%, CAGR%)
Table 33 Spain Plasma Protein Therapeutics Market Forecast, 2022-2032 (US$ mn, AGR%, CAGR%)
Table 34 Rest of Europe Plasma Protein Therapeutics Market Forecast, 2022-2032 (US$ mn, AGR%, CAGR%)
Table 35 Europe Plasma Protein Therapeutics Market Forecast by Country, 2022-2032 (US$ mn, AGR%, CAGR%): "V" Shaped Recovery
Table 36 Europe Plasma Protein Therapeutics Market Forecast by Country, 2022-2032 (US$ mn, AGR%, CAGR%): "U" Shaped Recovery
Table 37 Europe Plasma Protein Therapeutics Market Forecast by Country, 2022-2032 (US$ mn, AGR%, CAGR%): "W" Shaped Recovery
Table 38 Europe Plasma Protein Therapeutics Market Forecast by Country, 2022-2032 (US$ mn, AGR%, CAGR%): "L" Shaped Recovery
Table 39 Asia Pacific Plasma Protein Therapeutics Market Forecast by Country, 2022-2032 (US$ mn, AGR%, CAGR%)
Table 40 Asia Pacific Plasma Protein Therapeutics Market Forecast by Product, 2022-2032 (US$ mn, AGR%, CAGR%)
Table 41 Asia Pacific Plasma Protein Therapeutics Market Forecast by Application, 2022-2032 (US$ mn, AGR%, CAGR%)
Table 42 Japan Plasma Protein Therapeutics Market Forecast, 2022-2032 (US$ mn, AGR%, CAGR%)
Table 43 China Plasma Protein Therapeutics Market Forecast, 2022-2032 (US$ mn, AGR%, CAGR%)
Table 44 India Plasma Protein Therapeutics Market Forecast, 2022-2032 (US$ mn, AGR%, CAGR%)
Table 45 Australia Plasma Protein Therapeutics Market Forecast, 2022-2032 (US$ mn, AGR%, CAGR%)
Table 46 South Korea Plasma Protein Therapeutics Market Forecast, 2022-2032 (US$ mn, AGR%, CAGR%)
Table 47 Rest of Asia Pacific Plasma Protein Therapeutics Market Forecast, 2022-2032 (US$ mn, AGR%, CAGR%)
Table 48 Asia Pacific Plasma Protein Therapeutics Market Forecast by Country, 2022-2032 (US$ mn, AGR%, CAGR%): "V" Shaped Recovery
Table 49 Asia Pacific Plasma Protein Therapeutics Market Forecast by Country, 2022-2032 (US$ mn, AGR%, CAGR%): "U" Shaped Recovery
Table 50 Asia Pacific Plasma Protein Therapeutics Market Forecast by Country, 2022-2032 (US$ mn, AGR%, CAGR%): "W" Shaped Recovery
Table 51 Asia Pacific Plasma Protein Therapeutics Market Forecast by Country, 2022-2032 (US$ mn, AGR%, CAGR%): "L" Shaped Recovery
Table 52 Latin America Plasma Protein Therapeutics Market Forecast by Country, 2022-2032 (US$ mn, AGR%, CAGR%)
Table 53 Latin America Plasma Protein Therapeutics Market Forecast by Product, 2022-2032 (US$ mn, AGR%, CAGR%)
Table 54 Latin America Plasma Protein Therapeutics Market Forecast by Application, 2022-2032 (US$ mn, AGR%, CAGR%)
Table 55 Brazil Plasma Protein Therapeutics Market Forecast, 2022-2032 (US$ mn, AGR%, CAGR%)
Table 56 Mexico Plasma Protein Therapeutics Market Forecast, 2022-2032 (US$ mn, AGR%, CAGR%)
Table 57 Rest of Latin America Plasma Protein Therapeutics Market Forecast, 2022-2032 (US$ mn, AGR%, CAGR%)
Table 58 Latin America Plasma Protein Therapeutics Market Forecast by Country, 2022-2032 (US$ mn, AGR%, CAGR%): "V" Shaped Recovery
Table 59 Latin America Plasma Protein Therapeutics Market Forecast by Country, 2022-2032 (US$ mn, AGR%, CAGR%): "U" Shaped Recovery
Table 60 Latin America Plasma Protein Therapeutics Market Forecast by Country, 2022-2032 (US$ mn, AGR%, CAGR%): "W" Shaped Recovery
Table 61 Latin America Plasma Protein Therapeutics Market Forecast by Country, 2022-2032 (US$ mn, AGR%, CAGR%): "L" Shaped Recovery
Table 62 MEA Plasma Protein Therapeutics Market Forecast by Country, 2022-2032 (US$ mn, AGR%, CAGR%)
Table 63 MEA Plasma Protein Therapeutics Market Forecast by Product, 2022-2032 (US$ mn, AGR%, CAGR%)
Table 64 MEA Plasma Protein Therapeutics Market Forecast by Application, 2022-2032 (US$ mn, AGR%, CAGR%)
Table 65 GCC Plasma Protein Therapeutics Market Forecast, 2022-2032 (US$ mn, AGR%, CAGR%)
Table 66 South Africa Plasma Protein Therapeutics Market Forecast, 2022-2032 (US$ mn, AGR%, CAGR%)
Table 67 Rest of MEA Plasma Protein Therapeutics Market Forecast, 2022-2032 (US$ mn, AGR%, CAGR%)
Table 68 MEA Plasma Protein Therapeutics Market Forecast by Country, 2022-2032 (US$ mn, AGR%, CAGR%): "V" Shaped Recovery
Table 69 MEA Plasma Protein Therapeutics Market Forecast by Country, 2022-2032 (US$ mn, AGR%, CAGR%): "U" Shaped Recovery
Table 70 MEA Plasma Protein Therapeutics Market Forecast by Country, 2022-2032 (US$ mn, AGR%, CAGR%): "W" Shaped Recovery
Table 71 MEA Plasma Protein Therapeutics Market Forecast by Country, 2022-2032 (US$ mn, AGR%, CAGR%): "L" Shaped Recovery
Table 72 ADMA Biologics, Inc.: Key Details, (CEO, HQ, Revenue, Founded, No. of Employees, Company Type, Website, Business Segment)
Table 73 ADMA Biologics Inc.: Product Benchmarking
Table 74 ADMA Biologics, Inc.: Recent Developments
Table 75 Bio Products Laboratory Ltd.: Key Details, (CEO, HQ, Founded, No. of Employees, Company Type, Website, Business Segment)
Table 76 Bio Products Laboratory Ltd.: Product Benchmarking
Table 77 Bio Products Laboratory Ltd.: Recent Developments
Table 78 Biotest AG: Key Details, (CEO, HQ, Revenue, Founded, No. of Employees, Company Type, Website, Business Segment)
Table 79 Biotest AG: Product Benchmarking
Table 80 Biotest AG: Recent Developments
Table 81 China Biologic Products Holdings Inc.: Key Details, (CEO, HQ, Founded, No. of Employees, Company Type, Website, Business Segment)
Table 82 China Biologic Products Holdings Inc.: Product Benchmarking
Table 83 China Biologic Products Holdings Inc.: Recent Developments
Table 84 CSL Behring: Key Details, (CEO, HQ, Revenue, Founded, No. of Employees, Company Type, Website, Business Segment)
Table 85 CSL Behring: Product Benchmarking
Table 86 CSL Behring: Recent Developments
Table 87 Grifols SA: Key Details, (CEO, HQ, Revenue, Founded, No. of Employees, Company Type, Website, Business Segment)
Table 88 Grifols SA: Product Benchmarking
Table 89 Grifols SA: Recent Developments
Table 90 Kedrion SpA: Key Details, (CEO, HQ, Revenue, Founded, No. of Employees, Company Type, Website, Business Segment)
Table 91 Kedrion SpA: Product Benchmarking
Table 92 Octapharma AG: Key Details, (CEO, HQ, Founded, No. of Employees, Company Type, Website, Business Segment)
Table 93 Octapharma AG: Product Benchmarking
Table 94 Octapharma AG: Recent Developments
Table 95 Takeda Pharmaceutical Company Ltd: Key Details, (CEO, HQ, Revenue, Founded, No. of Employees, Company Type, Website, Business Segment)
Table 96 Takeda Pharmaceutical Company Ltd: Product Benchmarking
Table 97 Takeda Pharmaceutical Company Ltd: Recent Developments
List of Figures
Figure 1 Global Plasma Protein Therapeutics Market: Market Segmentation
Figure 2 Global Plasma Protein Therapeutics Market Trends
Figure 3 Global Plasma Protein Therapeutics Market: Porter’s Five Forces
Figure 4 Global Plasma Protein Therapeutics Market: SWOT Analysis
Figure 5 Global Plasma Protein Therapeutics Market Share Forecast by Product: 2022, 2027, 2032 (%)
Figure 6 Global Plasma Protein Therapeutics Market Forecast by Product, 2022-2032 (US$ million, AGR %)
Figure 7 Global Plasma Protein Therapeutics Market Forecast by Product, 2022-2032 (US$ million, AGR %): “V” Shaped Recovery
Figure 8 Global Plasma Protein Therapeutics Market Forecast by Product, 2022-2032 (US$ million, AGR %): “U” Shaped Recovery
Figure 9 Global Plasma Protein Therapeutics Market Forecast by Product, 2022-2032 (US$ million, AGR %): “W” Shaped Recovery
Figure 10 Global Plasma Protein Therapeutics Market Forecast by Product, 2022-2032 (US$ million, AGR %): “L” Shaped Recovery
Figure 11 Global Plasma Protein Therapeutics Market Share Forecast by Applications: 2022, 2027, 2032 (%)
Figure 12 Global Plasma Protein Therapeutics Market Forecast by Applications, 2022-2032 (US$ million, AGR %)
Figure 13 Global Plasma Protein Therapeutics Market Forecast by Applications, 2022-2032 (US$ million, AGR %): “V” Shaped Recovery
Figure 14 Global Plasma Protein Therapeutics Market Forecast by Applications, 2022-2032 (US$ million, AGR %): “U” Shaped Recovery
Figure 15 Global Plasma Protein Therapeutics Market Forecast by Applications, 2022-2032 (US$ million, AGR %): “W” Shaped Recovery
Figure 16 Global Plasma Protein Therapeutics Market Forecast by Applications, 2022-2032 (US$ million, AGR %): “L” Shaped Recovery
Figure 17 Global Plasma Protein Therapeutics Market Forecast by Region 2022-2032 (US$ million)
Figure 18 Global Plasma Protein Therapeutics Market Share Forecast by Region 2022, 2027, 2032 (%)
Figure 19 Global Plasma Protein Therapeutics Market Forecast, 2022-2032 (US$ million, AGR%): “V” Shaped Recovery
Figure 20 Global Plasma Protein Therapeutics Market Forecast, 2022-2032 (US$ million, AGR %): “U” Shaped Recovery
Figure 21 Global Plasma Protein Therapeutics Market Forecast, 2022-2032 (US$ million, AGR%): “W” Shaped Recovery
Figure 22 Global Plasma Protein Therapeutics Market Forecast, 2022-2032 (US$ million, AGR%): “L” Shaped Recovery
Figure 23 North America Plasma Protein Therapeutics Market Forecast by Country 2022-2032 (US$ million)
Figure 24 North America Plasma Protein Therapeutics Market Share Forecast by Country 2022, 2027, 2032 (%)
Figure 25 North America Plasma Protein Therapeutics Market Forecast by Product, 2022-2032 (US$ million)
Figure 26 North America Plasma Protein Therapeutics Market Forecast by Applications, 2022-2032 (US$ million)
Figure 27 U.S. Plasma Protein Therapeutics Market Forecast, 2022-2032 (US$ million, AGR %)
Figure 28 Canada Plasma Protein Therapeutics Market Forecast, 2022-2032 (US$ million, AGR %)
Figure 29 North America Plasma Protein Therapeutics Market Forecast by Country, 2022-2032 (US$ million, AGR %): “V” Shaped Recovery
Figure 30 North America Plasma Protein Therapeutics Market Forecast by Country, 2022-2032 (US$ million, AGR %): “U” Shaped Recovery
Figure 31 North America Plasma Protein Therapeutics Market Forecast by Country, 2022-2032 (US$ million, AGR %): “W” Shaped Recovery
Figure 32 North America Plasma Protein Therapeutics Market Forecast by Country, 2022-2032 (US$ million, AGR %): “L” Shaped Recovery
Figure 33 Europe Plasma Protein Therapeutics Market Forecast by Country 2022-2032 (US$ million)
Figure 34 Europe Plasma Protein Therapeutics Market Share Forecast by Country 2022, 2027, 2032 (%)
Figure 35 Europe Plasma Protein Therapeutics Market Forecast by Product, 2022-2032 (US$ million, AGR%)
Figure 36 Europe Plasma Protein Therapeutics Market Forecast by Applications, 2022-2032 (US$ million, AGR%)
Figure 37 Germany Plasma Protein Therapeutics Market Forecast, 2022-2032 (US$ million, AGR %)
Figure 38 UK Plasma Protein Therapeutics Market Forecast, 2022-2032 (US$ million, AGR %)
Figure 39 France Plasma Protein Therapeutics Market Forecast, 2022-2032 (US$ million, AGR %)
Figure 40 Italy Plasma Protein Therapeutics Market Forecast, 2022-2032 (US$ million, AGR %)
Figure 41 Spain Plasma Protein Therapeutics Market Forecast, 2022-2032 (US$ million, AGR %)
Figure 42 Rest of Europe Plasma Protein Therapeutics Market Forecast, 2022-2032 (US$ million, AGR %)
Figure 43 Europe Plasma Protein Therapeutics Market Forecast by Country, 2022-2032 (US$ million, AGR %): “V” Shaped Recovery
Figure 44 Europe Plasma Protein Therapeutics Market Forecast by Country, 2022-2032 (US$ million, AGR %): “U” Shaped Recovery
Figure 45 Europe Plasma Protein Therapeutics Market Forecast by Country, 2022-2032 (US$ million, AGR %): “W” Shaped Recovery
Figure 46 Europe Plasma Protein Therapeutics Market Forecast by Country, 2022-2032 (US$ million, AGR %): “L” Shaped Recovery
Figure 47 Asia Pacific Plasma Protein Therapeutics Market Forecast by Country 2022-2032 (US$ million)
Figure 48 Asia Pacific Plasma Protein Therapeutics Market Share Forecast by Country 2022, 2027, 2032 (%)
Figure 49 Asia Pacific Plasma Protein Therapeutics Market Forecast by Product, 2022-2032 (US$ million)
Figure 50 Asia Pacific Plasma Protein Therapeutics Market Forecast by Applications, 2022-2032 (US$ million, AGR%)
Figure 51 Japan Plasma Protein Therapeutics Market Forecast, 2022-2032 (US$ million, AGR %)
Figure 52 China Plasma Protein Therapeutics Market Forecast, 2022-2032 (US$ million, AGR %)
Figure 53 India Plasma Protein Therapeutics Market Forecast, 2022-2032 (US$ million, AGR %)
Figure 54 Australia Plasma Protein Therapeutics Market Forecast, 2022-2032 (US$ million, AGR %)
Figure 55 South Korea Plasma Protein Therapeutics Market Forecast, 2022-2032 (US$ million, AGR %)
Figure 56 Rest of Asia Pacific Plasma Protein Therapeutics Market Forecast, 2022-2032 (US$ million, AGR %)
Figure 57 Asia Pacific Plasma Protein Therapeutics Market Forecast by Country, 2022-2032 (US$ million, AGR %): “V” Shaped Recovery
Figure 58 Asia Pacific Plasma Protein Therapeutics Market Forecast by Country, 2022-2032 (US$ million, AGR %): “U” Shaped Recovery
Figure 59 Asia Pacific Plasma Protein Therapeutics Market Forecast by Country, 2022-2032 (US$ million, AGR %): “W” Shaped Recovery
Figure 60 Asia Pacific Plasma Protein Therapeutics Market Forecast by Country, 2022-2032 (US$ million, AGR %): “L” Shaped Recovery
Figure 61 Latin America Plasma Protein Therapeutics Market Forecast by Country 2022-2032 (US$ million)
Figure 62 Latin America Plasma Protein Therapeutics Market Share Forecast by Country 2022, 2027, 2032 (%)
Figure 63 Latin America Plasma Protein Therapeutics Market Forecast by Product, 2022-2032 (US$ million, AGR%)
Figure 64 Latin America Plasma Protein Therapeutics Market Forecast by Applications, 2022-2032 (US$ million, AGR%)
Figure 65 Brazil Plasma Protein Therapeutics Market Forecast, 2022-2032 (US$ million, AGR %)
Figure 66 Mexico Plasma Protein Therapeutics Market Forecast, 2022-2032 (US$ million, AGR %)
Figure 67 Rest of Latin America Plasma Protein Therapeutics Market Forecast, 2022-2032 (US$ million, AGR %)
Figure 68 Latin America Plasma Protein Therapeutics Market Forecast by Country, 2022-2032 (US$ million, AGR %): “V” Shaped Recovery
Figure 69 Latin America Plasma Protein Therapeutics Market Forecast by Country, 2022-2032 (US$ million, AGR %): “U” Shaped Recovery
Figure 70 Latin America Plasma Protein Therapeutics Market Forecast by Country, 2022-2032 (US$ million, AGR %): “W” Shaped Recovery
Figure 71 Latin America Plasma Protein Therapeutics Market Forecast by Country, 2022-2032 (US$ million, AGR %): “L” Shaped Recovery
Figure 72 Middle East and Africa Plasma Protein Therapeutics Market Forecast by Country 2022-2032 (US$ million)
Figure 73 Middle East and Africa Plasma Protein Therapeutics Market Share Forecast by Country 2022, 2027, 2032 (%)
Figure 74 Middle East and Africa Plasma Protein Therapeutics Market Forecast by Product, 2022-2032 (US$ million, AGR%)
Figure 75 Middle East and Africa Plasma Protein Therapeutics Market Forecast by Applications, 2022-2032 (US$ million, AGR%)
Figure 76 GCC Plasma Protein Therapeutics Market Forecast, 2022-2032 (US$ million, AGR %)
Figure 77 South Africa Plasma Protein Therapeutics Market Forecast, 2022-2032 (US$ million, AGR %)
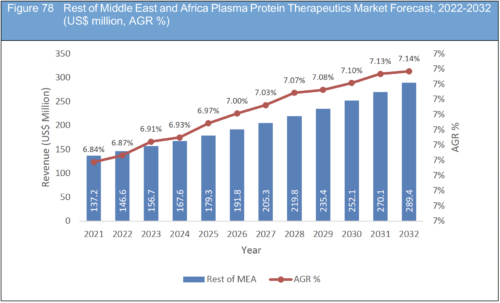
Figure 78 Rest of Middle East and Africa Plasma Protein Therapeutics Market Forecast, 2022-2032 (US$ million, AGR %)
Figure 79 MEA Plasma Protein Therapeutics Market Forecast by Country, 2022-2032 (US$ million, AGR %): “V” Shaped Recovery
Figure 80 MEA Plasma Protein Therapeutics Market Forecast by Country, 2022-2032 (US$ million, AGR %): “U” Shaped Recovery
Figure 81 MEA Plasma Protein Therapeutics Market Forecast by Country, 2022-2032 (US$ million, AGR %): “W” Shaped Recovery
Figure 82 MEA Plasma Protein Therapeutics Market Forecast by Country, 2022-2032 (US$ million, AGR %): “L” Shaped Recovery
Figure 83 ADMA Biologics, Inc.: Net Revenue, 2015-2021 (US$ million, AGR%)
Figure 84 ADMA Biologics, Inc.: R&D Expenses, 2015-2021 (US$ million, AGR%)
Figure 85 ADMA Biologics, Inc.: Gross Profit, 2015-2021 (US$ million, AGR%)
Figure 86 Biotest AG: Net Revenue, 2015-2021 (US$ million, AGR%)
Figure 87 CSL Behring: Net Revenue, 2015-2021 (US$ million, AGR%)
Figure 88 CSL Behring: R&D Expenses, 2015-2021 (US$ million, AGR%)
Figure 89 CSL Behring: Gross Profit, 2015-2021 (US$ million, AGR%)
Figure 90 Grifols SA: Net Revenue, 2015-2021 (US$ million, AGR%)
Figure 91 Grifols SA: R&D Expenses, 2015-2021 (US$ million, AGR%)
Figure 92 Grifols SA: Gross Profit, 2015-2021 (US$ million, AGR%)
Figure 93 Kedrion SpA: Net Revenue, 2018-2020 (US$ million, AGR%)
Figure 94 Kedrion SpA: R&D Expenses, 2018-2020 (US$ million, AGR%)
Figure 95 Kedrion SpA: Gross Profit, 2018-2020 (US$ million, AGR%)
Figure 96 Takeda Pharmaceutical Company Ltd: Net Revenue, 2015-2021 (US$ million, AGR%)
Figure 97 Takeda Pharmaceutical Company Ltd: R&D Expenses, 2015-2021 (US$ million, AGR%)
Figure 98 Takeda Pharmaceutical Company Ltd: Gross Profit, 2015-2021 (US$ million, AGR%)
Companies Profiled in the Report
ADMA Biologics Inc.
Bio Products Laboratory Ltd.
Biotest AG
China Biologic Products Holdings Inc.
CSL Behring
Grifols SA
Kedrion SpA
Octapharma USA Inc.
Takeda Pharmaceutical Company Ltd
List of Other Companies
Allozyne
Alteogen
Alvogen
Amarey Novamedical
Amega Biotech
Apotex
Astellas Pharma
Avesthagen
Biocad
BioGenomics
Biolab
Bionovis
BioXpress Therapeutics
Boehringer Ingelheim
Bristol-Myers Squibb
Cambridge Antibody Technology
CCL Pharmaceuticals
CCM Duopharma
Celltrion
Centocor Ortho Biotech
Chong Kun Dang
Chugai
CinnaGen.
Coherus BioSciences
Compass Biotechnologies
Cristália
CT Arzneimittel
Cyplasin
Daiichi Sankyo
Dong-A Pharmaceutical
Dr. Reddy's Laboratories
Egis Pharmaceuticals
Eisai
Eli Lilly
Elpen Pharmaceutical
Emcure Pharmaceuticals
EMS
Epirus
Eurofarma
Express Scripts
FibroGen
Finox Biotech
Fuji Pharma
Gan & Lee
Genetech
Genexine
Gennova
GenSci
Genzyme
Geropharm
Gilead Sciences
GlaxoSmithKline
Hangzhou Jiuyuan Gene Engineering Co.
Hanmi Pharmaceutical
Hanwha Chemical
Haselmeier
Health Canada
Helius Biotech
Hexal
Hindustan Antibiotic
Hospira
Hualida Biotech
Hypermarcas
IGES Institute
Intas Biopharmaceuticals
inVentiv Health
JCR Pharmaceuticals
Kabi
Kemwell Biopharma
Kissea
Koçak Farma
Kwizda Pharma
Kyowa Hakko Kirin
Landsteiner Scientific
LG Life Sciences
Libbs
LKM SA
Lonza
Marvel Life Sciences
Minapharm
Mitsubishi Tanabe
Mochida Pharmaceutical
Momenta Pharmaceuticals
Mycenax Biotech
Mylan
Nichi-Iko
Nippion Kayaku
Novo Nordisk
Nuron Biotech
Pharmstandard
PRA International
Pro Generika
PROBIOMED
Qilu Pharmaceutical
Quintiles
Ranbaxy Laboratories
Ratiopharm
Regeneron Pharmaceuticals
Reliance Life Sciences (RLS)
Rentschler Biotechnologie
Sandoz
Sanofi
SciGen
Shandong Kexing Pharma
Shanghai Celgen Biopharmaceutical
Shanghai CP Guojian
Shanghai Fosun
Shantha Biotechnics
Shinogi
Sicor Biotech
Sothema Laboratories
Spectrum Pharmaceuticals
Stragen Pharma
Strides Arcolab
Syngene International
Synthon Biopharmaceuticals
Takeda
Tianjin Hualida Biotechnology
Tonghua Dongbao
TSH Biopharm Corp
União Química
USV Biologics
Virchow Biotech
Wanbang Biopharmaceuticals
Wockhardt
Xiamen Amoytop Biotech
Zenotech
Zuventus
List of Organizations
Association of International Pharmaceutical Manufacturers
Chinese Pharmaceutical Association
European Medicines Agency
Federal Drugs Agency
IFPMA
Indian Drug Manufacturers' Association
International Federation of Pharmaceutical Manufacturers & Associations
International Pharmaceutical Federation
Jordanian Association of Pharmaceutical Manufacturers
Medicines and Healthcare Products Regulatory Agency
National Association of Pharmaceutical Manufacturers
Pharma & Biopharma Outsourcing Association (PBOA)
Pharmaceutical Group of the European Union
Pharmaceutical Manufacturers Association (PMA)
Pharmaceutical Society of Australia
Pharmaceutical Society of Ireland
Pharmaceutical Society Of New Zealand
Pharmaceutical Society of Northern Ireland
Royal Pharmaceutical Society
Singapore Association of Pharmaceutical Industries (SAPI)
Sri Lanka Pharmaceutical Manufacturers Association
The Association of the British Pharmaceutical Industry (ABPI)
The Australian Pharmaceutical Manufacturers Association
The European Federation of Pharmaceutical Industries and Associations
The European Personalised Medicine Association
The International Federation of Pharmaceutical Manufacturers & Associations (IFPMA)
The Korea Pharmaceutical and Bio-Pharma Manufacturers Association