The Offshore Wind Power Market Report 2022-2032: This report will prove invaluable to leading firms striving for new revenue pockets if they wish to better understand the industry and its underlying dynamics. It will be useful for companies that would like to expand into different industries or to expand their existing operations in a new region.
Cost Reduction in the Offshore Wind Set-Up is Helping in Market Growth
The importance of cost reduction cannot be overstated. Wind turbines and installation account for over one-third of offshore wind project lifetime costs, while OPEX accounts for approximately 30%. Offshore wind LCOE has fallen well below what industry experts could have projected due to improving manufacturing, installation, and O&M efficiency, as well as growing turbine size and economies of scale. Over the previous five years, cost reduction options for offshore wind have been grossly overestimated. Fixed-bottom offshore LCOE is expected to drop from 35 to 49 percent between 2035 and 2050, according to experts polled, while floating offshore wind is expected to drop from 17 to 40 percent between 2035 and 2050. Innovation in turbine technology, as well as improvements in cost of capital, project design life, total capacity factors, and OPEX optimization, will drive this reduction.
Norway Has Announced Plans to Significantly Increase Offshore Wind Energy Output by 2040
Norway has announced plans to significantly increase offshore wind energy output by 2040, with the goal of transforming the country from an oil and gas exporter to a renewable energy producer. The administration, which has been chastised by environmentalists for continuing to assist the oil and gas industry, has set a goal of developing 30 gigawatts (GW) of offshore wind power by 2040. Following substantial demand from energy companies, Norway has designated two locations in the North Sea to accommodate up to 4.5 gigawatts (GW) of floating and bottom-fixed wind turbine capacity. Equinor, Shell, British Petroleum (BP), Denmark’s Orsted, and Italy’s Eni are among the utilities, oil and gas businesses, and engineering firms that have lined up to develop offshore power projects in Norway.
What Are These Questions You Should Ask Before Buying A Market Research Report?
• How is the offshore wind power market evolving?
• What is driving and restraining the offshore wind power market?
• How will each offshore wind submarket segment grow over the forecast period and how much revenue will these submarkets account for in 2032?
• How will the market shares for each offshore wind submarket develop from 2022 to 2032?
• What will be the main driver for the overall market from 2022 to 2032?
• Will leading offshore wind power markets broadly follow the macroeconomic dynamics, or will individual national markets outperform others?
• How will the market shares of the national markets change by 2032 and which geographical region will lead the market in 2032?
• Who are the leading players and what are their prospects over the forecast period?
• What are the offshore wind projects for these leading companies?
• How will the industry evolve during the period between 2020 and 2032? What are the implication of offshore wind projects taking place now and over the next 10 years?
• Is there a greater need for product commercialisation to further scale the offshore wind power market?
• Where is the offshore wind power market heading? And how can you ensure you are at the forefront of the market?
• What can be the best investment options for new product and service lines?
• What are the key prospects for moving companies into a new growth path? C-suite?
You need to discover how this will impact the offshore wind power market today, and over the next 10 years:
• Our 264-page report provides 131 tables and 129 charts/graphs exclusively to you.
• The report highlights key lucrative areas in the industry so you can target them – NOW.
• Contains in-depth analyse of global, regional and national sales and growth
• Highlights for you the key successful trends, changes and revenue projections made by your competitors
This report tells you TODAY how the offshore wind power market will develop in the next 10 years, and in-line with the variations in COVID-19 economic recession and bounce. This market is more critical now than at any point over the last 10 years.
Delivers exclusive COVID-19 variations economic data specific to your market.
To access the data contained in this document please email contactus@visiongain.com
Forecasts to 2032 and other analyses reveal the commercial prospects
• In addition to revenue forecasting to 2032, our new study provides you with recent results, growth rates, and market shares.
• You find original analyses, with business outlooks and developments.
• Discover qualitative analyses (including market dynamics, drivers, opportunities, restraints and challenges), cost structure, impact of rising offshore wind prices and recent developments.
This report includes data analysis and invaluable insight into how COVID-19 will affect the industry and your company. Four COVID-19 recovery patterns and their impact, namely, V, L, W and U are discussed in this report.
Segments Covered in this report
Market Segment by
• Market Value (USD Billion)
• Market Cumulative Installations (GW)
Market Segment by Location
• Shallow Water Installation
• Transitional Water Installation
• Deep Water Installation
Market Segment by Technology
• Horizontal-Axis Wind Turbines (HAWTs)
• Vertical-Axis Wind Turbine (VAWT)
• Diffuser-Augmented Wind Turbine (DAWT)
• Vortex Bladeless Technology
• Other Technology
Market Segment by Components
• Turbines
• Electrical Infrastructure
• Substructure
• Other Components
Market Segment by Type
• Floating
• Bottom Fixed

In addition to the revenue predictions for the overall world market and segments, you will also find revenue forecasts for 4 regional and 20 leading national markets:
Americas
• U.S.
• Canada
Europe
• UK
• Germany
• Netherlands
• Denmark
• Belgium
• Rest of Europe
Asia Pacific
• China
• Japan
• Taiwan
• Vietnam
• South Korea
• Rest of Asia Pacific
Need industry data? Please contact us today.
The report also includes profiles and for some of the leading companies in the Offshore Wind Power Market, 2022 to 2032, with a focus on this segment of these companies’ operations.
Leading companies and the potential for market growth
• ABB Ltd.
• DEME Group
• Doosan Heavy Industries & Construction Co Ltd
• Envision
• General Electric Company
• Hitachi, Ltd.
• Ming Yang Smart Energy Group Limited
• Nexans SA
• Nordex SE
• Rockwell Automation, Inc.
• Shanghai Electric Wind Power Equipment Co.
• Siemens Gamesa Renewable Energy SA
• Sinovel Wind Group Co., Ltd
• Vestas Wind Systems A/S
• Xinjiang Goldwind Science & Technology Co Ltd
Overall world revenue for Offshore Wind Power Market, 2022 to 2032 in terms of value the market will surpass US$35.99 billion in 2022, our work calculates. We predict strong revenue growth through to 2032. Our work identifies which organizations hold the greatest potential. Discover their capabilities, progress, and commercial prospects, helping you stay ahead.
How the Offshore Wind Power Market, 2022 to 2032 Market report helps you?
In summary, our 264-page report provides you with the following knowledge:
• Revenue forecasts to 2032 for Offshore Wind Power Market, 2022 to 2032 Market, with forecasts for market value, cumulative installations, location, technology components, type, each forecasted at a global and regional level– discover the industry’s prospects, finding the most lucrative places for investments and revenues
• Revenue forecasts to 2032 for 4 regional and 20 key national markets – See forecasts for the Offshore Wind Power Market, 2022 to 2032 market in Americas, Europe, Asia-Pacific. Also forecasted is the market in the US, Canada, Germany, France, UK, China, Japan, and Taiwan among other prominent economies.
• Prospects for established firms and those seeking to enter the market– including company profiles for 15 of the major companies involved in the Offshore Wind Power Market, 2022 to 2032 Market.
Find quantitative and qualitative analyses with independent predictions. Receive information that only our report contains, staying informed with this invaluable business intelligence.
Information found nowhere else
With our newly report title, you are less likely to fall behind in knowledge or miss out on opportunities. See how our work could benefit your research, analyses, and decisions. Visiongain’s study is for everybody needing commercial analyses for the Offshore Wind Power Market, 2022 to 2032 Market and leading companies. You will find data, trends and predictions.
To access the data contained in this document please email contactus@visiongain.com
Buy our report today Offshore Wind Power Market Report 2022-2032: Forecasts by Location (Shallow Water Installation, Transitional Water Installation, Deep Water Installation), by Technology (Horizontal-Axis Wind Turbines (HAWTs), Vertical-Axis Wind Turbine (VAWT), Diffuser-Augmented Wind Turbine (DAWT), Vortex Bladeless Technology, Other), by Components (Turbines, Electrical Infrastructure, Substructure, Other), by Type (Floating, Bottom Fixed) AND Regional and Leading National Market Analysis PLUS Analysis of Leading Companies AND COVID-19 Impact Analysis and Recovery Pattern Analysis. Avoid missing out by staying informed – order our report now.
Visiongain is a trading partner with the US Federal Government
CCR Ref number: KD4R6
Do you have any custom requirements we can help you with? Any need for a specific country, geo region, market segment or specific company information? Contact us today, we can discuss your needs and see how we can help: contactus@visiongain.com
1. Report Overview
1.1 Introduction to Offshore Wind Power Market
1.2 Global Offshore Wind Power Market Overview
1.2.1 California Plans to Produce 10 to 15 Gigawatts of Offshore Wind Energy by 2045
1.2.2 Norway Has Announced Plans to Significantly Increase Offshore Wind Energy Output by 2040
1.2.3 Heerema Marine Contractors Claims to Have Invented a New Way for Installing Offshore Floating Wind Farms
1.3 What Are the Objectives of this Report?
1.4 What is the Scope of the Report?
1.5 Offshore Wind Power Market Definition
1.6 Why You Should Read this Report
1.7 What this Report Delivers
1.8 Key Questions Answered by this Analytical Report Include:
1.9 Who is this Report for?
1.10 Research Methodology
1.10.1 Primary Research
1.10.2 Secondary Research
1.10.3 Market Evaluation & Forecasting Methodology
1.11 Frequently Asked Questions (FAQs)
1.12 Associated Visiongain Reports
1.13 About Visiongain
2 Executive Summary
2.1.1 International Energy Developer Totalenergies Has Been Named a Winner by the Bureau of Ocean Energy Management
2.1.2 New York's $1 Billion Grid Hub that Connects Enormous Amounts of Offshore Wind to an Old Fossil Fuel Plant
2.1.3 Following a Winter Break, Development on the Yunlin Offshore Wind Farm in Taiwan Has Restarted
2.1.4 The US Government Proposes to Lease an Area Roughly 17 Miles Off Morro Bay to Wind Energy Businesses
2.2 Market Segment Insights
3 Offshore Wind Industry Structure
3.1 Overview
3.2 Working of Offshore Wind Farm
3.3 Advantages of Offshore Wind Energy
3.3.1 Only a Few Natural Resources Are needed
3.3.2 Effectiveness
3.3.3 Significant Reduction in Noise Pollution
3.3.4 Sources of Renewable Energy
3.3.5 Cost-Effective
3.4 Innovations in the Offshore Wind Market
3.5 Models and Tools for Wind Energy
3.5.1 Models
3.5.1.1 System Advisor Model (SAM)
3.5.1.2 Jobs and Economic Development Impacts (JEDI) Models
3.5.1.3 Small Wind Economic ModelMicrosoft Excel
3.5.1.4 Regional Energy Deployment System Model
3.5.1.5 Renewable Energy Potential (reV) Model
3.5.1.6 Distributed Generation Market Demand (dGenTM) Model
3.5.2 Tools
3.5.2.1 Wind Energy Permitting Toolkits
3.5.2.2 Energy Zones Mapping Tool
3.5.2.3 DoD Siting Clearinghouse
3.5.2.4 West-Wide Wind Mapping Project
3.5.2.5 Renewable Energy Integration and Optimization (REopt) Tool
3.5.2.6 RE-Powering’s Electronic Decision Tree
3.5.2.7 Wind Prospector
3.5.2.8 United States Wind Turbine Database
3.5.2.9 State and Local Planning for Energy (SLOPE) Platform
3.5.2.10 State Statutes on Wind Facility Siting
3.5.2.11 Northeast Ocean Data Portal
3.5.2.12 OceanReports
3.5.2.13 WindView
3.6 The Owner Act
4 Global Market Dynamics
4.1 Market Drivers, Restraints, Opportnities and Challenges
4.1.1 Market Driving Factors
4.1.1.1 Price Volatility in the International Markets Boost the Industry
4.1.1.2 Cost Reduction in the Offshore Wind Power Set-Up is Helping in Market Growth
4.1.1.3 Stable Revenue is an Added Advantage
4.1.2 Market Restraining Factors
4.1.2.1 Unpredictable Wind Patterns Can Cause Energy Production to Fluctuate
4.1.2.2 Offshore Wind Farms Can Disturb the Marine Habitat
4.1.3 Opportunities in the Global Market
4.1.3.1 Continuous Innovations Are Required in Order to Deal with Unprecedented Incidents
4.1.3.2 With Rising Demands, Collaboration with Other Sectors Will Required in Future
4.1.4 Challenges in the Global Market
4.1.4.1 The Expenses Are Still Quite High
4.1.4.2 Problems Like Unanticipated Cable Failure, Increased Offshore Grid Costs Pose Major Hurdles
4.2 SWOT Analysis
4.2.1 Market Strengths
4.2.1.1 The Offshore Wind Energy Industry Has Long-Term Viability
4.2.1.2 Offshore Wind Energy Has Low Impact on the Environment
4.2.2 Market Weaknesses
4.2.2.1 Restrictions in Terms of Location
4.2.2.2 Maintenance and Repair Are Expensive
4.2.3 Market Opportunities
4.2.3.1 The Offshore Wind Power Market to Create Plathora of Jobs in Various Other Sectors
4.2.3.2 MSP Can May Bring the Decarbonisation, Biodiversity, and SDGs Together
4.2.4 Market Threats
4.2.4.1 High Risk of Investment Involved
4.2.4.2 Excessive Reliance on Technology
4.3 PEST Analysis
Source: Visiongain Reports Ltd., 2022
4.3.1 Political Factors
4.3.1.1 Properly Curated Legislative Structure is of Prime Importance
4.3.1.2 Local Governments Play a Vital Role in Offshore Wind Power Market Progress
4.3.2 Economical Factors
4.3.2.1 The Electricity Market is Still Going Through Transitions
4.3.2.2 Customers of Forced to Change their Buying Behavior with Changing Demands and Services
4.3.3 Social Factors
4.3.3.1 Offshore Wind Power Market is Reviving Coastal Areas
4.3.3.2 Mobilisation of Employees Takes Place Along with Creating New Jobs
4.3.4 Technological Factors
4.3.4.1 In-Depth Research is Required in Order to Get Positive Results
4.3.4.2 Technologies Like SWIFT, HAZOP, FTA, etc. Must be Used by Companies to Stay Ahead in the Market
4.4 Porter’s Analysis
4.4.1 Industry Rivalry
4.4.2 Bargaining Power of Buyers
4.4.3 Threat of New Entrants
4.4.4 Bargaining Power of Suppliers
4.4.5 Threat of Substitutes
4.5 Recent Developments in the Global Market
4.5.1 The Carolina Long Bay Offshore Wind Auction Included a New 20 Percent Credit for Bidders
4.5.2 Commercial and Recreational Fishing Businesses Have Raised Concerns About the Offshore Projects
4.5.3 Orsted Created the First Offshore Wind Farm in Rhode Island
4.5.4 TotalEnergies, a French Energy Company, Has Begun Construction on the Eolmed Project
4.5.5 The National Petroleum Development Company (NPCC) of Abu Dhabi Has Been Awarded a Contract to Install the Remaining Monopiles on the 640 MW Yunlin Wind Farm Off the Coast of Taiwan
4.5.6 The First GE Haliade 150-6 Megawatt (MW) Wind Turbine Has Been Installed in St. Nazaire, France's First Offshore Wind Farm
4.5.7 TotalEnergies is Partnering with Green Investment Group and Qair to Create a Floating Wind Farm in Brittany
4.5.8 Towing of 11 Concrete SPAR-Type Floating Foundations for the 88 MW Hywind Tampen Offshore Wind Farm Has Begun
4.5.9 Olympic Wind is a Project Developed by Trident Winds
4.5.10 iXblue Performed the Bathymetric Survey at the Saint-Nazaire Offshore Wind Project Site (USV)
4.5.11 The Lithuanian Energy Agency Has Chosen EOLOS Floating Lidar Solutions from Spain to Undertake Hydrometeorological Measurements
4.5.12 Eversource is Collaborating with Orsted of Denmark on the South Fork Wind Farm
4.5.13 The Nordsee One Offshore Wind Farm Has Begun a Major Turbine Component Exchange
5 Global Offshore Wind Power Market Analysis
5.1 Global Market Outlook
5.1.1 Although New, Offshore Wind is Fast Gaining Traction
5.1.2 Future Trends in Offshore Wind Market
5.1.3 Shell and Eneco Have Formed Joint Ventures to Compete in Offshore Wind Tenders
5.1.4 Plenitude, an Eni Affiliate, Will Invest in Enerocean, a Spanish Floating Offshore Wind Company
5.2 Global Market Size Estimation and Forecast by Value
5.3 Regional Market Size Estimation and Forecast by Value
5.4 Global Market Size Estimation and Forecast by Location
5.4.1 Shallow Water Installation
5.4.2 Transitional Water Installation
5.4.3 Deep Water Installation
5.5 Global Market Size Estimation and Forecast by Technology
5.5.1 Horizontal-Axis Wind Turbines (HAWTs)
5.5.2 Vertical-Axis Wind Turbine (VAWT)
5.5.3 Diffuser-Augmented Wind Turbine (DAWT)
5.5.4 Vortex Bladeless Technology
5.6 Global Market Size Estimation and Forecast by Components
5.6.1 Turbines
5.6.2 Electrical Infrastructure
5.6.3 Substructure
5.6.4 Other Components
5.6.4.1 Offshore Substations
5.6.4.2 Subsea Cables
5.7 Global Market Size Estimation and Forecast by Type
5.7.1 Floating
5.7.2 Bottom Fixed
6 COVID-19 Impact on the Industry
6.1 The Industry Recovered Inspite of the Worldwide COVID Outbreak
6.2 The Pandemic Hastens Changes in the Global Energy Landscape
6.3 COVID-19 Resulted in Significant Delays
6.4 Global Market Size Estimation and Forecast
6.4.1 Post-COVID-19 Market Scenarios (V-Shaped Recovery Analysis)
6.4.2 Post-COVID-19 Market Scenarios (W-Shaped Recovery Analysis)
6.4.3 Post-COVID-19 Market Scenarios (U-Shaped Recovery Analysis)
6.4.4 Post-COVID-19 Market Scenarios (L-Shaped Recovery Analysis)
6.5 Global Market Size Estimation and Forecast by Region
6.5.1 Post-COVID-19 Market Scenarios (V-Shaped Recovery Analysis)
6.5.2 Post-COVID-19 Market Scenarios (W-Shaped Recovery Analysis)
6.5.3 Post-COVID-19 Market Scenarios (U-Shaped Recovery Analysis)
6.5.4 Post-COVID-19 Market Scenarios (L-Shaped Recovery Analysis)
7 Americas Offshore Wind Power Market Analysis
7.1 Americas Market Outlook
7.1.1 Offshore Wind Has a Lot of Promise in the Americas
7.1.2 Key Highlights on the Region
7.1.3 New Jersey's First Offshore Wind Farm, to be Built South of Long Beach Island, Off the Coast of Atlantic City
7.2 Americas Market Size Estimation and Forecast
7.3 Country Market Size Estimation and Forecast
7.4 Americas Market Size Estimation and Forecast by Location
7.5 Americas Market Size Estimation and Forecast by Technology
7.6 Americas Market Size Estimation and Forecast by Components
7.7 Americas Market Size Estimation and Forecast by Type
7.8 US Offshore Wind Power Market Analysis
7.8.1 US Offshore Wind Profile
7.8.2 At the State Level, there is a Lot of Momentum for Offshoe Wind
7.8.3 New Hybrid SOV to be Supplied by Edison for New York Offshore Wind Projects
7.9 Canada Offshore Wind Power Market Analysis
7.9.1 Canada Offshore Wind Outlook
7.9.2 Eastern Canada Might be Powered by Offshore Winds
8 Europe Offshore Wind Power Market Analysis
8.1 Europe Market Outlook
8.1.1 Europe Offshore Wind Profile
8.1.2 The Offshore Wind Business in Europe is Booming
8.1.3 Eolus Vind, Based in Sweden, Has Applied to Build Three Offshore Wind Farms in the Polish Baltic Sea
8.2 Europe Market Size Estimation and Forecast
8.3 Country Market Size Estimation and Forecast
8.4 Europe Market Size Estimation and Forecast by Location
8.5 Europe Market Size Estimation and Forecast by Technology
8.6 Europe Market Size Estimation and Forecast by Components
8.7 Europe Market Size Estimation and Forecast by Type
8.8 Germany Offshore Wind Power Market Analysis
8.8.1 Germany Offshore Wind Outlook
8.8.2 BSH is Revamping its Maritime Spatial Plan
8.9 UK Offshore Wind Power Market Analysis
8.9.1 The UK's Electrical Mix Includes a Significant Amount of Wind Energy
8.9.2 The United Kingdom is at an Ideal Location for Harnessing Wind Energy
8.10 Netherlands Offshore Wind Power Market Analysis
8.10.1 The Netherlands is Accelerating its Ambition to Double Offshore Wind Generation by 2030
8.10.2 The 759 MW Project Will be Built in the Netherlands by a Shell-Eneco Collaboration
8.10.3 BP Has Formally Submitted Bids for Two Offshore Wind Licences in the Netherlands
8.11 Denmark Offshore Wind Power Market Analysis
8.11.1 Denmark Aims to Expand its Offshore Wind Power Capacity
8.11.2 In the North Sea and the Baltic Sea, the Danish Government Approved Two "Energy Islands"
8.11.3 Cadeler Will Have Five Vessels in its Fleet, Making it the Largest and Most Competent Jack-Up Fleet in the Offshore Wind Business
8.12 Belgium Offshore Wind Power Market Analysis
8.12.1 Offshore Wind Outlook of Belgium
8.12.2 The Belgian North Sea's Offshore Tender and Potential Wind Farms
8.13 Rest of Europe Offshore Wind Power Market Analysis
8.13.1 France to Increase its Offshore Wind Capacity
8.13.2 Poland is Making a Strong Foothold in the Industry
8.13.3 Greenalia (Spain) to Proceed with Greater Precision with the Design of the Floating Structures for Offshote Wind Farm
8.13.4 The Beleolico Offshore Wind Farm in Italy is Now Ready to Link to the National Electricity Grid
9 Asia-Pacific Offshore Wind Power Market Analysis
9.1 Asia-Pacific Market Outlook
9.1.1 Asia-Pacific Offshore Wind Power Market is Expanding Rapidly
9.2 Asia-Pacific Market Size Estimation and Forecast
9.3 Country Market Size Estimation and Forecast
9.4 Asia-Pacific Market Size Estimation and Forecast by Location
9.5 Asia-Pacific Market Size Estimation and Forecast by Technology
9.6 Asia-Pacific Market Size Estimation and Forecast by Components
9.7 Asia-Pacific Market Size Estimation and Forecast by Type
9.8 China Offshore Wind Power Market Analysis
9.8.1 Offshore Wind Power Market Profile of China
9.8.2 China is Emerging as the Market Leader Leaving Behind the UK
9.9 Japan Offshore Wind Power Market Analysis
9.9.1 Offshore Wind Power Market is Taking Off in Japan
9.9.2 International Players Are Forming Alliances with Local Japanese Firms
9.10 South Korea Offshore Wind Power Market Analysis
9.10.1 Offshore Wind is Supported by a Strong Local Industrial Base in South Korea
9.10.2 Offshore Wind Development is Projected to be Accelerated Owing to International Cooperation
9.10.3 Vena Energy and Korea Midland Power Co. Ltd. (KOMIPO) Collaborated for 384 MW Offshore Wind Project at Yokji Island
9.11 Taiwan Offshore Wind Power Market Analysis
9.11.1 Offshore Wind Profile of Taiwan
9.11.2 New Goal Demonstrates Ambitions, but Obstacles Remain in Taiwan
9.11.3 Taiwan's Total Deployed Offshore Wind Capacity to Grow Further
9.11.4 Seajacks Zaratan Has Been Contracted by Siemens Gamesa to Provide Transportation and Installation of Wind Turbines at the Yunlin Wind Farm Off the Coast of Taiwan
9.11.5 The 640MW Yunlin Offshore Wind Farm is Being Developed in the Taiwan Strait by Yunneng Wind Power
9.12 Vietnam Offshore Wind Power Market Analysis
9.12.1 Vietnam’s Offshore Wind Outlook
9.12.2 Vietnam is Currently Developing an Offshore Wind Farm
9.13 Rest of Asia-Pacific Offshore Wind Power Market Analysis
9.13.1 India's Long-Term Energy Transformation Ambitions and the Importance of Offshore Wind to the Country
9.13.2 Offshore Wind Roadmap Has Been Launched by Philippines
9.13.3 Hongkong Electric Company (HK Electric), Has Unveiled Plans to Develop and Operate a 150 MW Offshore Wind Farm by 2027
10 Competitive Landscape
10.1 Company Market Share Analysis
10.2 Key Business Strategy Analysis
10.3 New Product/Service Launch as the Key Business Strategy in the Global Market
10.4 Acquisition as the Key Business Strategy in the Global Market
10.5 Partnership as the Key Business Strategy in the Global Market
10.6 Collaboration as the Key Business Strategy in the Global Market
10.7 Expansion as the Key Business Strategy in the Global Market
10.8 Joint Venture as the Key Business Strategy in the Global Market
10.9 Other Key Business Strategies in the Global Market
11 Leading Company Profiles
11.1 General Electric
11.1.1 Company Snapshot
11.1.2 Company Overview
11.1.3 Company Financial Profile
11.1.4 Company Product Benchmarking
11.1.5 Company Recent Developments
11.2 Vestas Wind Systems A/S
11.2.1 Company Snapshot
11.2.2 Company Overview
11.2.3 Company Financial Profile
11.2.4 Company Product Benchmarking
11.2.5 Company Recent Developments
11.3 Siemens Gamesa Renewable Energy SA
11.3.1 Company Snapshot
11.3.2 Company Overview
11.3.3 Company Financial Profile
11.3.4 Company Product Benchmarking
11.3.5 Company Recent Developments
11.4 Xinjiang Goldwind Science & Technology Co Ltd
11.4.1 Company Snapshot
11.4.2 Company Overview
11.4.3 Company Financial Profile
11.4.4 Company Product Benchmarking
11.4.5 Company Recent Developments
11.5 Shanghai Electric Wind Power Equipment Co.
11.5.1 Company Snapshot
11.5.2 Company Overview
11.5.3 Company Financial Profile
11.5.4 Company Product Benchmarking
11.5.5 Company Recent Developments
11.6 ABB Ltd
11.6.1 Company Snapshot
11.6.2 Company Overview
11.6.3 Company Financial Profile
11.6.4 Company Product Benchmarking
11.6.5 Company Recent Developments
11.7 Doosan Heavy Industries and Construction
11.7.1 Company Snapshot
11.7.2 Company Overview
11.7.3 Company Financial Profile
11.7.4 Company Product Benchmarking
11.7.5 Company Recent Developments
11.8 Hitachi Ltd.
11.8.1 Company Snapshot
11.8.2 Company Overview
11.8.3 Company Financial Profile
11.8.4 Company Product Benchmarking
11.8.5 Company Recent Developments
11.9 Nexans SA
11.9.1 Company Snapshot
11.9.2 Company Overview
11.9.3 Company Financial Profile
11.9.4 Company Product Benchmarking
11.9.5 Company Recent Developments
11.10 DEME Group
11.10.1 Company Snapshot
11.10.2 Company Overview
11.10.3 Company Product Benchmarking
11.10.4 Company Recent Developments
11.11 Ming Yang Smart Energy Group Co
11.11.1 Company Snapshot
11.11.2 Company Overview
11.11.3 Company Financial Profile
11.11.4 Company Product Benchmarking
11.12 Envision
11.12.1 Company Snapshot
11.12.2 Company Overview
11.12.3 Company Product Benchmarking
11.12.4 Company Recent Developments
11.13 Rockwell Automation Inc.
11.13.1 Company Snapshot
11.13.2 Company Overview
11.13.3 Company Financial Profile
11.13.4 Company Product Benchmarking
11.13.5 Company Recent Developments
11.14 Nordex SE
11.14.1 Company Snapshot
11.14.2 Company Overview
11.14.3 Company Financial Profile
11.14.4 Company Product Benchmarking
11.14.5 Company Recent Developments
11.15 Sinovel Wind Group Co., Ltd
11.15.1 Company Snapshot
11.15.2 Company Overview
11.15.3 Company Product Benchmarking
12 Conclusion and Recommendations
12.1 Conclusion
12.2 Recommendations
List of Tables
Table 1. Global Offshore Wind Power Market Forecast, 2022-2032 (USD Bn, AGR (%), CAGR(%))
Table 2. Global Offshore Wind Power Market Snapshot, 2022 & 2032 (US$billion, CAGR %)
Table 3. Global Offshore Wind Power Market Forecast, 2022-2032 (USD Bn, AGR (%), CAGR(%))
Table 4. Global Offshore Wind Power Market Forecast by Cumulative Installation, 2022-2032 (GW, AGR (%), CAGR(%))
Table 5. Global Offshore Wind Power Market by Region, 2022-2032 (USD Bn, AGR (%), CAGR(%))
Table 6. Global Offshore Wind Power Market by Region, 2022-2032 (GW, AGR (%), CAGR(%))
Table 7. Global Offshore Wind Power Market by Location, 2022-2032 (USD Bn, AGR (%), CAGR(%))
Table 8. Global Offshore Wind Power Market by Technology, 2022-2032 (USD Bn, AGR (%), CAGR(%))
Table 9. Global Offshore Wind Power Market by Components, 2022-2032 (USD Bn, AGR (%), CAGR(%))
Table 10. Global Offshore Wind Power Market by Type, 2022-2032 (USD Bn, AGR (%), CAGR(%))
Table 11. Global Offshore Wind Power Market Forecast, 2022-2032 (USD Bn, AGR (%), CAGR(%)) (V-Shaped Recovery Scenario Analysis)
Table 12. Global Offshore Wind Power Market Forecast, 2022-2032 (USD Bn, AGR (%), CAGR(%)) (W-Shaped Recovery Scenario Analysis)
Table 13. Global Offshore Wind Power Market Forecast, 2022-2032 (USD Bn, AGR (%), CAGR(%)) (U-Shaped Recovery Scenario Analysis)
Table 14. Global Offshore Wind Power Market Forecast, 2022-2032 (USD Bn, AGR (%), CAGR(%)) (L-Shaped Recovery Scenario Analysis)
Table 15. Global Offshore Wind Power Market by Region, 2022-2032 (USD Bn, AGR (%), CAGR(%)) (V-Shaped Recovery Scenario Analysis)
Table 16. Global Offshore Wind Power Market by Region, 2022-2032 (USD Bn, AGR (%), CAGR(%)) (W-Shaped Recovery Scenario Analysis)
Table 17. Global Offshore Wind Power Market by Region, 2022-2032 (USD Bn, AGR (%), CAGR(%)) (U-Shaped Recovery Scenario Analysis)
Table 18. Global Offshore Wind Power Market by Region, 2022-2032 (USD Bn, AGR (%), CAGR(%)) (L-Shaped Recovery Scenario Analysis)
Table 19. Americas Offshore Wind Power Market by Value, 2022-2032 (USD Bn, AGR (%), CAGR(%))
Table 20. Americas Offshore Wind Power Market by Cumulative Installation, 2022-2032 (GW, AGR (%), CAGR(%))
Table 21. Americas Offshore Wind Power Market Cumulative Installation by Country, 2022-2032 (GW, AGR (%), CAGR(%))
Table 22. Americas Offshore Wind Power Market by Location, 2022-2032 (USD Bn, AGR (%), CAGR(%))
Table 23. Americas Offshore Wind Power Market by Technology, 2022-2032 (USD Bn, AGR (%), CAGR(%))
Table 24. Americas Offshore Wind Power Market by Components, 2022-2032 (USD Bn, AGR (%), CAGR(%))
Table 25. Americas Offshore Wind Power Market by Type, 2022-2032 (USD Bn, AGR (%), CAGR(%))
Table 26. US Offshore Wind Power Market by Value, 2022-2032 (USD Bn, AGR (%), CAGR(%))
Table 27. US Offshore Wind Power Market by Cumulative Installation, 2022-2032 (GW, AGR (%), CAGR(%))
Table 28. Canada Offshore Wind Power Market by Value, 2022-2032 (USD Bn, AGR (%), CAGR(%))
Table 29. Canada Offshore Wind Power Market by Cumulative Installation, 2022-2032 (GW, AGR (%), CAGR(%))
Table 30. Europe Offshore Wind Power Market by Value, 2022-2032 (USD Bn, AGR (%), CAGR(%))
Table 31. Europe Offshore Wind Power Market by Cumulative Installation, 2022-2032 (GW, AGR (%), CAGR(%))
Table 32. Europe Offshore Wind Power Market by Country, 2022-2032 (USD Bn, AGR (%), CAGR(%))
Table 33. Europe Offshore Wind Power Market Cumulative Installation by Country, 2022-2032 (GW, AGR (%), CAGR(%))
Table 34. Europe Offshore Wind Power Market by Location, 2022-2032 (USD Bn, AGR (%), CAGR(%))
Table 35. Europe Offshore Wind Power Market by Technology, 2022-2032 (USD Bn, AGR (%), CAGR(%))
Table 36. Europe Offshore Wind Power Market by Components, 2022-2032 (USD Bn, AGR (%), CAGR(%))
Table 37. Europe Offshore Wind Power Market by Type, 2022-2032 (USD Bn, AGR (%), CAGR(%))
Table 38. Germany Offshore Wind Power Market by Value, 2022-2032 (USD Bn, AGR (%), CAGR(%))
Table 39. Germany Offshore Wind Power Market by Cumulative Installation, 2022-2032 (GW, AGR (%), CAGR(%))
Table 40. UK Offshore Wind Power Market by Value, 2022-2032 (USD Bn, AGR (%), CAGR(%))
Table 41. UK Offshore Wind Power Market by Cumulative Installation, 2022-2032 (GW, AGR (%), CAGR(%))
Table 42. Netherlands Offshore Wind Power Market by Value, 2022-2032 (USD Bn, AGR (%), CAGR(%))
Table 43. Netherlands Offshore Wind Power Market by Cumulative Installation, 2022-2032 (GW, AGR (%), CAGR(%))
Table 44. Denmark Offshore Wind Power Market by Value, 2022-2032 (USD Bn, AGR (%), CAGR(%))
Table 45. Denmark Offshore Wind Power Market by Cumulative Installation, 2022-2032 (GW, AGR (%), CAGR(%))
Table 46. Belgium Offshore Wind Power Market by Value, 2022-2032 (USD Bn, AGR (%), CAGR(%))
Table 47. Belgium Offshore Wind Power Market by Cumulative Installation, 2022-2032 (GW, AGR (%), CAGR(%))
Table 48. Rest of Europe Offshore Wind Power Market by Value, 2022-2032 (USD Bn, AGR (%), CAGR(%))
Table 49. Rest of Europe Offshore Wind Power Market by Cumulative Installation, 2022-2032 (GW, AGR (%), CAGR(%))
Table 50. Asia-Pacific Offshore Wind Power Market by Value, 2022-2032 (USD Bn, AGR (%), CAGR(%))
Table 51. Asia-Pacific Offshore Wind Power Market by Cumulative Installation, 2022-2032 (GW, AGR (%), CAGR(%))
Table 52. Asia-Pacific Offshore Wind Power Market by Country, 2022-2032 (USD Bn, AGR (%), CAGR(%))
Table 53. Asia-Pacific Offshore Wind Power Market Cumulative Installation by Country, 2022-2032 (GW, AGR (%), CAGR(%))
Table 54. Asia-Pacific Offshore Wind Power Market by Location, 2022-2032 (USD Bn, AGR (%), CAGR(%))
Table 55. Asia-Pacific Offshore Wind Power Market by Technology, 2022-2032 (USD Bn, AGR (%), CAGR(%))
Table 56. Asia-Pacific Offshore Wind Power Market by Components, 2022-2032 (USD Bn, AGR (%), CAGR(%))
Table 57. Asia-Pacific Offshore Wind Power Market by Type, 2022-2032 (USD Bn, AGR (%), CAGR(%))
Table 58. China Offshore Wind Power Market by Value, 2022-2032 (USD Bn, AGR (%), CAGR(%))
Table 59. China Offshore Wind Power Market by Cumulative Installation, 2022-2032 (GW, AGR (%), CAGR(%))
Table 60. Japan Offshore Wind Power Market by Value, 2022-2032 (USD Bn, AGR (%), CAGR(%))
Table 61. Japan Offshore Wind Power Market by Cumulative Installation, 2022-2032 (GW, AGR (%), CAGR(%))
Table 62. South Korea Offshore Wind Power Market by Value, 2022-2032 (USD Bn, AGR (%), CAGR(%))
Table 63. South Korea Offshore Wind Power Market by Cumulative Installation, 2022-2032 (GW, AGR (%), CAGR(%))
Table 64. Taiwan Offshore Wind Power Market by Value, 2022-2032 (USD Bn, AGR (%), CAGR(%))
Table 65. Taiwan Offshore Wind Power Market by Cumulative Installation, 2022-2032 (GW, AGR (%), CAGR(%))
Table 66. Vietnam Offshore Wind Power Market by Value, 2022-2032 (USD Bn, AGR (%), CAGR(%))
Table 67. Vietnam Offshore Wind Power Market by Cumulative Installation, 2022-2032 (GW, AGR (%), CAGR(%))
Table 68. Rest of Asia-Pacific Offshore Wind Power Market by Value, 2022-2032 (USD Bn, AGR (%), CAGR(%))
Table 69. Rest of Asia-Pacific Offshore Wind Power Market by Cumulative Installation, 2022-2032 (GW, AGR (%), CAGR(%))
Table 70. New Product/Service Launch Strategy Adopted by Key Players in Global Offshore Wind Market, 2020-2022
Table 71. Acquisition Strategy Adopted by Key Players in Global Offshore Wind Market, 2020-2022
Table 72. Partnership Strategy Adopted by Key Players in Global Offshore Wind Market, 2020-2022
Table 73. Collaboration Strategy Adopted by Key Players in Global Offshore Wind Market, 2020-2022
Table 74. Expansion Strategy Adopted by Key Players in Global Offshore Wind Market, 2020-2022
Table 75. Joint Venture Strategy Adopted by Key Players in Global Offshore Wind Market, 2020-2022
Table 76. Other Strategies Adopted by Key Players in Global Offshore Wind Market, 2020-2022
Table 77. General Electric: Company Information
Table 78. General Electric: Company Revenue 2017-2021 (US$Mn, AGR %)
Table 79. General Electric: Company Product and Service Benchmarking
Table 80. General Electric: Company Recent Developments
Table 81. Vestas: Company Information
Table 82. Vestas: Company Revenue 2017-2021 (US$Mn, AGR %)
Table 83. Vestas: Company Product and Service Benchmarking
Table 84. Vestas: Company Recent Developments
Table 85. Siemens Gamesa: Company Information
Table 86. Siemens Gamesa: Company Revenue 2017-2021 (US$Mn, AGR %)
Table 87. Siemens Gamesa: Company Product and Service Benchmarking
Table 88. Siemens Gamesa: Company Recent Developments
Table 89. Xinjiang Goldwind Science & Technology: Company Information
Table 90. Xinjiang Goldwind Science & Technology: Company Revenue 2017-2021 (US$Mn, AGR %)
Table 91. Xinjiang Goldwind Science & Technology: Company Product and Service Benchmarking
Table 92. Xinjiang Goldwind Science & Technology: Company Recent Developments
Table 93. Shanghai Electric: Company Information
Table 94. Shanghai Electric: Company Revenue 2017-2021 (US$Mn, AGR %)
Table 95. Shanghai Electric: Company Product and Service Benchmarking
Table 96. Shanghai Electric: Company Recent Developments
Table 97. Abb: Company Information
Table 98. Abb: Company Revenue 2017-2021 (US$Mn, AGR %)
Table 99. Abb: Company Product and Service Benchmarking
Table 100. Abb: Company Recent Developments
Table 101. Doosan: Company Information
Table 102. Doosan: Company Revenue 2017-2021 (US$Mn, AGR %)
Table 103. Doosan: Company Product and Service Benchmarking
Table 104. Doosan: Company Recent Developments
Table 105. Hitachi: Company Information
Table 106. Hitachi: Company Revenue 2017-2021 (US$Mn, AGR %)
Table 107. Hitachi: Company Product and Service Benchmarking
Table 108. Hitachi: Company Recent Developments
Table 109. Nexans: Company Information
Table 110. Nexans: Company Revenue 2017-2021 (US$Mn, AGR %)
Table 111. Nexans: Company Product and Service Benchmarking
Table 112. Nexans: Company Recent Developments
Table 113. DEME: Company Information
Table 114. DEME: Company Product and Service Benchmarking
Table 115. DEME: Company Recent Developments
Table 116. Ming Yang Smart Energy Group Limited: Company Information
Table 117. Ming Yang Smart Energy Group Limited: Company Revenue 2017-2021 (US$Mn, AGR %)
Table 118. Ming Yang Smart Energy Group Limited: Company Product and Service Benchmarking
Table 119. Envision: Company Information
Table 120. Envision: Company Product and Service Benchmarking
Table 121. Envision: Company Recent Developments
Table 122. Rockwell Automation: Company Information
Table 123. Rockwell Automation: Company Revenue 2017-2021 (US$Mn, AGR %)
Table 124. Rockwell Automation: Company Product and Service Benchmarking
Table 125. Rockwell Automation: Company Recent Developments
Table 126. Nordex SE: Company Information
Table 127. Nordex SE: Company Revenue 2017-2021 (US$Mn, AGR %)
Table 128. Nordex SE: Company Product and Service Benchmarking
Table 129. Nordex SE: Company Recent Developments
Table 130. Sinovel: Company Information
Table 131. Sinovel: Company Product and Service Benchmarking
List of Figures
Figure 1. Global Offshore Wind Power Market Forecast, 2022-2032 (USD Bn, AGR (%))
Figure 2. Global Offshore Wind Power Market Segmentation
Figure 3. Dudgeon wind farm, United Kingdom
Figure 4. Offshore Wind Farm Layout
Figure 5. Market Drivers, Restraints, Opportunities, Challenges
Figure 6. SWOT Analysis
Figure 7. PEST Analysis
Figure 8. Porters Five Forces
Figure 9. Global Offshore Wind Power Market Forecast, 2022-2032 (USD Bn, AGR (%))
Figure 10. Global Offshore Wind Power Market Forecast by Cumulative Installation, 2022-2032 (GW, AGR (%))
Figure 11. Global Offshore Wind Power Market by Region, 2022-2032 (USD Bn, AGR (%))
Figure 12. Global Offshore Wind Power Market by Region, 2022-2032 (GW, AGR (%))
Figure 13. Shallow Water Foundations – Present Options
Figure 14. Transitional Substructure Technology
Figure 15. Technology Progression for Offshore Wind Turbines
Figure 16. Global Offshore Wind Power Market by Location, 2022-2032 (USD Bn, AGR (%))
Figure 17. 64m Horizontal Axis Wind Turbine
Figure 18. Global Offshore Wind Power Market by Technology, 2022-2032 (USD Bn, AGR (%))
Figure 19. Global Offshore Wind Power Market by Components, 2022-2032 (USD Bn, AGR (%))
Figure 20. Global Offshore Wind Power Market by Type, 2022-2032 (USD Bn, AGR (%))
Figure 21. Global Offshore Wind Power Market Forecast, 2022-2032 (USD Bn, AGR (%)) (V-Shaped Recovery Scenario Analysis)
Figure 22. Global Offshore Wind Power Market Forecast, 2022-2032 (USD Bn, AGR (%))(W-Shaped Recovery Scenario Analysis)
Figure 23. Global Offshore Wind Power Market Forecast, 2022-2032 (USD Bn, AGR (%))(U-Shaped Recovery Scenario Analysis)
Figure 24. Global Offshore Wind Power Market Forecast, 2022-2032 (USD Bn, AGR (%))(L-Shaped Recovery Scenario Analysis)
Figure 25. Global Offshore Wind Power Market by Region, 2022-2032 (USD Bn, AGR (%))(V-Shaped Recovery Scenario Analysis)
Figure 26. Global Offshore Wind Power Market by Region, 2022-2032 (USD Bn, AGR (%))(W-Shaped Recovery Scenario Analysis)
Figure 27. Global Offshore Wind Power Market by Region, 2022-2032 (USD Bn, AGR (%))(U-Shaped Recovery Scenario Analysis)
Figure 28. Global Offshore Wind Power Market by Region, 2022-2032 (USD Bn, AGR (%))(L-Shaped Recovery Scenario Analysis)
Figure 29. Americas Offshore Wind Power Market by Value, 2022-2032 (USD Bn, AGR (%))
Figure 30. Americas Offshore Wind Power Market by Cumulative Installation, 2022-2032 (GW, AGR (%))
Figure 31. Americas Offshore Wind Power Market by Cumulative Installation by Country, 2022-2032 (GW, AGR (%))
Figure 32. Americas Offshore Wind Power Market by Location, 2022-2032 (USD Bn, AGR (%))
Figure 33. Americas Offshore Wind Power Market by Technology, 2022-2032 (USD Bn, AGR (%))
Figure 34. Americas Offshore Wind Power Market by Components, 2022-2032 (USD Bn, AGR (%))
Figure 35. Americas Offshore Wind Power Market by Type, 2022-2032 (USD Bn, AGR (%))
Figure 36. US Offshore Wind Power Market by Value, 2022-2032 (USD Bn, AGR (%))
Figure 37. US Offshore Wind Power Market by Cumulative Installation, 2022-2032 (GW, AGR (%))
Figure 38. Canada Offshore Wind Power Market by Value, 2022-2032 (USD Bn, AGR (%))
Figure 39. Canada Offshore Wind Power Market by Cumulative Installation, 2022-2032 (GW, AGR (%))
Figure 40. Europe Offshore Wind Power Market by Value, 2022-2032 (USD Bn, AGR (%))
Figure 41. Europe Offshore Wind Power Market by Cumulative Installation, 2022-2032 (GW, AGR (%))
Figure 42. Europe Offshore Wind Power Market by Country, 2022-2032 (USD Bn, AGR (%))
Figure 43. Europe Offshore Wind Power Market by Cumulative Installation by Country, 2022-2032 (GW, AGR (%))
Figure 44. Europe Offshore Wind Power Market by Location, 2022-2032 (USD Bn, AGR (%))
Figure 45. Europe Offshore Wind Power Market by Technology, 2022-2032 (USD Bn, AGR (%))
Figure 46. Europe Offshore Wind Power Market by Components, 2022-2032 (USD Bn, AGR (%))
Figure 47. Europe Offshore Wind Power Market by Type, 2022-2032 (USD Bn, AGR (%))
Figure 48. Germany Offshore Wind Power Market by Value, 2022-2032 (USD Bn, AGR (%))
Figure 49. Germany Offshore Wind Power Market by Cumulative Installation, 2022-2032 (GW, AGR (%))
Figure 50. UK Offshore Wind Power Market by Value, 2022-2032 (USD Bn, AGR (%))
Figure 51. UK Offshore Wind Power Market by Cumulative Installation, 2022-2032 (GW, AGR (%))
Figure 52. Netherlands Offshore Wind Power Market by Value, 2022-2032 (USD Bn, AGR (%))
Figure 53. Netherlands Offshore Wind Power Market by Cumulative Installation, 2022-2032 (GW, AGR (%))
Figure 54. Denmark Offshore Wind Power Market by Value, 2022-2032 (USD Bn, AGR (%))
Figure 55. Denmark Offshore Wind Power Market by Cumulative Installation, 2022-2032 (GW, AGR (%))
Figure 56. Belgium Offshore Wind Power Market by Value, 2022-2032 (USD Bn, AGR (%))
Figure 57. Belgium Offshore Wind Power Market by Cumulative Installation, 2022-2032 (GW, AGR (%))
Figure 58. Rest of Europe Offshore Wind Power Market by Value, 2022-2032 (USD Bn, AGR (%))
Figure 59. Rest of Europe Offshore Wind Power Market by Cumulative Installation, 2022-2032 (GW, AGR (%))
Figure 60. Asia-Pacific Offshore Wind Power Market by Value, 2022-2032 (USD Bn, AGR (%))
Figure 61. Asia-Pacific Offshore Wind Power Market by Cumulative Installation, 2022-2032 (GW, AGR (%))
Figure 62. Asia-Pacific Offshore Wind Power Market by Country, 2022-2032 (USD Bn, AGR (%))
Figure 63. Asia-Pacific Offshore Wind Power Market Cumulative Installation by Country, 2022-2032 (GW, AGR (%))
Figure 64. Asia-Pacific Offshore Wind Power Market by Location, 2022-2032 (USD Bn, AGR (%))
Figure 65. Asia-Pacific Offshore Wind Power Market by Technology, 2022-2032 (USD Bn, AGR (%))
Figure 66. Asia-Pacific Offshore Wind Power Market by Components, 2022-2032 (USD Bn, AGR (%))
Figure 67. Asia-Pacific Offshore Wind Power Market by Type, 2022-2032 (USD Bn, AGR (%))
Figure 68. China Offshore Wind Power Market by Value, 2022-2032 (USD Bn, AGR (%))
Figure 69. China Offshore Wind Power Market by Cumulative Installation, 2022-2032 (GW, AGR (%))
Figure 70. Japan Offshore Wind Power Market by Value, 2022-2032 (USD Bn, AGR (%))
Figure 71. Japan Offshore Wind Power Market by Cumulative Installation, 2022-2032 (GW, AGR (%))
Figure 72. South Korea Offshore Wind Power Market by Value, 2022-2032 (USD Bn, AGR (%))
Figure 73. South Korea Offshore Wind Power Market by Cumulative Installation, 2022-2032 (GW, AGR (%))
Figure 74. Taiwan Offshore Wind Power Market by Value, 2022-2032 (USD Bn, AGR (%))
Figure 75. Taiwan Offshore Wind Power Market by Cumulative Installation, 2022-2032 (GW, AGR (%))
Figure 76. Vietnam Offshore Wind Power Market by Value, 2022-2032 (USD Bn, AGR (%))
Figure 77. Vietnam Offshore Wind Power Market by Cumulative Installation, 2022-2032 (GW, AGR (%))
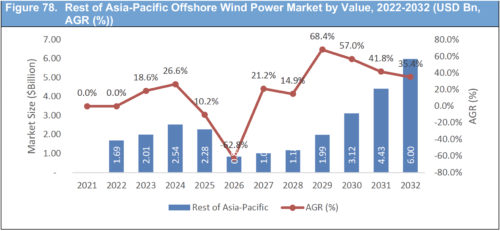
Figure 78. Rest of Asia-Pacific Offshore Wind Power Market by Value, 2022-2032 (USD Bn, AGR (%))
Figure 79. Rest of Asia-Pacific Offshore Wind Power Market by Cumulative Installation, 2022-2032 (GW, AGR (%))
Figure 80. Global Offshore Wind Power Market by Company Share, 2021 (%)
Figure 81. Global Offshore Wind Power Market by Key Business Strategy, 2020-2022 (%)
Figure 82. General Electric: Company Revenue 2017-2021 (US$Mn, AGR %)
Figure 83. General Electric: Company Operating Income 2017-2021 (US$Mn, AGR %)
Figure 84. General Electric: Company Net Income 2017-2021 (US$Mn, AGR %)
Figure 85. General Electric: Company EBITDA 2017-2021 (US$Mn, AGR %)
Figure 86. Vestas: Company Revenue 2017-2021 (US$Mn, AGR %)
Figure 87. Vestas: Company Operating Income 2017-2021 (US$Mn, AGR %)
Figure 88. Vestas: Company Net Income 2017-2021 (US$Mn, AGR %)
Figure 89. Vestas: Company EBITDA 2017-2021 (US$Mn, AGR %)
Figure 90. Siemens Gamesa: Company Revenue 2017-2021 (US$Mn, AGR %)
Figure 91. Siemens Gamesa: Company Operating Income 2017-2021 (US$Mn, AGR %)
Figure 92. Siemens Gamesa: Company Net Income 2017-2021 (US$Mn, AGR %)
Figure 93. Siemens Gamesa: Company EBITDA 2017-2021 (US$Mn, AGR %)
Figure 94. Xinjiang Goldwind Science & Technology: Company Revenue 2017-2021 (US$Mn, AGR %)
Figure 95. Xinjiang Goldwind Science & Technology: Company Operating Income 2017-2021 (US$Mn, AGR %)
Figure 96. Xinjiang Goldwind Science & Technology: Company Net Income 2017-2021 (US$Mn, AGR %)
Figure 97. Xinjiang Goldwind Science & Technology: Company EBITDA 2017-2021 (US$Mn, AGR %)
Figure 98. Shanghai Electric: Company Revenue 2017-2021 (US$Mn, AGR %)
Figure 99. Shanghai Electric: Company Operating Income 2017-2021 (US$Mn, AGR %)
Figure 100. Shanghai Electric: Company Net Income 2017-2021 (US$Mn, AGR %)
Figure 101. Shanghai Electric: Company EBITDA 2017-2021 (US$Mn, AGR %)
Figure 102. Abb: Company Revenue 2017-2021 (US$Mn, AGR %)
Figure 103. Abb: Company Operating Income 2017-2021 (US$Mn, AGR %)
Figure 104. Abb: Company Net Income 2017-2021 (US$Mn, AGR %)
Figure 105. Abb: Company EBITDA 2017-2021 (US$Mn, AGR %)
Figure 106. Doosan: Company Revenue 2017-2021 (US$Mn, AGR %)
Figure 107. Doosan: Company Operating Income 2017-2021 (US$Mn, AGR %)
Figure 108. Doosan: Company Net Income 2017-2021 (US$Mn, AGR %)
Figure 109. Doosan: Company EBITDA 2017-2021 (US$Mn, AGR %)
Figure 110. Hitachi: Company Revenue 2017-2021 (US$Mn, AGR %)
Figure 111. Hitachi: Company Operating Income 2017-2021 (US$Mn, AGR %)
Figure 112. Hitachi: Company Net Income 2017-2021 (US$Mn, AGR %)
Figure 113. Hitachi: Company EBITDA 2017-2021 (US$Mn, AGR %)
Figure 114. Nexans: Company Revenue 2017-2021 (US$Mn, AGR %)
Figure 115. Nexans: Company Operating Income 2017-2021 (US$Mn, AGR %)
Figure 116. Nexans: Company Net Income 2017-2021 (US$Mn, AGR %)
Figure 117. Nexans: Company EBITDA 2017-2021 (US$Mn, AGR %)
Figure 118. Ming Yang Smart Energy Group Limited: Company Revenue 2017-2021 (US$Mn, AGR %)
Figure 119. Ming Yang Smart Energy Group Limited: Company Operating Income 2017-2021 (US$Mn, AGR %)
Figure 120. Ming Yang Smart Energy Group Limited: Company Net Income 2017-2021 (US$Mn, AGR %)
Figure 121. Ming Yang Smart Energy Group Limited: Company EBITDA 2017-2021 (US$Mn, AGR %)
Figure 122. Rockwell Automation: Company Revenue 2017-2021 (US$Mn, AGR %)
Figure 123. Rockwell Automation: Company Operating Income 2017-2021 (US$Mn, AGR %)
Figure 124. Rockwell Automation: Company Net Income 2017-2021 (US$Mn, AGR %)
Figure 125. Rockwell Automation: Company EBITDA 2017-2021 (US$Mn, AGR %)
Figure 126. Nordex SE: Company Revenue 2017-2021 (US$Mn, AGR %)
Figure 127. Nordex SE: Company Operating Income 2017-2021 (US$Mn, AGR %)
Figure 128. Nordex SE: Company Net Income 2017-2021 (US$Mn, AGR %)
Figure 129. Nordex SE: Company EBITDA 2017-2021 (US$Mn, AGR %)
List of Companies Profiled in the report
ABB Ltd.
DEME Group
Doosan Heavy Industries & Construction Co Ltd
Envision
General Electric Company
Hitachi, Ltd.
Ming Yang Smart Energy Group Limited
Nexans SA
Nordex SE
Rockwell Automation, Inc.
Shanghai Electric Wind Power Equipment Co.
Siemens Gamesa Renewable Energy SA
Sinovel Wind Group Co., Ltd
Vestas Wind Systems A/S
Xinjiang Goldwind Science & Technology Co Ltd
List of Other Companies Mentioned in the report
Alstom
Areva
Chongqing Zhongneng Oil Purifier Manufacture Co., Ltd.
Clipper Windpower
Duke Energy Renewables Wind, LLC
Empire Offshore Wind
Equinor
Gamesa Technology
Green Investment Group
Harren&Partner Group
Heerema Marine Contractors
Henan Union Precision Material Co., Ltd.
Iota Silicone Oil (Anhui) Co., Ltd.
iXblue
Liaoning Haihua Technology Co., Ltd.
National Petroleum Construction Company (NPCC)
Offshore Wind Solutions GmbH (OWS)
Orsted
P&T Technologie (Energiequelle GmbH)
Qair
SAL Renewables
Shanghai Minglan Chemical Co., Ltd.
Simply Blue Group
SKALN Oil (Chongqing) Co., Ltd.
Tangshan Xinwei Zq Trading Company Limited
TotalEnergies Renewables USA, LLC
Trident Winds
VSB Holding GmbH
Wind Multiplikator GmbH
Windmanager GmbH & Co. KG
List of Associations Mentioned in the Report
Bureau of Ocean Energy Management (BOEM)
Department of Energy (DoE)
Development Bank of Japan
Dutch Banking Association (NVB)
Eolien Maritime France (EMF)
European Commission (EC)
Foundation for Sustainable Energy (FNEZ) of Poland
German Wind Energy Association (BWE)
Global Wind Energy Council (GWEC)
Gujarat Technological University (GTU)
KIER (Korea Institute of Energy Research)
Kyoto University
National Renewable Energy Laboratory (NREL)
Polish Offshore Wind Energy Society (PTME)
Polish Transmission System Operator (PSE)
South Brooklyn Marine Terminal (SBMT)
Taiwan Ministry of Economic Affairs (MOEA)
The Bureau of Ocean Energy Management (BOEM)
The Environmental Protection Agency (EPA)
The Government of Belgium
The Government of Taiwan
The Ministry of Economy, Trade and Industry (METI)
US Department of the Interior (DoI)

