This latest report by business intelligence provider Visiongain assesses that In 2030, from 739.12 in 2020, the worldwide demand for wind systems is anticipated to achieve a worldwide total integrated wind ability of 1840.9 GW. The worldwide wind turbine industry will encounter elevated development in North America, the Middle East and Africa, and Latin America. In 2019, the synthetic gear oil section retained the biggest market share, corresponding to about 78 percent of the business. According to the studies, the market share in this section is anticipated to raise by nearly 4.5 times by 2030. This study on the overall and basic requirements and requirements for wind turbine equipment oils begins with an outline of the industry for agricultural equipment oils and includes the ranking of agricultural equipment oils, their specifications and the present standardization operations. The requirements on wind turbine equipment fluids are also discussed, particularly in terms of mechanical-dynamic and chemical testing. In addition, it also deals with the small temperature elements of agricultural equipment oils for wind turbines.
It is therefore critical that you have your timescales correct and your forecasting plans ready. This report will ensure that you do. Visiongain’s report will ensure that you keep informed and ahead of your competitors. Gain that competitive advantage.
Owing to variables such as an increase in wind energy usage and a significant change from advanced and emerging nations to renewable energy sources for power generation, the wind turbine equipment fuel industry has seen important development. In addition, increasing consciousness of the advantages of wind energy is fueling supply, leading to increased supply for wind turbines. As a result, increasing wind turbine facilities result in the development of the worldwide industry for wind turbine equipment oil. However, it is expected that the elevated assembly price of wind turbines will hamper market growth.
Demands on Wind Turbine Gear Oils
The Siemens Flender specifications are regarded as basic requirements of all equipment oils requirements and are among the most significant together with DIN 51 517. Compatibility with internal gearbox paints, static elastomer testing (NBR–100 ° C, 1008 h, FKM–110 ° C, 1008 h) and Freudenberg vibrant elastomer exam are prominent among the physical / chemical requirements. Experience has shown that compliance with gearbox oils is not an unimportant consideration under particular experiment circumstances. The foundation oil as well as the additives and their parts affect paint consistency. FKM products are comparatively uncritical with regard to seals. NBR compatibility is an issue insofar as the corresponding tests are carried out for 1008 hours at very high temperatures (a drop in test temperature is planned to 95 ° C). The vibrant experiments are carried out in accordance with the in-house processes of Freudenberg. A Working Group is presently reviewing the requirements, sample conditions and sample durations, and a shift to current requirements and sample parameters is presently being discussed. In this Working Group, apart from Flender and Freudenberg, a range of major producers of lubricants and additives are depicted to debate and possibly alter the current requirements in practice. In addition, important mechanical dynamic tests – demands on wind turbine gear oils with regard to micro-pitting and scuffing avoidance (standard test and test with higher speeds), roller bearing wear test FE8 as well as diverse Flender foam tests, also with corrosion preventive contamination should also be mentioned.
Read on to discover how you can exploit the future business opportunities emerging in this sector. Visiongain’s new study tells you and tells you NOW. The 151-pages report provides clear, detailed insight into the global Wind Turbine Gear Oil market. Discover the key drivers and challenges affecting the market.
By ordering and reading our brand-new report today, you stay better informed and ready to act.
Report Scope
The report delivers considerable added value by revealing:
47 tables, charts and graphs are analyzing and revealing the growth prospects and outlook for the Wind Turbine Gear Oil market.
Global Wind Turbine Gear Oil market forecasts and analysis from 2020-2030.
Wind Turbine Gear Oil market provides revenue estimates, forecasts and analysis from 2020-2030 for Wind Turbine Gear Oil submarkets:
Forecasts and analysis of Wind Turbine Gear Oil market by Type between 2020-2030
Synthetic Gear Oil Market, 2020-2030
Mineral Gear Oil Market, 2020-2030
Other Types Market, 2020-2030
Forecasts and analysis of Wind Turbine Gear Oil market by Application between 2020-2030
On-shore Market, 2020-2030
Off-shore Market, 2020-2030
Regional Wind Turbine Gear Oil market forecasts from 2020-2030 with drivers and restraints for the countries including:
Geographic Breakdown
Focused regional forecasts and analysis explore the future opportunities:
North America Market, 2020-2030
US Market, 2020-2030
Canada Market, 2020-2030
Europe Market, 2020-2030
The UK Market, 2020-2030
Germany Market, 2020-2030
France Market, 2020-2030
Italy Market, 2020-2030
Spain Market, 2020-2030
Rest of Europe Market, 2020-2030
Asia-Pacific Market, 2020-2030
China Market, 2020-2030
India Market, 2020-2030
Japan Market, 2020-2030
Australia & New Zealand Market, 2020-2030
Rest of Asia-Pacific Market, 2020-2030
LAMEA Market, 2020-2030
Latin America Market, 2020-2030
Middle East Market, 2020-2030
Africa Market, 2020-2030

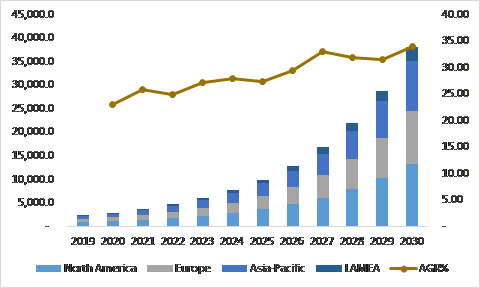
Figure:- Wind Turbine Gear Oil Market Size and Forecast by Region, 2020-2030
Wind power is a quickly changing, high-growth sector directly related to the use of lubricants (equipment petroleum). North America is currently the major region for equipment oils manufacturing and use. In conditions of consumption and production of equipment oils for wind turbines, Europe meets North America. With fresh innovations and increasing concentrate on renewable energies, Asia and Latin America are expected in the close future to outperform North America and Europe in aspects of equipment oils consumption.
Globally, in 2017, the United States rated second in relation to regular wind capability, but was well behind the wind energy consumption industry rulers. In 2017, global wind supplements amounted to 52,500 MW, well below the 2015 record of 63,600 MW, resulting in a combined sum of 539,000 MW. In spite of total and combined capability as well as global wind generation, the United States stayed the second-leading company behind China. A proportion of nations have attained elevated rates of water consumption; wind capacity at the end of 2020 is projected to deliver the total of 47% of Denmark’s energy demand and about 30% of Ireland and Portugal’s request. In the United States, it is projected that the complete wind power produced by the middle of 2020 will be equal to 9 half of the supply for electricity in an ordinary year.
Company profiles for the leading Wind Turbine Gear Oil companies
The accounts contain main trends as organic and inorganic growth policies in the wind turbine equipment fuel industry. Various businesses focus on policies for organic growth such as item releases, brand approvals and others such as patents and activities. Activities observed in the industry were inorganic growth policies purchases and partnerships & partnerships. These actions have paved the path for market players to expand their company and client base. With the increasing supply for wind turbine equipment petroleum on the worldwide economy, tax payers from the wind turbine equipment oil industry are expected to see profitable development possibilities in the future.
Over the prediction era (2020-2030), the worldwide motor motor and immediate engine economies are probable to develop at a CAGR of 1.5% and 6.2%. Historic wind gearbox installation would lead to a big gearbox retrofit industry, expected to achieve $5.7 billion in 2030. In the forecast period, a change towards the deployment of direct drive wind turbines is anticipated. Direct drive offers less servicing and is simpler to deploy, helping to increase their use in offshore wind farms. Direct engine is anticipated to represent 27.9% of the business size by 2030.
Company Profiles of Leading Players
Exxon Mobil Corporation
Evonik Industries AG
BP
Amsoil Inc.
Royal Dutch Shell plc,
Klüber Lubrication
FUCHS PETROLUB SE
Croda International Plc
Chevron
Castrol Limited
Afton Chemical
Other Key Players in the market
Quaker Chemical
Lubrita
Total
Petro-Canada Lubricants Inc
Shell Global Solutions US Inc.
PennWell Corporation
Castrol
Chongqing Zhongneng Oil Purifier Manufacture Co., Ltd.
Liaoning Haihua Technology Co., Ltd.
Henan Union Precision Material Co., Ltd.
Shanghai Minglan Chemical Co., Ltd.
SKALN Oil (Chongqing) Co., Ltd.
Iota Silicone Oil (Anhui) Co., Ltd.
Tangshan Xinwei Zq Trading Company Limited
Conclusions and recommendations which will aid decision-making
How will you benefit from this report?
Keep your knowledge base up to speed. Don’t get left behind
Reinforce your strategic decision-making with definitive and reliable market data
Learn how to exploit new technological trends
Realise your company’s full potential within the market
Understand the competitive landscape and identify potential new business opportunities & partnerships
Who should read this report?
Anyone with involvement in the Wind Turbine Gear Oil
Wind Energy operators
Engineering contractors
Investment managers
Arbitrage companies and divisions
Wind Energy price reporting companies
Wind Energy company managers
Wind Energy consultants
Wind Energy company executives and analysts
Heads of strategic development
Business development managers
Marketing managers
Market analysts,
Technologists
Suppliers
Investors
Banks
Government agencies
Visiongain’s study is intended for anyone requiring commercial analyses for the Wind Turbine Gear Oil market and leading companies. You find data, trends and predictions.
Buy our report today the Wind Turbine Gear Oil Market Forecast 2020-2030. Avoid missing out by staying informed – get our report now.
Visiongain is a trading partner with the US Federal Government
CCR Ref number: KD4R6
Do you have any custom requirements we can help you with? Any need for specific country, geo region, market segment or specific company information? Contact us today, we can discuss your needs and see how we can help sara.peerun@visiongain.com
Report Overview
1.1 Global Wind Turbine Gear Oil Market
1.2 Global Wind Turbine Gear Oil Market Overview
1.3 Global Wind Turbine Gear Oil Market Segmentation
1.4 The Emergence of Wind Turbine Gear Oil in the Industry
1.5 Why You Should Read This Report
1.6 How This Report Delivers
1.7 Key Questions Answered by This Analytical Report
1.8 Methodology
1.8.1 Secondary Research
1.8.2 Market Evaluation & Forecasting Methodology
1.9 Frequently Asked Questions (FAQ)
1.10 Associated Visiongain Reports
1.11 About Visiongain
2. Introduction to Wind Turbine Gear Oil Market
2.1 Market Definition
2.2 Industry Outlook
2.3 Value Chain Analysis
2.4 Industry Structure
2.5 Current Status & Trends
2.6 Demand & Supply Analysis
2.7 Trade Analysis
2.8 Price Trend Analysis
3. Global Wind Turbine Gear Oil Market Analysis
3.1 PEST Analysis of the Wind Turbine Gear Oil Market
3.2 Expert Opinion
3.2.1 Primary Correspondents
3.3 Market Outlook
3.4 Drivers & Restraints
3.5 Dominant Region/Country
3.6 Market Scenario
3.7 Overall Growth Rate, Globally
3.8 SWOT Analysis of the Wind Turbine Gear Oil Market
3.8.1 Strengths
3.8.2 Weaknesses
3.8.3 Opportunities
3.8.4 Threats
3.9 Porter’s Five Forces Analysis
3.9.1 Competitive Rivalry
3.9.2 Supplier Power
3.9.3 Buyer Power
3.9.4 Threat of Substitute
3..9.5 Threat of New Entrant
4. Wind Turbine Gear Oil: Global Market Analysis by Segments
4.1 Global Wind Turbine Gear Oil Market Forecast, by Type 2020-2030
4.1.1 Type Overview
4.1.2 Synthetic Gear Oil Market, 2020-2030
4.1.3 Mineral Gear Oil Market, 2020-2030
4.1.4 Other Types Market, 2020-2030
4.2 Global Wind Turbine Gear Oil Market Forecast, by Application 2020-2030
4.2.1 Application Overview
4.2.2 On-shore Market, 2020-2030
4.2.3 Off-shore Market, 2020-2030
4.2.4 Other Application Market, 2020-2030
5. Leading Regions in Wind Turbine Gear Oil Market 2020-2030
5.1 Regional Overview
5.1.1 North America
5.1.2 Europe
5.1.3 Asia Pacific
5.1.4 LAMEA
5.1.5 Leading Countries/ Regions
5.2 U.S. Wind Turbine Gear Oil Market Forecast, 2020-2030
5.2.1 U.S. Wind Turbine Gear Oil Submarket, By Type Forecast 2020-2030
5.2.2 U.S. Wind Turbine Gear Oil Submarket, By Application Forecast 2020-2030
5.3 Canada Wind Turbine Gear Oil Market Forecast, 2020-2030
5.3.1 Canada Wind Turbine Gear Oil Submarket, By Type Forecast 2020-2030
5.3.2 Canada Wind Turbine Gear Oil Submarket, By Application Forecast 2020-2030
5.4 The UK Wind Turbine Gear Oil Market Forecast, 2020-2030
5.4.1 The UK Wind Turbine Gear Oil Submarket, By Type Forecast 2020-2030
5.4.2 The UK Wind Turbine Gear Oil Submarket, By Application Forecast 2020-2030
5.5 Germany Wind Turbine Gear Oil Market Forecast, 2020-2030
5.5.1 Germany Wind Turbine Gear Oil Submarket, By Type Forecast 2020-2030
5.5.2 Germany Wind Turbine Gear Oil Submarket, By Application Forecast 2020-2030
5.6 France Wind Turbine Gear Oil Market Forecast, 2020-2030
5.6.1 France Wind Turbine Gear Oil Submarket, By Type Forecast 2020-2030
5.6.2 France Wind Turbine Gear Oil Submarket, By Application Forecast 2020-2030
5.7 Italy Wind Turbine Gear Oil Market Forecast, 2020-2030
5.7.1 Italy Wind Turbine Gear Oil Submarket, By Type Forecast 2020-2030
5.7.2 Italy Wind Turbine Gear Oil Submarket, By Application Forecast 2020-2030
5.8 Spain Wind Turbine Gear Oil Market Forecast, 2020-2030
5.8.1 Spain Wind Turbine Gear Oil Submarket, By Type Forecast 2020-2030
5.8.2 Spain Wind Turbine Gear Oil Submarket, By Application Forecast 2020-2030
5.8.3 Spain Wind Turbine Gear Oil Submarket, By Forecast 2020-2030
5.8.4 Spain Wind Turbine Gear Oil Submarket, By Forecast 2020-2030
5.9 Rest of Europe Wind Turbine Gear Oil Market Forecast, 2020-2030
5.9.1 Rest of Europe Wind Turbine Gear Oil Submarket, By Type Forecast 2020-2030
5.9.2 Rest of Europe Wind Turbine Gear Oil Submarket, By Application Forecast 2020-2030
5.10 China Wind Turbine Gear Oil Market Forecast, 2020-2030
5.10.1 China Wind Turbine Gear Oil Submarket, By Type Forecast 2020-2030
5.10.2 China Wind Turbine Gear Oil Submarket, By Application Forecast 2020-2030
5.11 India Wind Turbine Gear Oil Market Forecast, 2020-2030
5.11.1 India Wind Turbine Gear Oil Submarket, By Type Forecast 2020-2030
5.11.2 India Wind Turbine Gear Oil Submarket, By Application Forecast 2020-2030
5.12 Japan Wind Turbine Gear Oil Market Forecast, 2020-2030
5.12.1 Japan Wind Turbine Gear Oil Submarket, By Type Forecast 2020-2030
5.12.2 Japan Wind Turbine Gear Oil Submarket, By Application Forecast 2020-2030
5.13 Australia & New Zealand Wind Turbine Gear Oil Market Forecast, 2020-2030
5.13.1 Australia & New Zealand Wind Turbine Gear Oil Submarket, By Type Forecast 2020-2030
5.13.2 Australia & New Zealand Wind Turbine Gear Oil Submarket, By Application Forecast 2020-2030
5.14 Rest of Asia-Pacific Wind Turbine Gear Oil Market Forecast, 2020-2030
5.14.1 Rest of Asia-Pacific Wind Turbine Gear Oil Submarket, By Type Forecast 2020-2030
5.14.2 Rest of Asia-Pacific Wind Turbine Gear Oil Submarket, By Application Forecast 2020-2030
5.15 Latin America Wind Turbine Gear Oil Market Forecast, 2020-2030
5.15.1 Latin America Wind Turbine Gear Oil Submarket, By Type Forecast 2020-2030
5.15.2 Latin America Wind Turbine Gear Oil Submarket, By Application Forecast 2020-2030
5.16 Middle East Wind Turbine Gear Oil Market Forecast, 2020-2030
5.16.1 Middle East Wind Turbine Gear Oil Submarket, By Type Forecast 2020-2030
5.16.2 Middle East Wind Turbine Gear Oil Submarket, By Application Forecast 2020-2030
5.17 Africa Wind Turbine Gear Oil Market Forecast, 2020-2030
5.17.1 Africa Wind Turbine Gear Oil Submarket, By Type Forecast 2020-2030
5.17.2 Africa Wind Turbine Gear Oil Submarket, By Application Forecast 2020-2030
7. Leading Companies in The Wind Turbine Gear Oil Market
7.1 Exxon Mobil Corporation
7.1.1 Exxon Mobil Corporation Products and Services
7.1.2 Analysis of Exxon Mobil Corporation within the Wind Turbine Gear Oil Market
7.1.3 Exxon Mobil Corporation M&A Activity
7.1.4 Future Outlook for Exxon Mobil Corporation
7.1.5 Exxon Mobil Corporation Projects
7.2 Evonik Industries AG
7.2.1 Evonik Industries AG Products and Services
7.2.2 Analysis of Evonik Industries AG within the Wind Turbine Gear Oil Market
7.2.3 Evonik Industries AG M&A Activity
7.2.4 Future Outlook for Evonik Industries AG
7.2.5 Evonik Industries AG Projects
7.3 BP
7.3.1 BP Products and Services
7.3.2 Analysis of BP within the Wind Turbine Gear Oil Market
7.3.3 BP M&A Activity
7.3.4 Future Outlook for BP
7.3.5 BP Projects
7.4 Amsoil Inc.
7.4.1 Amsoil Inc. Products and Services
7.4.2 Analysis of Amsoil Inc. within the Wind Turbine Gear Oil Market
7.4.3 Amsoil Inc. M&A Activity
7.4.4 Future Outlook for Amsoil Inc.
7.4.5 Amsoil Inc. Projects
7.5 Royal Dutch Shell plc,
7.5.1 Royal Dutch Shell plc, Products and Services
7.5.2 Analysis of Royal Dutch Shell plc, within the Wind Turbine Gear Oil Market
7.5.3 Royal Dutch Shell plc, M&A Activity
7.5.4 Future Outlook for Royal Dutch Shell plc,
7.5.5 Royal Dutch Shell plc, Projects
7.6 Klüber Lubrication
7.6.1 Klüber Lubrication Products and Services
7.6.2 Analysis of Klüber Lubrication within the Wind Turbine Gear Oil Market
7.6.3 Klüber Lubrication M&A Activity
7.6.4 Future Outlook for Klüber Lubrication
7.6.5 Klüber Lubrication Projects
7.7 Fuchs Petrolub SE
7.7.1 Fuchs Petrolub SE Products and Services
7.7.2 Analysis of Fuchs Petrolub SE within the Wind Turbine Gear Oil Market
7.7.3 Fuchs Petrolub SE M&A Activity
7.7.4 Future Outlook for Fuchs Petrolub SE
7.7.5 Fuchs Petrolub SE Projects
7.8 Croda International Plc
7.8.1 Croda International Plc Products and Services
7.8.2 Analysis of Croda International Plc within the Wind Turbine Gear Oil Market
7.8.3 Croda International Plc M&A Activity
7.8.4 Future Outlook for Croda International Plc
7.8.5 Croda International Plc Projects
7.9 Chevron
7.9.1 Chevron Products and Services
7.9.2 Analysis of Chevron within the Wind Turbine Gear Oil Market
7.9.3 Chevron M&A Activity
7.9.4 Future Outlook for Chevron
7.9.5 Chevron Projects
7.10 Castrol Limited
7.10.1 Castrol Limited Products and Services
7.10.2 Analysis of Castrol Limited within the Wind Turbine Gear Oil Market
7.10.3 Castrol Limited M&A Activity
7.10.4 Future Outlook for Castrol Limited
7.10.5 Castrol Limited Projects
7.11 Afton Chemical
7.11.1 Afton Chemical Products and Services
7.11.2 Analysis of Afton Chemical within the Wind Turbine Gear Oil Market
7.11.3 Afton Chemical M&A Activity
7.11.4 Future Outlook for Afton Chemical
7.11.5 Afton Chemical Projects
8. Conclusions and Recommendations
8.1 Global Wind Turbine Gear Oil Market Outlook
8.2 Recommendations
9. Glossary
Associated Visiongain Reports
Visiongain Report Sales Order Form
Appendix A
About Visiongain
Appendix B
Visiongain Report Evaluation Form
List of Tables
Table 1.0 Key Highlights
Table 3.1 PEST Analysis, Wind Turbine Gear Oil Market
Table 3.2 SWOT Analysis
Table 4.1 Global Wind Turbine Gear Oil Market Forecast 2020-2030 ($Bn, AGR %, CAGR %, Cumulative)
Table 4.2 Global Wind Turbine Gear Oil Submarket, By Type Forecast 2020-2030 ($billion, AGR %, Cumulative)
Table 4.3 Global Wind Turbine Gear Oil Submarket, By Forecast 2020-2030 ($billion, AGR %, Cumulative)
Table 4.4 Global Wind Turbine Gear Oil Submarket, By Forecast 2020-2030 ($billion, AGR %, Cumulative)
Table 5.1 Global Wind Turbine Gear Oil Market, by Country/Region Forecast 2020-2030 ($billion, AGR %, Cumulative)
Table 5.2 Global Wind Turbine Gear Oil Market, by Country/Region Forecast 2020-2030 ($billion, AGR %, Cumulative)
Table 5.3 Canada Wind Turbine Gear Oil Market Forecast 2020-2030 ($billion, , AGR %, CAGR %, Cumulative)
Table 5.4 Canada Wind Turbine Gear Oil Submarket, By Type Forecast 2020-2030 ($billion, AGR %, Cumulative)
Table 5.5 Canada Wind Turbine Gear Oil Submarket, By Application Forecast 2020-2030 ($billion, AGR %, Cumulative)
Table 5.6 US Wind Turbine Gear Oil Market Submarket, By Forecast 2020-2030 ($billion, , AGR %, CAGR %, Cumulative)
Table 5.7 US Wind Turbine Gear Oil Submarket, By Type Forecast 2020-2030 ($billion, AGR %, Cumulative)
Table 5.8 US Wind Turbine Gear Oil Submarket, By Application Forecast 2020-2030 ($billion, AGR %, Cumulative)
Table 5.9 Latin America Wind Turbine Gear Oil Market Forecast 2020-2030 ($billion, , AGR %, CAGR %, Cumulative)
Table 5.10 Latin America Wind Turbine Gear Oil Submarket, By Type Forecast 2020-2030 ($billion, AGR %, Cumulative)
Table 5.11 Latin America Wind Turbine Gear Oil Submarket, By Application Forecast 2020-2030 ($billion, AGR %, Cumulative)
Table 5.12 Germany Wind Turbine Gear Oil Market Submarket, By Forecast 2020-2030 ($billion, , AGR %, CAGR %, Cumulative)
Table 5.13 Germany Wind Turbine Gear Oil Submarket, By Type Forecast 2020-2030 ($billion, AGR %, Cumulative)
Table 5.14 Germany Wind Turbine Gear Oil Submarket, By Application Forecast 2020-2030 ($billion, AGR %, Cumulative)
Table 5.15 UK Wind Turbine Gear Oil Market Submarket, By Forecast 2020-2030 ($billion, , AGR %, CAGR %, Cumulative)
Table 5.16 UK Wind Turbine Gear Oil Submarket, By Type Forecast 2020-2030 ($billion, AGR %, Cumulative)
Table 5.17 UK Wind Turbine Gear Oil Submarket, By Application Forecast 2020-2030 ($billion, AGR %, Cumulative)
Table 5.18 Spain Wind Turbine Gear Oil Market Submarket, By Forecast 2020-2030 ($billion, , AGR %, CAGR %, Cumulative)
Table 5.19 Spain Wind Turbine Gear Oil Submarket, By Type Forecast 2020-2030 ($billion, AGR %, Cumulative)
Table 5.20 Spain Wind Turbine Gear Oil Submarket, By Application Forecast 2020-2030 ($billion, AGR %, Cumulative)
Table 5.21 UK Wind Turbine Gear Oil Submarket, By Forecast 2020-2030 ($billion, , AGR %, CAGR %, Cumulative)
Table 5.22 UK Wind Turbine Gear Oil Submarket, By Type Forecast 2020-2030 ($billion, AGR %, Cumulative)
Table 5.23 UK Wind Turbine Gear Oil Submarket, By Application Forecast 2020-2030 ($billion, AGR %, Cumulative)
Table 5.24 China Wind Turbine Gear Oil Submarket, By Forecast 2020-2030 ($billion, , AGR %, CAGR %, Cumulative)
Table 5.25 China Wind Turbine Gear Oil Submarket, By Type Forecast 2020-2030 ($billion, AGR %, Cumulative)
Table 5.26 China Wind Turbine Gear Oil Submarket, By Application Forecast 2020-2030 ($billion, AGR %, Cumulative)
Table 5.27 Australia Wind Turbine Gear Oil Submarket, By Forecast 2020-2030 ($billion, , AGR %, CAGR %, Cumulative)
Table 5.28 Australia Wind Turbine Gear Oil Submarket, By Type Forecast 2020-2030 ($billion, AGR %, Cumulative)
Table 5.29 Australia Wind Turbine Gear Oil Submarket, By Application Forecast 2020-2030 ($billion, AGR %, Cumulative)
Table 5.30 South Korea Wind Turbine Gear Oil Submarket, By Forecast 2020-2030 ($billion, , AGR %, CAGR %, Cumulative)
Table 5.31 South Korea Wind Turbine Gear Oil Submarket, By Type Forecast 2020-2030 ($billion, AGR %, Cumulative)
Table 5.32 South Korea Wind Turbine Gear Oil Submarket, By Application Forecast 2020-2030 ($billion, AGR %, Cumulative)
Table 5.33 Japan Wind Turbine Gear Oil Submarket, By Forecast 2020-2030 ($billion, , AGR %, CAGR %, Cumulative)
Table 5.34 Japan Wind Turbine Gear Oil Submarket, By Type Forecast 2020-2030 ($billion, AGR %, Cumulative)
Table 5.35 Japan Wind Turbine Gear Oil Submarket, By Application Forecast 2020-2030 ($billion, AGR %, Cumulative)
Table 5.36 India Wind Turbine Gear Oil Submarket, By Forecast 2020-2030 ($billion, , AGR %, CAGR %, Cumulative)
Table 5.37 India Wind Turbine Gear Oil Submarket, By Type Forecast 2020-2030 ($billion, AGR %, Cumulative)
Table 5.38 India Wind Turbine Gear Oil Submarket, By Application Forecast 2020-2030 ($billion, AGR %, Cumulative)
Table 5.39 Middle East Wind Turbine Gear Oil Submarket, By Forecast 2020-2030 ($billion, , AGR %, CAGR %, Cumulative)
Table 5.40 Middle East Wind Turbine Gear Oil Submarket, By Type Forecast 2020-2030 ($billion, AGR %, Cumulative)
Table 5.41 Middle East Wind Turbine Gear Oil Submarket, By Application Forecast 2020-2030 ($billion, AGR %, Cumulative)
Table 5.42 Rest of Asia-Pacific Wind Turbine Gear Oil Submarket, By Forecast 2020-2030 ($billion , , AGR %, CAGR %, Cumulative)
Table 5.43 Rest of Asia-Pacific Wind Turbine Gear Oil Submarket, By Type Forecast 2020-2030 ($billion , AGR %, Cumulative)
Table 5.44 Rest of Asia-Pacific Wind Turbine Gear Oil Submarket, By Application Forecast 2020-2030 ($billion , AGR %, Cumulative)
Table 5.45 Rest of Europe Wind Turbine Gear Oil Submarket, By Forecast 2020-2030 ($billion, , AGR %, CAGR %, Cumulative)
Table 5.46 Rest of Europe Wind Turbine Gear Oil Submarket, By Type Forecast 2020-2030 ($billion, AGR %, Cumulative)
Table 5.47 Rest of Europe Wind Turbine Gear Oil Submarket, By Application Forecast 2020-2030 ($billion, AGR %, Cumulative)
Table 5.48 Africa Wind Turbine Gear Oil Submarket, By Forecast 2020-2030 ($billion, , AGR %, CAGR %, Cumulative)
Table 5.49 Africa Wind Turbine Gear Oil Submarket, By Type Forecast 2020-2030 ($billion, AGR %, Cumulative)
Table 5.50 Africa Wind Turbine Gear Oil Submarket, By Application Forecast 2020-2030 ($billion, AGR %, Cumulative)
Table 5.51 Spain Wind Turbine Gear Oil Submarket, By Forecast 2020-2030 ($billion , , AGR %, CAGR %, Cumulative)
Table 5.52 Spain Wind Turbine Gear Oil Submarket, By Type Forecast 2020-2030 ($billion , AGR %, Cumulative)
Table 5.53 Spain Wind Turbine Gear Oil Submarket, By Application Forecast 2020-2030 ($billion , AGR %, Cumulative)
Table 7.1 Exxon Mobil Corporation Profile 2019 (Market Entry, Public/Private, Headquarters, Geography, Key Market, Listed on, Products/Services
Table 7.2 Exxon Mobil Corporation Profile 2019 (Market Entry, Public/Private, Headquarter, Total Company Revenue $billion, Change in Revenue, Geography, Key Market, Listed on, Products/Services)
Table 7.3 Exxon Mobil Corporation Products and Services (Product/Service, Notes)
Table 7.4 Exxon Mobil Corporation Total Company Sales 2015-2019 (US$billion, AGR %)
Table 7.5 Exxon Mobil Corporation Total Company Recent Development 2015-2019
Table 7.6 Evonik Industries AG Profile 2019 (Market Entry, Public/Private, Headquarter, Total Company Revenue $billion, Change in Revenue, Geography, Key Market, Listed on, Products/Services)
Table 7.7 Evonik Industries AG Products and Services (Product/Service, Notes)
Table 7.8 Evonik Industries AG Total Company Sales 2015-2019 (US$billion, AGR %)
Table 7.9 Evonik Industries AG Total Company Recent Development 2015-2019
Table 7.10 BP Profile 2019 (Market Entry, Public/Private, Headquarter, Total Company Revenue $billion, Change in Revenue, Geography, Key Market, Listed on, Products/Services)
Table 7.11 BP Products and Services (Product/Service, Notes)
Table 7.12 BP Total Company Sales 2015-2019 (US$billion, AGR %)
Table 7.13 BP Total Company Recent Development 2015-2019
Table 7.14 Amsoil Inc. Profile 2019 (Market Entry, Public/Private, Headquarter, Total Company Revenue $billion, Change in Revenue, Geography, Key Market, Listed on, Products/Services)
Table 7.15 Amsoil Inc. Products and Services (Product/Service, Notes)
Table 7.16 Amsoil Inc. Total Company Sales 2015-2019 (US$billion, AGR %)
Table 7.17 Amsoil Inc. Total Company Recent Development 2015-2019
Table 7.18 Royal Dutch Shell plc, Profile 2019 (Market Entry, Public/Private, Headquarter, Total Company Revenue $billion, Change in Revenue, Geography, Key Market, Listed on, Products/Services)
Table 7.19 Royal Dutch Shell plc, Products and Services (Product/Service, Notes)
Table 7.20 Royal Dutch Shell plc, Total Company Sales 2015-2019 (US$billion, AGR %)
Table 7.21 Royal Dutch Shell plc, Total Company Recent Development 2015-2019
Table 7.22 Klüber Lubrication Profile 2019 (Market Entry, Public/Private, Headquarter, Total Company Revenue $billion, Change in Revenue, Geography, Key Market, Listed on, Products/Services)
Table 7.23 Klüber Lubrication Products and Services (Product/Service, Notes)
Table 7.24 Klüber Lubrication Total Company Sales 2015-2019 (US$billion, AGR %)
Table 7.25 Klüber Lubrication Total Company Recent Development 2015-2019
Table 7.26 Fuchs Petrolub SE Profile 2019 (Market Entry, Public/Private, Headquarter, Total Company Revenue $billion, Change in Revenue, Geography, Key Market, Listed on, Products/Services)
Table 7.27 Fuchs Petrolub SE Products and Services (Product/Service, Notes)
Table 7.28 Fuchs Petrolub SE Total Company Sales 2015-2019 (US$billion, AGR %)
Table 7.29 Fuchs Petrolub SE Total Company Recent Development 2015-2019
Table 7.30 Croda International Plc Profile 2019 (Market Entry, Public/Private, Headquarter, Total Company Revenue $billion, Change in Revenue, Geography, Key Market, Listed on, Products/Services)
Table 7.31 Croda International Plc Products and Services (Product/Service, Notes)
Table 7.32 Croda International Plc Total Company Sales 2015-2019 (US$billion, AGR %)
Table 7.33 Croda International Plc Total Company Recent Development 2015-2019
Table 7.34 Chevron Profile 2019 (Market Entry, Public/Private, Headquarter, Total Company Revenue $billion, Change in Revenue, Geography, Key Market, Listed on, Products/Services)
Table 7.35 Chevron Products and Services (Product/Service, Notes)
Table 7.36 Chevron Total Company Sales 2015-2019 (US$billion, AGR %)
Table 7.37 Chevron Total Company Recent Development 2015-2019
Table 7.38 Castrol Limited Profile 2019 (Market Entry, Public/Private, Headquarter, Total Company Revenue $billion, Change in Revenue, Geography, Key Market, Listed on, Products/Services)
Table 7.39 Castrol Limited Products and Services (Product/Service, Notes)
Table 7.40 Castrol Limited Total Company Sales 2015-2019 (US$billion, AGR %)
Table 7.41 Castrol Limited Total Company Recent Development 2015-2019
Table 7.42 Afton Chemical Profile 2019 (Market Entry, Public/Private, Headquarter, Total Company Revenue $billion, Change in Revenue, Geography, Key Market, Listed on, Products/Services)
Table 7.43 Afton Chemical Products and Services (Product/Service, Notes)
Table 7.44 Afton Chemical Total Company Sales 2015-2019 (US$billion, AGR %)
Table 7.45 Afton Chemical Total Company Recent Development 2015-2019
List of Figures
Figure 1.1 Global Wind Turbine Gear Oil Market Segmentation
Figure 2.1 Wind Turbine Gear Oil Value Chain Analysis
Figure 3.1 Wind Turbine Gear Oil Supply-Demand Analysis
Figure 4.1 Global Wind Turbine Gear Oil Forecast 2020-2030 ($billion, AGR %)
Figure 4.2 Global Wind Turbine Gear Oil Market Forecast 2020-2030
Figure 4.3 Global Wind Turbine Gear Oil Submarket Forecast by 2020-2030 ($ billion)
Figure 4.4 Global Wind Turbine Gear Oil Market By Type Share Forecast 2020, 2025, 2030 (% Share)
Figure 4.19 Global Wind Turbine Gear Oil by Submarket By Type Forecast 2020-2030 ($ million)
Figure 4.20 Global Wind Turbine Gear Oil Market, by Share Forecast 2020, 2025, 2030 (% Share)
Figure 4.21 Wind Turbine Gear Oil Market, By Type Forecast 2020-2030 ($billion, AGR%)
Figure 4.23 Wind Turbine Gear Oil Market, By Type Forecast 2020-2030 ($billion, AGR%)
Figure 4.25 Wind Turbine Gear Oil Market, By Type Forecast 2020-2030 ($billion, AGR%)
Figure 4.27 Wind Turbine Gear Oil Market, By Type Forecast 2020-2030 ($billion, AGR%)
Figure 5.1 Regional/Country Wind Turbine Gear Oil Market, by 2020-2030
Figure 5.3 Leading Country/Regional Wind Turbine Gear Oil Market Share, by 2020
Figure 5.4 Leading Country/Regional Wind Turbine Gear Oil Market Share, by 2025
Figure 5.5 Leading Country/Regional Wind Turbine Gear Oil Market Share, by 2030
Figure 5.6 Canada Wind Turbine Gear Oil Market Forecast 2020-2030 ($billion, AGR%)
Figure 5.7 Canada Wind Turbine Gear Oil Market, by Forecast 2020-2030
Figure 5.8 Canada Wind Turbine Gear Oil Submarket, By Type Forecast 2020-2030
Figure 5.9 Canada Wind Turbine Gear Oil Submarket , By Application Forecast 2020-2030
Figure 5.10 Canada Wind Turbine Gear Oil Submarket , By 2020-2030 ($billion, AGR%)
Figure 5.10 U.S. Wind Turbine Gear Oil Market Forecast 2020-2030 ($billion, AGR%)
Figure 5.11 U.S. Wind Turbine Gear Oil Market, by Forecast 2020-2030
Figure 5.12 U.S. Wind Turbine Gear Oil Submarket, By Type Forecast 2020-2030
Figure 5.13 U.S. Wind Turbine Gear Oil Submarket , By Application Forecast 2020-2030
Figure 5.13 U.S. Wind Turbine Gear Oil Submarket , By Forecast 2020-2030
Figure 5.14 Latin America Wind Turbine Gear Oil Market Forecast 2020-2030 ($billion , AGR%)
Figure 5.15 Latin America Wind Turbine Gear Oil Market, by Forecast 2020-2030
Figure 5.16 Latin America Wind Turbine Gear Oil Submarket, By Type Forecast 2020-2030
Figure 5.17 Latin America Wind Turbine Gear Oil Submarket , By Application Forecast 2020-2030
Figure 5.17 Latin America Wind Turbine Gear Oil Submarket , By Forecast 2020-2030
Figure 5.18 Germany Wind Turbine Gear Oil Market Forecast 2020-2030 ($billion, AGR%)
Figure 5.19 Germany Wind Turbine Gear Oil Market, by Forecast 2020-2030
Figure 5.20 Germany Wind Turbine Gear Oil Submarket, By Type Forecast 2020-2030
Figure 5.21 Germany Wind Turbine Gear Oil Submarket , By Application Forecast 2020-2030
Figure 5.21 Germany Wind Turbine Gear Oil Submarket , By Forecast 2020-2030
Figure 5.22 U.K. Wind Turbine Gear Oil Market Forecast 2020-2030 ($billion, AGR%)
Figure 5.23 U.K. Wind Turbine Gear Oil Market, by Forecast 2020-2030
Figure 5.24 U.K. Wind Turbine Gear Oil Submarket, By Type Forecast 2020-2030
Figure 5.25 U.K. Wind Turbine Gear Oil Submarket , By Application Forecast 2020-2030
Figure 5.25 U.K. Wind Turbine Gear Oil Submarket , By Forecast 2020-2030
Figure 5.26 Spain Wind Turbine Gear Oil Market Forecast 2020-2030 ($billion, AGR%)
Figure 5.27 Spain Wind Turbine Gear Oil Market, by Forecast 2020-2030
Figure 5.28 Spain Wind Turbine Gear Oil Submarket, By Type Forecast 2020-2030
Figure 5.29 Spain Wind Turbine Gear Oil Submarket , By Application Forecast 2020-2030
Figure 5.30 UK Wind Turbine Gear Oil Market Forecast 2020-2030 ($billion, AGR%)
Figure 5.31 UK Wind Turbine Gear Oil Market, by Forecast 2020-2030
Figure 5.32 UK Wind Turbine Gear Oil Submarket, By Type Forecast 2020-2030
Figure 5.33 UK Wind Turbine Gear Oil Submarket , By Application Forecast 2020-2030
Figure 5.34 China Wind Turbine Gear Oil Market Forecast 2020-2030 ($billion, AGR%)
Figure 5.35 China Wind Turbine Gear Oil Submarket , By , by Forecast 2020-2030
Figure 5.36 China Wind Turbine Gear Oil Submarket, By Type Forecast 2020-2030
Figure 5.37 China Wind Turbine Gear Oil Submarket , By Application Forecast 2020-2030
Figure 5.38 Australia Wind Turbine Gear Oil Market Forecast 2020-2030 ($billion, AGR%)
Figure 5.39 Australia Wind Turbine Gear Oil Submarket , By , by Forecast 2020-2030
Figure 5.40 Australia Wind Turbine Gear Oil Submarket, By Type Forecast 2020-2030
Figure 5.41 Australia Wind Turbine Gear Oil Submarket , By Application Forecast 2020-2030
Figure 5.42 South Korea Wind Turbine Gear Oil Market Forecast 2020-2030 ($billion, AGR%)
Figure 5.43 South Korea Wind Turbine Gear Oil Submarket , By , by Forecast 2020-2030
Figure 5.44 South Korea Wind Turbine Gear Oil Submarket, By Type Forecast 2020-2030
Figure 5.45 South Korea Wind Turbine Gear Oil Submarket , By Application Forecast 2020-2030
Figure 5.46 Japan Wind Turbine Gear Oil Market Forecast 2020-2030 ($billion, AGR%)
Figure 5.47 Japan Wind Turbine Gear Oil Submarket , By , by Forecast 2020-2030
Figure 5.48 Japan Wind Turbine Gear Oil Submarket, By Type Forecast 2020-2030
Figure 5.49 Japan Wind Turbine Gear Oil Submarket , By Application Forecast 2020-2030
Figure 5.50 India Wind Turbine Gear Oil Market Forecast 2020-2030 ($billion, AGR%)
Figure 5.51 India Wind Turbine Gear Oil Submarket , By , by Forecast 2020-2030
Figure 5.52 India Wind Turbine Gear Oil Submarket, By Type Forecast 2020-2030
Figure 5.53 India Wind Turbine Gear Oil Submarket , By Application Forecast 2020-2030
Figure 5.54 Middle East Wind Turbine Gear Oil Market Forecast 2020-2030 ($billion, AGR%)
Figure 5.55 Middle East Wind Turbine Gear Oil Submarket , By , by Forecast 2020-2030
Figure 5.56 Middle East Wind Turbine Gear Oil Submarket, By Type Forecast 2020-2030
Figure 5.57 Middle East Wind Turbine Gear Oil Submarket , By Application Forecast 2020-2030
Figure 5.70 Rest of the World Wind Turbine Gear Oil Market Forecast 2020-2030 ($billion , AGR%)
Figure 5.71 Rest of the World Wind Turbine Gear Oil Submarket , By , by Forecast 2020-2030
Figure 5.72 Rest of the World Wind Turbine Gear Oil Submarket, By Type Forecast 2020-2030
Figure 5.73 Rest of the World Wind Turbine Gear Oil Submarket , By Application Forecast 2020-2030
Figure 7.1 Exxon Mobil Corporation Total Company Sales 2013-2019 (US$ million, AGR %)
Figure 7.2 Evonik Industries AG Total Company Sales 2013-2019 (US$ million, AGR %)
Figure 7.3 BP Total Company Sales 2013-2019 (US$ Bn, AGR %)
Figure 7.6 Amsoil Inc. Company Sales 2013-2019 (US$ bn, AGR %)
Figure 7.7 Amsoil Inc. Revenue % Share, by Segment, 2019
Figure 7.8 Amsoil Inc. Revenue % Share, by Geographical Trade, 2019
Figure 7.9 Amsoil Inc. Revenue % Share, by Business Segment, 2019
Figure 7.10 Royal Dutch Shell plc, Revenue % Share, by Geographic Segment, 2019
Figure 7.11 Klüber Lubrication Company Total Company Sales 2013-2019 (US$ million, AGR %)
Figure 7.12 Fuchs Petrolub SE Total Company Sales 2013-2019 (US$ million, AGR %)
Figure 7.13 Fuchs Petrolub SE Revenue % Share, by Regional Segment, 2019
Figure 7.14 Croda International Plc Total Company Sales 2013-2019 (US$ million, AGR %)
Figure 7.15 Croda International Plc Revenue % Share, by Regional Segment, 2019
Figure 7.16 Croda International Plc Revenue % Share, by Business Segment, 2019
Figure 7.17 Chevron Total Company Sales 2013-2019 (US$ bn, AGR %)
Figure 7.18 Castrol Limited Total Company Revenue 2013-2019 (US$ bn, AGR %)
Figure 7.19 Castrol Limited Company Sales 2014-2019 (US$ bn, AGR %)
Figure 7.20 Castrol Limited Revenue % Share, by Business Segment, 2019