The Offshore Support Vessel Market Report 2022-2032: This report will prove invaluable to leading firms striving for new revenue pockets if they wish to better understand the industry and its underlying dynamics. It will be useful for companies that would like to expand into different industries or to expand their existing operations in a new region.
Technological Advancements Are Creating New Opportunities For The Specialised Vessel Fleet
Technology advancements and developments, particularly Storage Vessels, which provide a cost-effective alternative for the development of gas-to-power projects, are also critical. Many of the gas-to-power projects under consideration use vessels rather than more traditional onshore regasification facilities. FSRUs have several advantages, including the ability to be built offsite and quickly transported to the project’s location, as well as the possibility of lower risk than onshore development – especially if onshore development may face challenges such as increased security or permitting issues.
The technological advancements are creating new possibilities for the specialised vessel fleet There is anticipate changes in offshore vessel design, equipment, and systems, and they’re updating and expanding the guidance for these vessels right now so the industry can continue to look to them for guidance.
Operators are contracting multipurpose OSVs as a cost-effective tool for carrying out specialised services on platforms, offshore facilities, and piping equipment and systems as oil and gas moves into deeper, more demanding environments. Today’s OSVs are equipped with larger accommodation spaces, heavy lift cranes, helidecks, and streamlined bow forms for harsh-environment operations, as well as larger accommodation spaces, heavy lift cranes, helidecks, and streamlined bow forms for harsh-environment operations.
What Are These Questions You Should Ask Before Buying A Market Research Report?
• How is the offshore support vessel market evolving?
• What is driving and restraining the offshore support vessel market?
• How will each offshore support vessel submarket segment grow over the forecast period and how much revenue will these submarkets account for in 2032?
• How will the market shares for each offshore support vessel submarket develop from 2022 to 2032?
• What will be the main driver for the overall market from 2022 to 2032?
• Will leading offshore support vessel markets broadly follow the macroeconomic dynamics, or will individual national markets outperform others?
• How will the market shares of the national markets change by 2032 and which geographical region will lead the market in 2032?
• Who are the leading players and what are their prospects over the forecast period?
• What are the offshore support vessel projects for these leading companies?
• How will the industry evolve during the period between 2020 and 2032? What are the implication of offshore support vessel projects taking place now and over the next 10 years?
• Is there a greater need for product commercialisation to further scale the offshore support vessel market?
• Where is the offshore support vessel market heading? And how can you ensure you are at the forefront of the market?
• What can be the best investment options for new product and service lines?
• What are the key prospects for moving companies into a new growth path? C-suite?
You need to discover how this will impact the offshore support vessel market today, and over the next 10 years:
• Our 414-page report provides 314 tables and 311 charts/graphs exclusively to you.
• The report highlights key lucrative areas in the industry so you can target them – NOW.
• Contains in-depth analyse of global, regional and national sales and growth
• Highlights for you the key successful trends, changes and revenue projections made by your competitors
This report tells you TODAY how the offshore support vessel market will develop in the next 10 years, and in-line with the variations in COVID-19 economic recession and bounce. This market is more critical now than at any point over the last 10 years.
Delivers exclusive COVID-19 variations economic data specific to your market.
To access the data contained in this document please email contactus@visiongain.com
Forecasts to 2032 and other analyses reveal the commercial prospects
• In addition to revenue forecasting to 2032, our new study provides you with recent results, growth rates, and market shares.
• You find original analyses, with business outlooks and developments.
• Discover qualitative analyses (including market dynamics, drivers, opportunities, restraints and challenges), cost structure, impact of rising offshore support vessel prices and recent developments.
This report includes data analysis and invaluable insight into how COVID-19 will affect the industry and your company. Four COVID-19 recovery patterns and their impact, namely, V, L, W and U are discussed in this report.
Global Offshore Support Vessel Market (COVID Impact Analysis) by Application
• Shallow Water
• Deepwater
Global Offshore Support Vessel Market (COVID Impact Analysis) by End-Use
• Oil Supply
• Gas Supply
• Offshore Wind
Global Offshore Support Vessel Market (COVID Impact Analysis) by Type
• Platform Support Vessel
• Anchor Handling Tug Supply Vessel
• Multipurpose Support Vessel
• Standby and Rescue Vessel
• Other Vessel Type
Global Offshore Support Vessel Market (COVID Impact Analysis) by Vessel Size
• Small Vessels
• Medium Vessels
• Large Vessels
• Very Large Vessels

In addition to the revenue predictions for the overall world market and segments, you will also find revenue forecasts for 4 regional and 20 leading national markets:
North America Offshore Support Vessel Market, 2022 to 2032 Market Outlook
• U.S. Offshore Support Vessel Market, 2022 to 2032 Market Forecast & COVID Impact Analysis
• Canada Offshore Support Vessel Market, 2022 to 2032 Market Forecast & COVID Impact Analysis
• Mexico Offshore Support Vessel Market, 2022 to 2032 Market Forecast & COVID Impact Analysis
Europe Offshore Support Vessel Market, 2022 to 2032 Market Outlook
• Germany Offshore Support Vessel Market, 2022 to 2032 Market Forecast & COVID Impact Analysis
• Spain Offshore Support Vessel Market, 2022 to 2032 Market Forecast & COVID Impact Analysis
• United Kingdom Offshore Support Vessel Market, 2022 to 2032 Market Forecast & COVID Impact Analysis
• France Offshore Support Vessel Market, 2022 to 2032 Market Forecast & COVID Impact Analysis
• Russia Offshore Support Vessel Market, 2022 to 2032 Market Forecast & COVID Impact Analysis
• Rest of Europe Market Forecast & COVID Impact Analysis
Asia Pacific Offshore Support Vessel Market, 2022 to 2032 Market Outlook
• China Offshore Support Vessel Market, 2022 to 2032 Market Forecast & COVID Impact Analysis
• Japan Offshore Support Vessel Market, 2022 to 2032 Market Forecast & COVID Impact Analysis
• India Offshore Support Vessel Market, 2022 to 2032 Market Forecast & COVID Impact Analysis
• Australia Offshore Support Vessel Market, 2022 to 2032 Market Forecast & COVID Impact Analysis
• South Korea Offshore Support Vessel Market, 2022 to 2032 Market Forecast & COVID Impact Analysis
• Rest of Asia Pacific Market Forecast & COVID Impact Analysis
LAMEA Offshore Support Vessel Market, 2022 to 2032 Market Outlook
• Brazil Offshore Support Vessel Market, 2022 to 2032 Market Forecast & COVID Impact Analysis
• Turkey Offshore Support Vessel Market, 2022 to 2032 Market Forecast & COVID Impact Analysis
• Saudi Arabia Offshore Support Vessel Market, 2022 to 2032 Market Forecast & COVID Impact Analysis
• South Africa Offshore Support Vessel Market, 2022 to 2032 Market Forecast & COVID Impact Analysis
• UAE Offshore Support Vessel Market, 2022 to 2032 Market Forecast & COVID Impact Analysis
• Rest of Latin America, Middle East and Africa
Need industry data? Please contact us today.
The report also includes profiles and for some of the leading companies in the Offshore Support Vessel Market, 2022 to 2032, with a focus on this segment of these companies’ operations.
Leading companies and the potential for market growth
• DOF Group
• GC Rieber
• Grupo CBO
• Harvey Gulf International Marine
• Havila Shipping
• Kawasaki Heavy Industries
• Maersk Drilling A/S
• MMA Offshore Limited:
• Nam Cheong Limited
• PACC Offshore Service Holding
• Seacor Marine
• Siem Offshore
• Solstad Offshore
• Swire Pacific Offshore
• TideWater
• TideWater
Overall world revenue for Offshore Support Vessel Market, 2022 to 2032 in terms of value the market will surpass US$xx million in 2022, our work calculates. We predict strong revenue growth through to 2032. Our work identifies which organizations hold the greatest potential. Discover their capabilities, progress, and commercial prospects, helping you stay ahead.
How the Offshore Support Vessel Market, 2022 to 2032 Market report helps you?
In summary, our 410+ page report provides you with the following knowledge:
• Revenue forecasts to 2032 for Offshore Support Vessel Market, 2022 to 2032 Market, with forecasts for application, end-use, type each forecasted at a global and regional level– discover the industry’s prospects, finding the most lucrative places for investments and revenues
• Revenue forecasts to 2032 for 4 regional and 20 key national markets – See forecasts for the Offshore Support Vessel Market, 2022 to 2032 market in North America, Europe, Asia-Pacific and LAMEA. Also forecasted is the market in the US, Canada, Mexico, Brazil, Germany, France, UK, Italy, China, India, Japan, and Australia among other prominent economies.
• Prospects for established firms and those seeking to enter the market– including company profiles for 20 of the major companies involved in the Offshore Support Vessel Market, 2022 to 2032 Market.
Find quantitative and qualitative analyses with independent predictions. Receive information that only our report contains, staying informed with this invaluable business intelligence.
Information found nowhere else
With our newly report title, you are less likely to fall behind in knowledge or miss out on opportunities. See how our work could benefit your research, analyses, and decisions. Visiongain’s study is for everybody needing commercial analyses for the Offshore Support Vessel Market, 2022 to 2032 Market and leading companies. You will find data, trends and predictions.
To access the data contained in this document please email contactus@visiongain.com
Buy our report today Offshore Support Vessel Market Report 2022-2032: Forecasts by Application (Shallow Water, Deepwater), by End-use (Oil, Gas, Offshore Wind), by Type (Platform Support Vessel, Anchor Handling Tug Supply Vessel, Multipurpose Support Vessel, Standby and Rescue Vessel), by Vessel Size (Small, Medium, Large, Very Large) AND Regional and Leading National Market Analysis PLUS Analysis of Leading Companies AND COVID-19 Recovery Scenarios. Avoid missing out by staying informed – order our report now.
Visiongain is a trading partner with the US Federal Government
CCR Ref number: KD4R6
Do you have any custom requirements we can help you with? Any need for a specific country, geo region, market segment or specific company information? Contact us today, we can discuss your needs and see how we can help: sara.peerun@visiongain.com
1. Report Overview
1.1 Introduction to Offshore Support Vessel Market
1.2 Global Offshore Support Vessel Market Overview
1.3 What are the Objectives of this Report?
1.4 What is the Scope of the Report?
1.5 Offshore Support Vessel Market Definition
1.6 Why You Should Read This Report
1.7 What This Report Delivers
1.8 Key Questions Answered By This Analytical Report Include:
1.9 Who is This Report for?
1.10 Research Methodology
1.10.1 Primary Research
1.10.2 Secondary Research
1.10.3 Market Evaluation & Forecasting Methodology
1.11 Frequently Asked Questions (FAQs)
1.12 Associated Visiongain Reports
1.13 About Visiongain
2 Executive Summary
3 Global Market Dynamics
3.1 Impact of Covid-19 on Offshore Support Vessel Market
3.1 Current Trends in the Global Market
3.2 Market Driving Factors
3.2.1 Infrastructure Is A Major Motivator
3.2.2 Technological Advancements Are Creating New Opportunities For The Specialised Vessel Fleet.
3.2.3 Wind Power Installations Are Increasing Rapidly
3.3 Market Restraining Factors
3.3.1 Fuel Consumption Per Unit Of Output Produced Rises When Vessel’s Engines Run At Lower Power
3.3.2 Oil Spills Cause Major Economic Losses On The Coast.
3.3.3 A Lack Of Shipyards Capable Of Constructing A Vessel Poses A Potential Challenge.
3.4 Opportunities in the Global Market
3.4.1 Dynamic Positioning (DP) That Uses The Vessel's Own Propellers And Thrusters To Maintain The Vessel's Position And Heading.
3.4.2 Hybrid Power Technology Is Used In Maritime Shipping To Reduce Emissions And Climate Impacts.
3.4.3 Using Contracted Resources Lowers Costs
3.5 Challenges in the Global Market
3.5.1 The Use Of Renewable Energy Sources Such As Wind, Solar PV, Solar Thermal, And Geothermal Energy Is Encouraged In Most Countries.
3.5.2 Breakdowns Do Happen, Though They Are Rare, And When They Do, They Are Completely Unexpected.
3.5.3 Installation Cost Of Offshore Support Vessels Are Considered To Be So High
3.6 SWOT Analysis
3.7 PEST Analysis
3.8 Porters Five Forces
3.8.1 Competitive Rivalry
3.8.2 Bargaining Power of Buyers
3.8.3 Bargaining Power of Suppliers
3.8.4 Threat of Substitutes
3.8.5 The Threat Of New Entrants
4 Global Offshore Support Vessel Market Analysis
4.1 Global Market Outlook
4.2 Global Market Size Estimation and Forecast
4.2.1 Pre-COVID-19 Market Scenario
4.2.2 Post-COVID-19 Market Scenarios (V, W, U, L-Shaped Recovery Analysis)
5 Global Offshore Support Vessel Market Analysis By Region
5.1 North America
5.2 Europe
5.3 Asia-Pacific
5.4 LAMEA
5.5 Regional Market Size Estimation and Forecast
5.5.1 Pre-COVID-19 Market Scenario
5.5.2 Post-COVID-19 Market Scenarios (V, W, U, L-Shaped Recovery Analysis)
6 Global Market Size Estimation and Forecast By Application
6.1 Shallow Water
6.2 Deepwater
6.3 Pre-COVID-19 Market Scenario
6.4 Post-COVID-19 Market Scenarios (V, W, U, L-Shaped Recovery Analysis)
7 Global Market Size Estimation and Forecast By End-Use
7.1 Oil Supply
7.2 Gas Supply
7.3 Offshore Wind
7.4 Pre-COVID-19 Market Scenario
7.5 Post-COVID-19 Market Scenarios (V, W, U, L-Shaped Recovery Analysis)
8 Global Market Size Estimation and Forecast By Type
8.1 Platform Support Vessel
8.2 Anchor Handling Tug Supply Vessel
8.3 Multipurpose Support Vessel
8.4 Standby and Rescue Vessel
8.5 Pre-COVID-19 Market Scenario
8.6 Post-COVID-19 Market Scenarios (V, W, U, L-Shaped Recovery Analysis)
9 Global Market Size Estimation and Forecast By Vessel Size
9.1 Small Vessel
9.2 Medium Vessels
9.3 Large Vessels
9.4 Very Large
9.5 Pre-COVID-19 Market Scenario
9.6 Post-COVID-19 Market Scenarios (V, W, U, L-Shaped Recovery Analysis)
10 North America Market Size Estimation and Forecast
10.1 Market Outlook
10.2 North America Market Size Estimation and Forecast
10.2.1 Pre-COVID-19 Market Scenario
10.2.2 Post-COVID-19 Market Scenarios (V, W, U, L-Shaped Recovery Analysis)
10.3 Country Market Size Estimation and Forecast
10.3.1 Pre-COVID-19 Market Scenario
10.3.2 Post-COVID-19 Market Scenarios (V, W, U, L-Shaped Recovery Analysis)
10.4 North America Market Size Estimation and Forecast Application
10.4.1 Pre-COVID-19 Market Scenario
10.4.2 Post-COVID-19 Market Scenarios (V, W, U, L-Shaped Recovery Analysis)
10.5 North America Market Size Estimation and Forecast End-Use
10.5.1 Pre-COVID-19 Market Scenario
10.5.2 Post-COVID-19 Market Scenarios (V, W, U, L-Shaped Recovery Analysis)
10.6 North America Market Size Estimation and Forecast By Type
10.6.1 Pre-COVID-19 Market Scenario
10.6.2 Post-COVID-19 Market Scenarios (V, W, U, L-Shaped Recovery Analysis)
10.7 North America Market Size Estimation and Forecast Vessel Size
10.7.1 Pre-COVID-19 Market Scenario
10.7.2 Post-COVID-19 Market Scenarios (V, W, U, L-Shaped Recovery Analysis)
10.8 US Offshore Support Vessel Market Analysis
10.8.1 Offshore Wind Plays A Significant Role In A Sustainable US Energy Strategy.
10.8.2 US Growing Sector Of The Maritime Industry On Both A Domestic And International Scale
10.8.3 Pre-COVID-19 Market Scenario
10.8.4 Post-COVID-19 Market Scenarios (V, W, U, L-Shaped Recovery Analysis)
10.9 Canada Offshore Support Vessel Market Analysis
10.9.1 Offshore Support Vessel’s Projects Undertaken
10.9.2 Exploration Is Crucial For The Offshore Industry's Future
10.9.3 Pre-COVID-19 Market Scenario
10.9.4 Post-COVID-19 Market Scenarios (V, W, U, L-Shaped Recovery Analysis)
10.10 Mexico Offshore Support Vessel Market Analysis
10.10.1 The Gulf Of Mexico's Offshore Support Vessel Sector Is Improving.
10.10.2 Oil And Natural Gas Development On Nearly All Of The Territory's In Mexico
10.10.3 Pre-COVID-19 Market Scenario
10.10.4 Post-COVID-19 Market Scenarios (V, W, U, L-Shaped Recovery Analysis)
11 Europe Market Size Estimation and Forecast
11.1 Market Outlook
11.2 Europe Market Size Estimation and Forecast
11.2.1 Pre-COVID-19 Market Scenario
11.2.2 Post-COVID-19 Market Scenarios (V, W, U, L-Shaped Recovery Analysis)
11.3 Country Market Size Estimation and Forecast
11.3.1 Pre-COVID-19 Market Scenario
11.3.2 Post-COVID-19 Market Scenarios (V, W, U, L-Shaped Recovery Analysis)
11.4 Europe Market Size Estimation and Forecast Application
11.4.1 Pre-COVID-19 Market Scenario
11.4.2 Post-COVID-19 Market Scenarios (V, W, U, L-Shaped Recovery Analysis)
11.5 Europe Market Size Estimation and Forecast End-Use
11.5.1 Pre-COVID-19 Market Scenario
11.5.2 Post-COVID-19 Market Scenarios (V, W, U, L-Shaped Recovery Analysis)
11.6 Europe Market Size Estimation and Forecast Type
11.6.1 Pre-COVID-19 Market Scenario
11.6.2 Post-COVID-19 Market Scenarios (V, W, U, L-Shaped Recovery Analysis)
11.7 Europe Market Size Estimation and Forecast Vessel Size
11.7.1 Pre-COVID-19 Market Scenario
11.7.2 Post-COVID-19 Market Scenarios (V, W, U, L-Shaped Recovery Analysis)
11.8 Germany Offshore Support Vessel Market Analysis
11.8.1 The Expansion Of Offshore Renewable Energy In Germany
11.8.2 Germany Has Successfully Reduced Its Primary Energy Reliance On Oil And Gas By A Significant Amount.
11.8.3 Pre-COVID-19 Market Scenario
11.8.4 Post-COVID-19 Market Scenarios (V, W, U, L-Shaped Recovery Analysis)
11.9 UK Offshore Support Vessel Market Analysis
11.9.1 Projects Undertaken In UK Related To Offshore Support Vessel
11.9.2 Pre-COVID-19 Market Scenario
11.9.3 Post-COVID-19 Market Scenarios (V, W, U, L-Shaped Recovery Analysis)
11.10 France Offshore Support Vessel Market Analysis
11.10.1 Contracts Of Offshore Support Vessel In France
11.10.2 Pre-COVID-19 Market Scenario
11.10.3 Post-COVID-19 Market Scenarios (V, W, U, L-Shaped Recovery Analysis)
11.11 Spain Offshore Support Vessel Market Analysis
11.11.1 The World's Longest Offshore Construction Vessel In Spain
11.11.2 Pre-COVID-19 Market Scenario
11.11.3 Post-COVID-19 Market Scenarios (V, W, U, L-Shaped Recovery Analysis)
11.12 Russia Offshore Support Vessel Market Analysis
11.12.1 A New Multi-Purpose Icebreaking Supply Vessel For Production Platforms
11.12.2 A Significant Upgrade Of Arctic Vessels In Russia
11.12.3 Pre-COVID-19 Market Scenario
11.12.4 Post-COVID-19 Market Scenarios (V, W, U, L-Shaped Recovery Analysis)
11.13 Rest of Europe Offshore Support Vessel Market Analysis
11.13.1 Pre-COVID-19 Market Scenario
11.13.2 Post-COVID-19 Market Scenarios (V, W, U, L-Shaped Recovery Analysis)
12 Asia-Pacific Market Size Estimation and Forecast
12.1 Market Outlook
12.2 Asia-Pacific Market Size Estimation and Forecast
12.2.1 Pre-COVID-19 Market Scenario
12.2.2 Post-COVID-19 Market Scenarios (V, W, U, L-Shaped Recovery Analysis)
12.3 Country Market Size Estimation and Forecast
12.3.1 Pre-COVID-19 Market Scenario
12.3.2 Post-COVID-19 Market Scenarios (V, W, U, L-Shaped Recovery Analysis)
12.4 Asia-Pacific Market Size Estimation and Forecast Application
12.4.1 Pre-COVID-19 Market Scenario
12.4.2 Post-COVID-19 Market Scenarios (V, W, U, L-Shaped Recovery Analysis)
12.5 Asia-Pacific Market Size Estimation and Forecast End-Use
12.5.1 Pre-COVID-19 Market Scenario
12.5.2 Post-COVID-19 Market Scenarios (V, W, U, L-Shaped Recovery Analysis)
12.6 Asia-Pacific Market Size Estimation and Forecast Type
12.6.1 Pre-COVID-19 Market Scenario
12.6.2 Post-COVID-19 Market Scenarios (V, W, U, L-Shaped Recovery Analysis)
12.7 Asia-Pacific Market Size Estimation and Forecast Vessel Size
12.7.1 Pre-COVID-19 Market Scenario
12.7.2 Post-COVID-19 Market Scenarios (V, W, U, L-Shaped Recovery Analysis)
12.8 China Offshore Support Vessel Market Analysis
12.8.1 China's Domestically Developed Largest Offshore Oil Platform for Support Vessel
12.8.2 Projects Undertaken In China For Offshore Support Vessel
12.8.3 Pre-COVID-19 Market Scenario
12.8.4 Post-COVID-19 Market Scenarios (V, W, U, L-Shaped Recovery Analysis)
12.9 India Offshore Support Vessel Market Analysis
12.9.1 Company’s Offshore Support Vessels in India
12.9.2 Technology Requirements, And Financial Capability Have Increased In Recent Years In India
12.9.3 Small Businesses With A Limited Number Of Boats And Limited Capabilities Still Exist In India
12.9.4 Pre-COVID-19 Market Scenario
12.9.5 Post-COVID-19 Market Scenarios (V, W, U, L-Shaped Recovery Analysis)
12.10 Japan Offshore Support Vessel Market Analysis
12.10.1 The Majority Of Offshore Vessel Owners Around The World Have Given These Vessels High Marks In Japan
12.10.2 Lots of Development in Japan related to OSV (Offshore Support Vessel)
12.10.3 Pre-COVID-19 Market Scenario
12.10.4 Post-COVID-19 Market Scenarios (V, W, U, L-Shaped Recovery Analysis)
12.11 South Korea Offshore Support Vessel Market Analysis
12.11.1 South Korean Shipping Companies Had Surpassed Chinese Competitors
12.11.2 Contracts Undertaken In South Korea Related to Offshore Support Vessel
12.11.3 Pre-COVID-19 Market Scenario
12.11.4 Post-COVID-19 Market Scenarios (V, W, U, L-Shaped Recovery Analysis)
12.12 Australia Offshore Support Vessel Market Analysis
12.12.1 Contracts Undertaken in Australia related to Offshore Support Vessel
12.12.2 Pre-COVID-19 Market Scenario
12.12.3 Post-COVID-19 Market Scenarios (V, W, U, L-Shaped Recovery Analysis)
12.13 Rest of Asia-Pacific Offshore Support Vessel Market Analysis
12.13.1 Pre-COVID-19 Market Scenario
12.13.2 Post-COVID-19 Market Scenarios (V, W, U, L-Shaped Recovery Analysis)
13 LAMEA Market Size Estimation and Forecast
13.1 Market Outlook
13.2 LAMEA Market Size Estimation and Forecast
13.2.1 Pre-COVID-19 Market Scenario
13.2.2 Post-COVID-19 Market Scenarios (V, W, U, L-Shaped Recovery Analysis)
13.3 Country Market Size Estimation and Forecast
13.3.1 Pre-COVID-19 Market Scenario
13.3.2 Post-COVID-19 Market Scenarios (V, W, U, L-Shaped Recovery Analysis)
13.4 LAMEA Market Size Estimation and Forecast Application
13.4.1 Pre-COVID-19 Market Scenario
13.4.2 Post-COVID-19 Market Scenarios (V, W, U, L-Shaped Recovery Analysis)
13.5 LAMEA Market Size Estimation and Forecast End-Use
13.5.1 Pre-COVID-19 Market Scenario
13.5.2 Post-COVID-19 Market Scenarios (V, W, U, L-Shaped Recovery Analysis)
13.6 LAMEA Market Size Estimation and Forecast Type
13.6.1 Pre-COVID-19 Market Scenario
13.6.2 Post-COVID-19 Market Scenarios (V, W, U, L-Shaped Recovery Analysis)
13.7 LAMEA Market Size Estimation and Forecast Vessel Size
13.7.1 Pre-COVID-19 Market Scenario
13.7.2 Post-COVID-19 Market Scenarios (V, W, U, L-Shaped Recovery Analysis)
13.8 Brazil Offshore Support Vessel Market Analysis
13.8.1 Offshore Support Vessel Contracts undertaken in Brazil
13.8.2 Overall Development OD Offshore Support Vessel in Brazil
13.8.3 Pre-COVID-19 Market Scenario
13.8.4 Post-COVID-19 Market Scenarios (V, W, U, L-Shaped Recovery Analysis)
13.9 South Africa Offshore Support Vessel Market Analysis
13.9.1 Offshore Services Industry Should Consider Increasing Their Services To Ships In South Africa
13.9.2 Pre-COVID-19 Market Scenario
13.9.3 Post-COVID-19 Market Scenarios (V, W, U, L-Shaped Recovery Analysis)
13.10 Saudi Arabia Offshore Support Vessel Market Analysis
13.10.1 Offshore Vessel Owners In Saudi Arabia, Indicating A Significant Expansion Into The Saudi Offshore Oil And Gas Market.
13.10.2 Contracts related to Offshore Support Vessel in Saudi Arabia
13.10.3 Pre-COVID-19 Market Scenario
13.10.4 Post-COVID-19 Market Scenarios (V, W, U, L-Shaped Recovery Analysis)
13.11 Turkey Offshore Support Vessel Market Analysis
13.11.1 Development of Offshore Support Vessel in Turkey
13.11.2 Government is taking intiative for the growth of Offshore Support Vessel
13.11.3 Pre-COVID-19 Market Scenario
13.11.4 Post-COVID-19 Market Scenarios (V, W, U, L-Shaped Recovery Analysis)
13.12 UAE Offshore Support Vessel Market Analysis
13.12.1 UAE Is More Focusing To Explore Engineering, Procurement, And Construction Opportunities
13.12.2 Contracts undertaken in UAE for Offshore Support Vessel
13.12.3 Pre-COVID-19 Market Scenario
13.12.4 Post-COVID-19 Market Scenarios (V, W, U, L-Shaped Recovery Analysis)
13.13 Rest of LAMEA Offshore Support Vessel Market Analysis
13.13.1 Pre-COVID-19 Market Scenario
13.13.2 Post-COVID-19 Market Scenarios (V, W, U, L-Shaped Recovery Analysis)
14 Competitive Landscape
14.1 Company Market Ranking Analysis
14.2 Key Business Strategy Analysis
14.3 Collaboration as the Key Business Strategy In the Global Market
14.4 Joint Venture as the Key Business Strategy In the Global Market
14.5 Contract/ Agreement as the Key Business Strategy In the Global Market
14.6 Others as the Key Business Strategy In the Global Market
15 Leading Company Analysis and Profile
15.1 Maersk Drilling A/S
15.1.1 Company Snapshot
15.1.2 Company Overview
15.1.3 Company Financial Profile
15.1.4 Company Product Benchmarking
15.2 MMA Offshore
15.2.1 Company Snapshot
15.2.2 Company Overview
15.2.3 Company Financial Profile
15.2.4 Company Product Benchmarking
15.2.5 Company Recent Developments
15.3 Seacor Marine
15.3.1 Company Snapshot
15.3.2 Company Overview
15.3.3 Company Financial Profile
15.3.4 Company Product Benchmarking
15.3.5 Company Recent Developments
15.4 Solstad Offshore
15.4.1 Company Snapshot
15.4.2 Company Overview
15.4.3 Company Financial Profile
15.4.4 Company Product Benchmarking
15.4.5 Company Recent Developments
15.5 DOF Group
15.5.1 Company Snapshot
15.5.2 Company Overview
15.5.3 Company Financial Profile
15.5.4 Company Product Benchmarking
15.5.5 Company Recent Developments
15.6 Siem Offshore
15.6.1 Company Snapshot
15.6.2 Company Overview
15.6.3 Company Financial Profile
15.6.4 Company Product Benchmarking
15.6.5 Company Recent Developments
15.7 Swire Pacific Offshore
15.7.1 Company Snapshot
15.7.2 Company Overview
15.7.3 Company Product Benchmarking
15.8 Kawasaki Heavy Industries
15.8.1 Company Snapshot
15.8.2 Company Overview
15.8.3 Company Financial Profile
15.8.4 Company Product Benchmarking
15.8.5 Company Recent Developments
15.9 Havila Shipping
15.9.1 Company Snapshot
15.9.2 Company Overview
15.9.3 Company Financial Profile
15.9.4 Company Product Benchmarking
15.9.5 Company Recent Developments
15.10 Nam Cheong Limited
15.10.1 Company Snapshot
15.10.2 Company Overview
15.10.3 Company Financial Profile
15.10.4 Company Product Benchmarking
15.11 Harvey Gulf International Marine
15.11.1 Company Snapshot
15.11.2 Company Overview
15.11.3 Company Product Benchmarking
15.11.4 Company Recent Developments
15.12 GC Rieber
15.12.1 Company Snapshot
15.12.2 Company Overview
15.12.3 Company Financial Profile
15.12.4 Company Product Benchmarking
15.13 TideWater
15.13.1 Company Snapshot
15.13.2 Company Overview
15.13.3 Company Financial Profile
15.13.4 Company Product Benchmarking
15.14 PACC Offshore Service Holding
15.14.1 Company Snapshot
15.14.2 Company Overview
15.14.3 Company Product Benchmarking
15.15 Grupo CBO
15.15.1 Company Snapshot
15.15.2 Company Overview
15.15.3 Company Product Benchmarking
16 Conclusion and Recommendations
16.1 Conclusion Summary
16.2 Recommendations
17 Glossary Terms
List of Tables
Table 1 Global Offshore Support Vessel Market Forecast, 2022-2032 (USD Mn, AGR (%), CAGR(%))
Table 2 Global Offshore Support Vessel Market Snapshot, 2021 & 2031 (US$million, CAGR %)
Table 3 Global Offshore Support Vessel Market Forecast, 2022-2032 (USD Mn, AGR (%), CAGR(%))
Table 4 Global Offshore Support Vessel Market Forecast, 2022-2032 (USD Mn, AGR (%), CAGR(%))(V-Shaped Recovery Scenario)
Table 5 Global Offshore Support Vessel Market Forecast, 2022-2032 (USD Mn, AGR (%), CAGR(%))(W-Shaped Recovery Scenario)
Table 6 Global Offshore Support Vessel Market Forecast, 2022-2032 (USD Mn, AGR (%), CAGR(%))(U-Shaped Recovery Scenario)
Table 7 Global Offshore Support Vessel Market Forecast, 2022-2032 (USD Mn, AGR (%), CAGR(%))(L-Shaped Recovery Scenario)
Table 8 Global Offshore Support Vessel Market by Region, 2022-2032 (USD Mn, AGR (%), CAGR(%))
Table 9 Global Offshore Support Vessel Market by Region, 2022-2032 (USD Mn, AGR (%), CAGR(%))(V-Shaped Recovery Scenario)
Table 10 Global Offshore Support Vessel Market by Region, 2022-2032 (USD Mn, AGR (%), CAGR(%))(W-Shaped Recovery Scenario)
Table 11 Global Offshore Support Vessel Market by Region, 2022-2032 (USD Mn, AGR (%), CAGR(%))(U-Shaped Recovery Scenario)
Table 12 Global Offshore Support Vessel Market by Region, 2022-2032 (USD Mn, AGR (%), CAGR(%))(L-Shaped Recovery Scenario)
Table 13 Global Offshore Support Vessel Market by Application, 2022-2032 (USD Mn, AGR (%), CAGR(%))
Table 14 Global Offshore Support Vessel Market by Application, 2022-2032 (USD Mn, AGR (%), CAGR(%))(V-Shaped Recovery Scenario)
Table 15 Global Offshore Support Vessel Market by Application, 2022-2032 (USD Mn, AGR (%), CAGR(%))(W-Shaped Recovery Scenario)
Table 16 Global Offshore Support Vessel Market by Application, 2022-2032 (USD Mn, AGR (%), CAGR(%))(U-Shaped Recovery Scenario)
Table 17 Global Offshore Support Vessel Market by Application, 2022-2032 (USD Mn, AGR (%), CAGR(%))(L-Shaped Recovery Scenario)
Table 18 Global Offshore Support Vessel Market by End-Use, 2022-2032 (USD Mn, AGR (%), CAGR(%))
Table 19 Global Offshore Support Vessel Market by End-Use, 2022-2032 (USD Mn, AGR (%), CAGR(%))(V-Shaped Recovery Scenario)
Table 20 Global Offshore Support Vessel Market by End-Use, 2022-2032 (USD Mn, AGR (%), CAGR(%))(W-Shaped Recovery Scenario)
Table 21 Global Offshore Support Vessel Market by Application, 2022-2032 (USD Mn, AGR (%), CAGR(%))(U-Shaped Recovery Scenario)
Table 22 Global Offshore Support Vessel Market by End-Use, 2022-2032 (USD Mn, AGR (%), CAGR(%))(L-Shaped Recovery Scenario)
Table 23 Global Offshore Support Vessel Market by Type, 2022-2032 (USD Mn, AGR (%), CAGR(%))
Table 24 Global Offshore Support Vessel Market by Type, 2022-2032 (USD Mn, AGR (%), CAGR(%))(V-Shaped Recovery Scenario)
Table 25 Global Offshore Support Vessel Market by Type, 2022-2032 (USD Mn, AGR (%), CAGR(%))(W-Shaped Recovery Scenario)
Table 26 Global Offshore Support Vessel Market by Type, 2022-2032 (USD Mn, AGR (%), CAGR(%))(U-Shaped Recovery Scenario)
Table 27 Global Offshore Support Vessel Market by Type, 2022-2032 (USD Mn, AGR (%), CAGR(%))(L-Shaped Recovery Scenario)
Table 28 Global Offshore Support Vessel Market by Vessel Size, 2022-2032 (USD Mn, AGR (%), CAGR(%))
Table 29 Global Offshore Support Vessel Market by Vessel Size, 2022-2032 (USD Mn, AGR (%), CAGR(%))(V-Shaped Recovery Scenario)
Table 30 Global Offshore Support Vessel Market by Vessel Size, 2022-2032 (USD Mn, AGR (%), CAGR(%))(W-Shaped Recovery Scenario)
Table 31 Global Offshore Support Vessel Market by Vessel Size, 2022-2032 (USD Mn, AGR (%), CAGR(%))(U-Shaped Recovery Scenario)
Table 32 Global Offshore Support Vessel Market by Vessel Size, 2022-2032 (USD Mn, AGR (%), CAGR(%))(L-Shaped Recovery Scenario)
Table 33 North America Offshore Support Vessel Market by Value, 2022-2032 (USD Mn, AGR (%), CAGR(%))
Table 34 North America Offshore Support Vessel Market by Value, 2022-2032 (USD Mn, AGR (%), CAGR(%))(V-Shaped Recovery Scenario)
Table 35 North America Offshore Support Vessel Market by Value, 2022-2032 (USD Mn, AGR (%), CAGR(%))(W-Shaped Recovery Scenario)
Table 36 North America Offshore Support Vessel Market by Value, 2022-2032 (USD Mn, AGR (%), CAGR(%))(U-Shaped Recovery Scenario)
Table 37 North America Offshore Support Vessel Market by Value, 2022-2032 (USD Mn, AGR (%), CAGR(%))(L-Shaped Recovery Scenario)
Table 38 North America Offshore Support Vessel Market by Country, 2022-2032 (USD Mn, AGR (%), CAGR(%))
Table 39 North America Offshore Support Vessel Market by Country, 2022-2032 (USD Mn, AGR (%), CAGR(%))(V-Shaped Recovery Scenario)
Table 40 North America Offshore Support Vessel Market by Country, 2022-2032 (USD Mn, AGR (%), CAGR(%))(W-Shaped Recovery Scenario)
Table 41 North America Offshore Support Vessel Market by Country, 2022-2032 (USD Mn, AGR (%), CAGR(%))(U-Shaped Recovery Scenario)
Table 42 North America Offshore Support Vessel Market by Country, 2022-2032 (USD Mn, AGR (%), CAGR(%))(L-Shaped Recovery Scenario)
Table 43 North America Offshore Support Vessel Market by Application, 2022-2032 (USD Mn, AGR (%), CAGR(%))
Table 44 North America Offshore Support Vessel Market by Application, 2022-2032 (USD Mn, AGR (%), CAGR(%))(V-Shaped Recovery Scenario)
Table 45 North America Offshore Support Vessel Market by Application, 2022-2032 (USD Mn, AGR (%), CAGR(%))(W-Shaped Recovery Scenario)
Table 46 North America Offshore Support Vessel Market by Application, 2022-2032 (USD Mn, AGR (%), CAGR(%))(U-Shaped Recovery Scenario)
Table 47 North America Offshore Support Vessel Market by Application, 2022-2032 (USD Mn, AGR (%), CAGR(%))(L-Shaped Recovery Scenario)
Table 48 North America Offshore Support Vessel Market by End-Use, 2022-2032 (USD Mn, AGR (%), CAGR(%))
Table 49 North America Offshore Support Vessel Market by End-Use, 2022-2032 (USD Mn, AGR (%), CAGR(%))(V-Shaped Recovery Scenario)
Table 50 North America Offshore Support Vessel Market by End-Use, 2022-2032 (USD Mn, AGR (%), CAGR(%))(W-Shaped Recovery Scenario)
Table 51 North America Offshore Support Vessel Market by End-Use, 2022-2032 (USD Mn, AGR (%), CAGR(%))(U-Shaped Recovery Scenario)
Table 52 North America Offshore Support Vessel Market by End Use, 2022-2032 (USD Mn, AGR (%), CAGR(%))(L-Shaped Recovery Scenario)
Table 53 North America Offshore Support Vessel Market by Type, 2022-2032 (USD Mn, AGR (%), CAGR(%))
Table 54 North America Offshore Support Vessel Market by Type, 2022-2032 (USD Mn, AGR (%), CAGR(%))(V-Shaped Recovery Scenario)
Table 55 North America Offshore Support Vessel Market by Type, 2022-2032 (USD Mn, AGR (%), CAGR(%))(W-Shaped Recovery Scenario)
Table 56 North America Offshore Support Vessel Market by Type, 2022-2032 (USD Mn, AGR (%), CAGR(%))(U-Shaped Recovery Scenario)
Table 57 North America Offshore Support Vessel Market by Type, 2022-2032 (USD Mn, AGR (%), CAGR(%))(L-Shaped Recovery Scenario)
Table 58 North America Offshore Support Vessel Market by Vessel Size, 2022-2032 (USD Mn, AGR (%), CAGR(%))
Table 59 North America Offshore Support Vessel Market by Vessel Size, 2022-2032 (USD Mn, AGR (%), CAGR(%))(V-Shaped Recovery Scenario)
Table 60 North America Offshore Support Vessel Market by Vessel Size, 2022-2032 (USD Mn, AGR (%), CAGR(%))(W-Shaped Recovery Scenario)
Table 61 North America Offshore Support Vessel Market by Vessel Size, 2022-2032 (USD Mn, AGR (%), CAGR(%))(U-Shaped Recovery Scenario)
Table 62 North America Offshore Support Vessel Market by Vessel Size, 2022-2032 (USD Mn, AGR (%), CAGR(%))(L-Shaped Recovery Scenario)
Table 63 US Offshore Support Vessel Market by Value, 2022-2032 (USD Mn, AGR (%), CAGR(%))
Table 64 US Offshore Support Vessel Market by Value, 2022-2032 (USD Mn, AGR (%), CAGR(%))(V-Shaped Recovery Scenario)
Table 65 US Offshore Support Vessel Market by Value, 2022-2032 (USD Mn, AGR (%), CAGR(%))(W-Shaped Recovery Scenario)
Table 66 US Offshore Support Vessel Market by Value, 2022-2032 (USD Mn, AGR (%), CAGR(%))(U-Shaped Recovery Scenario)
Table 67 US Offshore Support Vessel Market by Value, 2022-2032 (USD Mn, AGR (%), CAGR(%))(L-Shaped Recovery Scenario)
Table 68 Canada Offshore Support Vessel Market by Value, 2022-2032 (USD Mn, AGR (%), CAGR(%))
Table 69 Canada Offshore Support Vessel Market by Value, 2022-2032 (USD Mn, AGR (%), CAGR(%))(V-Shaped Recovery Scenario)
Table 70 Canada Offshore Support Vessel Market by Value, 2022-2032 (USD Mn, AGR (%), CAGR(%))(W-Shaped Recovery Scenario)
Table 71 Canada Offshore Support Vessel Market by Value, 2022-2032 (USD Mn, AGR (%), CAGR(%))(U-Shaped Recovery Scenario)
Table 72 Canada Offshore Support Vessel Market by Value, 2022-2032 (USD Mn, AGR (%), CAGR(%))(L-Shaped Recovery Scenario)
Table 73 Mexico Offshore Support Vessel Market by Value, 2022-2032 (USD Mn, AGR (%), CAGR(%))
Table 74 Mexico Offshore Support Vessel Market by Value, 2022-2032 (USD Mn, AGR (%), CAGR(%))(V-Shaped Recovery Scenario)
Table 75 Mexico Offshore Support Vessel Market by Value, 2022-2032 (USD Mn, AGR (%), CAGR(%))(W-Shaped Recovery Scenario)
Table 76 Mexico Offshore Support Vessel Market by Value, 2022-2032 (USD Mn, AGR (%), CAGR(%))(U-Shaped Recovery Scenario)
Table 77 Mexico Offshore Support Vessel Market by Value, 2022-2032 (USD Mn, AGR (%), CAGR(%))(L-Shaped Recovery Scenario)
Table 78 Europe Offshore Support Vessel Market by Value, 2022-2032 (USD Mn, AGR (%), CAGR(%))
Table 79 Europe Offshore Support Vessel Market by Value, 2022-2032 (USD Mn, AGR (%), CAGR(%))(V-Shaped Recovery Scenario)
Table 80 Europe Offshore Support Vessel Market by Value, 2022-2032 (USD Mn, AGR (%), CAGR(%))(W-Shaped Recovery Scenario)
Table 81 Europe Offshore Support Vessel Market by Value, 2022-2032 (USD Mn, AGR (%), CAGR(%))(U-Shaped Recovery Scenario)
Table 82 Europe Offshore Support Vessel Market by Value, 2022-2032 (USD Mn, AGR (%), CAGR(%))(L-Shaped Recovery Scenario)
Table 83 Europe Offshore Support Vessel Market by Country, 2022-2032 (USD Mn, AGR (%), CAGR(%))
Table 84 Europe Offshore Support Vessel Market by Country, 2022-2032 (USD Mn, AGR (%), CAGR(%))(V-Shaped Recovery Scenario)
Table 85 Europe Offshore Support Vessel Market by Country, 2022-2032 (USD Mn, AGR (%), CAGR(%))(W-Shaped Recovery Scenario)
Table 86 Europe Offshore Support Vessel Market by Country, 2022-2032 (USD Mn, AGR (%), CAGR(%))(U-Shaped Recovery Scenario)
Table 87 Europe Offshore Support Vessel Market by Country, 2022-2032 (USD Mn, AGR (%), CAGR(%))(L-Shaped Recovery Scenario)
Table 88 Europe Offshore Support Vessel Market by Application, 2022-2032 (USD Mn, AGR (%), CAGR(%))
Table 89 .Europe Offshore Support Vessel Market by Application, 2022-2032 (USD Mn, AGR (%),CAGR(%))(V-ShapeRecovery)
Table 90 Europe Offshore Support Vessel Market by Application, 2022-2032 (USD Mn, AGR (%), CAGR(%))(W-Shaped Recovery Scenario)
Table 91 Europe Offshore Support Vessel Market by Application, 2022-2032 (USD Mn, AGR (%), CAGR(%))(U-Shaped Recovery Scenario)
Table 92 Europe Offshore Support Vessel Market by Application, 2022-2032 (USD Mn, AGR (%), CAGR(%))(L-Shaped Recovery Scenario)
Table 93 Europe Offshore Support Vessel Market by Type, 2022-2032 (USD Mn, AGR (%), CAGR(%))
Table 94 Europe Offshore Support Vessel Market by Type, 2022-2032 (USD Mn, AGR (%), CAGR(%))(V-Shaped Recovery Scenario)
Table 95 Europe Offshore Support Vessel Market by Type, 2022-2032 (USD Mn, AGR (%), CAGR(%))(W-Shaped Recovery Scenario)
Table 96 Europe Offshore Support Vessel Market by Type, 2022-2032 (USD Mn, AGR (%), CAGR(%))(U-Shaped Recovery Scenario)
Table 97 Europe Offshore Support Vessel Market by Type, 2022-2032 (USD Mn, AGR (%), CAGR(%))(L-Shaped Recovery Scenario)
Table 98 Europe Offshore Support Vessel Market by Type, 2022-2032 (USD Mn, AGR (%), CAGR(%))
Table 99 Europe Offshore Support Vessel Market by Type, 2022-2032 (USD Mn, AGR (%), CAGR(%))(V-Shaped Recovery Scenario)
Table 100 Europe Offshore Support Vessel Market by Type, 2022-2032 (USD Mn, AGR (%), CAGR(%))(W-Shaped Recovery Scenario)
Table 101 Europe Offshore Support Vessel Market by Type, 2022-2032 (USD Mn, AGR (%), CAGR(%))(U-Shaped Recovery Scenario)
Table 102 Europe Offshore Support Vessel Market by Type, 2022-2032 (USD Mn, AGR (%), CAGR(%))(L-Shaped Recovery Scenario)
Table 103 Europe Offshore Support Vessel Market by Vessel Size, 2022-2032 (USD Mn, AGR (%), CAGR(%))
Table 104 Europe Offshore Support Vessel Market by Vessel Size, 2022-2032 (USD Mn, AGR (%), CAGR(%))(V-Shaped Recovery Scenario)
Table 105 Europe Offshore Support Vessel Market by Vessel Size, 2022-2032 (USD Mn, AGR (%), CAGR(%))(W-Shaped Recovery Scenario)
Table 106 Europe Offshore Support Vessel Market by Vessel Size, 2022-2032 (USD Mn, AGR (%), CAGR(%))(U-Shaped Recovery Scenario)
Table 107 Europe Offshore Support Vessel Market by Vessel Size, 2022-2032 (USD Mn, AGR (%), CAGR(%))(L-Shaped Recovery Scenario)
Table 108 Germany Offshore Support Vessel Market by Value, 2022-2032 (USD Mn, AGR (%), CAGR(%))
Table 109 Germany Offshore Support Vessel Market by Value, 2022-2032 (USD Mn, AGR (%), CAGR(%))(V-Shaped Recovery Scenario)
Table 110 Germany Offshore Support Vessel Market by Value, 2022-2032 (USD Mn, AGR (%), CAGR(%))(W-Shaped Recovery Scenario)
Table 111 Germany Offshore Support Vessel Market by Value, 2022-2032 (USD Mn, AGR (%), CAGR(%))(U-Shaped Recovery Scenario)
Table 112 Germany Offshore Support Vessel Market by Value, 2022-2032 (USD Mn, AGR (%), CAGR(%))(L-Shaped Recovery Scenario)
Table 113 UK Offshore Support Vessel Market by Value, 2022-2032 (USD Mn, AGR (%), CAGR(%))
Table 114 UK Offshore Support Vessel Market by Value, 2022-2032 (USD Mn, AGR (%), CAGR(%))(V-Shaped Recovery Scenario)
Table 115 UK Offshore Support Vessel Market by Value, 2022-2032 (USD Mn, AGR (%), CAGR(%))(W-Shaped Recovery Scenario)
Table 116 UK Offshore Support Vessel Market by Value, 2022-2032 (USD Mn, AGR (%), CAGR(%))(U-Shaped Recovery Scenario)
Table 117 UK Offshore Support Vessel Market by Value, 2022-2032 (USD Mn, AGR (%), CAGR(%))(L-Shaped Recovery Scenario)
Table 118 France Offshore Support Vessel Market by Value, 2022-2032 (USD Mn, AGR (%), CAGR(%))
Table 119 France Offshore Support Vessel Market by Value, 2022-2032 (USD Mn, AGR (%), CAGR(%))(V-Shaped Recovery Scenario)
Table 120 France Offshore Support Vessel Market by Value, 2022-2032 (USD Mn, AGR (%), CAGR(%))(W-Shaped Recovery Scenario)
Table 121 France Offshore Support Vessel Market by Value, 2022-2032 (USD Mn, AGR (%), CAGR(%))(U-Shaped Recovery Scenario)
Table 122 France Offshore Support Vessel Market by Value, 2022-2032 (USD Mn, AGR (%), CAGR(%))(L-Shaped Recovery Scenario)
Table 123 Spain Offshore Support Vessel Market by Value, 2022-2032 (USD Mn, AGR (%), CAGR(%))
Table 124 Spain Offshore Support Vessel Market by Value, 2022-2032 (USD Mn, AGR (%), CAGR(%))(V-Shaped Recovery Scenario)
Table 125 Spain Offshore Support Vessel Market by Value, 2022-2032 (USD Mn, AGR (%), CAGR(%))(W-Shaped Recovery Scenario)
Table 126 Spain Offshore Support Vessel Market by Value, 2022-2032 (USD Mn, AGR (%), CAGR(%))(U-Shaped Recovery Scenario)
Table 127 Spain Offshore Support Vessel Market by Value, 2022-2032 (USD Mn, AGR (%), CAGR(%))(L-Shaped Recovery Scenario)
Table 128 Russia Offshore Support Vessel Market by Value, 2022-2032 (USD Mn, AGR (%), CAGR(%))
Table 129 Russia Offshore Support Vessel Market by Value, 2022-2032 (USD Mn, AGR (%), CAGR(%))(V-Shaped Recovery Scenario)
Table 130 Russia Offshore Support Vessel Market by Value, 2022-2032 (USD Mn, AGR (%), CAGR(%))(W-Shaped Recovery Scenario)
Table 131 Russia Offshore Support Vessel Market by Value, 2022-2032 (USD Mn, AGR (%), CAGR(%))(U-Shaped Recovery Scenario)
Table 132 Russia Offshore Support Vessel Market by Value, 2022-2032 (USD Mn, AGR (%), CAGR(%))(L-Shaped Recovery Scenario)
Table 133 Rest of Europe Offshore Support Vessel Market by Value, 2022-2032 (USD Mn, AGR (%), CAGR(%))
Table 134 Rest of Europe Offshore Support Vessel Market by Value, 2022-2032 (USD Mn, AGR (%), CAGR(%))(V-Shaped Recovery Scenario)
Table 135 Rest of Europe Offshore Support Vessel Market by Value, 2022-2032 (USD Mn, AGR (%), CAGR(%))(W-Shaped Recovery Scenario)
Table 136 Rest of Europe Offshore Support Vessel Market by Value, 2022-2032 (USD Mn, AGR (%), CAGR(%))(U-Shaped Recovery Scenario)
Table 137 Rest of Europe Offshore Support Vessel Market by Value, 2022-2032 (USD Mn, AGR (%), CAGR(%))(L-Shaped Recovery Scenario)
Table 138 Asia-Pacific Offshore Support Vessel Market by Value, 2022-2032 (USD Mn, AGR (%), CAGR(%))
Table 139 Asia-Pacific Offshore Support Vessel Market by Value, 2022-2032 (USD Mn, AGR (%), CAGR(%))(V-Shaped Recovery Scenario)
Table 140 Asia-Pacific Offshore Support Vessel Market by Value, 2022-2032 (USD Mn, AGR (%), CAGR(%))(W-Shaped Recovery Scenario)
Table 141 Asia-Pacific Offshore Support Vessel Market by Value, 2022-2032 (USD Mn, AGR (%), CAGR(%))(U-Shaped Recovery Scenario)
Table 142 Asia-Pacific Offshore Support Vessel Market by Value, 2022-2032 (USD Mn, AGR (%), CAGR(%))(L-Shaped Recovery Scenario)
Table 143 Asia-Pacific Offshore Support Vessel Market by Country, 2022-2032 (USD Mn, AGR (%), CAGR(%))
Table 144 Asia-Pacific Offshore Support Vessel Market by Country, 2022-2032 (USD Mn, AGR (%), CAGR(%))(V-Shaped Recovery Scenario)
Table 145 Asia-Pacific Offshore Support Vessel Market by Country, 2022-2032 (USD Mn, AGR (%), CAGR(%))(W-Shaped Recovery Scenario)
Table 146 Asia-Pacific Offshore Support Vessel Market by Country, 2022-2032 (USD Mn, AGR (%), CAGR(%))(U-Shaped Recovery Scenario)
Table 147 Asia-Pacific Offshore Support Vessel Market by Country, 2022-2032 (USD Mn, AGR (%), CAGR(%))(L-Shaped Recovery Scenario)
Table 148 Asia-Pacific Offshore Support Vessel Market by Application, 2022-2032 (USD Mn, AGR (%), CAGR(%))
Table 149 Asia-Pacific Offshore Support Vessel Market by Application, 2022-2032 (USD Mn, AGR (%), CAGR(%))(V-Shaped Recovery Scenario)
Table 150 Asia-Pacific Offshore Support Vessel Market by Application, 2022-2032 (USD Mn, AGR (%), CAGR(%))(W-Shaped Recovery Scenario)
Table 151 Asia-Pacific Offshore Support Vessel Market by Application, 2022-2032 (USD Mn, AGR (%), CAGR(%))(U-Shaped Recovery Scenario)
Table 152 Asia-Pacific Offshore Support Vessel Market by Application, 2022-2032 (USD Mn, AGR (%), CAGR(%))(L-Shaped Recovery Scenario)
Table 153 Asia-Pacific Offshore Support Vessel Market by Type, 2022-2032 (USD Mn, AGR (%), CAGR(%))
Table 154 Asia-Pacific Offshore Support Vessel Market by Type, 2022-2032 (USD Mn, AGR (%), CAGR(%))(V-Shaped Recovery Scenario)
Table 155 Asia-Pacific Offshore Support Vessel Market by Type, 2022-2032 (USD Mn, AGR (%), CAGR(%))(W-Shaped Recovery Scenario)
Table 156 Asia-Pacific Offshore Support Vessel Market by Type, 2022-2032 (USD Mn, AGR (%), CAGR(%))(U-Shaped Recovery Scenario)
Table 157 Asia-Pacific Offshore Support Vessel Market by Type, 2022-2032 (USD Mn, AGR (%), CAGR(%))(L-Shaped Recovery Scenario)
Table 158 Asia-Pacific Offshore Support Vessel Market by Type, 2022-2032 (USD Mn, AGR (%), CAGR(%))
Table 159 Asia-Pacific Offshore Support Vessel Market by Type, 2022-2032 (USD Mn, AGR (%), CAGR(%))(V-Shaped Recovery Scenario)
Table 160 Asia-Pacific Offshore Support Vessel Market by Type, 2022-2032 (USD Mn, AGR (%), CAGR(%))(W-Shaped Recovery Scenario)
Table 161 Asia-Pacific Offshore Support Vessel Market by Type, 2022-2032 (USD Mn, AGR (%), CAGR(%))(U-Shaped Recovery Scenario)
Table 162 Asia-Pacific Offshore Support Vessel Market by Type, 2022-2032 (USD Mn, AGR (%), CAGR(%))(L-Shaped Recovery Scenario)
Table 163 Asia-Pacific Offshore Support Vessel Market by Vessel Size, 2022-2032 (USD Mn, AGR (%), CAGR(%))
Table 164 Asia-Pacific Offshore Support Vessel Market by Vessel Size, 2022-2032 (USD Mn, AGR (%), CAGR(%))(V-Shaped Recovery Scenario)
Table 165 Asia-Pacific Offshore Support Vessel Market by Vessel Size, 2022-2032 (USD Mn, AGR (%), CAGR(%))(W-Shaped Recovery Scenario)
Table 166 Asia-Pacific Offshore Support Vessel Market by Vessel Size, 2022-2032 (USD Mn, AGR (%), CAGR(%))(U-Shaped Recovery Scenario)
Table 167 Asia-Pacific Offshore Support Vessel Market by Vessel Size, 2022-2032 (USD Mn, AGR (%), CAGR(%))(L-Shaped Recovery Scenario)
Table 168 China Offshore Support Vessel Market by Value, 2022-2032 (USD Mn, AGR (%), CAGR(%))
Table 169 China Offshore Support Vessel Market by Value, 2022-2032 (USD Mn, AGR (%), CAGR(%))(V-Shaped Recovery Scenario)
Table 170 China Offshore Support Vessel Market by Value, 2022-2032 (USD Mn, AGR (%), CAGR(%))(W-Shaped Recovery Scenario)
Table 171 China Offshore Support Vessel Market by Value, 2022-2032 (USD Mn, AGR (%), CAGR(%))(U-Shaped Recovery Scenario)
Table 172 China Offshore Support Vessel Market by Value, 2022-2032 (USD Mn, AGR (%), CAGR(%))(L-Shaped Recovery Scenario)
Table 173 India Offshore Support Vessel Market by Value, 2022-2032 (USD Mn, AGR (%), CAGR(%))
Table 174 India Offshore Support Vessel Market by Value, 2022-2032 (USD Mn, AGR (%), CAGR(%))(V-Shaped Recovery Scenario)
Table 175 India Offshore Support Vessel Market by Value, 2022-2032 (USD Mn, AGR (%), CAGR(%))(W-Shaped Recovery Scenario)
Table 176 India Offshore Support Vessel Market by Value, 2022-2032 (USD Mn, AGR (%), CAGR(%))(U-Shaped Recovery Scenario)
Table 177 India Offshore Support Vessel Market by Value, 2022-2032 (USD Mn, AGR (%), CAGR(%))(L-Shaped Recovery Scenario)
Table 178 Japan Offshore Support Vessel Market by Value, 2022-2032 (USD Mn, AGR (%), CAGR(%))
Table 179 Japan Offshore Support Vessel Market by Value, 2022-2032 (USD Mn, AGR (%), CAGR(%))(V-Shaped Recovery Scenario)
Table 180 Japan Offshore Support Vessel Market by Value, 2022-2032 (USD Mn, AGR (%), CAGR(%))(W-Shaped Recovery Scenario)
Table 181 Japan Offshore Support Vessel Market by Value, 2022-2032 (USD Mn, AGR (%), CAGR(%))(U-Shaped Recovery Scenario)
Table 182 Japan Offshore Support Vessel Market by Value, 2022-2032 (USD Mn, AGR (%), CAGR(%))(L-Shaped Recovery Scenario)
Table 183 South Korea Offshore Support Vessel Market by Value, 2022-2032 (USD Mn, AGR (%), CAGR(%))
Table 184 South Korea Offshore Support Vessel Market by Value, 2022-2032 (USD Mn, AGR (%), CAGR(%))(V-Shaped Recovery Scenario)
Table 185 South Korea Offshore Support Vessel Market by Value, 2022-2032 (USD Mn, AGR (%), CAGR(%))(W-Shaped Recovery Scenario)
Table 186 South Korea Offshore Support Vessel Market by Value, 2022-2032 (USD Mn, AGR (%), CAGR(%))(U-Shaped Recovery Scenario)
Table 187 South Korea Offshore Support Vessel Market by Value, 2022-2032 (USD Mn, AGR (%), CAGR(%))(L-Shaped Recovery Scenario)
Table 188 Australia Offshore Support Vessel Market by Value, 2022-2032 (USD Mn, AGR (%), CAGR(%))
Table 189 Australia Offshore Support Vessel Market by Value, 2022-2032 (USD Mn, AGR (%), CAGR(%))(V-Shaped Recovery Scenario)
Table 190 Australia Offshore Support Vessel Market by Value, 2022-2032 (USD Mn, AGR (%), CAGR(%))(W-Shaped Recovery Scenario)
Table 191 Australia Offshore Support Vessel Market by Value, 2022-2032 (USD Mn, AGR (%), CAGR(%))(U-Shaped Recovery Scenario)
Table 192 Australia Offshore Support Vessel Market by Value, 2022-2032 (USD Mn, AGR (%), CAGR(%))(L-Shaped Recovery Scenario)
Table 193 Rest of Asia-Pacific Offshore Support Vessel Market by Value, 2022-2032 (USD Mn, AGR (%), CAGR(%))
Table 194 Rest of Asia-Pacific Offshore Support Vessel Market by Value, 2022-2032 (USD Mn, AGR (%), CAGR(%))(V-Shaped Recovery Scenario)
Table 195 Rest of Asia-Pacific Offshore Support Vessel Market by Value, 2022-2032 (USD Mn, AGR (%), CAGR(%))(W-Shaped Recovery Scenario)
Table 196 Rest of Asia-Pacific Offshore Support Vessel Market by Value, 2022-2032 (USD Mn, AGR (%), CAGR(%))(U-Shaped Recovery Scenario)
Table 197 Rest of Asia-Pacific Offshore Support Vessel Market by Value, 2022-2032 (USD Mn, AGR (%), CAGR(%))(L-Shaped Recovery Scenario)
Table 198 LAMEA Offshore Support Vessel Market by Value, 2022-2032 (USD Mn, AGR (%), CAGR(%))
Table 199 LAMEA Offshore Support Vessel Market by Value, 2022-2032 (USD Mn, AGR (%), CAGR(%))(V-Shape Rcovery)
Table 200 LAMEA Offshore Support Vessel Market by Value, 2022-2032 (USD Mn, AGR (%), CAGR(%))
Table 201 LAMEA Offshore Support Vessel Market by Value, 2022-2032 (USD Mn, AGR (%), CAGR(%))(U-Shaped Recovery Scenario)
Table 202 LAMEA Offshore Support Vessel Market by Value, 2022-2032 (USD Mn, AGR (%), CAGR(%))(L-Shaped Recovery Scenario)
Table 203 LAMEA Offshore Support Vessel Market by Country, 2022-2032 (USD Mn, AGR (%), CAGR(%))
Table 204 LAMEA Offshore Support Vessel Market by Country, 2022-2032 (USD Mn, AGR (%), CAGR(%))(V-Shaped Recovery Scenario)
Table 205 LAMEA Offshore Support Vessel Market by Country, 2022-2032 (USD Mn, AGR (%), CAGR(%))
Table 206 LAMEA Offshore Support Vessel Market by Country, 2022-2032 (USD Mn, AGR (%), CAGR(%))(U-Shaped Recovery Scenario)
Table 207 LAMEA Offshore Support Vessel Market by Country, 2022-2032 (USD Mn, AGR (%), CAGR(%))(L-Shaped Recovery Scenario)
Table 208 LAMEA Offshore Support Vessel Market by Application, 2022-2032 (USD Mn, AGR (%), CAGR(%))
Table 209 LAMEA Offshore Support Vessel Market by Application, 2022-2032 (USD Mn, AGR (%), CAGR(%))(V-Shaped Recovery Scenario)
Table 210 LAMEA Offshore Support Vessel Market by Application, 2022-2032 (USD Mn, AGR (%), CAGR(%))(W-Shaped Recovery Scenario)
Table 211 LAMEA Offshore Support Vessel Market by Application, 2022-2032 (USD Mn, AGR (%), CAGR(%))(U-Shaped Recovery Scenario)
Table 212 LAMEA Offshore Support Vessel Market by Application, 2022-2032 (USD Mn, AGR (%), CAGR(%))(L-Shaped Recovery Scenario)
Table 213 LAMEA Offshore Support Vessel Market by Type, 2022-2032 (USD Mn, AGR (%), CAGR(%))
Table 214 LAMEA Offshore Support Vessel Market by Type, 2022-2032 (USD Mn, AGR (%), CAGR(%))(V-Shaped Recovery Scenario)
Table 215 LAMEA Offshore Support Vessel Market by Type, 2022-2032 (USD Mn, AGR (%), CAGR(%))(W-Shaped Recovery Scenario)
Table 216 LAMEA Offshore Support Vessel Market by Type, 2022-2032 (USD Mn, AGR (%), CAGR(%))(U-Shaped Recovery Scenario)
Table 217 LAMEA Offshore Support Vessel Market by Type, 2022-2032 (USD Mn, AGR (%), CAGR(%))(L-Shaped Recovery Scenario)
Table 218 LAMEA Offshore Support Vessel Market by Type, 2022-2032 (USD Mn, AGR (%), CAGR(%))
Table 219 LAMEA Offshore Support Vessel Market by Type, 2022-2032 (USD Mn, AGR (%), CAGR(%))(V-Shaped Recovery Scenario)
Table 220 LAMEA Offshore Support Vessel Market by Type, 2022-2032 (USD Mn, AGR (%), CAGR(%))(W-Shaped Recovery Scenario)
Table 221 LAMEA Offshore Support Vessel Market by Type, 2022-2032 (USD Mn, AGR (%), CAGR(%))(U-Shaped Recovery Scenario)
Table 222 LAMEA Offshore Support Vessel Market by Type, 2022-2032 (USD Mn, AGR (%), CAGR(%))(L-Shaped Recovery Scenario)
Table 223 LAMEA Offshore Support Vessel Market by Vessel Size, 2022-2032 (USD Mn, AGR (%), CAGR(%))
Table 224 LAMEA Offshore Support Vessel Market by Vessel Size, 2022-2032 (USD Mn, AGR (%), CAGR(%))(V-Shaped Recovery Scenario)
Table 225 LAMEA Offshore Support Vessel Market by Vessel Size, 2022-2032 (USD Mn, AGR (%), CAGR(%))(W-Shaped Recovery Scenario)
Table 226 LAMEA Offshore Support Vessel Market by Vessel Size, 2022-2032 (USD Mn, AGR (%), CAGR(%))(U-Shaped Recovery Scenario)
Table 227 LAMEA Offshore Support Vessel Market by Vessel Size, 2022-2032 (USD Mn, AGR (%), CAGR(%))(L-Shaped Recovery Scenario)
Table 228 Brazil Offshore Support Vessel Market by Value, 2022-2032 (USD Mn, AGR (%), CAGR(%))
Table 229 Brazil Offshore Support Vessel Market by Value, 2022-2032 (USD Mn, AGR (%), CAGR(%))(V-Shaped Recovery Scenario)
Table 230 Brazil Offshore Support Vessel Market by Value, 2022-2032 (USD Mn, AGR (%), CAGR(%))(W-Shaped Recovery Scenario)
Table 231 Brazil Offshore Support Vessel Market by Value, 2022-2032 (USD Mn, AGR (%), CAGR(%))(U-Shaped Recovery Scenario)
Table 232 Brazil Offshore Support Vessel Market by Value, 2022-2032 (USD Mn, AGR (%), CAGR(%))(L-Shaped Recovery Scenario)
Table 233 South Africa Offshore Support Vessel Market by Value, 2022-2032 (USD Mn, AGR (%), CAGR(%))
Table 234 South Africa Offshore Support Vessel Market by Value, 2022-2032 (USD Mn, AGR (%), CAGR(%))(V-Shaped Recovery Scenario)
Table 235 South Africa Offshore Support Vessel Market by Value, 2022-2032 (USD Mn, AGR (%), CAGR(%))(W-Shaped Recovery Scenario)
Table 236 South Africa Offshore Support Vessel Market by Value, 2022-2032 (USD Mn, AGR (%), CAGR(%))(U-Shaped Recovery Scenario)
Table 237 South Africa Offshore Support Vessel Market by Value, 2022-2032 (USD Mn, AGR (%), CAGR(%))(L-Shaped Recovery Scenario)
Table 238 Saudi Arabia Offshore Support Vessel Market by Value, 2022-2032 (USD Mn, AGR (%), CAGR(%))
Table 239 Saudi Arabia Offshore Support Vessel Market by Value, 2022-2032 (USD Mn, AGR (%), CAGR(%))(V-Shaped Recovery Scenario)
Table 240 Saudi Arabia Offshore Support Vessel Market by Value, 2022-2032 (USD Mn, AGR (%), CAGR(%))(W-Shaped Recovery Scenario)
Table 241 Saudi Arabia Offshore Support Vessel Market by Value, 2022-2032 (USD Mn, AGR (%), CAGR(%))(U-Shaped Recovery Scenario)
Table 242 Saudi Arabia Offshore Support Vessel Market by Value, 2022-2032 (USD Mn, AGR (%), CAGR(%))(L-Shaped Recovery Scenario)
Table 243 Turkey Offshore Support Vessel Market by Value, 2022-2032 (USD Mn, AGR (%), CAGR(%))
Table 244 Turkey Offshore Support Vessel Market by Value, 2022-2032 (USD Mn, AGR (%), CAGR(%))(V-Shaped Recovery Scenario)
Table 245 Turkey Offshore Support Vessel Market by Value, 2022-2032 (USD Mn, AGR (%), CAGR(%))(W-Shaped Recovery Scenario)
Table 246 Turkey Offshore Support Vessel Market by Value, 2022-2032 (USD Mn, AGR (%), CAGR(%))(U-Shaped Recovery Scenario)
Table 247 Turkey Offshore Support Vessel Market by Value, 2022-2032 (USD Mn, AGR (%), CAGR(%))(L-Shaped Recovery Scenario)
Table 248 UAE Offshore Support Vessel Market by Value, 2022-2032 (USD Mn, AGR (%), CAGR(%))
Table 249 UAE Offshore Support Vessel Market by Value, 2022-2032 (USD Mn, AGR (%), CAGR(%))(V-Shaped Recovery Scenario)
Table 250 UAE Offshore Support Vessel Market by Value, 2022-2032 (USD Mn, AGR (%), CAGR(%))(W-Shaped Recovery Scenario)
Table 251 UAE Offshore Support Vessel Market by Value, 2022-2032 (USD Mn, AGR (%), CAGR(%))(U-Shaped Recovery Scenario)
Table 252 UAE Offshore Support Vessel Market by Value, 2022-2032 (USD Mn, AGR (%), CAGR(%))(L-Shaped Recovery Scenario)
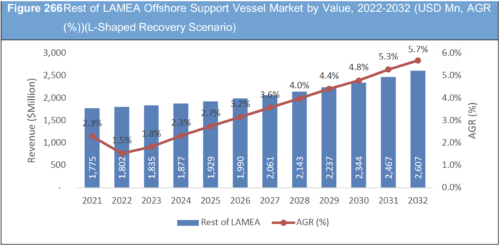
Table 253 Rest of LAMEA Offshore Support Vessel Market by Value, 2022-2032 (USD Mn, AGR (%), CAGR(%))
Table 254 Rest of LAMEA Offshore Support Vessel Market by Value, 2022-2032 (USD Mn, AGR (%), CAGR(%))(V-Shaped Recovery Scenario)
Table 255 Rest of LAMEA Offshore Support Vessel Market by Value, 2022-2032 (USD Mn, AGR (%), CAGR(%))(W-Shaped Recovery Scenario)
Table 256 Rest of LAMEA Offshore Support Vessel Market by Value, 2022-2032 (USD Mn, AGR (%), CAGR(%))(U-Shaped Recovery Scenario)
Table 257 Rest of LAMEA Offshore Support Vessel Market by Value, 2022-2032 (USD Mn, AGR (%), CAGR(%))(L-Shaped Recovery Scenario)
Table 258 Company Market Ranking Analysis
Table 259 Collaboration Strategy Adopted by Key Players in Global Offshore Support Vessel Market, 2018-2021
Table 260 Joint Venture Strategy Adopted by Key Players in Global Offshore Support Vessel Market, 2018-2021
Table 261 Contract/Agreement Strategy Adopted by Key Players in GlobalOffshore Support Vessel Market, 2018-2021
Table 262 Contract Strategy Adopted by Key Players in Global Offshore Support Vessel Market, 2018-2021
Table 263 Maersk Drilling A/S: Company Information
Table 264 Maersk Drilling A/S: Company Revenue 2016-2020 (US$Mn, AGR (%))
Table 265 Maersk Drilling A/S: Company Product and Service Benchmarking
Table 266 MMA Offshore Limited.: Company Information
Table 267 MMA Offshore Limited: Company Revenue 2017-2021(US$Mn, AGR (%))
Table 268 MMA Offshore Limited.: Company Product and Service Benchmarking
Table 269 MMA Offshore Limited.: Company Recent Developments till Dec,2021
Table 270 Seacor Marine.: Company Information
Table 271 Seacor Marine.: Company Revenue 2016-2020(US$Mn, AGR (%))
Table 272 Seacor Marine.: Company Product and Service
Table 273 Seacor Marine Recent Developments till Dec,2021
Table 274 Solstad Offshore: Company Information
Table 275 Solstad Offshore: Company Revenue 2016-2020(US$Mn, AGR (%))
Table 276 Solstad Offshore: Company Product and Service Benchmarking
Table 277 Solstad Offshore.: Company Recent Developments till Dec,2021
Table 278 DOF Group.: Company Information
Table 279 DOF Group: Company Revenue 2016-2020(US$Mn, AGR (%))
Table 280 DOF Group: Company Product and Service Benchmarking
Table 281 DOF Group.: Company Recent Developments till Dec,2021
Table 282 Siem Offshore.: Company Information
Table 283 Siem Offshore: Company Revenue 2016-2020(US$Mn, AGR (%))
Table 284 Siem Offshore.: Company Product and Service
Table 285 Siem Offshore.: Company Recent Developments till Dec,2021
Table 286 Swire Pacific Offshore.: Company Information
Table 287 Swire Pacific Offshore.: Company Product and Service
Table 288 Kawasaki Heavy Industries.: Company Information
Table 289 Kawasaki Heavy Industries: Company Revenue 2016-2020 (US$Mn, AGR (%))
Table 290 Kawasaki Heavy Industries: Company Product and Service
Table 291 Kawasaki Heavy Industries.: Company Recent Developments till Dec,2021
Table 292 Havila Shipping.: Company Information
Table 293 Havila Shipping: Company Revenue 2016-2020 (US$Mn, AGR (%))
Table 294 Havila Shipping: Company Product and Service Benchmarking
Table 295 Havila Shipping.: Company Recent Developments till Dec,2021
Table 296 Nam Cheong Limited: Company Information
Table 297 Nam Cheong Limited: Company Revenue 2016-2020(US$Mn, AGR (%))
Table 298 Nam Cheong Limited: Company Product and Service Benchmarking
Table 299 Harvey Gulf International Marine: Company Information
Table 300 Harvey Gulf International Marine: Company Product and Service Benchmarking
Table 301 Harvey gulf international marine: Company Recent Developments
Table 302 GC Rieber.: Company Information
Table 303 GC Rieber: Company Revenue 2016-2020(US$Mn, AGR (%))
Table 304 GC Rieber: Company Product and Service Benchmarking
Table 305 TideWater: Company Information
Table 306 TideWater: Company Revenue 2016-2020(US$Mn, AGR (%))
Table 307 TideWater: Company Product and Service
Table 308 PACC Offshore Service Holding : Company Information
Table 309 PACC Offshore Service Holding : Company Product and Service Benchmarking
Table 310 Grupo CBO : Company Information
Table 311 Grupo CBO : Company Product and Service Benchmarking
List of Figures
Figure 1 Global Offshore Support Vessel Market Forecast, 2022-2032 (USD Mn, AGR (%))
Figure 2 Global Offshore Support Vessel Market Segmentation
Figure 3 Offshore Support Vessel Market Trends
Figure 4 SWOT Analysis
Figure 5 PEST Analysis
Figure 6 Porters Five Forces
Figure 7 Global Offshore Support Vessel Market Forecast, 2022-2032 (USD Mn, AGR (%))
Figure 8 Global Offshore Support Vessel Market Forecast, 2022-2032 (USD Mn, AGR (%))(V-Shaped Recovery Scenario)
Figure 9 Global Offshore Support Vessel Market Forecast, 2022-2032 (USD Mn, AGR (%))(W-Shaped Recovery Scenario)
Figure 10 Global Offshore Support Vessel Market Forecast, 2022-2032 (USD Mn, AGR (%))(U-Shaped Recovery Scenario)
Figure 11 Global Offshore Support Vessel Market Forecast, 2022-2032 (USD Mn, AGR (%))(L-Shaped Recovery Scenario)
Figure 12 Offshore Support Vessel Market Share Forecast by Region 2022, 2027, 2032 (%)
Figure 13 Global Offshore Support Vessel Market by Region, 2022-2032 (USD Mn, AGR (%))
Figure 14 Global Offshore Support Vessel Market by Region, 2022-2032 (USD Mn, AGR (%))(V-Shaped Recovery Scenario)
Figure 15 Global Offshore Support Vessel Market by Region, 2022-2032 (USD Mn, AGR (%))(W-Shaped Recovery Scenario)
Figure 16 Global Offshore Support Vessel Market by Region, 2022-2032 (USD Mn, AGR (%))(U-Shaped Recovery Scenario)
Figure 17 Global Offshore Support Vessel Market by Region, 2022-2032 (USD Mn, AGR (%))(L-Shaped Recovery Scenario)
Figure 18 Offshore Support Vessel Market Share Forecast by Application 2022, 2027, 2032 (%)
Figure 19 Global Offshore Support Vessel Market by Application, 2022-2032 (USD Mn, AGR (%))
Figure 20 Global Offshore Support Vessel Market by Application, 2022-2032 (USD Mn, AGR (%))(V-Shaped Recovery Scenario)
Figure 21 Global Offshore Support Vessel Market by Application, 2022-2032 (USD Mn, AGR (%))(W-Shaped Recovery Scenario)
Figure 22 Global Offshore Support Vessel Market by Application, 2022-2032 (USD Mn, AGR (%))(U-Shaped Recovery Scenario)
Figure 23 Global Offshore Support Vessel Market by Application, 2022-2032 (USD Mn, AGR (%))(L-Shaped Recovery Scenario)
Figure 24 Offshore Support Vessel Market Share Forecast by End-Use 2022, 2027, 2032 (%)
Figure 25 Global Offshore Support Vessel Market by End-Use, 2022-2032 (USD Mn, AGR (%))
Figure 26 Global Offshore Support Vessel Market by End-Use, 2022-2032 (USD Mn, AGR (%))(V-Shaped Recovery Scenario)
Figure 27 Global Offshore Support Vessel Market by End-Use, 2022-2032 (USD Mn, AGR (%))(W-Shaped Recovery Scenario)
Figure 28 Global Offshore Support Vessel Market by Application, 2022-2032 (USD Mn, AGR (%))(U-Shaped Recovery Scenario)
Figure 29 Global Offshore Support Vessel Market by End-Use, 2022-2032 (USD Mn, AGR (%))(L-Shaped Recovery Scenario)
Figure 30 Offshore Support Vessel Market Share Forecast by Type 2022, 2027, 2032 (%)
Figure 31 Global Offshore Support Vessel Market by Type, 2022-2032 (USD Mn, AGR (%))
Figure 32 Global Offshore Support Vessel Market by Type, 2022-2032 (USD Mn, AGR (%))(V-Shaped Recovery Scenario)
Figure 33 Global Offshore Support Vessel Market by Type, 2022-2032 (USD Mn, AGR (%))(W-Shaped Recovery Scenario)
Figure 34 Global Offshore Support Vessel Market by Type, 2022-2032 (USD Mn, AGR (%))(U-Shaped Recovery Scenario)
Figure 35 Global Offshore Support Vessel Market by Type, 2022-2032 (USD Mn, AGR (%))(L-Shaped Recovery Scenario)
Figure 36 Offshore Support Vessel Market Share Forecast by Vessel Size 2022, 2027, 2032 (%)
Figure 37 Global Offshore Support Vessel Market by Vessel Size, 2022-2032 (USD Mn, AGR (%))
Figure 38 Global Offshore Support Vessel Market by Vessel Size, 2022-2032 (USD Mn, AGR (%))(V-Shaped Recovery Scenario)
Figure 39 Global Offshore Support Vessel Market by Vessel Size, 2022-2032 (USD Mn, AGR (%))(W-Shaped Recovery Scenario)
Figure 40 Global Offshore Support Vessel Market by Vessel Size, 2022-2032 (USD Mn, AGR (%))(U-Shaped Recovery Scenario)
Figure 41 Global Offshore Support Vessel Market by Vessel Size, 2022-2032 (USD Mn, AGR (%))(L-Shaped Recovery Scenario)
Figure 42 North America Offshore Support Vessel Market by Value, 2022-2032 (USD Mn, AGR (%))
Figure 43 North America Offshore Support Vessel Market by Value, 2022-2032 (USD Mn, AGR (%))(V-Shaped Recovery Scenario)
Figure 44 North America Offshore Support Vessel Market by Value, 2022-2032 (USD Mn, AGR (%))(W-Shaped Recovery Scenario)
Figure 45 North America Offshore Support Vessel Market by Value, 2022-2032 (USD Mn, AGR (%))(U-Shaped Recovery Scenario)
Figure 46 North America Offshore Support Vessel Market by Value, 2022-2032 (USD Mn, AGR (%))(L-Shaped Recovery Scenario)
Figure 47 North America Offshore Support Vessel Market by Country, 2022-2032 (USD Mn, AGR (%))
Figure 48 North America Offshore Support Vessel Market by Country, 2022-2032 (USD Mn, AGR (%))(V-Shaped Recovery Scenario)
Figure 49 North America Offshore Support Vessel Market by Country, 2022-2032 (USD Mn, AGR (%))(W-Shaped Recovery Scenario)
Figure 50 North America Offshore Support Vessel Market by Country, 2022-2032 (USD Mn, AGR (%))(U-Shaped Recovery Scenario)
Figure 51 North America Offshore Support Vessel Market by Country, 2022-2032 (USD Mn, AGR (%))(L-Shaped Recovery Scenario)
Figure 52 North America Offshore Support Vessel Market by Application, 2022-2032 (USD Mn, AGR (%))
Figure 53 North America Offshore Support Vessel Market by Application, 2022-2032 (USD Mn, AGR (%))(V-Shaped Recovery Scenario)
Figure 54 North America Offshore Support Vessel Market by Application, 2022-2032 (USD Mn, AGR (%))(W-Shaped Recovery Scenario)
Figure 55 North America Offshore Support Vessel Market by Application, 2022-2032 (USD Mn, AGR (%))(U-Shaped Recovery Scenario)
Figure 56 North America Offshore Support Vessel Market by Application, 2022-2032 (USD Mn, AGR (%))(L-Shaped Recovery Scenario)
Figure 57 North America Offshore Support Vessel Market by End-Use, 2022-2032 (USD Mn, AGR (%))
Figure 58 North America Offshore Support Vessel Market by Type, 2022-2032 (USD Mn, AGR (%))(V-Shaped Recovery Scenario)
Figure 59 North America Offshore Support Vessel Market by End-Use, 2022-2032 (USD Mn, AGR (%))(W-Shaped Recovery Scenario)
Figure 60 North America Offshore Support Vessel Market by Type, 2022-2032 (USD Mn, AGR (%))(U-Shaped Recovery Scenario)
Figure 61 North America Offshore Support Vessel Market by Type, 2022-2032 (USD Mn, AGR (%))(L-Shaped Recovery Scenario)
Figure 62 North America Offshore Support Vessel Market by Type, 2022-2032 (USD Mn, AGR (%))
Figure 63 North America Offshore Support Vessel Market by Type, 2022-2032 (USD Mn, AGR (%))(V-Shaped Recovery Scenario)
Figure 64 North America Offshore Support Vessel Market by Type, 2022-2032 (USD Mn, AGR (%))(W-Shaped Recovery Scenario)
Figure 65 North America Offshore Support Vessel Market by Type, 2022-2032 (USD Mn, AGR (%))(U-Shaped Recovery Scenario)
Figure 66 North America Offshore Support Vessel Market by Type, 2022-2032 (USD Mn, AGR (%))(L-Shaped Recovery Scenario)
Figure 67 North America Offshore Support Vessel Market by Vessel Size, 2022-2032 (USD Mn, AGR (%))
Figure 68 North America Offshore Support Vessel Market by Vessel Size, 2022-2032 (USD Mn, AGR (%))(V-Shaped Recovery Scenario)
Figure 69 North America Offshore Support Vessel Market by Vessel Size, 2022-2032 (USD Mn, AGR (%))(W-Shaped Recovery Scenario)
Figure 70 North America Offshore Support Vessel Market by Vessel Size, 2022-2032 (USD Mn, AGR (%))(U-Shaped Recovery Scenario)
Figure 71 North America Offshore Support Vessel Market by Vessel Size, 2022-2032 (USD Mn, AGR (%))(L-Shaped Recovery Scenario)
Figure 72 US Offshore Support Vessel Market by Value, 2022-2032 (USD Mn, AGR (%))
Figure 73 US Offshore Support Vessel Market by Value, 2022-2032 (USD Mn, AGR (%))(V-Shaped Recovery Scenario)
Figure 74 US Offshore Support Vessel Market by Value, 2022-2032 (USD Mn, AGR (%))(W-Shaped Recovery Scenario)
Figure 75 US Offshore Support Vessel Market by Value, 2022-2032 (USD Mn, AGR (%))(U-Shaped Recovery Scenario)
Figure 76 US Offshore Support Vessel Market by Value, 2022-2032 (USD Mn, AGR (%))(L-Shaped Recovery Scenario)
Figure 77 Canada Offshore Support Vessel Market by Value, 2022-2032 (USD Mn, AGR (%))
Figure 78 Canada Offshore Support Vessel Market by Value, 2022-2032 (USD Mn, AGR (%))(V-Shaped Recovery Scenario)
Figure 79 Canada Offshore Support Vessel Market by Value, 2022-2032 (USD Mn, AGR (%))(W-Shaped Recovery Scenario)
Figure 80 Canada Offshore Support Vessel Market by Value, 2022-2032 (USD Mn, AGR (%))(U-Shaped Recovery Scenario)
Figure 81 Canada Offshore Support Vessel Market by Value, 2022-2032 (USD Mn, AGR (%))(L-Shaped Recovery Scenario)
Figure 82 Mexico Offshore Support Vessel Market by Value, 2022-2032 (USD Mn, AGR (%))
Figure 83 Mexico Offshore Support Vessel Market by Value, 2022-2032 (USD Mn, AGR (%))(V-Shaped Recovery Scenario)
Figure 84 Mexico Offshore Support Vessel Market by Value, 2022-2032 (USD Mn, AGR (%))(W-Shaped Recovery Scenario)
Figure 85 Mexico Offshore Support Vessel Market by Value, 2022-2032 (USD Mn, AGR (%))(U-Shaped Recovery Scenario)
Figure 86 Mexico Offshore Support Vessel Market by Value, 2022-2032 (USD Mn, AGR (%))(L-Shaped Recovery Scenario)
Figure 87 Europe Offshore Support Vessel Market by Value, 2022-2032 (USD Mn, AGR (%))
Figure 88 Europe Offshore Support Vessel Market by Value, 2022-2032 (USD Mn, AGR (%))(V-Shaped Recovery Scenario)
Figure 89 Europe Offshore Support Vessel Market by Value, 2022-2032 (USD Mn, AGR (%))(W-Shaped Recovery Scenario)
Figure 90 Europe Offshore Support Vessel Market by Value, 2022-2032 (USD Mn, AGR (%))(U-Shaped Recovery Scenario)
Figure 91 Europe Offshore Support Vessel Market by Value, 2022-2032 (USD Mn, AGR (%))(L-Shaped Recovery Scenario)
Figure 92 Europe Offshore Support Vessel Market by Country, 2022-2032 (USD Mn, AGR (%))
Figure 93 Europe Offshore Support Vessel Market by Country, 2022-2032 (USD Mn, AGR (%))(V-Shaped Recovery Scenario)
Figure 94 Europe Offshore Support Vessel Market by Country, 2022-2032 (USD Mn, AGR (%))(W-Shaped Recovery Scenario)
Figure 95 Europe Offshore Support Vessel Market by Country, 2022-2032 (USD Mn, AGR (%))(U-Shaped Recovery Scenario)
Figure 96 Europe Offshore Support Vessel Market by Country, 2022-2032 (USD Mn, AGR (%))(L-Shaped Recovery Scenario)
Figure 97 Europe Offshore Support Vessel Market by Application, 2022-2032 (USD Mn, AGR (%))
Figure 98 Europe Offshore Support Vessel Market by Application, 2022-2032 (USD Mn, AGR (%))(V-ShapeRecovery)
Figure 99 Europe Offshore Support Vessel Market by Application, 2022-2032 (USD Mn, AGR (%))(W-Shaped Recovery Scenario)
Figure 100 Europe Offshore Support Vessel Market by Application, 2022-2032 (USD Mn, AGR (%))(U-Shaped Recovery Scenario)
Figure 101 Europe Offshore Support Vessel Market by Application, 2022-2032 (USD Mn, AGR (%))(L-Shaped Recovery Scenario)
Figure 102 Europe Offshore Support Vessel Market by Type, 2022-2032 (USD Mn, AGR (%))
Figure 103 Europe Offshore Support Vessel Market by Type, 2022-2032 (USD Mn, AGR (%))(V-Shaped Recovery Scenario)
Figure 104 Europe Offshore Support Vessel Market by Type, 2022-2032 (USD Mn, AGR (%))(W-Shaped Recovery Scenario)
Figure 105 Europe Offshore Support Vessel Market by Type, 2022-2032 (USD Mn, AGR (%))(U-Shaped Recovery Scenario)
Figure 106 Europe Offshore Support Vessel Market by Type, 2022-2032 (USD Mn, AGR (%))(L-Shaped Recovery Scenario)
Figure 107 Europe Offshore Support Vessel Market by Type, 2022-2032 (USD Mn, AGR (%))
Figure 108 Europe Offshore Support Vessel Market by Type, 2022-2032 (USD Mn, AGR (%))(V-Shaped Recovery Scenario)
Figure 109 Europe Offshore Support Vessel Market by Type, 2022-2032 (USD Mn, AGR (%))(W-Shaped Recovery Scenario)
Figure 110 Europe Offshore Support Vessel Market by Type, 2022-2032 (USD Mn, AGR (%))(U-Shaped Recovery Scenario)
Figure 111 Europe Offshore Support Vessel Market by Type, 2022-2032 (USD Mn, AGR (%))(L-Shaped Recovery Scenario)
Figure 112 Europe Offshore Support Vessel Market by Vessel Size, 2022-2032 (USD Mn, AGR (%))
Figure 113 Europe Offshore Support Vessel Market by Vessel Size, 2022-2032 (USD Mn, AGR (%))(V-Shaped Recovery Scenario)
Figure 114 Europe Offshore Support Vessel Market by Vessel Size, 2022-2032 (USD Mn, AGR (%))(W-Shaped Recovery Scenario)
Figure 115 Europe Offshore Support Vessel Market by Vessel Size, 2022-2032 (USD Mn, AGR (%))(U-Shaped Recovery Scenario)
Figure 116 Europe Offshore Support Vessel Market by Vessel Size, 2022-2032 (USD Mn, AGR (%))(L-Shaped Recovery Scenario)
Figure 117 Germany Offshore Support Vessel Market by Value, 2022-2032 (USD Mn, AGR (%))
Figure 118 Germany Offshore Support Vessel Market by Value, 2022-2032 (USD Mn, AGR (%))(V-Shaped Recovery Scenario)
Figure 119 Germany Offshore Support Vessel Market by Value, 2022-2032 (USD Mn, AGR (%))(W-Shaped Recovery Scenario)
Figure 120 Germany Offshore Support Vessel Market by Value, 2022-2032 (USD Mn, AGR (%))(U-Shaped Recovery Scenario)
Figure 121 Germany Offshore Support Vessel Market by Value, 2022-2032 (USD Mn, AGR (%))(L-Shaped Recovery Scenario)
Figure 122 UK Offshore Support Vessel Market by Value, 2022-2032 (USD Mn, AGR (%))
Figure 123 UK Offshore Support Vessel Market by Value, 2022-2032 (USD Mn, AGR (%))(V-Shaped Recovery Scenario)
Figure 124 UK Offshore Support Vessel Market by Value, 2022-2032 (USD Mn, AGR (%))(W-Shaped Recovery Scenario)
Figure 125 UK Offshore Support Vessel Market by Value, 2022-2032 (USD Mn, AGR (%))(U-Shaped Recovery Scenario)
Figure 126 UK Offshore Support Vessel Market by Value, 2022-2032 (USD Mn, AGR (%))(L-Shaped Recovery Scenario)
Figure 127 France Offshore Support Vessel Market by Value, 2022-2032 (USD Mn, AGR (%))
Figure 128 France Offshore Support Vessel Market by Value, 2022-2032 (USD Mn, AGR (%))(V-Shaped Recovery Scenario)
Figure 129 France Offshore Support Vessel Market by Value, 2022-2032 (USD Mn, AGR (%))(W-Shaped Recovery Scenario)
Figure 130 France Offshore Support Vessel Market by Value, 2022-2032 (USD Mn, AGR (%))(U-Shaped Recovery Scenario)
Figure 131 France Offshore Support Vessel Market by Value, 2022-2032 (USD Mn, AGR (%))(L-Shaped Recovery Scenario)
Figure 132 Spain Offshore Support Vessel Market by Value, 2022-2032 (USD Mn, AGR (%))
Figure 133 Spain Offshore Support Vessel Market by Value, 2022-2032 (USD Mn, AGR (%))(V-Shaped Recovery Scenario)
Figure 134 Spain Offshore Support Vessel Market by Value, 2022-2032 (USD Mn, AGR (%))(W-Shaped Recovery Scenario)
Figure 135 Spain Offshore Support Vessel Market by Value, 2022-2032 (USD Mn, AGR (%), CAGR(%))(U-Shaped Recovery Scenario)
Figure 136 Spain Offshore Support Vessel Market by Value, 2022-2032 (USD Mn, AGR (%))(L-Shaped Recovery Scenario)
Figure 137 Russia Offshore Support Vessel Market by Value, 2022-2032 (USD Mn, AGR (%))
Figure 138 Russia Offshore Support Vessel Market by Value, 2022-2032 (USD Mn, AGR (%))(V-Shaped Recovery Scenario)
Figure 139 Russia Offshore Support Vessel Market by Value, 2022-2032 (USD Mn, AGR (%))(W-Shaped Recovery Scenario)
Figure 140 Russia Offshore Support Vessel Market by Value, 2022-2032 (USD Mn, AGR (%))(U-Shaped Recovery Scenario)
Figure 141 Russia Offshore Support Vessel Market by Value, 2022-2032 (USD Mn, AGR (%))(L-Shaped Recovery Scenario)
Figure 142 Rest of Europe Offshore Support Vessel Market by Value, 2022-2032 (USD Mn, AGR (%))
Figure 143 Rest of Europe Offshore Support Vessel Market by Value, 2022-2032 (USD Mn, AGR (%))(V-Shaped Recovery Scenario)
Figure 144 Rest of Europe Offshore Support Vessel Market by Value, 2022-2032 (USD Mn, AGR (%))(W-Shaped Recovery Scenario)
Figure 145 Rest of Europe Offshore Support Vessel Market by Value, 2022-2032 (USD Mn, AGR (%))(U-Shaped Recovery Scenario)
Figure 146 Rest of Europe Offshore Support Vessel Market by Value, 2022-2032 (USD Mn, AGR (%))(L-Shaped Recovery Scenario)
Figure 147 Asia-Pacific Offshore Support Vessel Market by Value, 2022-2032 (USD Mn, AGR (%))
Figure 148 Asia-Pacific Offshore Support Vessel Market by Value, 2022-2032 (USD Mn, AGR (%))(V-Shaped Recovery Scenario)
Figure 149 Asia-Pacific Offshore Support Vessel Market by Value, 2022-2032 (USD Mn, AGR (%))(W-Shaped Recovery Scenario)
Figure 150 Asia-Pacific Offshore Support Vessel Market by Value, 2022-2032 (USD Mn, AGR (%))(U-Shaped Recovery Scenario)
Figure 151 Asia-Pacific Offshore Support Vessel Market by Value, 2022-2032 (USD Mn, AGR (%))(L-Shaped Recovery Scenario)
Figure 152 Asia-Pacific Offshore Support Vessel Market by Country, 2022-2032 (USD Mn, AGR (%))
Figure 153 Asia-Pacific Offshore Support Vessel Market by Country, 2022-2032 (USD Mn, AGR (%))(V-Shaped Recovery Scenario)
Figure 154 Asia-Pacific Offshore Support Vessel Market by Country, 2022-2032 (USD Mn, AGR (%))(W-Shaped Recovery Scenario)
Figure 155 Asia-Pacific Offshore Support Vessel Market by Country, 2022-2032 (USD Mn, AGR (%))(U-Shaped Recovery Scenario)
Figure 156 Asia-Pacific Offshore Support Vessel Market by Country, 2022-2032 (USD Mn, AGR (%))(L-Shaped Recovery Scenario)
Figure 157 Asia-Pacific Offshore Support Vessel Market by Application, 2022-2032 (USD Mn, AGR (%))
Figure 158 Asia-Pacific Offshore Support Vessel Market by Application, 2022-2032 (USD Mn, AGR (%))(V-Shaped Recovery Scenario)
Figure 159 Asia-Pacific Offshore Support Vessel Market by Application, 2022-2032 (USD Mn, AGR (%))(W-Shaped Recovery Scenario)
Figure 160 Asia-Pacific Offshore Support Vessel Market by Application, 2022-2032 (USD Mn, AGR (%))(U-Shaped Recovery Scenario)
Figure 161 Asia-Pacific Offshore Support Vessel Market by Application, 2022-2032 (USD Mn, AGR (%))(L-Shaped Recovery Scenario)
Figure 162 Asia-Pacific Offshore Support Vessel Market by Type, 2022-2032 (USD Mn, AGR (%))
Figure 163 Asia-Pacific Offshore Support Vessel Market by Type, 2022-2032 (USD Mn, AGR (%))(V-Shaped Recovery Scenario)
Figure 164 Asia-Pacific Offshore Support Vessel Market by Type, 2022-2032 (USD Mn, AGR (%))(W-Shaped Recovery Scenario)
Figure 165 Asia-Pacific Offshore Support Vessel Market by Type, 2022-2032 (USD Mn, AGR (%))(U-Shaped Recovery Scenario)
Figure 166 Asia-Pacific Offshore Support Vessel Market by Type, 2022-2032 (USD Mn, AGR (%))(L-Shaped Recovery Scenario)
Figure 167 Asia-Pacific Offshore Support Vessel Market by Type, 2022-2032 (USD Mn, AGR (%))
Figure 168 Asia-Pacific Offshore Support Vessel Market by Type, 2022-2032 (USD Mn, AGR (%))(V-Shaped Recovery Scenario)
Figure 169 Asia-Pacific Offshore Support Vessel Market by Type, 2022-2032 (USD Mn, AGR (%))(W-Shaped Recovery Scenario)
Figure 170 Asia-Pacific Offshore Support Vessel Market by Type, 2022-2032 (USD Mn, AGR (%))(U-Shaped Recovery Scenario)
Figure 171 Asia-Pacific Offshore Support Vessel Market by Type, 2022-2032 (USD Mn, AGR (%))(L-Shaped Recovery Scenario)
Figure 172 Asia-Pacific Offshore Support Vessel Market by Vessel Size, 2022-2032 (USD Mn, AGR (%))
Figure 173 Asia-Pacific Offshore Support Vessel Market by Vessel Size, 2022-2032 (USD Mn, AGR (%))(V-Shaped Recovery Scenario)
Figure 174 Asia-Pacific Offshore Support Vessel Market by Vessel Size, 2022-2032 (USD Mn, AGR (%))(W-Shaped Recovery Scenario)
Figure 175 Asia-Pacific Offshore Support Vessel Market by Vessel Size, 2022-2032 (USD Mn, AGR (%))(U-Shaped Recovery Scenario)
Figure 176 Asia-Pacific Offshore Support Vessel Market by Vessel Size, 2022-2032 (USD Mn, AGR (%))(L-Shaped Recovery Scenario)
Figure 177 China Offshore Support Vessel Market by Value, 2022-2032 (USD Mn, AGR (%))
Figure 178 China Offshore Support Vessel Market by Value, 2022-2032 (USD Mn, AGR (%))(V-Shaped Recovery Scenario)
Figure 179 China Offshore Support Vessel Market by Value, 2022-2032 (USD Mn, AGR (%))(W-Shaped Recovery Scenario)
Figure 180 China Offshore Support Vessel Market by Value, 2022-2032 (USD Mn, AGR (%))(U-Shaped Recovery Scenario)
Figure 181 China Offshore Support Vessel Market by Value, 2022-2032 (USD Mn, AGR (%))(L-Shaped Recovery Scenario)
Figure 182 India Offshore Support Vessel Market by Value, 2022-2032 (USD Mn, AGR (%))
Figure 183 India Offshore Support Vessel Market by Value, 2022-2032 (USD Mn, AGR (%))(V-Shaped Recovery Scenario)
Figure 184 India Offshore Support Vessel Market by Value, 2022-2032 (USD Mn, AGR (%))(W-Shaped Recovery Scenario)
Figure 185 India Offshore Support Vessel Market by Value, 2022-2032 (USD Mn, AGR (%))(U-Shaped Recovery Scenario)
Figure 186 India Offshore Support Vessel Market by Value, 2022-2032 (USD Mn, AGR (%))(L-Shaped Recovery Scenario)
Figure 187 Japan Offshore Support Vessel Market by Value, 2022-2032 (USD Mn, AGR (%))
Figure 188 Japan Offshore Support Vessel Market by Value, 2022-2032 (USD Mn, AGR (%))(V-Shaped Recovery Scenario)
Figure 189 Japan Offshore Support Vessel Market by Value, 2022-2032 (USD Mn, AGR (%))(W-Shaped Recovery Scenario)
Figure 190 Japan Offshore Support Vessel Market by Value, 2022-2032 (USD Mn, AGR (%))(U-Shaped Recovery Scenario)
Figure 191 Japan Offshore Support Vessel Market by Value, 2022-2032 (USD Mn, AGR (%))(L-Shaped Recovery Scenario)
Figure 192 South Korea Offshore Support Vessel Market by Value, 2022-2032 (USD Mn, AGR (%))
Figure 193 South Korea Offshore Support Vessel Market by Value, 2022-2032 (USD Mn, AGR (%))(V-Shaped Recovery Scenario)
Figure 194 South Korea Offshore Support Vessel Market by Value, 2022-2032 (USD Mn, AGR (%))(W-Shaped Recovery Scenario)
Figure 195 South Korea Offshore Support Vessel Market by Value, 2022-2032 (USD Mn, AGR (%))(U-Shaped Recovery Scenario)
Figure 196 South Korea Offshore Support Vessel Market by Value, 2022-2032 (USD Mn, AGR (%))(L-Shaped Recovery Scenario)
Figure 197 Australia Offshore Support Vessel Market by Value, 2022-2032 (USD Mn, AGR (%))
Figure 198 Australia Offshore Support Vessel Market by Value, 2022-2032 (USD Mn, AGR (%))(V-Shaped Recovery Scenario)
Figure 199 Australia Offshore Support Vessel Market by Value, 2022-2032 (USD Mn, AGR (%))(W-Shaped Recovery Scenario)
Figure 200 Australia Offshore Support Vessel Market by Value, 2022-2032 (USD Mn, AGR (%))(U-Shaped Recovery Scenario)
Figure 201 Australia Offshore Support Vessel Market by Value, 2022-2032 (USD Mn, AGR (%))(L-Shaped Recovery Scenario)
Figure 202 Rest of Asia-Pacific Offshore Support Vessel Market by Value, 2022-2032 (USD Mn, AGR (%))
Figure 203 Rest of Asia-Pacific Offshore Support Vessel Market by Value, 2022-2032 (USD Mn, AGR (%))(V-Shaped Recovery Scenario)
Figure 204 Rest of Asia-Pacific Offshore Support Vessel Market by Value, 2022-2032 (USD Mn, AGR (%))(W-Shaped Recovery Scenario)
Figure 205 Rest of Asia-Pacific Offshore Support Vessel Market by Value, 2022-2032 (USD Mn, AGR (%))(U-Shaped Recovery Scenario)
Figure 206 Rest of Asia-Pacific Offshore Support Vessel Market by Value, 2022-2032 (USD Mn, AGR (%))(L-Shaped Recovery Scenario)
Figure 207 LAMEA Offshore Support Vessel Market by Value, 2022-2032 (USD Mn, AGR (%))
Figure 208 LAMEA Offshore Support Vessel Market by Value, 2022-2032 (USD Mn, AGR (%))(V-Shape Rcovery)
Figure 209 LAMEA Offshore Support Vessel Market by Value, 2022-2032 (USD Mn, AGR (%))
Figure 210 LAMEA Offshore Support Vessel Market by Value, 2022-2032 (USD Mn, AGR (%))(U-Shaped Recovery Scenario)
Figure 211 LAMEA Offshore Support Vessel Market by Value, 2022-2032 (USD Mn, AGR (%))(L-Shaped Recovery Scenario)
Figure 212 LAMEA Offshore Support Vessel Market by Country, 2022-2032 (USD Mn, AGR (%))
Figure 213 LAMEA Offshore Support Vessel Market by Country, 2022-2032 (USD Mn, AGR (%))(V-Shaped Recovery Scenario)
Figure 214 LAMEA Offshore Support Vessel Market by Country, 2022-2032 (USD Mn, AGR (%))
Figure 215 LAMEA Offshore Support Vessel Market by Country, 2022-2032 (USD Mn, AGR (%))(U-Shaped Recovery Scenario)
Figure 216 LAMEA Offshore Support Vessel Market by Country, 2022-2032 (USD Mn, AGR (%))(L-Shaped Recovery Scenario)
Figure 217 LAMEA Offshore Support Vessel Market by Application, 2022-2032 (USD Mn, AGR (%))
Figure 218 LAMEA Offshore Support Vessel Market by Application, 2022-2032 (USD Mn, AGR (%))(V-Shaped Recovery Scenario)
Figure 219 LAMEA Offshore Support Vessel Market by Application, 2022-2032 (USD Mn, AGR (%))(W-Shaped Recovery Scenario)
Figure 220 LAMEA Offshore Support Vessel Market by Application, 2022-2032 (USD Mn, AGR (%))(U-Shaped Recovery Scenario)
Figure 221 LAMEA Offshore Support Vessel Market by Application, 2022-2032 (USD Mn, AGR (%))(L-Shaped Recovery Scenario)
Figure 222 LAMEA Offshore Support Vessel Market by Type, 2022-2032 (USD Mn, AGR (%))
Figure 223 LAMEA Offshore Support Vessel Market by Type, 2022-2032 (USD Mn, AGR (%))(V-Shaped Recovery Scenario)
Figure 224 LAMEA Offshore Support Vessel Market by Type, 2022-2032 (USD Mn, AGR (%))(W-Shaped Recovery Scenario)
Figure 225 LAMEA Offshore Support Vessel Market by Type, 2022-2032 (USD Mn, AGR (%))(U-Shaped Recovery Scenario)
Figure 226 LAMEA Offshore Support Vessel Market by Type, 2022-2032 (USD Mn, AGR (%))(L-Shaped Recovery Scenario)
Figure 227 LAMEA Offshore Support Vessel Market by Type, 2022-2032 (USD Mn, AGR (%))
Figure 228 LAMEA Offshore Support Vessel Market by Type, 2022-2032 (USD Mn, AGR (%))(V-Shaped Recovery Scenario)
Figure 229 LAMEA Offshore Support Vessel Market by Type, 2022-2032 (USD Mn, AGR (%))(W-Shaped Recovery Scenario)
Figure 230 LAMEA Offshore Support Vessel Market by Type, 2022-2032 (USD Mn, AGR (%))(U-Shaped Recovery Scenario)
Figure 231 LAMEA Offshore Support Vessel Market by Type, 2022-2032 (USD Mn, AGR (%))(L-Shaped Recovery Scenario)
Figure 232 LAMEA Offshore Support Vessel Market by Vessel Size, 2022-2032 (USD Mn, AGR (%))
Figure 233 LAMEA Offshore Support Vessel Market by Vessel Size, 2022-2032 (USD Mn, AGR (%))(V-Shaped Recovery Scenario)
Figure 234 LAMEA Offshore Support Vessel Market by Vessel Size, 2022-2032 (USD Mn, AGR (%))(W-Shaped Recovery Scenario)
Figure 235 LAMEA Offshore Support Vessel Market by Vessel Size, 2022-2032 (USD Mn, AGR (%))(U-Shaped Recovery Scenario)
Figure 236 LAMEA Offshore Support Vessel Market by Vessel Size, 2022-2032 (USD Mn, AGR (%))(L-Shaped Recovery Scenario)
Figure 237 Brazil Offshore Support Vessel Market by Value, 2022-2032 (USD Mn, AGR (%))
Figure 238 Brazil Offshore Support Vessel Market by Value, 2022-2032 (USD Mn, AGR (%))(V-Shaped Recovery Scenario)
Figure 239 Brazil Offshore Support Vessel Market by Value, 2022-2032 (USD Mn, AGR (%))(W-Shaped Recovery Scenario)
Figure 240 Brazil Offshore Support Vessel Market by Value, 2022-2032 (USD Mn, AGR (%))(U-Shaped Recovery Scenario)
Figure 241 Brazil Offshore Support Vessel Market by Value, 2022-2032 (USD Mn, AGR (%))(L-Shaped Recovery Scenario)
Figure 242 South Africa Offshore Support Vessel Market by Value, 2022-2032 (USD Mn, AGR (%))
Figure 243 South Africa Offshore Support Vessel Market by Value, 2022-2032 (USD Mn, AGR (%))(V-Shaped Recovery Scenario)
Figure 244 South Africa Offshore Support Vessel Market by Value, 2022-2032 (USD Mn, AGR (%))(W-Shaped Recovery Scenario)
Figure 245 South Africa Offshore Support Vessel Market by Value, 2022-2032 (USD Mn, AGR (%))(U-Shaped Recovery Scenario)
Figure 246 South Africa Offshore Support Vessel Market by Value, 2022-2032 (USD Mn, AGR (%))(L-Shaped Recovery Scenario)
Figure 247 Saudi Arabia Offshore Support Vessel Market by Value, 2022-2032 (USD Mn, AGR (%))
Figure 248 Saudi Arabia Offshore Support Vessel Market by Value, 2022-2032 (USD Mn, AGR (%))(V-Shaped Recovery Scenario)
Figure 249 Saudi Arabia Offshore Support Vessel Market by Value, 2022-2032 (USD Mn, AGR (%))(W-Shaped Recovery Scenario)
Figure 250 Saudi Arabia Offshore Support Vessel Market by Value, 2022-2032 (USD Mn, AGR (%))(U-Shaped Recovery Scenario)
Figure 251 Saudi Arabia Offshore Support Vessel Market by Value, 2022-2032 (USD Mn, AGR (%))(L-Shaped Recovery Scenario)
Figure 252 Turkey Offshore Support Vessel Market by Value, 2022-2032 (USD Mn, AGR (%))
Figure 253 Turkey Offshore Support Vessel Market by Value, 2022-2032 (USD Mn, AGR (%))(V-Shaped Recovery Scenario)
Figure 254 Turkey Offshore Support Vessel Market by Value, 2022-2032 (USD Mn, AGR (%))(W-Shaped Recovery Scenario)
Figure 255 Turkey Offshore Support Vessel Market by Value, 2022-2032 (USD Mn, AGR (%))(U-Shaped Recovery Scenario)
Figure 256 Turkey Offshore Support Vessel Market by Value, 2022-2032 (USD Mn, AGR (%))(L-Shaped Recovery Scenario)
Figure 257 UAE Offshore Support Vessel Market by Value, 2022-2032 (USD Mn, AGR (%))
Figure 258 UAE Offshore Support Vessel Market by Value, 2022-2032 (USD Mn, AGR (%))(V-Shaped Recovery Scenario)
Figure 259 UAE Offshore Support Vessel Market by Value, 2022-2032 (USD Mn, AGR (%))(W-Shaped Recovery Scenario)
Figure 260 UAE Offshore Support Vessel Market by Value, 2022-2032 (USD Mn, AGR (%))(U-Shaped Recovery Scenario)
Figure 261 UAE Offshore Support Vessel Market by Value, 2022-2032 (USD Mn, AGR (%))(L-Shaped Recovery Scenario)
Figure 262 Rest of LAMEA Offshore Support Vessel Market by Value, 2022-2032 (USD Mn, AGR (%))
Figure 263 Rest of LAMEA Offshore Support Vessel Market by Value, 2022-2032 (USD Mn, AGR (%))(V-Shaped Recovery Scenario)
Figure 264 Rest of LAMEA Offshore Support Vessel Market by Value, 2022-2032 (USD Mn, AGR (%))(W-Shaped Recovery Scenario)
Figure 265 Rest of LAMEA Offshore Support Vessel Market by Value, 2022-2032 (USD Mn, AGR (%))(U-Shaped Recovery Scenario)
Figure 266 Rest of LAMEA Offshore Support Vessel Market by Value, 2022-2032 (USD Mn, AGR (%))(L-Shaped Recovery Scenario)
Figure 267 Global Offshore Support Vessel Market by Key Business Strategy, 2018-2021 (%)
Figure 268 Maersk Drilling A/S: Company Revenue 2016-2020 (US$Mn, AGR (%))
Figure 269 Maersk Drilling A/S: Company Operating Income 2016-2020 (US$Mn, AGR (%))
Figure 270 Maersk Drilling A/S: Company Net Income 2016-2020 (US$Mn, AGR (%))
Figure 271 Maersk Drilling A/S: Company EBITDA 2016-2020 (US$Mn, AGR (%))
Figure 272 MMA Offshore Limited: Company Revenue 2017-2021(US$Mn, AGR (%))
Figure 273 MMA Offshore Limited: Company Operating Income 2017-2021(US$Mn, AGR (%))
Figure 274 MMA Offshore Limited: Company Net Income 2017-2021(US$Mn, AGR (%))
Figure 275 MMA Offshore Limited: Company EBITDA 2016-2020(US$Mn, AGR (%))
Figure 276 Seacor Marine.: Company Revenue 2016-2020(US$Mn, AGR (%))
Figure 277 Seacor Marine.: Company Operating Income 2016-2020(US$Mn, AGR (%))
Figure 278 Seacor Marine.: Company Net Income 2016-2020(US$Mn, AGR (%))
Figure 279 Seacor Marine.: Company EBITDA 2016-2020(US$Mn, AGR (%))
Figure 280 Solstad Offshore: Company Revenue 2016-2020(US$Mn, AGR (%))
Figure 281 Solstad Offshore:.: Company Operating Income 2016-2020(US$Mn, AGR (%))
Figure 282 Solstad Offshore: Company Net Income 2016-2020(US$Mn, AGR (%))
Figure 283 Solstad Offshore: Company EBITDA 2016-2020(US$Mn, AGR (%))
Figure 284 DOF Group: Company Revenue 2016-2020(US$Mn, AGR (%))
Figure 285 DOF Group Company Operating Income 2016-2020(US$Mn, AGR (%))
Figure 286 DOF Group: Company Net Income 2016-2020(US$Mn, AGR (%))
Figure 287 DOF Group: Company EBITDA 2016-2020(US$Mn, AGR (%))
Figure 288 Siem Offshore: Company Revenue 2016-2020(US$Mn, AGR (%))
Figure 289 Siem Offshore:.Company Operating Income 2016-2020(US$Mn, AGR (%))
Figure 290 Siem Offshore: Company Net Income 2016-2020(US$Mn, AGR (%))
Figure 291 Siem Offshore: Company EBITDA 2016-2020(US$Mn, AGR (%))
Figure 292 Kawasaki Heavy Industries: Company Revenue 2016-2020 (US$Mn, AGR (%))
Figure 293 Kawasaki Heavy Industries: Company Operating Income 2016-2020 (US$Mn, AGR (%))
Figure 294 Kawasaki Heavy Industries: Company Net Income 2016-2020 (US$Mn, AGR (%))
Figure 295 Kawasaki Heavy Industries: Company EBITDA 2016-2020 (US$Mn, AGR (%))
Figure 296 Havila Shipping: Company Revenue 2016-2020 (US$Mn, AGR (%))
Figure 297 Havila Shipping: Company Operating Income 2016-2020 (US$Mn, AGR (%))
Figure 298 Havila Shipping: Company Net Income 2016-2020 (US$Mn, AGR (%))
Figure 299 Havila Shipping: Company EBITDA 2016-2020 (US$Mn, AGR (%))
Figure 300 Nam Cheong Limited: Company Revenue 2016-2020(US$Mn, AGR (%))
Figure 301 Nam Cheong Limited: Company Operating Income 2016-2020(US$Mn, AGR (%))
Figure 302 Nam Cheong Limited: Company Net Income 2016-2020(US$Mn, AGR (%))
Figure 303 Nam Cheong Limited: Company EBITDA 2016-2020(US$Mn, AGR (%))
Figure 304 GC Rieber: Company Revenue 2016-2020(US$Mn, AGR (%))
Figure 305 GC Rieber: Company Operating Income 2016-2020(US$Mn, AGR (%))
Figure 306 GC Rieber: Company Net Income 2016-2020(US$Mn, AGR (%))
Figure 307 GC Rieber: Company EBITDA 2016-2020(US$Mn, AGR (%))
Figure 308 TideWater: Company Revenue 2016-2020(US$Mn, AGR(%))
Figure 309 TideWater: Company Operating Income 2016-2020(US$Mn, AGR (%))
Figure 310 TideWater: Company Net Income 2016-2020(US$Mn, AGR (%))
Figure 311 TideWater: Company EBITDA 2016-2020(US$Mn, AGR (%))
List of Companies Profiled in the Report
DOF Group
GC Rieber
Grupo CBO
Harvey Gulf International Marine
Havila Shipping
Kawasaki Heavy Industries
Maersk Drilling A/S
MMA Offshore Limited:
Nam Cheong Limited
PACC Offshore Service Holding
Seacor Marine
Siem Offshore
Solstad Offshore
Swire Pacific Offshore
TideWater
TideWater
List of Other Companies Mentioned in the Report
Abyss Aqua
AMI International
AMSEC LLC
Asis Boats
Austal
Austal Fassmer Pty Ltd
BAE Systems
Bangkok Dock Company
BCGP
BMT Defence Services Ltd
Bollinger Shipyards LLC
Brunswick Commercial & Government Products
China Shipbuilding Industry Corporation (CSIC)
Connor Industries
Cotecmar
Daewoo Mangalia Heavy Industries (DMHI)
Daewoo Shipbuilding & Marine Engineering Co., Ltd
Damen Shipyards Group
FassmerGmbh&Co.
FB Design
Fincantieri – Cantieri NavaliItaliani S.p.A.
Fr Lurssen Werft GmbH & Co.KG
Fr. Maritime Partner ASKG
Garden Reach Shipbuilders & Engineers Ltd
General Dynamics Bath Iron Works
General Dynamics Corporation
Goa Shipyard Limited
Gulf Coast Shipyard Group, Inc.
Huntington Ingalls Industries Inc.
Hyundai Heavy Industries Co., Ltd.
Irving Shipbuilding of Canada
LOMOcean Design Ltd.
Marine Alutech
Maritime Partner AS
Navantia SA
SAFE Boats International (SBI)
Samsung
Samwoo Heavy Industries Co., Ltd
Shinhan Heavy Industries Co., Ltd
South Boats IOW Ltd.
Sunbird Yacht Co., Ltd
Swiftships
Willard Marine, Inc.
List of Associations Mentioned in the Report
China Classification Society
China Ship Research & Development Institute
Comité Maritime International (CMI)
European Maritime Safety Agency
Institute of Marine Engineering, Science & Technology (IMarEST)
Japanese Ministry of Land, Infrastructure, Transportation and Tourism
Marine Design Research Institute of China (MARIC)
Monohakobi Technology Institute
Norwegian Forum for Autonomous Ships (NFAS)
Norwegian Maritime Authority (NMA)
One Sea
Shanghai Marine Diesel Engine Research Institute
Shanghai Merchant Ship Design and Research Institute (SDARI)
Tokyo University of Marine Science and Technology
Unmanned Cargo Ship Development Alliance
Wuhan University of Technology
Zhuhai Government