This latest report by business intelligence provider Visiongain assesses that Wind Turbine Decommissioning Services Market spending will reach $521.4 mn in during 2020-2030. This study provides an application-based (onshore and overseas) and geographic (Americas, APAC, and EMEA) industry assessment. The study analyzes the dynamic landscape of the market and provides data about several firms including EnBW, JLT Group, M2 Subsea, NIRAS, Oceaneering International, and Ramboll.
Modern wind farms are intended for at least 25 to 30 years of operation, during which period they are closely run and preserved. It is essential to have a strategy for what will occur when their helpful lives comes to an end. They are withdrawn when wind farms are “dismantled” or thrown out of operation and the soil under them is returned. When turbines are withdrawn, they are completely separated from the earth’s ground. In fact, every component of the turbine is removed from the site within four feet of the surface. This guarantees that agricultural purposes and other potential utilizes can remain unimpeded and that there are no remains of turbine constructions noticeable.
Many states and counties are increasingly concerned about what will occur to the fast-growing amount of wind energy locations across the nation at the close of the lifecycle. In fact, the initial proprietor and promoters purchased several wind farms. Developers are most often responsible for developing their own decommissioning scheme. This may create meaning because when it goes to decommissioning, they are probable to be accountable for doing the job. In fact, presently landfill storage is required for fiberglass cores, nacelle and core covers, which have significant costs. It is also a good idea for lenders to recognize in their performances the expense of decommissioning. Legislators and County Officials are increasingly requiring bonds and more sophisticated plans to make sure they are covered financially for turbine removal.
It is therefore critical that you have your timescales correct and your forecasting plans ready. This report will ensure that you do. Visiongain’s report will ensure that you keep informed and ahead of your competitors. Gain that competitive advantage.
Thousands of wind turbines have been built around the globe over the previous few centuries. According to the Global Wind Energy Council (GWEC), wind capability of 432,883 MW was commissioned globally at the beginning of 2015, mostly in the last century. But a significant part of the world’s flotilla is becoming outdated as wind technology is quickly improving. Nearly 17% of the output (73,957 MW) was at least 10 years old by 2015, and 9% (39,431 MW) was at least 13 years old. Some groundbreaking industrial power farms in Northern Europe and California are even younger. If, according to sector estimates, wind turbines are intended with lifespan ranging from 20 to 25 years, approximately one third of the world’s integrated wind turbines may be midway through their lives. One result of the shrinking of this technology is decreased efficiency. Wind turbine burden (or ability) variables decrease significantly with era, according to some specialists. Typically, wind turbine providers facing an elderly fleet have three alternatives: dismantling the turbine, embarking on a life-long expansion. According to Mercedes Irujo Espinosa de los Monteros of Acciona Energia, a life-extension specialist in wind turbine production, each alternative has its disadvantages.
Life modifications involving the reconditioning of significant components, primarily by improving their component parts or combining these elements with the recent technology, could increase the accessibility and revenue of wind turbines. With interventions such as retrofitting contemporary power schemes, reliability can be enhanced. Partial repowering is also available, but this strategy has severe limitations. Usually it is not suggested to install a 3-MW nacelle on bottom of a 250-kW building. Increasing the volume of the blade often leads to fast wear in gears and other rotating machinery and bearings as the early infrastructure’s parameters are exceeded.
Top wind turbine decommissioning services companies covered in this market research report
The industry for wind turbine decommissioning facilities is extremely divided due to the existence of many market players who focus on installing wind turbines to satisfy the changing requirements of end-user sectors. This study on the wind turbine decommissioning utilities sector assessment will help customers define fresh development possibilities and develop fresh development policies by providing a comprehensive assessment of the dynamic landscape of the market and data on the products provided by the businesses.
Read on to discover how you can exploit the future business opportunities emerging in this sector. Visiongain’s new study tells you and tells you NOW. The 171-pages report provides clear, detailed insight into the global Wind Turbine Decommissioning Services market. Discover the key drivers and challenges affecting the market.
By ordering and reading our brand-new report today, you stay better informed and ready to act.
Report Scope
The report delivers considerable added value by revealing:
57 tables, charts and graphs are analyzing and revealing the growth prospects and outlook for the Wind Turbine Decommissioning Services market.
Global Wind Turbine Decommissioning Services market forecasts and analysis from 2020-2030.
Wind Turbine Decommissioning Services market provides revenue estimates, forecasts and analysis from 2020-2030 for Wind Turbine Decommissioning Services submarkets:
Forecasts and analysis of Wind Turbine Decommissioning Services market by Turbine Size between 2020-2030
Large-sized Wind Turbine Market, 2020-2030
Medium Sized Wind Turbine Market, 2020-2030
Small Sized Wind Turbine Market, 2020-2030
Other Market, 2020-2030
Forecasts and analysis of Wind Turbine Decommissioning Services market by Application between 2020-2030
On-Shore Market, 2020-2030
Off-Shore Market, 2020-2030
Other Applications Market, 2020-2030
Forecasts and analysis of Wind Turbine Decommissioning Services market by Service Type between 2020-2030
Parts Dismantle Market, 2020-2030
Scour Protection Removal Market, 2020-2030
Cable Removal Market, 2020-2030
WTG Removal Market, 2020-2030
Transition Piece and Monopile Removal Market, 2020-2030
ESP Removal Market, 2020-2030
Material Disposal Services Market, 2020-2030
Disposal of WTG and Tower Material Market, 2020-2030
Disposal of Electric Service Platform Material Market, 2020-2030
Disposal of Electrical Cable Market, 2020-2030
Disposal of Fluids Market, 2020-2030
Other Services Market, 2020-2030
Equipment And Vessel Services Market, 2020-2030
Transport and Inventory Services Market, 2020-2030
Regional Wind Turbine Decommissioning Services market forecasts from 2020-2030 with drivers and restraints for the countries including:
Geographic Breakdown
Focused regional forecasts and analysis explore the future opportunities:
North America Market, 2020-2030
US Market, 2020-2030
Canada Market, 2020-2030
Europe Market, 2020-2030
The UK Market, 2020-2030
Germany Market, 2020-2030
France Market, 2020-2030
Italy Market, 2020-2030
Spain Market, 2020-2030
Rest of Europe Market, 2020-2030
Asia-Pacific Market, 2020-2030
China Market, 2020-2030
India Market, 2020-2030
Japan Market, 2020-2030
Australia & New Zealand Market, 2020-2030
Rest of Asia-Pacific Market, 2020-2030
LAMEA Market, 2020-2030
Latin America Market, 2020-2030
Middle East Market, 2020-2030
Africa Market, 2020-2030

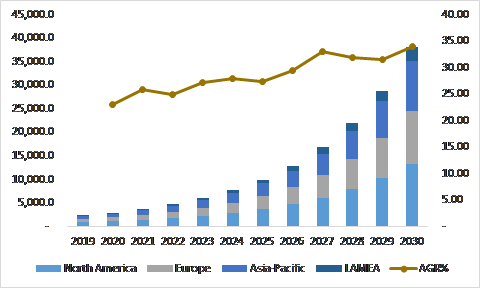
Figure:- Wind Turbine Decommissioning Services Market Size and Forecast by Region, 2020-2030
Company profiles for the leading Wind Turbine Decommissioning Services companies
Company Profiles of Leading Players
Apex Clean Energy
DonJon Marine Company, Inc.
Jack-up Barge, B.V.
EnBW
JLT Group
M2 Subsea
NIRAS
Oceaneering International
Rambol
Ocean Surveys, Inc.
Other Key Players in the market
Weeks Marine
Eight Point Wind, LLC
Equinor ASA
Intertek Group plc
DEME Offshore
PRINCIPLE POWER, INC.
ROBUR Group USA LLC
Ardent
Conclusions and recommendations which will aid decision-making
How will you benefit from this report?
Keep your knowledge base up to speed. Don’t get left behind
Reinforce your strategic decision-making with definitive and reliable market data
Learn how to exploit new technological trends
Realise your company’s full potential within the market
Understand the competitive landscape and identify potential new business opportunities & partnerships
Who should read this report?
Anyone with involvement in the Wind Turbine Decommissioning Services
Wind Energy operators
Engineering contractors
Investment managers
Arbitrage companies and divisions
Wind Energy price reporting companies
Wind Energy company managers
Wind Energy consultants
Wind Energy company executives and analysts
Heads of strategic development
Business development managers
Marketing managers
Market analysts,
Technologists
Suppliers
Investors
Banks
Government agencies
Visiongain’s study is intended for anyone requiring commercial analyses for the Wind Turbine Decommissioning Services market and leading companies. You find data, trends and predictions.
Buy our report today the Wind Turbine Decommissioning Services Market Forecast 2020-2030. Avoid missing out by staying informed – get our report now.
Visiongain is a trading partner with the US Federal Government
CCR Ref number: KD4R6
Do you have any custom requirements we can help you with? Any need for specific country, geo region, market segment or specific company information? Contact us today, we can discuss your needs and see how we can help sara.peerun@visiongain.com
Report Overview
1.1 Global Wind Turbine Decommissioning Services Market
1.2 Global Wind Turbine Decommissioning Services Market Overview
1.3 Global Wind Turbine Decommissioning Services Market Segmentation
1.4 The Emergence of Wind Turbine Decommissioning Services in the Industry
1.5 Why You Should Read This Report
1.6 How This Report Delivers
1.7 Key Questions Answered by This Analytical Report
1.8 Methodology
1.8.1 Secondary Research
1.8.2 Market Evaluation & Forecasting Methodology
1.9 Frequently Asked Questions (FAQ)
1.10 Associated Visiongain Reports
1.11 About Visiongain
2. Introduction to Wind Turbine Decommissioning Services Market
2.1 Market Definition
2.2 Industry Outlook
2.3 Value Chain Analysis
2.4 Industry Structure
2.5 Current Status & Trends
2.6 Demand & Supply Analysis
2.7 Trade Analysis
2.8 Price Trend Analysis
2.9 Cost Development Costs
2.9.1 Offloading Barges At The Marshaling Area
2.9.2 Trucking Materials To Processing Locations
2.9.3 Processing Scrap Materials For Recycling
2.9.4 Transport Of Non-Recyclables To A Landfill For Final Disposal
3. Global Wind Turbine Decommissioning Services Market Analysis
3.1 PEST Analysis of the Wind Turbine Decommissioning Services Market
3.2 Expert Opinion
3.2.1 Primary Correspondents
3.3 Market Outlook
3.4 Drivers & Restraints
3.5 Dominant Region/Country
3.6 Market Scenario
3.7 Overall Growth Rate, Globally
3.8 SWOT Analysis of the Wind Turbine Decommissioning Services Market
3.8.1 Strengths
3.8.2 Weaknesses
3.8.3 Opportunities
3.8.4 Threats
3.9 Porter’s Five Forces Analysis
3.9.1 Competitive Rivalry
3.9.2 Supplier Power
3.9.3 Buyer Power
3.9.4 Threat of Substitute
3..9.5 Threat of New Entrant
3.10 Sustainability Analysis
3.10.1 Labor problems
3.10.2 Uncertainty in permit approvals
3.10.3 Failure of acceptance tests
3.10.4 New technology being available
3.10.5 Severe weather
3.10. Variations in contractor performance
3.10.7 Variations in site conditions
3.10.8 Political instability in a development area
3.10.9 Inadequate specifications
3.10.10 Delays in management reviews and approvals
3.10.11 Mechanical breakdown and malfunctions
4. Wind Turbine Decommissioning Services: Global Market Analysis by Segments
4.1 Global Wind Turbine Decommissioning Services Market Forecast, by Turbine Size 2020-2030
4.1.1 Turbine Size Overview
4.1.2 Large-sized Wind Turbine Market, 2020-2030
4.1.3 Medium Sized Wind Turbine Market, 2020-2030
4.1.4 Small Sized Wind Turbine Market, 2020-2030
4.1.5 Other Market, 2020-2030
4.2 Global Wind Turbine Decommissioning Services Market Forecast, by Application 2020-2030
4.2.1 Application Overview
4.2.2 On-Shore Market, 2020-2030
4.2.3 Off-Shore Market, 2020-2030
4.2.4 Other Applications Market, 2020-2030
4.3 Global Wind Turbine Decommissioning Services Market Forecast, by Service Type 2020-2030
4.3.1 Service Type Overview
4.3.2 Parts Dismantle Market, 2020-2030
4.3.2.1 Scour Protection Removal Market, 2020-2030
4.3.2.2 Cable Removal Market, 2020-2030
4.3.2.3 WTG Removal Market, 2020-2030
4.3.2.4 Transition Piece and Monopile Removal Market, 2020-2030
4.3.2.5 ESP Removal Market, 2020-2030
4.3.3 Material Disposal Services Market, 2020-2030
4.3.3.1 Disposal of WTG and Tower Material Market, 2020-2030
4.3.3.2 Disposal of Electric Service Platform Material Market, 2020-2030
4.3.3.3 Disposal of Electrical Cable Market, 2020-2030
4.3.3.4 Disposal of Fluids Market, 2020-2030
4.3.3.5 Other Services Market, 2020-2030
4.3.4 Equipment And Vessel Services Market, 2020-2030
4.3.5 Transport and Inventory Services Market, 2020-2030
5. Leading Regions in Wind Turbine Decommissioning Services Market 2020-2030
5.1 Regional Overview
5.1.1 North America
5.1.2 Europe
5.1.3 Asia Pacific
5.1.4 LAMEA
5.1.5 Leading Countries/ Regions
5.2 U.S. Wind Turbine Decommissioning Services Market Forecast, 2020-2030
5.2.1 U.S. Wind Turbine Decommissioning Services Submarket, By Turbine Size Forecast 2020-2030
5.2.2 U.S. Wind Turbine Decommissioning Services Submarket, By Application Forecast 2020-2030
5.2.3 U.S. Wind Turbine Decommissioning Services Submarket, By Service Type Forecast 2020-2030
5.2.4 U.S. Wind Turbine Decommissioning Services Submarket, By Forecast 2020-2030
5.3 Canada Wind Turbine Decommissioning Services Market Forecast, 2020-2030
5.3.1 Canada Wind Turbine Decommissioning Services Submarket, By Turbine Size Forecast 2020-2030
5.3.2 Canada Wind Turbine Decommissioning Services Submarket, By Application Forecast 2020-2030
5.3.3 Canada Wind Turbine Decommissioning Services Submarket, By Service Type Forecast 2020-2030
5.3.4 Canada Wind Turbine Decommissioning Services Submarket, By Forecast 2020-2030
5.4 The UK Wind Turbine Decommissioning Services Market Forecast, 2020-2030
5.4.1 The UK Wind Turbine Decommissioning Services Submarket, By Turbine Size Forecast 2020-2030
5.4.2 The UK Wind Turbine Decommissioning Services Submarket, By Application Forecast 2020-2030
5.4.3 The UK Wind Turbine Decommissioning Services Submarket, By Service Type Forecast 2020-2030
5.4.4 The UK Wind Turbine Decommissioning Services Submarket, By Forecast 2020-2030
5.5 Germany Wind Turbine Decommissioning Services Market Forecast, 2020-2030
5.5.1 Germany Wind Turbine Decommissioning Services Submarket, By Turbine Size Forecast 2020-2030
5.5.2 Germany Wind Turbine Decommissioning Services Submarket, By Application Forecast 2020-2030
5.5.3 Germany Wind Turbine Decommissioning Services Submarket, By Service Type Forecast 2020-2030
5.5.4 Germany Wind Turbine Decommissioning Services Submarket, By Forecast 2020-2030
5.6 France Wind Turbine Decommissioning Services Market Forecast, 2020-2030
5.6.1 France Wind Turbine Decommissioning Services Submarket, By Turbine Size Forecast 2020-2030
5.6.2 France Wind Turbine Decommissioning Services Submarket, By Application Forecast 2020-2030
5.6.3 France Wind Turbine Decommissioning Services Submarket, By Service Type Forecast 2020-2030
5.6.4 France Wind Turbine Decommissioning Services Submarket, By Forecast 2020-2030
5.7 Italy Wind Turbine Decommissioning Services Market Forecast, 2020-2030
5.7.1 Italy Wind Turbine Decommissioning Services Submarket, By Turbine Size Forecast 2020-2030
5.7.2 Italy Wind Turbine Decommissioning Services Submarket, By Application Forecast 2020-2030
5.7.3 Italy Wind Turbine Decommissioning Services Submarket, By Service Type Forecast 2020-2030
5.7.4 Italy Wind Turbine Decommissioning Services Submarket, By Forecast 2020-2030
5.8 Spain Wind Turbine Decommissioning Services Market Forecast, 2020-2030
5.8.1 Spain Wind Turbine Decommissioning Services Submarket, By Turbine Size Forecast 2020-2030
5.8.2 Spain Wind Turbine Decommissioning Services Submarket, By Application Forecast 2020-2030
5.8.3 Spain Wind Turbine Decommissioning Services Submarket, By Service Type Forecast 2020-2030
5.8.4 Spain Wind Turbine Decommissioning Services Submarket, By Forecast 2020-2030
5.9 Rest of Europe Wind Turbine Decommissioning Services Market Forecast, 2020-2030
5.9.1 Rest of Europe Wind Turbine Decommissioning Services Submarket, By Turbine Size Forecast 2020-2030
5.9.2 Rest of Europe Wind Turbine Decommissioning Services Submarket, By Application Forecast 2020-2030
5.9.3 Rest of Europe Wind Turbine Decommissioning Services Submarket, By Service Type Forecast 2020-2030
5.9.4 Rest of Europe Wind Turbine Decommissioning Services Submarket, By Forecast 2020-2030
5.10 China Wind Turbine Decommissioning Services Market Forecast, 2020-2030
5.10.1 China Wind Turbine Decommissioning Services Submarket, By Turbine Size Forecast 2020-2030
5.10.2 China Wind Turbine Decommissioning Services Submarket, By Application Forecast 2020-2030
5.10.3 China Wind Turbine Decommissioning Services Submarket, By Service Type Forecast 2020-2030
5.10.4 China Wind Turbine Decommissioning Services Submarket, By Forecast 2020-2030
5.11 India Wind Turbine Decommissioning Services Market Forecast, 2020-2030
5.11.1 India Wind Turbine Decommissioning Services Submarket, By Turbine Size Forecast 2020-2030
5.11.2 India Wind Turbine Decommissioning Services Submarket, By Application Forecast 2020-2030
5.11.3 India Wind Turbine Decommissioning Services Submarket, By Service Type Forecast 2020-2030
5.11.4 India Wind Turbine Decommissioning Services Submarket, By Forecast 2020-2030
5.12 Japan Wind Turbine Decommissioning Services Market Forecast, 2020-2030
5.12.1 Japan Wind Turbine Decommissioning Services Submarket, By Turbine Size Forecast 2020-2030
5.12.2 Japan Wind Turbine Decommissioning Services Submarket, By Application Forecast 2020-2030
5.12.3 Japan Wind Turbine Decommissioning Services Submarket, By Service Type Forecast 2020-2030
5.12.4 Japan Wind Turbine Decommissioning Services Submarket, By Forecast 2020-2030
5.13 Australia & New Zealand Wind Turbine Decommissioning Services Market Forecast, 2020-2030
5.13.1 Australia & New Zealand Wind Turbine Decommissioning Services Submarket, By Turbine Size Forecast 2020-2030
5.13.2 Australia & New Zealand Wind Turbine Decommissioning Services Submarket, By Application Forecast 2020-2030
5.13.3 Australia & New Zealand Wind Turbine Decommissioning Services Submarket, By Service Type Forecast 2020-2030
5.13.4 Australia & New Zealand Wind Turbine Decommissioning Services Submarket, By Forecast 2020-2030
5.14 Rest of Asia-Pacific Wind Turbine Decommissioning Services Market Forecast, 2020-2030
5.14.1 Rest of Asia-Pacific Wind Turbine Decommissioning Services Submarket, By Turbine Size Forecast 2020-2030
5.14.2 Rest of Asia-Pacific Wind Turbine Decommissioning Services Submarket, By Application Forecast 2020-2030
5.14.3 Rest of Asia-Pacific Wind Turbine Decommissioning Services Submarket, By Service Type Forecast 2020-2030
5.14.4 Rest of Asia-Pacific Wind Turbine Decommissioning Services Submarket, By Forecast 2020-2030
5.15 Latin America Wind Turbine Decommissioning Services Market Forecast, 2020-2030
5.15.1 Latin America Wind Turbine Decommissioning Services Submarket, By Turbine Size Forecast 2020-2030
5.15.2 Latin America Wind Turbine Decommissioning Services Submarket, By Application Forecast 2020-2030
5.15.3 Latin America Wind Turbine Decommissioning Services Submarket, By Service Type Forecast 2020-2030
5.15.4 Latin America Wind Turbine Decommissioning Services Submarket, By Forecast 2020-2030
5.16 Middle East Wind Turbine Decommissioning Services Market Forecast, 2020-2030
5.16.1 Middle East Wind Turbine Decommissioning Services Submarket, By Turbine Size Forecast 2020-2030
5.16.2 Middle East Wind Turbine Decommissioning Services Submarket, By Application Forecast 2020-2030
5.16.3 Middle East Wind Turbine Decommissioning Services Submarket, By Service Type Forecast 2020-2030
5.16.4 Middle East Wind Turbine Decommissioning Services Submarket, By Forecast 2020-2030
5.17 Africa Wind Turbine Decommissioning Services Market Forecast, 2020-2030
5.17.1 Africa Wind Turbine Decommissioning Services Submarket, By Turbine Size Forecast 2020-2030
5.17.2 Africa Wind Turbine Decommissioning Services Submarket, By Application Forecast 2020-2030
5.17.3 Africa Wind Turbine Decommissioning Services Submarket, By Service Type Forecast 2020-2030
5.17.4 Africa Wind Turbine Decommissioning Services Submarket, By Forecast 2020-2030
7. Leading Companies in The Wind Turbine Decommissioning Services Market
7.1 Apex Clean Energy
7.1.1 Apex Clean Energy Products and Services
7.1.2 Analysis of Apex Clean Energy within the Wind Turbine Decommissioning Services Market
7.1.3 Apex Clean Energy M&A Activity
7.1.4 Future Outlook for Apex Clean Energy
7.1.5 Apex Clean Energy Projects
7.2 DonJon Marine Company, Inc.
7.2.1 DonJon Marine Company, Inc. Products and Services
7.2.2 Analysis of DonJon Marine Company, Inc. within the Wind Turbine Decommissioning Services Market
7.2.3 DonJon Marine Company, Inc. M&A Activity
7.2.4 Future Outlook for DonJon Marine Company, Inc.
7.2.5 DonJon Marine Company, Inc. Projects
7.3 EnBW
7.3.1 EnBW Products and Services
7.3.2 Analysis of EnBW within the Wind Turbine Decommissioning Services Market
7.3.3 EnBW M&A Activity
7.3.4 Future Outlook for EnBW
7.3.5 EnBW Projects
7.4 JLT Group
7.4.1 JLT Group Products and Services
7.4.2 Analysis of JLT Group within the Wind Turbine Decommissioning Services Market
7.4.3 JLT Group M&A Activity
7.4.4 Future Outlook for JLT Group
7.4.5 JLT Group Projects
7.5 M2 Subsea
7.5.1 M2 Subsea Products and Services
7.5.2 Analysis of M2 Subsea within the Wind Turbine Decommissioning Services Market
7.5.3 M2 Subsea M&A Activity
7.5.4 Future Outlook for M2 Subsea
7.5.5 M2 Subsea Projects
7.6 NIRAS
7.6.1 NIRAS Products and Services
7.6.2 Analysis of NIRAS within the Wind Turbine Decommissioning Services Market
7.6.3 NIRAS M&A Activity
7.6.4 Future Outlook for NIRAS
7.6.5 NIRAS Projects
7.7 Oceaneering International
7.7.1 Oceaneering International Products and Services
7.7.2 Analysis of Oceaneering International within the Wind Turbine Decommissioning Services Market
7.7.3 Oceaneering International M&A Activity
7.7.4 Future Outlook for Oceaneering International
7.7.5 Oceaneering International Projects
7.8 Rambol
7.8.1 Rambol Products and Services
7.8.2 Analysis of Rambol within the Wind Turbine Decommissioning Services Market
7.8.3 Rambol M&A Activity
7.8.4 Future Outlook for Rambol
7.8.5 Rambol Projects
7.9 Jack-up Barge, B.V.
7.9.1 Jack-up Barge, B.V. Products and Services
7.9.2 Analysis of Jack-up Barge, B.V. within the Wind Turbine Decommissioning Services Market
7.9.3 Jack-up Barge, B.V. M&A Activity
7.9.4 Future Outlook for Jack-up Barge, B.V.
7.9.5 Jack-up Barge, B.V. Projects
7.10 Ocean Surveys, Inc.
7.10.1 Ocean Surveys, Inc. Products and Services
7.10.2 Analysis of Ocean Surveys, Inc. within the Wind Turbine Decommissioning Services Market
7.10.3 Ocean Surveys, Inc. M&A Activity
7.10.4 Future Outlook for Ocean Surveys, Inc.
7.10.5 Ocean Surveys, Inc. Projects
7.11 Weeks Marine
7.11.1 Weeks Marine Products and Services
7.11.2 Analysis of Weeks Marine within the Wind Turbine Decommissioning Services Market
7.11.3 Weeks Marine M&A Activity
7.11.4 Future Outlook for Weeks Marine
7.11.5 Weeks Marine Projects
8. Conclusions and Recommendations
8.1 Global Wind Turbine Decommissioning Services Market Outlook
8.2 Recommendations
9. Glossary
Associated Visiongain Reports
Visiongain Report Sales Order Form
Appendix A
About Visiongain
Appendix B
Visiongain Report Evaluation Form
List of Tables
Table 1.0 Key Highlights
Table 3.1 PEST Analysis, Wind Turbine Decommissioning Services Market
Table 3.2 SWOT Analysis
Table 4.1 Global Wind Turbine Decommissioning Services Market Forecast 2020-2030 ($Bn, AGR %, CAGR %, Cumulative)
Table 4.2 Global Wind Turbine Decommissioning Services Submarket, By Turbine Size Forecast 2020-2030 ($billion, AGR %, Cumulative)
Table 4.3 Global Wind Turbine Decommissioning Services Submarket, By Service Type Forecast 2020-2030 ($billion, AGR %, Cumulative)
Table 4.4 Global Wind Turbine Decommissioning Services Submarket, By Forecast 2020-2030 ($billion, AGR %, Cumulative)
Table 5.1 Global Wind Turbine Decommissioning Services Market, by Country/Region Forecast 2020-2030 ($billion, AGR %, Cumulative)
Table 5.2 Global Wind Turbine Decommissioning Services Market, by Country/Region Forecast 2020-2030 ($billion, AGR %, Cumulative)
Table 5.3 Canada Wind Turbine Decommissioning Services Market Forecast 2020-2030 ($billion, , AGR %, CAGR %, Cumulative)
Table 5.4 Canada Wind Turbine Decommissioning Services Submarket, By Turbine Size Forecast 2020-2030 ($billion, AGR %, Cumulative)
Table 5.5 Canada Wind Turbine Decommissioning Services Submarket, By Application Forecast 2020-2030 ($billion, AGR %, Cumulative)
Table 5.6 US Wind Turbine Decommissioning Services Market Submarket, By Service Type Forecast 2020-2030 ($billion, , AGR %, CAGR %, Cumulative)
Table 5.7 US Wind Turbine Decommissioning Services Submarket, By Turbine Size Forecast 2020-2030 ($billion, AGR %, Cumulative)
Table 5.8 US Wind Turbine Decommissioning Services Submarket, By Application Forecast 2020-2030 ($billion, AGR %, Cumulative)
Table 5.9 Latin America Wind Turbine Decommissioning Services Market Forecast 2020-2030 ($billion, , AGR %, CAGR %, Cumulative)
Table 5.10 Latin America Wind Turbine Decommissioning Services Submarket, By Turbine Size Forecast 2020-2030 ($billion, AGR %, Cumulative)
Table 5.11 Latin America Wind Turbine Decommissioning Services Submarket, By Application Forecast 2020-2030 ($billion, AGR %, Cumulative)
Table 5.12 Germany Wind Turbine Decommissioning Services Market Submarket, By Service Type Forecast 2020-2030 ($billion, , AGR %, CAGR %, Cumulative)
Table 5.13 Germany Wind Turbine Decommissioning Services Submarket, By Turbine Size Forecast 2020-2030 ($billion, AGR %, Cumulative)
Table 5.14 Germany Wind Turbine Decommissioning Services Submarket, By Application Forecast 2020-2030 ($billion, AGR %, Cumulative)
Table 5.15 UK Wind Turbine Decommissioning Services Market Submarket, By Service Type Forecast 2020-2030 ($billion, , AGR %, CAGR %, Cumulative)
Table 5.16 UK Wind Turbine Decommissioning Services Submarket, By Turbine Size Forecast 2020-2030 ($billion, AGR %, Cumulative)
Table 5.17 UK Wind Turbine Decommissioning Services Submarket, By Application Forecast 2020-2030 ($billion, AGR %, Cumulative)
Table 5.18 Spain Wind Turbine Decommissioning Services Market Submarket, By Service Type Forecast 2020-2030 ($billion, , AGR %, CAGR %, Cumulative)
Table 5.19 Spain Wind Turbine Decommissioning Services Submarket, By Turbine Size Forecast 2020-2030 ($billion, AGR %, Cumulative)
Table 5.20 Spain Wind Turbine Decommissioning Services Submarket, By Application Forecast 2020-2030 ($billion, AGR %, Cumulative)
Table 5.21 UK Wind Turbine Decommissioning Services Submarket, By Service Type Forecast 2020-2030 ($billion, , AGR %, CAGR %, Cumulative)
Table 5.22 UK Wind Turbine Decommissioning Services Submarket, By Turbine Size Forecast 2020-2030 ($billion, AGR %, Cumulative)
Table 5.23 UK Wind Turbine Decommissioning Services Submarket, By Application Forecast 2020-2030 ($billion, AGR %, Cumulative)
Table 5.24 China Wind Turbine Decommissioning Services Submarket, By Service Type Forecast 2020-2030 ($billion, , AGR %, CAGR %, Cumulative)
Table 5.25 China Wind Turbine Decommissioning Services Submarket, By Turbine Size Forecast 2020-2030 ($billion, AGR %, Cumulative)
Table 5.26 China Wind Turbine Decommissioning Services Submarket, By Application Forecast 2020-2030 ($billion, AGR %, Cumulative)
Table 5.27 Australia Wind Turbine Decommissioning Services Submarket, By Service Type Forecast 2020-2030 ($billion, , AGR %, CAGR %, Cumulative)
Table 5.28 Australia Wind Turbine Decommissioning Services Submarket, By Turbine Size Forecast 2020-2030 ($billion, AGR %, Cumulative)
Table 5.29 Australia Wind Turbine Decommissioning Services Submarket, By Application Forecast 2020-2030 ($billion, AGR %, Cumulative)
Table 5.30 South Korea Wind Turbine Decommissioning Services Submarket, By Service Type Forecast 2020-2030 ($billion, , AGR %, CAGR %, Cumulative)
Table 5.31 South Korea Wind Turbine Decommissioning Services Submarket, By Turbine Size Forecast 2020-2030 ($billion, AGR %, Cumulative)
Table 5.32 South Korea Wind Turbine Decommissioning Services Submarket, By Application Forecast 2020-2030 ($billion, AGR %, Cumulative)
Table 5.33 Japan Wind Turbine Decommissioning Services Submarket, By Service Type Forecast 2020-2030 ($billion, , AGR %, CAGR %, Cumulative)
Table 5.34 Japan Wind Turbine Decommissioning Services Submarket, By Turbine Size Forecast 2020-2030 ($billion, AGR %, Cumulative)
Table 5.35 Japan Wind Turbine Decommissioning Services Submarket, By Application Forecast 2020-2030 ($billion, AGR %, Cumulative)
Table 5.36 India Wind Turbine Decommissioning Services Submarket, By Service Type Forecast 2020-2030 ($billion, , AGR %, CAGR %, Cumulative)
Table 5.37 India Wind Turbine Decommissioning Services Submarket, By Turbine Size Forecast 2020-2030 ($billion, AGR %, Cumulative)
Table 5.38 India Wind Turbine Decommissioning Services Submarket, By Application Forecast 2020-2030 ($billion, AGR %, Cumulative)
Table 5.39 Middle East Wind Turbine Decommissioning Services Submarket, By Service Type Forecast 2020-2030 ($billion, , AGR %, CAGR %, Cumulative)
Table 5.40 Middle East Wind Turbine Decommissioning Services Submarket, By Turbine Size Forecast 2020-2030 ($billion, AGR %, Cumulative)
Table 5.41 Middle East Wind Turbine Decommissioning Services Submarket, By Application Forecast 2020-2030 ($billion, AGR %, Cumulative)
Table 5.42 Rest of Asia-Pacific Wind Turbine Decommissioning Services Submarket, By Service Type Forecast 2020-2030 ($billion , , AGR %, CAGR %, Cumulative)
Table 5.43 Rest of Asia-Pacific Wind Turbine Decommissioning Services Submarket, By Turbine Size Forecast 2020-2030 ($billion , AGR %, Cumulative)
Table 5.44 Rest of Asia-Pacific Wind Turbine Decommissioning Services Submarket, By Application Forecast 2020-2030 ($billion , AGR %, Cumulative)
Table 5.45 Rest of Europe Wind Turbine Decommissioning Services Submarket, By Service Type Forecast 2020-2030 ($billion, , AGR %, CAGR %, Cumulative)
Table 5.46 Rest of Europe Wind Turbine Decommissioning Services Submarket, By Turbine Size Forecast 2020-2030 ($billion, AGR %, Cumulative)
Table 5.47 Rest of Europe Wind Turbine Decommissioning Services Submarket, By Application Forecast 2020-2030 ($billion, AGR %, Cumulative)
Table 5.48 Africa Wind Turbine Decommissioning Services Submarket, By Service Type Forecast 2020-2030 ($billion, , AGR %, CAGR %, Cumulative)
Table 5.49 Africa Wind Turbine Decommissioning Services Submarket, By Turbine Size Forecast 2020-2030 ($billion, AGR %, Cumulative)
Table 5.50 Africa Wind Turbine Decommissioning Services Submarket, By Application Forecast 2020-2030 ($billion, AGR %, Cumulative)
Table 5.51 Spain Wind Turbine Decommissioning Services Submarket, By Service Type Forecast 2020-2030 ($billion , , AGR %, CAGR %, Cumulative)
Table 5.52 Spain Wind Turbine Decommissioning Services Submarket, By Turbine Size Forecast 2020-2030 ($billion , AGR %, Cumulative)
Table 5.53 Spain Wind Turbine Decommissioning Services Submarket, By Application Forecast 2020-2030 ($billion , AGR %, Cumulative)
Table 7.1 Apex Clean Energy Profile 2019 (Market Entry, Public/Private, Headquarters, Geography, Key Market, Listed on, Products/Services
Table 7.2 Apex Clean Energy Profile 2019 (Market Entry, Public/Private, Headquarter, Total Company Revenue $billion, Change in Revenue, Geography, Key Market, Listed on, Products/Services)
Table 7.3 Apex Clean Energy Products and Services (Product/Service, Notes)
Table 7.4 Apex Clean Energy Total Company Sales 2015-2019 (US$billion, AGR %)
Table 7.5 Apex Clean Energy Total Company Recent Development 2015-2019
Table 7.6 DonJon Marine Company, Inc. Profile 2019 (Market Entry, Public/Private, Headquarter, Total Company Revenue $billion, Change in Revenue, Geography, Key Market, Listed on, Products/Services)
Table 7.7 DonJon Marine Company, Inc. Products and Services (Product/Service, Notes)
Table 7.8 DonJon Marine Company, Inc. Total Company Sales 2015-2019 (US$billion, AGR %)
Table 7.9 DonJon Marine Company, Inc. Total Company Recent Development 2015-2019
Table 7.10 EnBW Profile 2019 (Market Entry, Public/Private, Headquarter, Total Company Revenue $billion, Change in Revenue, Geography, Key Market, Listed on, Products/Services)
Table 7.11 EnBW Products and Services (Product/Service, Notes)
Table 7.12 EnBW Total Company Sales 2015-2019 (US$billion, AGR %)
Table 7.13 EnBW Total Company Recent Development 2015-2019
Table 7.14 JLT Group Profile 2019 (Market Entry, Public/Private, Headquarter, Total Company Revenue $billion, Change in Revenue, Geography, Key Market, Listed on, Products/Services)
Table 7.15 JLT Group Products and Services (Product/Service, Notes)
Table 7.16 JLT Group Total Company Sales 2015-2019 (US$billion, AGR %)
Table 7.17 JLT Group Total Company Recent Development 2015-2019
Table 7.18 M2 Subsea Profile 2019 (Market Entry, Public/Private, Headquarter, Total Company Revenue $billion, Change in Revenue, Geography, Key Market, Listed on, Products/Services)
Table 7.19 M2 Subsea Products and Services (Product/Service, Notes)
Table 7.20 M2 Subsea Total Company Sales 2015-2019 (US$billion, AGR %)
Table 7.21 M2 Subsea Total Company Recent Development 2015-2019
Table 7.22 NIRAS Profile 2019 (Market Entry, Public/Private, Headquarter, Total Company Revenue $billion, Change in Revenue, Geography, Key Market, Listed on, Products/Services)
Table 7.23 NIRAS Products and Services (Product/Service, Notes)
Table 7.24 NIRAS Total Company Sales 2015-2019 (US$billion, AGR %)
Table 7.25 NIRAS Total Company Recent Development 2015-2019
Table 7.26 Oceaneering International Profile 2019 (Market Entry, Public/Private, Headquarter, Total Company Revenue $billion, Change in Revenue, Geography, Key Market, Listed on, Products/Services)
Table 7.27 Oceaneering International Products and Services (Product/Service, Notes)
Table 7.28 Oceaneering International Total Company Sales 2015-2019 (US$billion, AGR %)
Table 7.29 Oceaneering International Total Company Recent Development 2015-2019
Table 7.30 Rambol Profile 2019 (Market Entry, Public/Private, Headquarter, Total Company Revenue $billion, Change in Revenue, Geography, Key Market, Listed on, Products/Services)
Table 7.31 Rambol Products and Services (Product/Service, Notes)
Table 7.32 Rambol Total Company Sales 2015-2019 (US$billion, AGR %)
Table 7.33 Rambol Total Company Recent Development 2015-2019
Table 7.34 Jack-up Barge, B.V. Profile 2019 (Market Entry, Public/Private, Headquarter, Total Company Revenue $billion, Change in Revenue, Geography, Key Market, Listed on, Products/Services)
Table 7.35 Jack-up Barge, B.V. Products and Services (Product/Service, Notes)
Table 7.36 Jack-up Barge, B.V. Total Company Sales 2015-2019 (US$billion, AGR %)
Table 7.37 Jack-up Barge, B.V. Total Company Recent Development 2015-2019
Table 7.38 Ocean Surveys, Inc. Profile 2019 (Market Entry, Public/Private, Headquarter, Total Company Revenue $billion, Change in Revenue, Geography, Key Market, Listed on, Products/Services)
Table 7.39 Ocean Surveys, Inc. Products and Services (Product/Service, Notes)
Table 7.40 Ocean Surveys, Inc. Total Company Sales 2015-2019 (US$billion, AGR %)
Table 7.41 Ocean Surveys, Inc. Total Company Recent Development 2015-2019
Table 7.42 Weeks Marine Profile 2019 (Market Entry, Public/Private, Headquarter, Total Company Revenue $billion, Change in Revenue, Geography, Key Market, Listed on, Products/Services)
Table 7.43 Weeks Marine Products and Services (Product/Service, Notes)
Table 7.44 Weeks Marine Total Company Sales 2015-2019 (US$billion, AGR %)
Table 7.45 Weeks Marine Total Company Recent Development 2015-2019
List of Figures
Figure 1.1 Global Wind Turbine Decommissioning Services Market Segmentation
Figure 2.1 Wind Turbine Decommissioning Services Value Chain Analysis
Figure 3.1 Wind Turbine Decommissioning Services Supply-Demand Analysis
Figure 4.1 Global Wind Turbine Decommissioning Services Forecast 2020-2030 ($billion, AGR %)
Figure 4.2 Global Wind Turbine Decommissioning Services Market Forecast 2020-2030
Figure 4.3 Global Wind Turbine Decommissioning Services Submarket Forecast by 2020-2030 ($ billion)
Figure 4.4 Global Wind Turbine Decommissioning Services Market By Turbine Size Share Forecast 2020, 2025, 2030 (% Share)
Figure 4.19 Global Wind Turbine Decommissioning Services by Submarket By Turbine Size Forecast 2020-2030 ($ million)
Figure 4.20 Global Wind Turbine Decommissioning Services Market, by Share Forecast 2020, 2025, 2030 (% Share)
Figure 4.21 Wind Turbine Decommissioning Services Market, By Turbine Size Forecast 2020-2030 ($billion, AGR%)
Figure 4.23 Wind Turbine Decommissioning Services Market, By Turbine Size Forecast 2020-2030 ($billion, AGR%)
Figure 4.25 Wind Turbine Decommissioning Services Market, By Turbine Size Forecast 2020-2030 ($billion, AGR%)
Figure 4.27 Wind Turbine Decommissioning Services Market, By Turbine Size Forecast 2020-2030 ($billion, AGR%)
Figure 5.1 Regional/Country Wind Turbine Decommissioning Services Market, by 2020-2030
Figure 5.3 Leading Country/Regional Wind Turbine Decommissioning Services Market Share, by 2020
Figure 5.4 Leading Country/Regional Wind Turbine Decommissioning Services Market Share, by 2025
Figure 5.5 Leading Country/Regional Wind Turbine Decommissioning Services Market Share, by 2030
Figure 5.6 Canada Wind Turbine Decommissioning Services Market Forecast 2020-2030 ($billion, AGR%)
Figure 5.7 Canada Wind Turbine Decommissioning Services Market, by Forecast 2020-2030
Figure 5.8 Canada Wind Turbine Decommissioning Services Submarket, By Turbine Size Forecast 2020-2030
Figure 5.9 Canada Wind Turbine Decommissioning Services Submarket , By Application Forecast 2020-2030
Figure 5.10 Canada Wind Turbine Decommissioning Services Submarket , By Service Type 2020-2030 ($billion, AGR%)
Figure 5.10 U.S. Wind Turbine Decommissioning Services Market Forecast 2020-2030 ($billion, AGR%)
Figure 5.11 U.S. Wind Turbine Decommissioning Services Market, by Forecast 2020-2030
Figure 5.12 U.S. Wind Turbine Decommissioning Services Submarket, By Turbine Size Forecast 2020-2030
Figure 5.13 U.S. Wind Turbine Decommissioning Services Submarket , By Application Forecast 2020-2030
Figure 5.13 U.S. Wind Turbine Decommissioning Services Submarket , By Service Type Forecast 2020-2030
Figure 5.14 Latin America Wind Turbine Decommissioning Services Market Forecast 2020-2030 ($billion , AGR%)
Figure 5.15 Latin America Wind Turbine Decommissioning Services Market, by Forecast 2020-2030
Figure 5.16 Latin America Wind Turbine Decommissioning Services Submarket, By Turbine Size Forecast 2020-2030
Figure 5.17 Latin America Wind Turbine Decommissioning Services Submarket , By Application Forecast 2020-2030
Figure 5.17 Latin America Wind Turbine Decommissioning Services Submarket , By Service Type Forecast 2020-2030
Figure 5.18 Germany Wind Turbine Decommissioning Services Market Forecast 2020-2030 ($billion, AGR%)
Figure 5.19 Germany Wind Turbine Decommissioning Services Market, by Forecast 2020-2030
Figure 5.20 Germany Wind Turbine Decommissioning Services Submarket, By Turbine Size Forecast 2020-2030
Figure 5.21 Germany Wind Turbine Decommissioning Services Submarket , By Application Forecast 2020-2030
Figure 5.21 Germany Wind Turbine Decommissioning Services Submarket , By Service Type Forecast 2020-2030
Figure 5.22 U.K. Wind Turbine Decommissioning Services Market Forecast 2020-2030 ($billion, AGR%)
Figure 5.23 U.K. Wind Turbine Decommissioning Services Market, by Forecast 2020-2030
Figure 5.24 U.K. Wind Turbine Decommissioning Services Submarket, By Turbine Size Forecast 2020-2030
Figure 5.25 U.K. Wind Turbine Decommissioning Services Submarket , By Application Forecast 2020-2030
Figure 5.25 U.K. Wind Turbine Decommissioning Services Submarket , By Service Type Forecast 2020-2030
Figure 5.26 Spain Wind Turbine Decommissioning Services Market Forecast 2020-2030 ($billion, AGR%)
Figure 5.27 Spain Wind Turbine Decommissioning Services Market, by Forecast 2020-2030
Figure 5.28 Spain Wind Turbine Decommissioning Services Submarket, By Turbine Size Forecast 2020-2030
Figure 5.29 Spain Wind Turbine Decommissioning Services Submarket , By Application Forecast 2020-2030
Figure 5.30 UK Wind Turbine Decommissioning Services Market Forecast 2020-2030 ($billion, AGR%)
Figure 5.31 UK Wind Turbine Decommissioning Services Market, by Forecast 2020-2030
Figure 5.32 UK Wind Turbine Decommissioning Services Submarket, By Turbine Size Forecast 2020-2030
Figure 5.33 UK Wind Turbine Decommissioning Services Submarket , By Application Forecast 2020-2030
Figure 5.34 China Wind Turbine Decommissioning Services Market Forecast 2020-2030 ($billion, AGR%)
Figure 5.35 China Wind Turbine Decommissioning Services Submarket , By Service Type, by Forecast 2020-2030
Figure 5.36 China Wind Turbine Decommissioning Services Submarket, By Turbine Size Forecast 2020-2030
Figure 5.37 China Wind Turbine Decommissioning Services Submarket , By Application Forecast 2020-2030
Figure 5.38 Australia Wind Turbine Decommissioning Services Market Forecast 2020-2030 ($billion, AGR%)
Figure 5.39 Australia Wind Turbine Decommissioning Services Submarket , By Service Type, by Forecast 2020-2030
Figure 5.40 Australia Wind Turbine Decommissioning Services Submarket, By Turbine Size Forecast 2020-2030
Figure 5.41 Australia Wind Turbine Decommissioning Services Submarket , By Application Forecast 2020-2030
Figure 5.42 South Korea Wind Turbine Decommissioning Services Market Forecast 2020-2030 ($billion, AGR%)
Figure 5.43 South Korea Wind Turbine Decommissioning Services Submarket , By Service Type, by Forecast 2020-2030
Figure 5.44 South Korea Wind Turbine Decommissioning Services Submarket, By Turbine Size Forecast 2020-2030
Figure 5.45 South Korea Wind Turbine Decommissioning Services Submarket , By Application Forecast 2020-2030
Figure 5.46 Japan Wind Turbine Decommissioning Services Market Forecast 2020-2030 ($billion, AGR%)
Figure 5.47 Japan Wind Turbine Decommissioning Services Submarket , By Service Type, by Forecast 2020-2030
Figure 5.48 Japan Wind Turbine Decommissioning Services Submarket, By Turbine Size Forecast 2020-2030
Figure 5.49 Japan Wind Turbine Decommissioning Services Submarket , By Application Forecast 2020-2030
Figure 5.50 India Wind Turbine Decommissioning Services Market Forecast 2020-2030 ($billion, AGR%)
Figure 5.51 India Wind Turbine Decommissioning Services Submarket , By Service Type, by Forecast 2020-2030
Figure 5.52 India Wind Turbine Decommissioning Services Submarket, By Turbine Size Forecast 2020-2030
Figure 5.53 India Wind Turbine Decommissioning Services Submarket , By Application Forecast 2020-2030
Figure 5.54 Middle East Wind Turbine Decommissioning Services Market Forecast 2020-2030 ($billion, AGR%)
Figure 5.55 Middle East Wind Turbine Decommissioning Services Submarket , By Service Type, by Forecast 2020-2030
Figure 5.56 Middle East Wind Turbine Decommissioning Services Submarket, By Turbine Size Forecast 2020-2030
Figure 5.57 Middle East Wind Turbine Decommissioning Services Submarket , By Application Forecast 2020-2030
Figure 5.70 Rest of the World Wind Turbine Decommissioning Services Market Forecast 2020-2030 ($billion , AGR%)
Figure 5.71 Rest of the World Wind Turbine Decommissioning Services Submarket , By Service Type, by Forecast 2020-2030
Figure 5.72 Rest of the World Wind Turbine Decommissioning Services Submarket, By Turbine Size Forecast 2020-2030
Figure 5.73 Rest of the World Wind Turbine Decommissioning Services Submarket , By Application Forecast 2020-2030
Figure 7.1 Apex Clean Energy Total Company Sales 2013-2019 (US$ million, AGR %)
Figure 7.2 DonJon Marine Company, Inc. Total Company Sales 2013-2019 (US$ million, AGR %)
Figure 7.3 EnBW Total Company Sales 2013-2019 (US$ Bn, AGR %)
Figure 7.6 JLT Group Company Sales 2013-2019 (US$ bn, AGR %)
Figure 7.7 JLT Group Revenue % Share, by Service Type Segment, 2019
Figure 7.8 JLT Group Revenue % Share, by Geographical Trade, 2019
Figure 7.9 JLT Group Revenue % Share, by Business Segment, 2019
Figure 7.10 M2 Subsea Revenue % Share, by Geographic Segment, 2019
Figure 7.11 NIRAS Company Total Company Sales 2013-2019 (US$ million, AGR %)
Figure 7.12 Oceaneering International Total Company Sales 2013-2019 (US$ million, AGR %)
Figure 7.13 Oceaneering International Revenue % Share, by Regional Segment, 2019
Figure 7.14 Rambol Total Company Sales 2013-2019 (US$ million, AGR %)
Figure 7.15 Rambol Revenue % Share, by Regional Segment, 2019
Figure 7.16 Rambol Revenue % Share, by Business Segment, 2019
Figure 7.17 Jack-up Barge, B.V. Total Company Sales 2013-2019 (US$ bn, AGR %)
Figure 7.18 Ocean Surveys, Inc. Total Company Revenue 2013-2019 (US$ bn, AGR %)
Figure 7.19 Ocean Surveys, Inc. Company Sales 2014-2019 (US$ bn, AGR %)
Figure 7.20 Ocean Surveys, Inc. Revenue % Share, by Business Segment, 2019