The Virtual Power Plant (VPP) Market Report 2023-2033: This report will prove invaluable to leading firms striving for new revenue pockets if they wish to better understand the industry and its underlying dynamics. It will be useful for companies that would like to expand into different industries or to expand their existing operations in a new region.
Virtual Power Plants are Gaining Importance in the Power Distribution Sector
Electricity supply and demand must be matched, and any imbalance between them can disrupt the frequency and affect power quality, causing power outages and other problems. In the past, power companies adjusted supply by controlling thermal and hydroelectric power generation based on precise calculations. However, as renewable energies such as solar and wind power generation, which are difficult to control, become the main source of power, the challenge is to secure the capability to adjust these sources. With this background, virtual power plants (VPPs) are attracting attention. The VPP bundles and remotely controls distributed power resources such as solar power generation facilities, storage batteries, and electric vehicles owned by consumers. VPPs are also expected to further enhance disaster resilience.
VPPs connect large storage batteries via a network to not only renewable energy sources such as solar and wind power generation, but also distributed energy resources such as private power generation facilities of consumers in buildings and factories, as well as fuel cells, and aggregate, control, and remotely integrate and manage them using IoT. Energy supply and demand optimization technology stabilises the power of the entire network and controls surpluses, allowing the system to function as a power plant, supplying power to other consumers and the network in an emergency.
What Questions Should You Ask before Buying a Market Research Report?
• How is the virtual power plant (VPP) market evolving?
• What is driving and restraining the virtual power plant (VPP) market?
• How will each virtual power plant (VPP) submarket segment grow over the forecast period and how much revenue will these submarkets account for in 2033?
• How will the market shares for each virtual power plant (VPP) submarket develop from 2023 to 2033?
• What will be the main driver for the overall market from 2023 to 2033?
• Will leading virtual power plant (VPP) markets broadly follow the macroeconomic dynamics, or will individual national markets outperform others?
• How will the market shares of the national markets change by 2033 and which geographical region will lead the market in 2033?
• Who are the leading players and what are their prospects over the forecast period?
• What are the virtual power plant (VPP) projects for these leading companies?
• How will the industry evolve during the period between 2023 and 2033? What are the implications of virtual power plant (VPP) projects taking place now and over the next 10 years?
• Is there a greater need for product commercialisation to further scale the virtual power plant (VPP) market?
• Where is the virtual power plant (VPP) market heading and how can you ensure you are at the forefront of the market?
• What are the best investment options for new product and service lines?
• What are the key prospects for moving companies into a new growth path and C-suite?
You need to discover how this will impact the virtual power plant (VPP) market today, and over the next 10 years:
• Our 347-page report provides 158 tables and 199 charts/graphs exclusively to you.
• The report highlights key lucrative areas in the industry so you can target them – NOW.
• It contains in-depth analysis of global, regional and national sales and growth.
• It highlights for you the key successful trends, changes and revenue projections made by your competitors.
This report tells you TODAY how the virtual power plant (VPP) market will develop in the next 10 years, and in line with the variations in COVID-19 economic recession and bounce. This market is more critical now than at any point over the last 10 years.
Forecasts to 2033 and other analyses reveal commercial prospects
• In addition to revenue forecasting to 2033, our new study provides you with recent results, growth rates, and market shares.
• You will find original analyses, with business outlooks and developments.
• Discover qualitative analyses (including market dynamics, drivers, opportunities, restraints and challenges), cost structure, impact of rising virtual power plant (VPP) prices and recent developments.
This report includes data analysis and invaluable insight into how COVID-19 will affect the industry and your company. Four COVID-19 recovery patterns and their impact, namely, “V”, “L”, “W” and “U” are discussed in this report.
Segments Covered in the Report
Market Segment by Component
• Energy Generation Technology
• Energy Storage Technologies
• Information Communication Technology (ICT)
Market Segment by End-User
• Industrial VPP
• Commercial VPP
• Residential VPP
• Other End-User
Market Segment by Information Communication Technology (ICT)
• Energy Management Systems (EMS)
• Supervisory Control and Data Acquisition (SCADA)
• Distribution Management System (DMS)
• Smart Meters
• Other Information Communication Technology (ICT)
Market Segment by Energy Generation Technology
• Wind Based Energy Generation
• Small Hydro-Plants
• Solar Production
• Combined Heat and Power (CHP)
• Small Power Plants
• Other Energy Generation Technology
Market Segment by Energy Generation Technology
• Battery Energy Storage System (BESS)
• Supercapacitor Energy Storage (SCES)
• Super Conductor Magnetic Energy Storage (SMES)
• Hydraulic Pumped Energy Storage (HPES)
• Flywheel Energy Storage (FWES)
• Other Energy Storage Technology

In addition to the revenue predictions for the overall world market and segments, you will also find revenue forecasts for four regional and 20 leading national markets:
North America
• U.S.
• Canada
Europe
• Germany
• Spain
• United Kingdom
• France
• Italy
• Rest of Europe
Asia Pacific
• China
• Japan
• India
• Australia
• South Korea
• Rest of Asia Pacific
Middle East & Africa
• GCC
• South Africa
• Rest of Middle East & Africa
Latin America
• Brazil
• Mexico
• Rest of Latin America
Need industry data? Please contact us today.
The report also includes profiles and for some of the leading companies in the Virtual Power Plant (VPP) Market, 2023 to 2033, with a focus on this segment of these companies’ operations.
Leading companies and the potential for market growth
• ABB Ltd.
• AGL Energy Ltd
• AutoGrid
• Blue Pillar
• Cisco Systems, Inc.
• Enel S.P.A
• Enernoc, Inc.
• General Electric Company
• Hitachi, Ltd.
• International Business Machines Corporation
• Next Kraftwerke
• Robert Bosch GmbH
• Schneider Electric SE
• Siemens AG
• Toshiba Corporation
Overall world revenue for Virtual Power Plant (VPP) Market, 2023 to 2033 in terms of value the market will surpass US$520.7 million in 2023, our work calculates. We predict strong revenue growth through to 2033. Our work identifies which organizations hold the greatest potential. Discover their capabilities, progress, and commercial prospects, helping you stay ahead.
How will the Virtual Power Plant (VPP) Market, 2023 to 2033 report help you?
In summary, our 340+ page report provides you with the following knowledge:
• Revenue forecasts to 2033 for Virtual Power Plant (VPP) Market, 2023 to 2033 Market, with forecasts for component, end-user, Information communication technology (ICT), energy generation technology, energy generation technology and company size, each forecast at a global and regional level – discover the industry’s prospects, finding the most lucrative places for investments and revenues.
• Revenue forecasts to 2033 for four regional and 20 key national markets – See forecasts for the Virtual Power Plant (VPP) Market, 2023 to 2033 market in North America, Europe, Asia-Pacific, Latin America and Middle East & Africa. Also forecasted is the market in the US, Canada, Mexico, Brazil, Germany, France, UK, Italy, China, India, Japan, and Australia among other prominent economies.
• Prospects for established firms and those seeking to enter the market – including company profiles for 15 of the major companies involved in the Virtual Power Plant (VPP) Market, 2023 to 2033.
Find quantitative and qualitative analyses with independent predictions. Receive information that only our report contains, staying informed with invaluable business intelligence.
Information found nowhere else
With our new report, you are less likely to fall behind in knowledge or miss out on opportunities. See how our work could benefit your research, analyses, and decisions. Visiongain’s study is for everybody needing commercial analyses for the Virtual Power Plant (VPP) Market, 2023 to 2033, market-leading companies. You will find data, trends and predictions.
To access the data contained in this document please email contactus@visiongain.com
Buy our report today Virtual Power Plant (VPP) Market Report 2023-2033: Forecasts by Component (Energy Generation Technology, Energy Storage Technologies, Information Communication Technology (ICT)), by End-user (Industrial VPP, Commercial VPP, Residential VPP, Other), by Information Communication Technology (ICT) (Energy Management Systems (EMS), Supervisory Control and Data Acquisition (SCADA), Distribution Management System (DMS), Smart Meters, Other), by Energy Generation Technology (Wind Based Energy Generation, Small Hydro-Plants, Solar Production, Combined Heat and Power (CHP), Small Power Plants, Other), by Energy Storage Technology (Battery Energy Storage System (BESS), Supercapacitor Energy Storage (SCES), Super Conductor Magnetic Energy Storage (SMES), Hydraulic Pumped Energy Storage (HPES), Flywheel Energy Storage (FWES), Other) AND Regional and Leading National Market Analysis PLUS Analysis of Leading Companies AND COVID-19 Impact and Recovery Pattern Analysis. Avoid missing out by staying informed – order our report now.
Visiongain is a trading partner with the US Federal Government
CCR Ref number: KD4R6
Do you have any custom requirements we can help you with? Any need for a specific country, geo region, market segment or specific company information? Contact us today, we can discuss your needs and see how we can help: contactus@visiongain.com
1. Report Overview
1.1 Objectives of the Study
1.2 Introduction to Virtual Power Plant (VPP) Market
1.3 What This Report Delivers
1.4 Why You Should Read This Report
1.5 Key Questions Answered by this Analytical Report Include:
1.6 Who is This Report For?
1.7 Methodology
1.7.1 Market Definitions
1.7.2 Market Evaluation & Forecasting Methodology
1.7.3 Data Validation
1.8 Frequently Asked Questions (FAQs)
1.9 Associated Visiongain Reports
1.10 About Visiongain
2 Executive Summary
3 Premium Insights
3.1 Geographical Snapshot: Global Virtual Power Plant (VPP) Market
3.2 Component Segment: Market Attractiveness Index
3.3 End-User Segment: Market Attractiveness Index
3.4 Information Communication Technology: Market Attractiveness Index
3.5 Energy Generation Technology: Market Attractiveness Index
3.6 Energy Storage Technology: Market Attractiveness Index
4 Market Overview
4.1 Key Findings
4.2 Market Dynamics
4.2.1 Market Driving Factors
4.2.2 Market Restraining Factors
4.2.3 Market Opportunities
4.3 Porter’s Five Forces Analysis
4.3.1 Bargaining Power of Suppliers
4.3.2 Bargaining Power of Buyers
4.3.3 Competitive Rivalry
4.3.4 Threat from Substitutes
4.3.5 Threat of New Entrants
4.4 PESTLE Analysis
4.4.1 Political Factors
4.4.2 Economic Factors
4.4.3 Social Factors
4.4.4 Technology Factors
5 Global Virtual Power Plant (VPP) Market Analysis by Component
5.1 Key Findings
5.2 Global Virtual Power Plant (VPP) Market Attractiveness Index by Component
5.2.1 Global Virtual Power Plant (VPP) Market Attractiveness Index by Component
5.2.2 Global Virtual Power Plant (VPP) Market Size Estimation and Forecast by Component
5.3 Energy Generation Technology
5.4 Global Energy Generation Technology Market Size Estimation Forecast, 2023-2033 (US$ Mn)
Source: Visiongain Reports Ltd., 2023
5.4.1 Global Energy Generation Technology Market Size Estimation Forecast by Region, 2023-2033 (US$ Mn)
5.5 Energy Storage Technology
5.5.1 Global Energy Storage Technology Market Size Estimation Forecast, 2023-2033 (US$ Mn)
5.5.2 Global Energy Storage Technologies Market Forecast by Region, 2023-2033 (US$ Mn)
5.6 Information Communication Technology (ICT)
5.6.1 Global Information Communication Technology (ICT) Market Size Estimation Forecast, 2023-2033 (US$ Mn)
5.6.2 Global Information Communication Technology (ICT) Market Forecast by Region, 2023-2033 (US$ Mn)
6 Global Virtual Power Plant (VPP) Market Analysis by End-User
6.1 Key Findings
6.2 Global Virtual Power Plant (VPP) Market Attractiveness Index by End-User
6.2.1 Global Virtual Power Plant (VPP) Market Attractiveness Index by End-User
6.2.2 Global Virtual Power Plant (VPP) Market Size Estimation and Forecast by End-User
6.3 Industrial VPP
6.4 Global Industrial VPP Market Size Estimation Forecast, 2023-2033 (US$ Mn)
Source: Visiongain Reports Ltd., 2023
6.4.1 Global Industrial VPP Market Size Estimation Forecast by Region, 2023-2033 (US$ Mn)
6.5 Commercial VPP
6.5.1 Global Commercial VPP Market Size Estimation Forecast, 2023-2033 (US$ Mn)
6.5.2 Global Commercial VPP Market Forecast by Region, 2023-2033 (US$ Mn)
6.6 Residential VPP
6.6.1 Global Residential VPP Market Size Estimation Forecast, 2023-2033 (US$ Mn)
6.6.2 Global Residential VPP Market Forecast by Region, 2023-2033 (US$ Mn)
6.7 Other End-User
6.7.1 Global Other End-User Market Size Estimation Forecast, 2023-2033 (US$ Mn)
6.7.2 Global Other End-User Market Forecast by Region, 2023-2033 (US$ Mn)
7 Global Virtual Power Plant (VPP) Market Analysis by Information Communication Technology
7.1 Key Findings
7.2 Global Virtual Power Plant (VPP) Market Attractiveness Index by Information Communication Technology
7.2.1 Global Virtual Power Plant (VPP) Market Attractiveness Index by End-User
7.2.2 Global Virtual Power Plant (VPP) Market Size Estimation and Forecast by Information Communication Technology
7.3 Energy Management Systems (EMS)
7.4 Global Energy Management Systems (EMS) Market Size Estimation Forecast, 2023-2033 (US$ Mn)
Source: Visiongain Reports Ltd., 2023
7.4.1 Global Energy Management Systems (EMS) Market Size Estimation Forecast by Region, 2023-2033 (US$ Mn)
7.5 Supervisory Control and Data Acquisition (SCADA)
7.5.1 Global Supervisory Control and Data Acquisition (SCADA) Market Size Estimation Forecast, 2023-2033 (US$ Mn)
7.5.2 Global Supervisory Control and Data Acquisition (SCADA) Market Forecast by Region, 2023-2033 (US$ Mn)
7.6 Distribution Management System (DMS)
7.6.1 Global Distribution Management System (DMS) Market Size Estimation Forecast, 2023-2033 (US$ Mn)
7.6.2 Global Distribution Management System (DMS) Market Forecast by Region, 2023-2033 (US$ Mn)
7.7 Smart Meters
7.7.1 Global Smart Meter Market Size Estimation Forecast, 2023-2033 (US$ Mn)
7.7.2 Global Smart Meters Market Forecast by Region, 2023-2033 (US$ Mn)
7.8 Other Information Communication Technology (ICT)
7.8.1 Global Other Information Communication Technology (ICT) Market Size Estimation Forecast, 2023-2033 (US$ Mn)
7.8.2 Global Other Information Communication Technology (ICT) Market Forecast by Region, 2023-2033 (US$ Mn)
8 Global Virtual Power Plant (VPP) Market Analysis by Energy Generation Technology
8.1 Key Findings
8.2 Global Virtual Power Plant (VPP) Market Attractiveness Index by Energy Generation Technology
8.1.1 Global Virtual Power Plant (VPP) Market Attractiveness Index by Energy Generation Technology
8.1.2 Global Virtual Power Plant (VPP) Market Size Estimation and Forecast by Energy Generation Technology
8.2 Wind Based Energy Generation
8.3 Global Wind Based Energy Generation Market Size Estimation Forecast, 2023-2033 (US$ Mn)
Source: Visiongain Reports Ltd., 2023
8.3.1 Global Energy Management Systems (EMS) Market Size Estimation Forecast by Region, 2023-2033 (US$ Mn)
8.4 Small Hydro-Plants
8.4.1 Global Small Hydro-Plant Market Size Estimation Forecast, 2023-2033 (US$ Mn)
8.4.2 Global Small Hydro-Plants Market Forecast by Region, 2023-2033 (US$ Mn)
8.5 Solar Production
8.5.1 Global Solar Production Market Size Estimation Forecast, 2023-2033 (US$ Mn)
8.5.2 Global Solar Production Market Forecast by Region, 2023-2033 (US$ Mn)
8.6 Combined Heat and Power (CHP)
8.6.1 Global Combined Heat and Power (CHP) Market Size Estimation Forecast, 2023-2033 (US$ Mn)
8.6.2 Global Combined Heat and Power (CHP) Market Forecast by Region, 2023-2033 (US$ Mn)
8.7 Small Power Plants
8.7.1 Global Small Power Plants Market Size Estimation Forecast, 2023-2033 (US$ Mn)
8.7.2 Global Small Power Plants Market Forecast by Region, 2023-2033 (US$ Mn)
8.8 Other Energy Generation Technology
8.8.1 Global Other Energy Generation Technology Market Size Estimation Forecast, 2023-2033 (US$ Mn)
8.8.2 Global Other Energy Generation Technology Market Forecast by Region, 2023-2033 (US$ Mn)
9 Global Virtual Power Plant (VPP) Market Analysis by Energy Storage Technology
9.1 Key Findings
9.2 Global Virtual Power Plant (VPP) Market Attractiveness Index by Energy Storage Technology
9.1.1 Global Virtual Power Plant (VPP) Market Attractiveness Index by Energy Generation Technology
9.1.2 Global Virtual Power Plant (VPP) Market Size Estimation and Forecast by Energy Storage Technology
9.2 Battery Energy Storage System (BESS)
9.3 Global Battery Energy Storage System (BESS) Market Size Estimation Forecast, 2023-2033 (US$ Mn)
Source: Visiongain Reports Ltd., 2023
9.3.1 Global Battery Energy Storage System (BESS) Market Size Estimation Forecast by Region, 2023-2033 (US$ Mn)
9.4 Supercapacitor Energy Storage (SCES)
9.4.1 Global Supercapacitor Energy Storage (SCES) Market Size Estimation Forecast, 2023-2033 (US$ Mn)
9.4.2 Global Supercapacitor Energy Storage (SCES) Market Forecast by Region, 2023-2033 (US$ Mn)
9.5 Super Conductor Magnetic Energy Storage (SMES)
9.5.1 Global Super Conductor Magnetic Energy Storage (SMES) Market Size Estimation Forecast, 2023-2033 (US$ Mn)
9.5.2 Global Super Conductor Magnetic Energy Storage (SMES) Market Forecast by Region, 2023-2033 (US$ Mn)
9.6 Hydraulic Pumped Energy Storage (HPES)
9.6.1 Global Hydraulic Pumped Energy Storage (HPES) Market Size Estimation Forecast, 2023-2033 (US$ Mn)
9.6.2 Global Hydraulic Pumped Energy Storage (HPES) Market Forecast by Region, 2023-2033 (US$ Mn)
9.7 Flywheel Energy Storage (FWES)
9.7.1 Global Flywheel Energy Storage (FWES) Market Size Estimation Forecast, 2023-2033 (US$ Mn)
9.7.2 Global Flywheel Energy Storage (FWES) Market Forecast by Region, 2023-2033 (US$ Mn)
9.8 Other Energy Storage Technology
9.8.1 Global Other Energy Storage Technology Market Size Estimation Forecast, 2023-2033 (US$ Mn)
9.8.2 Global Other Energy Storage Technology Market Forecast by Region, 2023-2033 (US$ Mn)
10 Global Virtual Power Plant (VPP) Market Analysis by Region
10.1 Key Findings
10.2 Regional Market Size Estimation and Forecast
10.3 COVID-19 Impact Analysis: Recovery Scenarios (V, U, W, L)
11 North America Virtual Power Plant (VPP) Market Analysis
11.1 Key Findings
11.1.1 North America Virtual Power Plant (VPP) Market Attractiveness Index
11.1.2 North America Virtual Power Plant (VPP) Market Share by Region, 2023 & 2033
11.2 North America Virtual Power Plant (VPP) Market Size Estimation and Forecast by Country
11.3 North America Virtual Power Plant (VPP) Market Size Estimation and Forecast by Component
11.4 North America Virtual Power Plant (VPP) Market Size Estimation and Forecast by End-User
11.5 North America Virtual Power Plant (VPP) Market Size Estimation and Forecast by Information Communication Technology (ICT)
11.6 North America Virtual Power Plant (VPP) Market Size Estimation and Forecast by Energy Generation Technology
11.7 North America Virtual Power Plant (VPP) Market Size Estimation and Forecast by Energy Storage Technology
11.8 U.S. Market Analysis
11.9 Canada Market Analysis
12 Europe Virtual Power Plant (VPP) Market Analysis
12.1 Key Findings
12.1.1 Europe Virtual Power Plant (VPP) Market Attractiveness Index
12.1.2 Europe Virtual Power Plant (VPP) Market Share by Region, 2023 & 2033
12.2 Europe Virtual Power Plant (VPP) Market Size Estimation and Forecast by Country
12.3 Europe Virtual Power Plant (VPP) Market Size Estimation and Forecast by Component
12.4 Europe Virtual Power Plant (VPP) Market Size Estimation and Forecast by End-User
12.5 Europe Virtual Power Plant (VPP) Market Size Estimation and Forecast by Information Communication Technology (ICT)
12.6 Europe Virtual Power Plant (VPP) Market Size Estimation and Forecast by Energy Generation Technology
12.7 Europe Virtual Power Plant (VPP) Market Size Estimation and Forecast by Energy Storage Technology
12.8 Germany Market Analysis
12.9 UK Market Analysis
12.10 France Market Analysis
12.11 Italy Market Analysis
12.12 Spain Market Analysis
12.13 Rest of Europe Market Analysis
13 Asia-Pacific Virtual Power Plant (VPP) Market Analysis
13.1 Key Findings
13.1.1 Asia-Pacific Virtual Power Plant (VPP) Market Attractiveness Index
13.1.2 Asia-Pacific Virtual Power Plant (VPP) Market Share by Region, 2023 & 2033
13.2 Asia-Pacific Virtual Power Plant (VPP) Market Size Estimation and Forecast by Country
13.3 Asia-Pacific Virtual Power Plant (VPP) Market Size Estimation and Forecast by Component
13.4 Asia-Pacific Virtual Power Plant (VPP) Market Size Estimation and Forecast by End-User
13.5 Asia-Pacific Virtual Power Plant (VPP) Market Size Estimation and Forecast by Information Communication Technology (ICT)
13.6 Asia-Pacific Virtual Power Plant (VPP) Market Size Estimation and Forecast by Energy Generation Technology
13.7 Asia-Pacific Virtual Power Plant (VPP) Market Size Estimation and Forecast by Energy Storage Technology
13.8 China Market Analysis
13.9 India Market Analysis
13.10 Japan Market Analysis
13.11 South Korea Market Analysis
13.12 Australia Market Analysis
13.13 Rest of Asia-Pacific Market Analysis
14 Middle East & Africa Virtual Power Plant (VPP) Market Analysis
14.1 Key Findings
14.1.1 Middle East & Africa Virtual Power Plant (VPP) Market Attractiveness Index
14.1.2 Middle East & Africa Virtual Power Plant (VPP) Market Share by Region, 2023 & 2033
14.2 Middle East & Africa Virtual Power Plant (VPP) Market Size Estimation and Forecast by Country
14.3 Middle East & Africa Virtual Power Plant (VPP) Market Size Estimation and Forecast by Component
14.4 Middle East & Africa Virtual Power Plant (VPP) Market Size Estimation and Forecast by End-User
14.5 Middle East & Africa Virtual Power Plant (VPP) Market Size Estimation and Forecast by Information Communication Technology (ICT)
14.6 Middle East & Africa Virtual Power Plant (VPP) Market Size Estimation and Forecast by Energy Generation Technology
14.7 Middle East & Africa Virtual Power Plant (VPP) Market Size Estimation and Forecast by Energy Storage Technology
14.8 GCC Market Analysis
14.9 South Africa Market Analysis
14.10 Rest of Middle East & Africa Market Analysis
15 Latin America Virtual Power Plant (VPP) Market Analysis
15.1 Key Findings
15.1.1 Latin America Virtual Power Plant (VPP) Market Attractiveness Index
15.1.2 Latin America Virtual Power Plant (VPP) Market Share by Region, 2023 & 2033
15.2 Latin America Virtual Power Plant (VPP) Market Size Estimation and Forecast by Country
15.3 Latin America Virtual Power Plant (VPP) Market Size Estimation and Forecast by Component
15.4 Latin America Virtual Power Plant (VPP) Market Size Estimation and Forecast by End-User
15.5 Latin America Virtual Power Plant (VPP) Market Size Estimation and Forecast by Information Communication Technology (ICT)
15.6 Latin America Virtual Power Plant (VPP) Market Size Estimation and Forecast by Energy Generation Technology
15.7 Latin America Virtual Power Plant (VPP) Market Size Estimation and Forecast by Energy Storage Technology
15.8 Brazil Market Analysis
15.9 Mexico Market Analysis
15.10 Rest of Latin America Market Analysis
16 Company Profiles
16.1 General Electric Company
16.1.1 Company Snapshot
16.1.2 Company Overview
16.1.3 Financial Analysis
16.1.4 Product Benchmarking
16.1.5 Strategic Outlook
16.2 Toshiba Corporation
16.2.1 Company Snapshot
16.2.2 Company Overview
16.2.3 Financial Analysis
16.2.4 Product Benchmarking
16.2.5 Strategic Outlook
16.3 Enel S.P.A
16.3.1 Company Snapshot
16.3.2 Company Overview
16.3.3 Product Benchmarking
16.3.4 Strategic Outlook
16.4 Schneider Electric SE
16.4.1 Company Snapshot
16.4.2 Company Overview
16.4.3 Financial Analysis
16.4.4 Product Benchmarking
16.4.5 Strategic Outlook
16.5 ABB Ltd.
16.5.1 Company Snapshot
16.5.2 Company Overview
16.5.3 Financial Analysis
16.5.4 Product Benchmarking
16.5.5 Strategic Outlook
16.6 Hitachi, Ltd.
16.6.1 Company Snapshot
16.6.2 Company Overview
16.6.3 Financial Analysis
16.6.4 Product Benchmarking
16.6.5 Strategic Outlook
16.7 Siemens AG
16.7.1 Company Snapshot
16.7.2 Company Overview
16.7.3 Financial Analysis
16.7.4 Product Benchmarking
16.7.5 Strategic Outlook
16.8 Robert Bosch GmbH
16.8.1 Company Snapshot
16.8.2 Company Overview
16.8.3 Product Benchmarking
16.8.4 Strategic Outlook
16.9 Blue Pillar
16.9.1 Company Snapshot
16.9.2 Company Overview
16.9.3 Product Benchmarking
16.9.4 Strategic Outlook
16.10 International Business Machines Corporation
16.10.1 Company Snapshot
16.10.2 Company Overview
16.10.3 Financial Analysis
16.10.4 Product Benchmarking
16.10.5 Strategic Outlook
16.11 Cisco Systems, Inc
16.11.1 Company Snapshot
16.11.2 Company Overview
16.11.3 Financial Analysis
16.11.4 Product Benchmarking
16.11.5 Strategic Outlook
16.12 AGL Energy
16.12.1 Company Snapshot
16.12.2 Company Overview
16.12.3 Product Benchmarking
16.12.4 Strategic Outlook
16.13 Enernoc, Inc
16.13.1 Company Snapshot
16.13.2 Company Overview
16.13.3 Product Benchmarking
16.13.4 Strategic Outlook
16.14 Next Kraftwerke
16.14.1 Company Snapshot
16.14.2 Company Overview
16.14.3 Product Benchmarking
16.14.4 Strategic Outlook
16.15 AutoGrid
16.15.1 Company Snapshot
16.15.2 Company Overview
16.15.3 Product Benchmarking
16.15.4 Strategic Outlook
17 Conclusion and Recommendations
17.1 Concluding Remarks from Visiongain
17.2 Recommendations for Market Players
17.1 Improved incentives and regulatory measures can encourage widespread investment in virtual efficiency power plant initiatives.
17.2 Energy-efficiency champions can bridge the knowledge gap about new energy-saving technologies.
17.3 Credit and Lending Can Assist Small and Medium-Sized Businesses in Funding Energy-Efficient Initiatives
17.4 List of Other Notable Players
List of Tables
Table 1 Global Virtual Power Plant (VPP) Market Snapshot, 2023 & 2033 (US$ billion, CAGR %)
Table 2 Global Virtual Power Plant Market by Component, 2023-2033 (US$ Mn, AGR (%), CAGR (%))
Table 3 Global Energy Generation Technology Market Forecast, 2023-2033 (US$ Mn, AGR (%), CAGR (%))
Table 4 Global Energy Generation Technology Market by Region, 2023-2033 (US$ Mn, AGR (%), CAGR (%))
Table 5 Global Energy Storage Technologies Market Forecast, 2023-2033 (US$ Mn, AGR (%), CAGR (%))
Table 6 Global Energy Storage Technologies Market by Region, 2023-2033 (US$ Mn, AGR (%), CAGR (%))
Table 7 Global Information Communication Technology (ICT) Market Forecast, 2023-2033 (US$ Mn, AGR (%), CAGR (%))
Table 8 Global Information Communication Technology (ICT) Market by Region, 2023-2033 (US$ Mn, AGR (%), CAGR (%))
Table 9 Global Virtual Power Plant Market by End-User, 2023-2033 (US$ Mn, AGR (%), CAGR (%))
Table 10 Global Industrial VPP Market Forecast, 2023-2033 (US$ Mn, AGR (%), CAGR (%))
Table 11 Global Industrial VPP Market by Region, 2023-2033 (US$ Mn, AGR (%), CAGR (%))
Table 12 Global Commercial VPP Market Forecast, 2023-2033 (US$ Mn, AGR (%), CAGR (%))
Table 13 Global Commercial VPP Market by Region, 2023-2033 (US$ Mn, AGR (%), CAGR (%))
Table 14 Global Residential VPP Market Forecast, 2023-2033 (US$ Mn, AGR (%), CAGR (%))
Table 15 Global Residential VPP Market by Region, 2023-2033 (US$ Mn, AGR (%), CAGR (%))
Table 16 Global Other End-User Market Forecast, 2023-2033 (US$ Mn, AGR (%), CAGR (%))
Table 17 Global Other End-User Market by Region, 2023-2033 (US$ Mn, AGR (%), CAGR (%))
Table 18 Global Virtual Power Plant Market by Information Communication Technology (ICT), 2023-2033 (US$ Mn, AGR (%), CAGR (%))
Table 19 Global Energy Management Systems (EMS) Market Forecast, 2023-2033 (US$ Mn, AGR (%), CAGR (%))
Table 20 Global Energy Management Systems (EMS) Market by Region, 2023-2033 (US$ Mn, AGR (%), CAGR (%))
Table 21 Global Supervisory Control and Data Acquisition (SCADA) Market Forecast, 2023-2033 (US$ Mn, AGR (%), CAGR (%))
Table 22 Global Supervisory Control and Data Acquisition (SCADA) Market by Region, 2023-2033 (US$ Mn, AGR (%), CAGR (%))
Table 23 Global Distribution Management System (DMS) Market Forecast, 2023-2033 (US$ Mn, AGR (%), CAGR (%))
Table 24 Global Distribution Management System (DMS) Market by Region, 2023-2033 (US$ Mn, AGR (%), CAGR (%))
Table 25 Global Smart Meters Market Forecast, 2023-2033 (US$ Mn, AGR (%), CAGR (%))
Table 26 Global Smart Meters Market by Region, 2023-2033 (US$ Mn, AGR (%), CAGR (%))
Table 27 Global Other Information Communication Technology (ICT) Market Forecast, 2023-2033 (US$ Mn, AGR (%), CAGR (%))
Table 28 Global Other Information Communication Technology (ICT) Market by Region, 2023-2033 (US$ Mn, AGR (%), CAGR (%))
Table 29 Global Virtual Power Plant Market by Energy Generation Technology, 2023-2033 (US$ Mn, AGR (%), CAGR (%))
Table 30 Global Wind Based Energy Generation Market Forecast, 2023-2033 (US$ Mn, AGR (%), CAGR (%))
Table 31 Global Wind Based Energy Generation Market by Region, 2023-2033 (US$ Mn, AGR (%), CAGR (%))
Table 32 Global Small Hydro-Plants Market Forecast, 2023-2033 (US$ Mn, AGR (%), CAGR (%))
Table 33 Global Small Hydro-Plants Market by Region, 2023-2033 (US$ Mn, AGR (%), CAGR (%))
Table 34 Global Solar Production Market Forecast, 2023-2033 (US$ Mn, AGR (%), CAGR (%))
Table 35 Global Solar Production Market by Region, 2023-2033 (US$ Mn, AGR (%), CAGR (%))
Table 36 Global Combined Heat and Power (CHP) Market Forecast, 2023-2033 (US$ Mn, AGR (%), CAGR (%))
Table 37 Global Combined Heat and Power (CHP) Market by Region, 2023-2033 (US$ Mn, AGR (%), CAGR (%))
Table 38 Global Small Power Plants Market Forecast, 2023-2033 (US$ Mn, AGR (%), CAGR (%))
Table 39 Global Small Power Plants Market by Region, 2023-2033 (US$ Mn, AGR (%), CAGR (%))
Table 40 Global Other Energy Generation Technology Market Forecast, 2023-2033 (US$ Mn, AGR (%), CAGR (%))
Table 41 Global Other Energy Generation Technology Market by Region, 2023-2033 (US$ Mn, AGR (%), CAGR (%))
Table 42 Global Virtual Power Plant Market by Energy Storage Technology, 2023-2033 (US$ Mn, AGR (%), CAGR (%))
Table 43 Global Battery Energy Storage System (BESS) Market Forecast, 2023-2033 (US$ Mn, AGR (%), CAGR (%))
Table 44 Global Battery Energy Storage System (BESS) Market by Region, 2023-2033 (US$ Mn, AGR (%), CAGR (%))
Table 45 Global Supercapacitor Energy Storage (SCES) Market Forecast, 2023-2033 (US$ Mn, AGR (%), CAGR (%))
Table 46 Global Supercapacitor Energy Storage (SCES) Market by Region, 2023-2033 (US$ Mn, AGR (%), CAGR (%))
Table 47 Global Super Conductor Magnetic Energy Storage (SMES) Market Forecast, 2023-2033 (US$ Mn, AGR (%), CAGR (%))
Table 48 Global Super Conductor Magnetic Energy Storage (SMES) Market by Region, 2023-2033 (US$ Mn, AGR (%), CAGR (%))
Table 49 Global Hydraulic Pumped Energy Storage (HPES) Market Forecast, 2023-2033 (US$ Mn, AGR (%), CAGR (%))
Table 50 Global Hydraulic Pumped Energy Storage (HPES) Market by Region, 2023-2033 (US$ Mn, AGR (%), CAGR (%))
Table 51 Global Flywheel Energy Storage (FWES) Market Forecast, 2023-2033 (US$ Mn, AGR (%), CAGR (%))
Table 52 Global Flywheel Energy Storage (FWES) Market by Region, 2023-2033 (US$ Mn, AGR (%), CAGR (%))
Table 53 Global Other Energy Storage Technology Market Forecast, 2023-2033 (US$ Mn, AGR (%), CAGR (%))
Table 54 Global Other Energy Storage Technology Market by Region, 2023-2033 (US$ Mn, AGR (%), CAGR (%))
Table 55 Global Virtual Power Plant Market by Region, 2023-2033 (US$ Mn, AGR (%), CAGR (%))
Table 56 Global Virtual Power Plant Market Forecast, 2023-2033 (US$ Mn, AGR (%), CAGR (%)) (V-Shaped Recovery Scenario)
Table 57 Global Virtual Power Plant Market by Region, 2023-2033 (US$ Mn, AGR (%), CAGR (%)) (V-Shaped Recovery Scenario)
Table 58 Global Virtual Power Plant Market Forecast, 2023-2033 (US$ Mn, AGR (%), CAGR (%)) (U-Shaped Recovery Scenario)
Table 59 Global Virtual Power Plant Market by Region, 2023-2033 (US$ Mn, AGR (%), CAGR (%)) (U-Shaped Recovery Scenario)
Table 60 Global Virtual Power Plant Market Forecast, 2023-2033 (US$ Mn, AGR (%), CAGR (%)) (W-Shaped Recovery Scenario)
Table 61 Global Virtual Power Plant Market by Region, 2023-2033 (US$ Mn, AGR (%), CAGR (%)) (W-Shaped Recovery Scenario)
Table 62 Global Virtual Power Plant Market Forecast, 2023-2033 (US$ Mn, AGR (%), CAGR (%)) (L-Shaped Recovery Scenario)
Table 63 Global Virtual Power Plant Market by Region, 2023-2033 (US$ Mn, AGR (%), CAGR (%)) (L-Shaped Recovery Scenario)
Table 64 North America Virtual Power Plant Market by Country, 2023-2033 (US$ Mn, AGR (%), CAGR (%))
Table 65 North America Virtual Power Plant Market by Component, 2023-2033 (US$ Mn, AGR (%), CAGR (%))
Table 66 North America Virtual Power Plant Market by End-User, 2023-2033 (US$ Mn, AGR (%), CAGR (%))
Table 67 North America Virtual Power Plant Market by Information Communication Technology (ICT), 2023-2033 (US$ Mn, AGR (%), CAGR (%))
Table 68 North America Virtual Power Plant Market by Energy Generation Technology, 2023-2033 (US$ Mn, AGR (%), CAGR (%))
Table 69 North America Virtual Power Plant Market by Energy Storage Technology, 2023-2033 (US$ Mn, AGR (%), CAGR (%))
Table 70 US Virtual Power Plant Market by Value, 2023-2033 (US$ Mn, AGR (%), CAGR (%))
Table 71 Canada Virtual Power Plant Market by Value, 2023-2033 (US$ Mn, AGR (%), CAGR (%))
Table 72 Europe Virtual Power Plant Market by Country, 2023-2033 (US$ Mn, AGR (%), CAGR (%))
Table 73 Europe Virtual Power Plant Market by Component, 2023-2033 (US$ Mn, AGR (%), CAGR (%))
Table 74 Europe Virtual Power Plant Market by End-User, 2023-2033 (US$ Mn, AGR (%), CAGR (%))
Table 75 Europe Virtual Power Plant Market by Information Communication Technology (ICT), 2023-2033 (US$ Mn, AGR (%), CAGR (%))
Table 76 Europe Virtual Power Plant Market by Energy Generation Technology, 2023-2033 (US$ Mn, AGR (%), CAGR (%))
Table 77 Europe Virtual Power Plant Market by Energy Storage Technology, 2023-2033 (US$ Mn, AGR (%), CAGR (%))
Table 78 Germany Virtual Power Plant Market by Value, 2023-2033 (US$ Mn, AGR (%), CAGR (%))
Table 79 UK Virtual Power Plant Market by Value, 2023-2033 (US$ Mn, AGR (%), CAGR (%))
Table 80 France Virtual Power Plant Market by Value, 2023-2033 (US$ Mn, AGR (%), CAGR (%))
Table 81 Italy Virtual Power Plant Market by Value, 2023-2033 (US$ Mn, AGR (%), CAGR (%))
Table 82 Spain Virtual Power Plant Market by Value, 2023-2033 (US$ Mn, AGR (%), CAGR (%))
Table 83 Rest of Europe Virtual Power Plant Market by Value, 2023-2033 (US$ Mn, AGR (%), CAGR (%))
Table 84 Asia-Pacific Virtual Power Plant Market by Country, 2023-2033 (US$ Mn, AGR (%), CAGR (%))
Table 85 Asia-Pacific Virtual Power Plant Market by Component, 2023-2033 (US$ Mn, AGR (%), CAGR (%))
Table 86 Asia-Pacific Virtual Power Plant Market by End-User, 2023-2033 (US$ Mn, AGR (%), CAGR (%))
Table 87 Asia-Pacific Virtual Power Plant Market by Information Communication Technology (ICT), 2023-2033 (US$ Mn, AGR (%), CAGR (%))
Table 88 Asia-Pacific Virtual Power Plant Market by Energy Generation Technology, 2023-2033 (US$ Mn, AGR (%), CAGR (%))
Table 89 Asia-Pacific Virtual Power Plant Market by Energy Storage Technology, 2023-2033 (US$ Mn, AGR (%), CAGR (%))
Table 90 China Virtual Power Plant Market by Value, 2023-2033 (US$ Mn, AGR (%), CAGR (%))
Table 91 India Virtual Power Plant Market by Value, 2023-2033 (US$ Mn, AGR (%), CAGR (%))
Table 92 Japan Virtual Power Plant Market by Value, 2023-2033 (US$ Mn, AGR (%), CAGR (%))
Table 93 South Korea Virtual Power Plant Market by Value, 2023-2033 (US$ Mn, AGR (%), CAGR (%))
Table 94 Australia Virtual Power Plant Market by Value, 2023-2033 (US$ Mn, AGR (%), CAGR (%))
Table 95 Rest of Asia-Pacific Virtual Power Plant Market by Value, 2023-2033 (US$ Mn, AGR (%), CAGR (%))
Table 96 Middle East & Africa Virtual Power Plant Market by Country, 2023-2033 (US$ Mn, AGR (%), CAGR (%))
Table 97 Middle East & Africa Virtual Power Plant Market by Component, 2023-2033 (US$ Mn, AGR (%), CAGR (%))
Table 98 Middle East & Africa Virtual Power Plant Market by End-User, 2023-2033 (US$ Mn, AGR (%), CAGR (%))
Table 99 Middle East & Africa Virtual Power Plant Market by Information Communication Technology (ICT), 2023-2033 (US$ Mn, AGR (%), CAGR (%))
Table 100 Middle East & Africa Virtual Power Plant Market by Energy Generation Technology, 2023-2033 (US$ Mn, AGR (%), CAGR (%))
Table 101 Middle East & Africa Virtual Power Plant Market by Energy Storage Technology, 2023-2033 (US$ Mn, AGR (%), CAGR (%))
Table 102 GCC Virtual Power Plant Market by Value, 2023-2033 (US$ Mn, AGR (%), CAGR (%))
Table 103 South Africa Virtual Power Plant Market by Value, 2023-2033 (US$ Mn, AGR (%), CAGR (%))
Table 104 Rest of Middle East & Africa Virtual Power Plant Market by Value, 2023-2033 (US$ Mn, AGR (%), CAGR (%))
Table 105 North America Virtual Power Plant Market by Country, 2023-2033 (US$ Mn, AGR (%), CAGR (%))
Table 106 North America Virtual Power Plant Market by Component, 2023-2033 (US$ Mn, AGR (%), CAGR (%))
Table 107 North America Virtual Power Plant Market by End-User, 2023-2033 (US$ Mn, AGR (%), CAGR (%))
Table 108 North America Virtual Power Plant Market by Information Communication Technology (ICT), 2023-2033 (US$ Mn, AGR (%), CAGR (%))
Table 109 North America Virtual Power Plant Market by Energy Generation Technology, 2023-2033 (US$ Mn, AGR (%), CAGR (%))
Table 110 North America Virtual Power Plant Market by Energy Storage Technology, 2023-2033 (US$ Mn, AGR (%), CAGR (%))
Table 111 Brazil Virtual Power Plant Market by Value, 2023-2033 (US$ Mn, AGR (%), CAGR (%))
Table 112 Mexico Virtual Power Plant Market by Value, 2023-2033 (US$ Mn, AGR (%), CAGR (%))
Table 113 Rest of Latin America Virtual Power Plant Market by Value, 2023-2033 (US$ Mn, AGR (%), CAGR (%))
Table 114 General Electric: Key Details, (CEO, HQ, Revenue, Founded, No. of Employees, Company Type, Website, Business Segment)
Table 115 General Electric: Product Benchmarking
Table 116 General Electric: Strategic Outlook
Table 117 Toshiba Corporation: Key Details, (CEO, HQ, Revenue, Founded, No. of Employees, Company Type, Website, Business Segment)
Table 118 Toshiba Corporation: Product Benchmarking
Table 119 Toshiba Corporation: Strategic Outlook
Table 120 Enel S.P.A:: Key Details, (CEO, HQ, Revenue, Founded, No. of Employees, Company Type, Website, Business Segment)
Table 121 Enel S.P.A: Product Benchmarking
Table 122 Enel S.P.A: Strategic Outlook
Table 123 Schneider Electric SE: Key Details, (CEO, HQ, Revenue, Founded, No. of Employees, Company Type, Website, Business Segment)
Table 124 Schneider Electric SE: Product Benchmarking
Table 125 Schneider Electric SE: Strategic Outlook
Table 126 ABB Ltd: Key Details, (CEO, HQ, Revenue, Founded, No. of Employees, Company Type, Website, Business Segment)
Table 127 ABB Ltd: Product Benchmarking
Table 128 ABB Ltd: Strategic Outlook
Table 129 Hitachi Ltd: Key Details, (CEO, HQ, Revenue, Founded, No. of Employees, Company Type, Website, Business Segment)
Table 130 Hitachi Ltd: Product Benchmarking
Table 131 Hitachi Ltd: Strategic Outlook
Table 132 Siemens AG: Key Details, (CEO, HQ, Revenue, Founded, No. of Employees, Company Type, Website, Business Segment)
Table 133 Siemens AG: Product Benchmarking
Table 134 Siemens AG: Strategic Outlook
Table 135 Robert Bosch GmbH: Key Details, (CEO, HQ, Revenue, Founded, No. of Employees, Company Type, Website, Business Segment)
Table 136 Robert Bosch GmbH: Product Benchmarking
Table 137 Robert Bosch GmbH: Strategic Outlook
Table 138 Blue Pillar: Key Details, (CEO, HQ, Revenue, Founded, No. of Employees, Company Type, Website, Business Segment)
Table 139 Blue Pillar: Product Benchmarking
Table 140 Blue Pillar: Strategic Outlook
Table 141 International Business Machines Corporation: Key Details, (CEO, HQ, Revenue, Founded, No. of Employees, Company Type, Website, Business Segment)
Table 142 International Business Machines Corporation: Product Benchmarking
Table 143 International Business Machines Corporation: Strategic Outlook
Table 144 Cisco Systems, Inc: Key Details, (CEO, HQ, Revenue, Founded, No. of Employees, Company Type, Website, Business Segment)
Table 145 Cisco Systems, Inc: Product Benchmarking
Table 146 Cisco Systems, Inc: Strategic Outlook
Table 147 AGL Energy: Key Details, (CEO, HQ, Revenue, Founded, No. of Employees, Company Type, Website, Business Segment)
Table 148 AGL Energy: Product Benchmarking
Table 149 AGL Energy: Strategic Outlook
Table 150 Enernoc, Inc: Key Details, (CEO, HQ, Revenue, Founded, No. of Employees, Company Type, Website, Business Segment)
Table 151 Enernoc, Inc: Product Benchmarking
Table 152 Enernoc, Inc: Strategic Outlook
Table 153 Next Kraftwerke: Key Details, (CEO, HQ, Revenue, Founded, No. of Employees, Company Type, Website, Business Segment)
Table 154 Next Kraftwerke: Product Benchmarking
Table 155 Next Kraftwerke: Strategic Outlook
Table 156 AutoGrid: Key Details, (CEO, HQ, Revenue, Founded, No. of Employees, Company Type, Website, Business Segment)
Table 157 AutoGrid: Product Benchmarking
Table 158 AutoGrid: Strategic Outlook
List of Figures
Figure 1 Global Virtual Power Plant (VPP) Market Segmentation
Figure 2 Breakdown of Primary Interviews: By Company Type, Designation, & Region
Figure 3 Global Virtual Power Plant (VPP) Market Forecast by Region: Market Attractiveness Index
Figure 4 Global Virtual Power Plant (VPP) Market by Component: Market Attractiveness Index
Figure 5 Global Virtual Power Plant (VPP) Market by End-User: Market Attractiveness Index
Figure 6 Global Virtual Power Plant (VPP) Market by Information Communication Technology: Market Attractiveness Index
Figure 7 Global Virtual Power Plant (VPP) Market by Energy Generation Technology: Market Attractiveness Index
Figure 8 Global Virtual Power Plant (VPP) Market by Energy Storage Technology: Market Attractiveness Index
Figure 9 Global Virtual Power Plant (VPP) Market: Market Dynamics
Figure 10 Global Virtual Power Plant (VPP) Market: Porter’s Five Forces Analysis
Figure 11 Global Virtual Power Plant (VPP) Market: PESTLE Analysis
Figure 12 Global Virtual Power Plant (VPP) Market Forecast by Component 2023, 2033 (Revenue, CAGR%)
Figure 13 Global Virtual Power Plant (VPP) Market Forecast by Component,2023, 2033 (Revenue, CAGR%)
Figure 14 Global Virtual Power Plant Market by Component, 2023-2033 (US$ Mn, AGR (%)
Figure 15 Global Energy Generation Technology Market Forecast, 2023-2033 (US$ Mn, AGR (%))
Figure 16 Global Energy Generation Technology Market by Region, 2023-2033 (US$ Mn, AGR (%))
Figure 17 Global Energy Storage Technologies Market Forecast, 2023-2033 (US$ Mn, AGR (%))
Figure 18 Global Energy Storage Technologies Market by Region, 2023-2033 (US$ Mn, AGR (%))
Figure 19 Global Information Communication Technology (ICT) Market Forecast, 2023-2033 (US$ Mn, AGR (%))
Figure 20 Global Information Communication Technology (ICT) Market by Region, 2023-2033 (US$ Mn, AGR (%))
Figure 21 Global Virtual Power Plant (VPP) Market Forecast by End-User 2023, 2033 (Revenue, CAGR%)
Figure 22 Global Virtual Power Plant (VPP) Market Forecast by Component,2023, 2033 (Revenue, CAGR%)
Figure 23 Global Virtual Power Plant Market by End-User, 2023-2033 (US$ Mn, AGR (%))
Figure 24 Global Industrial VPP Market Forecast, 2023-2033 (US$ Mn, AGR (%))
Figure 25 Global Industrial VPP Market by Region, 2023-2033 (US$ Mn, AGR (%))
Figure 26 Global Commercial VPP Market Forecast, 2023-2033 (US$ Mn, AGR (%))
Figure 27 Global Commercial VPP Market by Region, 2023-2033 (US$ Mn, AGR (%))
Figure 28 Global Residential VPP Market Forecast, 2023-2033 (US$ Mn, AGR (%))
Figure 29 Global Residential VPP Market by Region, 2023-2033 (US$ Mn, AGR (%))
Figure 30 Global Other End-User Market Forecast, 2023-2033 (US$ Mn, AGR (%))
Figure 31 Global Other End-User Market by Region, 2023-2033 (US$ Mn, AGR (%))
Figure 32 Global Virtual Power Plant (VPP) Market Forecast by End-User 2023, 2033 (Revenue, CAGR%)
Figure 33 Global Virtual Power Plant (VPP) Market Forecast by Component,2023, 2033 (Revenue, CAGR%)
Figure 34 Global Virtual Power Plant Market by Information Communication Technology (ICT), 2023-2033 (US$ Mn, AGR (%))
Figure 35 Global Energy Management Systems (EMS) Market Forecast, 2023-2033 (US$ Mn, AGR (%))
Figure 36 Global Energy Management Systems (EMS) Market by Region, 2023-2033 (US$ Mn, AGR (%))
Figure 37 Global Supervisory Control and Data Acquisition (SCADA) Market Forecast, 2023-2033 (US$ Mn, AGR (%))
Figure 38 Global Supervisory Control and Data Acquisition (SCADA) Market by Region, 2023-2033 (US$ Mn, AGR (%))
Figure 39 Global Distribution Management System (DMS) Market Forecast, 2023-2033 (US$ Mn, AGR (%)
Figure 40 Global Distribution Management System (DMS) Market by Region, 2023-2033 (US$ Mn, AGR (%))
Figure 41 Global Smart Meters Market Forecast, 2023-2033 (US$ Mn, AGR (%))
Figure 42 Global Smart Meters Market by Region, 2023-2033 (US$ Mn, AGR (%))
Figure 43 Global Other Information Communication Technology (ICT) Market Forecast, 2023-2033 (US$ Mn, AGR (%))
Figure 44 Global Other Information Communication Technology (ICT) Market by Region, 2023-2033 (US$ Mn, AGR (%))
Figure 45 Global Virtual Power Plant (VPP) Market Forecast by Energy Generation Technology2023, 2033 (Revenue, CAGR%)
Figure 46 Global Virtual Power Plant (VPP) Market Forecast by Energy Generation Technology,2023, 2033 (Revenue, CAGR%)
Figure 47 Global Virtual Power Plant Market by Energy Generation Technology, 2023-2033 (US$ Mn, AGR (%))
Figure 48 Global Wind Based Energy Generation Market Forecast, 2023-2033 (US$ Mn, AGR (%))
Figure 49 Global Wind Based Energy Generation Market by Region, 2023-2033 (US$ Mn, AGR (%))
Figure 50 Global Small Hydro-Plants Market Forecast, 2023-2033 (US$ Mn, AGR (%))
Figure 51 Global Small Hydro-Plants Market by Region, 2023-2033 (US$ Mn, AGR (%))
Figure 52 Global Solar Production Market Forecast, 2023-2033 (US$ Mn, AGR (%))
Figure 53 Global Solar Production Market by Region, 2023-2033 (US$ Mn, AGR (%))
Figure 54 Global Combined Heat and Power (CHP) Market Forecast, 2023-2033 (US$ Mn, AGR (%))
Figure 55 Global Combined Heat and Power (CHP) Market by Region, 2023-2033 (US$ Mn, AGR (%))
Figure 1 Global Small Power Plants Market Forecast, 2023-2033 (US$ Mn, AGR (%), (%))
Figure 56 Global Small Power Plants Market by Region, 2023-2033 (US$ Mn, AGR (%))
Figure 57 Global Other Energy Generation Technology Market Forecast, 2023-2033 (US$ Mn, AGR (%))
Figure 58 Global Other Energy Generation Technology Market by Region, 2023-2033 (US$ Mn, AGR (%))
Figure 59 Global Virtual Power Plant (VPP) Market Forecast by Energy Storage Technology ,2023, 2033 (Revenue, CAGR%)
Figure 60 Global Virtual Power Plant (VPP) Market Forecast by Energy Storage Technology,2023, 2033 (Revenue, CAGR%)
Figure 61 Global Virtual Power Plant Market by Energy Storage Technology, 2023-2033 (US$ Mn, AGR (%))
Figure 62 Global Battery Energy Storage System (BESS) Market Forecast, 2023-2033 (US$ Mn, AGR (%))
Figure 63 Global Battery Energy Storage System (BESS) Market by Region, 2023-2033 (US$ Mn, AGR (%))
Figure 64 Global Supercapacitor Energy Storage (SCES) Market Forecast, 2023-2033 (US$ Mn, AGR (%))
Figure 65 Global Supercapacitor Energy Storage (SCES) Market by Region, 2023-2033 (US$ Mn, AGR (%))
Figure 66 Global Super Conductor Magnetic Energy Storage (SMES) Market Forecast, 2023-2033 (US$ Mn, AGR (%))
Figure 67 Global Super Conductor Magnetic Energy Storage (SMES) Market by Region, 2023-2033 (US$ Mn, AGR (%))
Figure 68 Global Hydraulic Pumped Energy Storage (HPES) Market Forecast, 2023-2033 (US$ Mn, AGR (%))
Figure 69 Global Hydraulic Pumped Energy Storage (HPES) Market by Region, 2023-2033 (US$ Mn, AGR (%))
Figure 70 Global Flywheel Energy Storage (FWES) Market Forecast, 2023-2033 (US$ Mn, AGR (%))
Figure 71 Global Flywheel Energy Storage (FWES) Market by Region, 2023-2033 (US$ Mn, AGR (%))
Figure 72 Global Other Energy Storage Technology Market Forecast, 2023-2033 (US$ Mn, AGR (%))
Figure 73 Global Other Energy Storage Technology Market by Region, 2023-2033 (US$ Mn, AGR (%))
Figure 74 Global Virtual Power Plant Market by Region, 2023-2033 (US$ Mn, AGR (%))
Figure 75 Global Virtual Power Plant Market Forecast, 2023-2033 (US$ Mn, AGR (%)), (V-Shaped Recovery Scenario)
Figure 76 Global Virtual Power Plant Market by Region, 2023-2033 (US$ Mn, AGR (%)) (V-Shaped Recovery Scenario)
Figure 77 Global Virtual Power Plant Market Forecast, 2023-2033 (US$ Mn, AGR (%)) (U-Shaped Recovery Scenario)
Figure 78 Global Virtual Power Plant Market by Region, 2023-2033 (US$ Mn, AGR (%)) (U-Shaped Recovery Scenario)
Figure 79 Global Virtual Power Plant Market Forecast, 2023-2033 (US$ Mn, AGR (%)) (W-Shaped Recovery Scenario)
Figure 80 Global Virtual Power Plant Market by Region, 2023-2033 (US$ Mn, AGR (%)) (W-Shaped Recovery Scenario)
Figure 81 Global Virtual Power Plant Market Forecast, 2023-2033 (US$ Mn, AGR (%)) (L-Shaped Recovery Scenario)
Figure 82 Global Virtual Power Plant Market by Region, 2023-2033 (US$ Mn, AGR (%)) (L-Shaped Recovery Scenario)
Figure 83 North America Virtual Power Plant (VPP) Market Attractiveness Index
Figure 84 North America Virtual Power Plant (VPP) Market Share Forecast 2023, 2033 (%)
Figure 85 North America Virtual Power Plant Market by Country, 2023-2033 (US$ Mn, AGR (%))
Figure 86 North America Virtual Power Plant Market by Component, 2023-2033 (US$ Mn, AGR (%))
Figure 87 North America Virtual Power Plant Market Share Forecast by Component, 2023 & 2033 (%)
Figure 88 North America Virtual Power Plant Market by End-User, 2023-2033 (US$ Mn, AGR (%))
Figure 89 North America Virtual Power Plant Market Share Forecast by End-User, 2023 & 2033 (%)
Figure 90 North America Virtual Power Plant Market by Information Communication Technology (ICT), 2023-2033 (US$ Mn, AGR (%))
Figure 91 North America Virtual Power Plant Market Share Forecast Information Communication Technology (ICT),2023 & 2033 (%)
Figure 92 North America Virtual Power Plant Market by Energy Generation Technology, 2023-2033 (US$ Mn, AGR (%))
Figure 93 North America Virtual Power Plant Market Share Forecast Energy Generation Technology ,2023 & 2033 (%)
Figure 94 North America Virtual Power Plant Market by Energy Storage Technology, 2023-2033 (US$ Mn, AGR (%))
Figure 95 North America Virtual Power Plant Market Share Forecast Energy Storage Technology ,2023 & 2033 (%)
Figure 96 US Virtual Power Plant Market by Value, 2023-2033 (US$ Mn, AGR (%))
Figure 97 Canada Virtual Power Plant Market by Value, 2023-2033 (US$ Mn, AGR (%))
Figure 98 Europe Virtual Power Plant (VPP) Market Attractiveness Index
Figure 99 Europe Virtual Power Plant (VPP) Market Share Forecast 2023, 2033 (%)
Figure 100 Europe Virtual Power Plant Market by Country, 2023-2033 (US$ Mn, AGR (%))
Figure 101 Europe Virtual Power Plant Market by Component, 2023-2033 (US$ Mn, AGR (%))
Figure 102 Europe Virtual Power Plant Market Share Forecast by Component, 2023 & 2033 (%)
Figure 103 Europe Virtual Power Plant Market by End-User, 2023-2033 (US$ Mn, AGR (%))
Figure 104 Europe Virtual Power Plant Market Share Forecast by End-User, 2023 & 2033 (%)
Figure 105 Europe Virtual Power Plant Market by Information Communication Technology (ICT), 2023-2033 (US$ Mn, AGR (%))
Figure 106 Europe Virtual Power Plant Market Share Forecast Information Communication Technology (ICT),2023 & 2033 (%)
Figure 107 Europe Virtual Power Plant Market by Energy Generation Technology, 2023-2033 (US$ Mn, AGR (%))
Figure 108 Europe Virtual Power Plant Market Share Forecast Energy Generation Technology ,2023 & 2033 (%)
Figure 109 Europe Virtual Power Plant Market by Energy Storage Technology, 2023-2033 (US$ Mn, AGR (%))
Figure 110 Europe Virtual Power Plant Market Share Forecast Energy Storage Technology ,2023 & 2033 (%)
Figure 111 Germany Virtual Power Plant Market by Value, 2023-2033 (US$ Mn, AGR (%))
Figure 112 UK Virtual Power Plant Market by Value, 2023-2033 (US$ Mn, AGR (%))
Figure 113 France Virtual Power Plant Market by Value, 2023-2033 (US$ Mn, AGR (%))
Figure 114 Italy Virtual Power Plant Market by Value, 2023-2033 (US$ Mn, AGR (%))
Figure 115 Spain Virtual Power Plant Market by Value, 2023-2033 (US$ Mn, AGR (%))
Figure 116 Rest of Europe Virtual Power Plant Market by Value, 2023-2033 (US$ Mn, AGR (%))
Figure 117 Asia-Pacific Virtual Power Plant (VPP) Market Attractiveness Index
Figure 118 Asia-Pacific Virtual Power Plant (VPP) Market Share Forecast 2023, 2033 (%)
Figure 119 Asia-Pacific Virtual Power Plant Market by Country, 2023-2033 (US$ Mn, AGR (%))
Figure 120 Asia-Pacific Virtual Power Plant Market by Component, 2023-2033 (US$ Mn, AGR (%))
Figure 121 Asia-Pacific Virtual Power Plant Market Share Forecast by Component, 2023 & 2033 (%)
Figure 122 Asia-Pacific Virtual Power Plant Market by End-User, 2023-2033 (US$ Mn, AGR (%))
Figure 123 Asia-Pacific Virtual Power Plant Market Share Forecast by End-User, 2023 & 2033 (%)
Figure 124 Asia-Pacific Virtual Power Plant Market by Information Communication Technology (ICT), 2023-2033 (US$ Mn, AGR (%))
Figure 125 Asia-Pacific Virtual Power Plant Market Share Forecast Information Communication Technology (ICT),2023 & 2033 (%)
Figure 126 Asia-Pacific Virtual Power Plant Market by Energy Generation Technology, 2023-2033 (US$ Mn, AGR (%))
Figure 127 Asia-Pacific Virtual Power Plant Market Share Forecast Energy Generation Technology ,2023 & 2033 (%)
Figure 128 Asia-Pacific Virtual Power Plant Market by Energy Storage Technology, 2023-2033 (US$ Mn, AGR (%))
Figure 129 Asia-Pacific Virtual Power Plant Market Share Forecast Energy Storage Technology ,2023 & 2033 (%)
Figure 130 China Virtual Power Plant Market by Value, 2023-2033 (US$ Mn, AGR (%))
Figure 131 India Virtual Power Plant Market by Value, 2023-2033 (US$ Mn, AGR (%))
Figure 132 Japan Virtual Power Plant Market by Value, 2023-2033 (US$ Mn, AGR (%))
Figure 133 South Korea Virtual Power Plant Market by Value, 2023-2033 (US$ Mn, AGR (%))
Figure 134 Australia Virtual Power Plant Market by Value, 2023-2033 (US$ Mn, AGR (%))
Figure 135 Rest of Asia-Pacific Virtual Power Plant Market by Value, 2023-2033 (US$ Mn, AGR (%))
Figure 136 Middle East & Africa Virtual Power Plant (VPP) Market Attractiveness Index
Figure 137 Middle East & Africa Virtual Power Plant (VPP) Market Share Forecast 2023, 2033 (%)
Figure 138 Middle East & Africa Virtual Power Plant Market by Country, 2023-2033 (US$ Mn, AGR (%))
Figure 139 Middle East & Africa Virtual Power Plant Market by Component, 2023-2033 (US$ Mn, AGR (%))
Figure 140 Middle East & Africa Virtual Power Plant Market Share Forecast by Component, 2023 & 2033 (%)
Figure 141 Middle East & Africa Virtual Power Plant Market by End-User, 2023-2033 (US$ Mn, AGR (%))
Figure 142 Middle East & Africa Virtual Power Plant Market Share Forecast by End-User, 2023 & 2033 (%)
Figure 143 Middle East & Africa Virtual Power Plant Market by Information Communication Technology (ICT), 2023-2033 (US$ Mn, AGR (%))
Figure 144 Middle East & Africa Virtual Power Plant Market Share Forecast Information Communication Technology (ICT),2023 & 2033 (%)
Figure 145 Middle East & Africa Virtual Power Plant Market by Energy Generation Technology, 2023-2033 (US$ Mn, AGR (%))
Figure 146 Middle East & Africa Virtual Power Plant Market Share Forecast Energy Generation Technology ,2023 & 2033 (%)
Figure 147 Middle East & Africa Virtual Power Plant Market by Energy Storage Technology, 2023-2033 (US$ Mn, AGR (%))
Figure 148 Middle East & Africa Virtual Power Plant Market Share Forecast Energy Storage Technology ,2023 & 2033 (%)
Figure 149 GCC Virtual Power Plant Market by Value, 2023-2033 (US$ Mn, AGR (%))
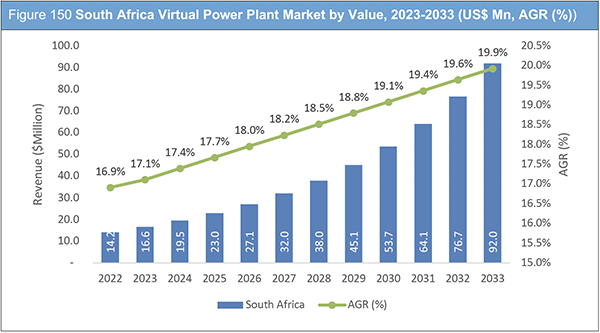
Figure 150 South Africa Virtual Power Plant Market by Value, 2023-2033 (US$ Mn, AGR (%))
Figure 151 Rest of Middle East & Africa Virtual Power Plant Market by Value, 2023-2033 (US$ Mn, AGR (%))
Figure 152 Latin America Virtual Power Plant (VPP) Market Attractiveness Index
Figure 153 Latin America Virtual Power Plant (VPP) Market Share Forecast 2023, 2033 (%)
Figure 154 North America Virtual Power Plant Market by Country, 2023-2033 (US$ Mn, AGR (%))
Figure 155 North America Virtual Power Plant Market by Component, 2023-2033 (US$ Mn, AGR (%))
Figure 156 Latin America Virtual Power Plant Market Share Forecast by Component, 2023 & 2033 (%)
Figure 157 North America Virtual Power Plant Market by End-User, 2023-2033 (US$ Mn, AGR (%))
Figure 158 Latin America Virtual Power Plant Market Share Forecast by End-User, 2023 & 2033 (%)
Figure 159 North America Virtual Power Plant Market by Information Communication Technology (ICT), 2023-2033 (US$ Mn, AGR (%))
Figure 160 Latin America Virtual Power Plant Market Share Forecast Information Communication Technology (ICT),2023 & 2033 (%)
Figure 161 North America Virtual Power Plant Market by Energy Generation Technology, 2023-2033 (US$ Mn, AGR (%))
Figure 162 Latin America Virtual Power Plant Market Share Forecast Energy Generation Technology ,2023 & 2033 (%)
Figure 163 North America Virtual Power Plant Market by Energy Storage Technology, 2023-2033 (US$ Mn, AGR (%))
Figure 164 Latin America Virtual Power Plant Market Share Forecast Energy Storage Technology ,2023 & 2033 (%)
Figure 165 Brazil Virtual Power Plant Market by Value, 2023-2033 (US$ Mn, AGR (%))
Figure 166 Mexico Virtual Power Plant Market by Value, 2023-2033 (US$ Mn, AGR (%))
Figure 167 Rest of Latin America Virtual Power Plant Market by Value, 2023-2033 (US$ Mn, AGR (%))
Figure 168 General Electric: Net Revenue, 2017-2021 (US$ million, AGR%)
Figure 169 General Electric: Gross Profit, 2017-2021 (US$ million, AGR%)
Figure 170 General Electric: Operational Income, 2017-2021 (US$ million, AGR%)
Figure 171 General Electric: EBITDA, 2017-2021 (US$ million, AGR%)
Figure 172 Toshiba Corporation: Net Revenue, 2017-2021 (US$ million, AGR%)
Figure 173 Toshiba Corporation: Gross Profit, 2017-2021 (US$ million, AGR%)
Figure 174 Toshiba Corporation: Operational Income, 2017-2021 (US$ million, AGR%)
Figure 175 Toshiba Corporation: EBITDA, 2017-2021 (US$ million, AGR%)
Figure 176 Schneider Electric SE: Net Revenue, 2017-2021 (US$ million, AGR%)
Figure 177 Schneider Electric SE: Gross Profit, 2017-2021 (US$ million, AGR%)
Figure 178 Schneider Electric SE: Operational Income, 2017-2021 (US$ million, AGR%)
Figure 179 Schneider Electric SE: EBITDA, 2017-2021 (US$ million, AGR%)
Figure 180 ABB Ltd: Net Revenue, 2017-2021 (US$ million, AGR%)
Figure 181 ABB Ltd: Gross Profit, 2017-2021 (US$ million, AGR%)
Figure 182 ABB Ltd: Operational Income, 2017-2021 (US$ million, AGR%)
Figure 183 ABB Ltd: EBITDA, 2017-2021 (US$ million, AGR%)
Figure 184 Hitachi Ltd: Net Revenue, 2017-2021 (US$ million, AGR%)
Figure 185 Hitachi Ltd: Gross Profit, 2017-2021 (US$ million, AGR%)
Figure 186 Hitachi Ltd: Operational Income, 2017-2021 (US$ million, AGR%)
Figure 187 Hitachi Ltd: EBITDA, 2017-2021 (US$ million, AGR%)
Figure 188 Siemens AG: Net Revenue, 2017-2021 (US$ million, AGR%)
Figure 189 Siemens AG: Gross Profit, 2017-2021 (US$ million, AGR%)
Figure 190 Siemens AG: Operational Income, 2017-2021 (US$ million, AGR%)
Figure 191 Siemens AG: EBITDA, 2017-2021 (US$ million, AGR%)
Figure 192 International Business Machines Corporation: Net Revenue, 2017-2021 (US$ million, AGR%)
Figure 193 International Business Machines Corporation: Gross Profit, 2017-2021 (US$ million, AGR%)
Figure 194 International Business Machines Corporation: Operational Income, 2017-2021 (US$ million, AGR%)
Figure 195 International Business Machines Corporation: EBITDA, 2017-2021 (US$ million, AGR%)
Figure 196 Cisco Systems, Inc: Net Revenue, 2017-2021 (US$ million, AGR%)
Figure 197 Cisco Systems, Inc: Gross Profit, 2017-2021 (US$ million, AGR%)
Figure 198 Cisco Systems, Inc: Operational Income, 2017-2021 (US$ million, AGR%)
Figure 199 Cisco Systems, Inc: EBITDA, 2017-2021 (US$ million, AGR%)
List of Companies Profiled in the report
ABB Ltd.
AGL Energy Ltd
AutoGrid
Blue Pillar
Cisco Systems, Inc.
Enel S.P.A
Enernoc, Inc.
General Electric Company
Hitachi, Ltd.
International Business Machines Corporation
Next Kraftwerke
Robert Bosch GmbH
Schneider Electric SE
Siemens AG
Toshiba Corporation
List of Other Companies Mentioned in the report
AGL Energy
American Electric Power
Amp Energy
AutoGrid
Cinergy Corporation
Cisco Systems, Inc.
Comverge
Direct Energy
Duke Energy
Enbala Power Networks
Enbala Power Networks, Inc.
Enernoc, Inc.
Geli
Generac
Hathaway Energy utility
Hawaii Public Utilities Commission
Holy Cross Energy
Kentucky Utilities
Leap
Louisville Gas & Electric
Next Kraftwerke
OhmConnect
Owensboro Municipal Utilities
PG&E
Rocky Mountain Power
Sonnen
Stem
Sunrun
Sunverge Energy
Swell Energy
SwitchDin
Sympower
Sympower
Tennessee Valley Authority
Vermont utility Green Mountain Power
Wasatch Group
List of Associations Mentioned in the Report
Alliance to Save Energy
American Boiler Manufacturers Association
American Council for an Energy-Efficient Economy
American Council on Renewable Energy
American Society of Heating, Refrigerating, and Air-Conditioning Engineers
American Wind Energy Association
Business Council for Sustainable Energy
Edison Electric Institute
Electric Power Research Institute
Electric Power Supply Association
Energy Storage Association
Geothermal Energy Association
Geothermal Resources Council
GridWise Alliance
IEEE
International District Energy Association
International Power Association
International Solar Energy Society
National Electrical Manufacturers Association
National Hydropower Association
Northwest Public Power Association (NWPPA)
Renewable Fuels Association
Smart Electric Power Alliance
Solar Energy Industries Association
The European Association for Storage of Energy – EASE
The International Energy Agency
U.S. Energy Association
Utilities Technology Council
Wind Energy Associations (WEA)
Zigbee Alliance
 Market Report 2023-2033")