Industries > Energy > Liquefied Natural Gas (LNG) Infrastructure Market 2017-2027
Liquefied Natural Gas (LNG) Infrastructure Market 2017-2027
Global Expenditure CAPEX ($mn) and Capacity (MMTPA) on Large-Scale Onshore LNG Infrastructure, by Liquefied Natural Gas (LNG) Infrastructure type - Liquefaction and Regasification Plus Analysis of Leading Companies
Visiongain has calculated that the LNG infrastructure market will see a total expenditure of $63,606 mn in 2017, including both Liquefaction and Regasification.
Read on to discover the potential business opportunities available.
LNG is used in various sectors such as automobile, industrial, and commercial. It is becoming a popular energy source due to its high replacement potential, considering its environmental benefits over other energy sources. The major advantage of LNG is the low emission of CO2, which makes it an efficient alternative to conventional fossil fuels. These advantages have been driving LNG demand from the industrial as well as automobile sector. Simultaneously, it is boosting the development of large-scale LNG terminals across the globe.
Increasing utilization of natural gas over oil is one of the major drivers for the large-scale terminals market. Various companies are focusing on establishing more liquefaction and regasification terminals in offshore areas to fulfil the increasing demand of LNG. In the current scenario, the overall global outlook is gradually shifting towards utilization of cleaner fuels. Natural gas is expected to occupy a major share of primary energy consumption by the end of the forecast period. With a boom in LNG trade activities expected in the future and steadily growing consumption pattern in emerging nations in Asia Pacific, an upward pressure on large-scale LNG sector development activities is inevitable in the future.
The construction of large-scale onshore liquefaction and regasification terminals is a function of the development of the global LNG industry. Investment in such infrastructure is dictated by unique supply and demand circumstances in different geographies, such as the US unconventional oil and gas boom and economic growth in Asia, particularly China.
There are a number of exciting LNG liquefaction prospects around the world in 2016, both under construction and perspective. The question is whether the demand of East Asia will be strong enough to support the economics of an abundant supply of liquefaction opportunities. The decline of the US as an import market for LNG has troubled financiers but has been balanced by demand in Asia, East Asia and emerging demand in South America.
Visiongain’s LNG infrastructure market report can keep you informed and up to date with the developments in the Liquefication Market in Australia, Canada, US and East Africa and Rest of the World. Visiongain has also included in-Depth market analysis about the Regasification markets in China, Japan, South Korea, India and Europe.
With reference to this report, it details the key investments trend in the global market, subdivided by regions, capital expenditure and capacity. Through extensive secondary research and interviews with industry experts, visiongain has identified a series of market trends that will impact the LNG infrastructure market over the forecast timeframe.
The report will answer questions such as:
– What are the key trends and factors affecting spending on new liquefaction infrastructure?
– What factors dictate this investment?
– How are the economics of terminals shaping up?
– What is the interplay between expenditure on regasification terminals and liquefaction capacity?
– How are demand markets for LNG most likely to evolve, and why?
– Who will be the main exporters and importers of LNG over the next decade?
– How will the future global LNG trade routes change?
– How much extra LNG capacity will enter the global market over the next decade
Five Reasons Why You Must Order and Read This Report Today:
1) The report provides CAPEX and capacity forecasts and analyses for the 5 Leading Regional Players in the LNG Liquefaction Market 2017-2027
– Australia
– Canada
– East Africa
– Russia
– US
– Rest of the World (Includes Iran, Papua New Guinea, Qatar, Trinidad & Tobago, Algeria, Angola & Nigeria)
2) The report provide CAPEX and capacity forecasts and analyses for the 5 Leading Regional Players in the LNG Regasification Market 2017-2027
– China
– Europe
– Japan
– South Korea
– India
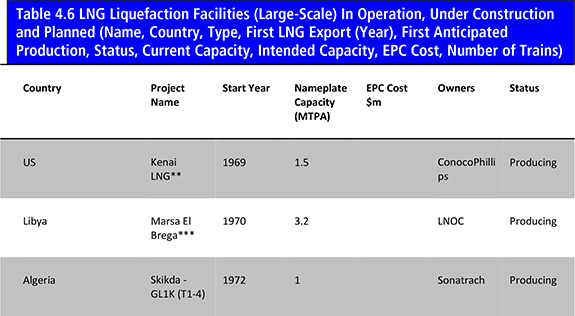
3) The report includes tables of all currently operating, under construction and planned liquefaction and regasification facilities, listing their Location, Operational Year, Status, Capacity, Owner(s) and EPC Cost
4) The analysis is underpinned by our exclusive interviews with leading experts from:
– Linde AG
5) The report provides detailed profiles of the leading companies operating within the LNG Infrastructure market:
– BHP Billiton
– ExxonMobil
– BP
– ConocoPhillips.
– Total S.A
– Linde AG
– Royal Dutch Shell
– PETRONAS
– Chevron Corporation
– Rosneft
This independent 328-page report guarantees you will remain better informed than your competitors. With 156 tables and figures examining the LNG Infrastructure market space, the report gives you a direct, detailed breakdown of the market. PLUS, capital expenditure AND capacity AND tables of all currently operating, under construction and planned liquefaction and regasification facilities, as well as in-Depth analysis, from 2017-2027 will keep your knowledge that one step ahead of your rivals.
This report is essential reading for you or anyone in the LNG sectors. Purchasing this report today will help you to recognise those important market opportunities and understand the possibilities there. I look forward to receiving your order.
Visiongain is a trading partner with the US Federal Government
CCR Ref number: KD4R6
1. Report Overview
1.1 Liquefied Natural Gas (LNG)Infrastructure Market Overview
1.2 Market Structure Overview and Market Definition
1.3 Why You Should Read This Report
1.4 How This Report Delivers
1.5 Key Questions Answered by This Analytical Report Include:
1.6 Who is This Report For?
1.7 Methodology
1.7.1 Primary Research
1.7.2 Secondary Research
1.7.3 Market Evaluation & Forecasting Methodology
1.8 Frequently Asked Questions (FAQ)
1.9 Associated Visiongain Reports
1.10 About Visiongain
2. Introduction to The Liquefied Natural Gas (LNG) Infrastructure Market
2.1 Global LNG Infrastructure Market Structure
2.2 Market Definition
2.3 LNG Industry Outlook
2.4 LNG- Value Chain Analysis
2.5 The Role and Function of LNG Infrastructure
2.6 What is Natural Gas Liquefaction?
2.7 What is LNG Regasification?
2.8 Brief History of LNG Infrastructure
3. Global Overview of Liquefied Natural Gas (LNG) Infrastructure Market 2017-2027
3.1 Global Overview
3.2 Global Liquefied Natural Gas (LNG) Import Terminals
3.2 Global Liquefied Natural Gas (LNG) Export Terminals
4. Liquefied Natural Gas (LNG) Infrastructure Submarkets Forecasts 2017-2027
4.1 Global Liquefied Natural Gas (LNG) Infrastructure Submarkets Forecasts, by Type 2017-2027
4.1.1 Global Liquefaction Liquefied Natural Gas (LNG) Infrastructure Forecasts 2017-2027
4.1.2 Global Regasification Forecasts 2017-2027
4.1.3 Global Liquefied Natural Gas (LNG) Infrastructure, by Liquefied Natural Gas (LNG) Infrastructure Type Drivers and Restraints
4.2 Demand Side Factors
4.3 Supply-Side Drivers
4.4 Global LNG Market: Where Are We Now; Where Will We Be in 5 Years; Where Will We Be in 10 Years?
4.5 Oil Price Analysis
4.6 Supply-Side Factors
4.7 Demand-Side Factors
4.8 Other Major Variables that Impact the Oil Price
4.9 Oil Price and LNG Price Relationship
4.10 Towards an Oversupplied LNG Market
4.11 Large-Scale Liquefaction Terminals in Operation, Under Construction and Planned
4.12 Large-Scale Regasification Terminals in Operation, Under Construction and Planned
5. The Leading Regional Players in LNG Liquefaction Market (Large-Scale Onshore) 2017-2027
5.1 Australian Large-Scale Onshore LNG Liquefaction Market 2017-2027
5.1.1 Overall Drivers & Restraints on Australian LNG Liquefaction Investment
5.1.2 Capital Expenditure Analysis
5.1.3 What Are the Prospects for Brownfield Terminal Development?
5.1.4 Future Outlook for Australian LNG Infrastructure
5.2 U.S. Large-Scale Onshore LNG Liquefaction Market 2017-2027
5.2.1 Overall Drivers & Restraints on U.S. LNG Liquefaction Investment
5.2.2 Capital Expenditure Analysis
5.2.2.1 Drivers for Capital Expenditure
5.2.2.2 Restraints on Capital Expenditure
5.2.3 US Large-Scale Onshore LNG Liquefaction Terminal Locations
5.3 Russian Large-Scale Onshore LNG Liquefaction Market 2017-2027
5.3.1 Overall Drivers & Restraints on RUSSIAN LNG Liquefaction Investment
5.3.2 Russia Onshore Liquefaction Facilities and Prospects
5.4 Canadian Large-Scale Onshore LNG Liquefaction Market 2017-2027
5.4.1 Overall Drivers & Restraints on Canadian LNG Liquefaction Investment
5.4.2 Capital Expenditure Analysis
5.4.3 Canadian Onshore LNG Liquefaction Projects
5.4.4 Greenfield Terminal Costs and Economic
5.4.5 Threats to LNG Liquefaction Terminal Investment
5.5 East African Large-Scale Onshore LNG Liquefaction Market 2017-2027
5.5.1 Overall Drivers & Restraints on East African LNG Liquefaction Investment
5.5.2 Mozambique LNG Liquefaction Outlook
5.5.3 Upstream Assets Relevant to LNG Liquefaction Development
5.5.4 Anadarko’s LNG Plan: The Onshore Option
5.5.5 ENI’s FLNG Option
5.5.6 Mozambique Development Context& Tax Regime
5.5.7 Most Likely Scenario for Mozambique LNG Development
5.5.8 Tanzanian LNG Liquefaction Outlook
5.5.9 Shell’s Acquisition of BG Group in 2015
5.5.10 Tanzania Development Context & Tax Regime
5.6 Rest of the World Large-Scale Onshore LNG Liquefaction Market 2017-2027
5.6.1 Iranian Onshore LNG Liquefaction Prospects
5.6.2 Joint LNG Exports
5.6.3 Potential Export Markets
5.6.4 Domestic Situation
5.6.5 Papua New Guinea Onshore LNG Liquefaction Prospects
5.6.6 Qatari Onshore LNG Liquefaction Prospects
5.6.7 Trinidad & Tobago Onshore LNG Prospects
5.6.8 Algeria
5.6.9 Angola
5.6.10 Nigeria
6. The Leading Regional Players in LNG Regasification Market (Large-Scale Onshore) 2017-2027
6.1 China Large-Scale Onshore LNG Regasification Market 2017-2027
6.1.1 Overall Drivers & Restraints on China LNG Regasification Investment
6.1.2 Domestic Supply – Shale Gas Development
6.1.3 Domestic Supply – Coalbed Methane Development
6.1.4 Domestic Supply – Tight Gas Development
6.1.5 Imports of Pipeline Gas
6.2 Japan Large-Scale Onshore LNG Regasification Market 2017-2027
6.2.1 Overall Drivers & Restraints on Japan LNG Regasification Investment
6.2.2 Capital Expenditure Analysis
6.2.3 Restarting Nuclear Power Generation
6.2.4 The Future of Coal Power Generation
6.2.5 Liquefaction Equity Investment Indicative of Future Imports
6.3 India Large-Scale Onshore LNG Regasification Market 2017-2027
6.3.1 Overall Drivers & Restraints on India LNG Regasification Investment
6.3.2 Indian LNG Infrastructure Outlook
6.3.4 LNG Pricing
6.4 Europe Large-Scale Onshore LNG Regasification Market 2017-2027
6.4.1 Overall Drivers & Restraints on Europe LNG Regasification Investment
6.4.2 How Does the Ukraine Crisis Impact Future European LNG
6.4.3 The Impact of Gas Pipeline Developments on LNG Infrastructure Investment
6.4.4 The Economics of LNG Imports vs Russian Gas
6.4.5 The FSRU Option – A Threat to Onshore Regasification in Europe?
6.4.6 What Will the Effect of UK North Sea Gas Declines be on Regasification Infrastructure?
6.4.7 Shale Gas Development Issues and their Relation to LNG Infrastructure Development
6.4.8 Poland
6.4.9 UK
6.4.10 Energy Security & Geo-Politics as a Driver of Regasification Infrastructure Development
6.4.11 A Shift to Natural Gas Power Generation?
6.4.12 Baltic States LNG Regasification Outlook
6.4.13 Italian LNG Regasification Terminal Outlook
6.5 South Korea Large-Scale Onshore LNG Regasification Market 2017-2027
6.5.1 Overall Drivers & Restraints on South Korea LNG Regasification Investment
6.5.2 Current LNG Demand Situation
6.5.3 What is the Future of Nuclear Power Generation in South Korea?
6.6 Rest of the World Large-Scale Onshore LNG Regasification Market 2017-2027
6.6.1 Overall Drivers & Restraints on Rest of the World LNG Regasification Investment
6.6.2 South & Central America
6.6.3 The Middle East& Africa
7. PESTEL Analysis of the LNG Infrastructure Market
7.1 PESTEL Analysis
8. Expert Opinion
8.1 Primary Correspondents
8.2 Global LNG Infra Market Outlook
8.3 Driver & Restraints
8.4 Dominant Region/Country in the LNG Liquefaction Market
8.5 Dominant Region/Country in the LNG Regasification Market
8.6 By type (Liquefaction & Regas) Market Scenario
8.7 Overall Growth Rate, Globally
9. Leading Companies in LNG Infrastructure Market
9.1 BHP Billiton
9.2 ExxonMobil
9.3 BP P.L.C.
9.4 ConocoPhillips
9.5 Total S.A.
9.6 Linde AG
9.7 Royal Dutch Shell
9.8 PETRONAS
9.9 Chevron Corporation
9.10 Rosneft
10. Conclusion & Recommendations
10.1 Key Findings
10.2 Recommendations
11. Glossary
Appendix
Associated Visiongain Reports
Visiongain Report Sales Order Form
Appendix A
Appendix B
Visiongain Report Evaluation Form
List of Tables
Table 1.1 Global LNG Infrastructure Market by Regional Market Forecast 2017-2027 ($ mn/MMTPA, AGR %, CAGR)
Table 3.1 Global Liquefaction Liquefied Natural Gas (LNG) Infrastructure Forecast 2017-2027($mn, AGR %, CAGR %, Cumulative)
Table 3.2 Global Liquefied Natural Gas (LNG) Import Terminals Details (Region, Country, Project, Onshore / Offshore, Status, Startup, Operator, Capacity mt/y)
Table 3.3 Global Liquefied Natural Gas (LNG) Export Terminals (Region, Country, Project, Onshore / Offshore, Status, Startup, Operator, Capacity mt/y, Storage '000cm)
Table 4.1 Global Liquefied Natural Gas (LNG) Infrastructure Market Forecast Liquefaction vs. Regasification 2017-2027($mn, AGR %, Cumulative)
Table 4.2 Global Liquefied Natural Gas (LNG) Infrastructure Market Forecast Liquefaction vs. Regasification 2017-2027(MMTPA, AGR %, Cumulative)
Table 4.3 Global Liquefaction Liquefied Natural Gas (LNG) Infrastructure Forecast 2017-2027($mn, AGR %, CAGR %, Cumulative)
Table 4.4 Global Regasification Forecast 2017-2027($mn, AGR %, CAGR %, Cumulative)
Table 4.5 Global Liquefaction Natural Gas (LNG) Infrastructure Drivers and Restraints
Table 4.6 LNG Liquefaction Facilities (Large-Scale) In Operation, Under Construction and Planned (Name, Country, Type, First LNG Export (Year), First Anticipated Production, Status, Current Capacity, Intended Capacity, EPC Cost, Number of Trains)
Table 4.7 Large-Scale Regasification Terminals in Operation, Under Construction and Planned (Country, Terminal Name, Start Year, Nameplate Receiving Capacity (MTPA), EPC Cost $m, Owners, Status)
Table 5.1 Global LNG Liquefaction Market, by Country/Region Forecast CAPEX 2017-2027 ($mn, AGR %, Cumulative)
Table 5.2 Global LNG Liquefaction Market, by Country/Region Forecast Capacity 2017-2027 (MMTPA, AGR %, Cumulative)
Table 5.3 Australian Large-Scale Onshore LNG Liquefaction Facility CAPEX & Capacity 2017-2027 ($m, MMTPA, AGR %, Cumulative)
Table 5.4 Australian Large-Scale Onshore LNG Liquefaction Drivers and Restraints
Table 5.5 U.S. Large-Scale Onshore LNG Liquefaction Facility CAPEX & Capacity 2017-2027 ($m, MMTPA, AGR %, Cumulative)
Table 5.6 U.S. Large-Scale Onshore LNG Liquefaction Drivers and Restraints
Table 5.7 Russian Large-Scale Onshore LNG Liquefaction Facility CAPEX & Capacity 2017-2027 ($m, MMTPA, AGR %, Cumulative)
Table 5.8 Russian Large-Scale Onshore LNG Liquefaction Drivers and Restraints
Table 5.9 Canadian Large-Scale Onshore LNG Liquefaction Facility CAPEX & Capacity 2017-2027 ($m, MMTPA, AGR %, Cumulative)
Table 5.10 Canadian Large-Scale Onshore LNG Liquefaction Drivers and Restraints
Table 5.11 East African Large-Scale Onshore LNG Liquefaction Facility CAPEX & Capacity 2017-2027 ($m, MMTPA, AGR %, Cumulative)
Table 5.12 East African Large-Scale Onshore LNG Liquefaction Drivers and Restraints
Figure 5.13 Mozambique Gas Blocks Relevant to LNG Exports (Operator, Block, Onshore/Offshore, km2, Project Shareholders, Status)
Table 5.14 Rest of the World Large-Scale Onshore LNG Liquefaction Facility CAPEX & Capacity 2017-2027 ($m, MMTPA, AGR %, Cumulative)
Table 6.1 Global LNG Regasification Market, by Country/Region Forecast CAPEX 2017-2027 ($mn, AGR %, Cumulative)
Table 6.2 Global LNG Regasification Market, by Country/Region Forecast Capacity 2017-2027 (MMTPA, AGR %, Cumulative)
Table 6.3 China Large-Scale Onshore LNG Regasification Facility CAPEX & Capacity 2017-2027 ($m, MMTPA, AGR %, Cumulative)
Table 6.4 China Large-Scale Onshore LNG Regasification Drivers and Restraints
Table 6.5 Japan Large-Scale Onshore LNG Regasification Facility CAPEX & Capacity 2017-2027 ($m, MMTPA, AGR %, Cumulative)
Table 6.6 Japan Large-Scale Onshore LNG Regasification Drivers and Restraints
Table 6.7 India Large-Scale Onshore LNG Regasification Facility CAPEX & Capacity 2017-2027 ($m, MMTPA, AGR %, Cumulative)
Table 6.8 India Large-Scale Onshore LNG Regasification Drivers and Restraints
Table 6.9 Europe Large-Scale Onshore LNG Regasification Facility CAPEX & Capacity 2017-2027 ($m, MMTPA, AGR %, Cumulative)
Table 6.10 Europe Large-Scale Onshore LNG Regasification Drivers and Restraints
Table 6.11 South Korea Large-Scale Onshore LNG Regasification Facility CAPEX & Capacity 2017-2027 ($m, MMTPA, AGR %, Cumulative)
Table 6.12 South Korea Large-Scale Onshore LNG Regasification Drivers and Restraints
Table 6.13 Rest of the World Large-Scale Onshore LNG Regasification Facility CAPEX & Capacity 2017-2027 ($m, MMTPA, AGR %, Cumulative)
Table 6.14 Rest of the World Large-Scale Onshore LNG Regasification Drivers and Restraints
Table 7.1 PESTEL Analysis, LNG Infrastructure Market
Table 9.1 BHP Billiton Profile 2016 (Market Entry, Public/Private, Headquarter, No. of Employees), Revenue 2016 ($bn), Change in Revenue, Geography, Key Market, Listed on & Products/Services
Table 9.2 BHP Billiton, Total Company Sales 2012-2016 ($bn, AGR %)
Table 9.3 ExxonMobil Profile 2016 (Market Entry, Public/Private, Headquarter, No. of Employees, Revenue 2016 ($bn), Change in Revenue, Geography, Key Market, Company Sales from LNG Infrastructure Market, Listed on & Products/Services
Table 9.4 ExxonMobil, Total Company Sales 2012-2016 ($bn, AGR %)
Table 9.5 BP P.L.C. (Market Entry, Public/Private, Headquarter, No. of Employees, Revenue 2016 ($bn), Change in Revenue, Geography, Key Market, Company Sales from LNG Infrastructure Market, Listed on & Products/Services
Table 9.6 BP P.L.C., Total Company Sales 2012-2016 ($bn, AGR %)
Table 9.7 ConocoPhillips Profile 2016 (Market Entry, Public/Private, Headquarter, No. of Employees, Revenue 2016 ($bn), Change in Revenue, Geography, Key Market, Company Sales from LNG Infrastructure Market, Listed on & Products/Services
Table 9.8 ConocoPhillips Total Company Sales 2012-2016 ($bn, AGR %)
Table 9.9 Total S.A., Profile 2016 (Market Entry, Public/Private, Headquarter, No. of Employees, Revenue 2016 ($bn), Change in Revenue, Geography, Key Market, Company Sales from LNG Infrastructure Market, Listed on & Products/Services
Table 9.10 Total S.A., Inc. Total Company Sales 2012-2016 ($bn, AGR %)
Table 9.11 Linde AG Company Profile 2015 (Market Entry, Public/Private, Headquarter, No. of Employees, Revenue 2016 ($bn), Change in Revenue, Geography, Key Market, Company Sales from LNG Infrastructure Market, Listed on & Products/Services
Table 9.12 Linde AG Total Company Sales 2012-2016 ($bn, AGR %)
Table 9.13 Royal Dutch Shell Profile 2016 (Market Entry, Public/Private, Headquarter, No. of Employees, Revenue 2016 ($bn), Change in Revenue, Geography, Key Market, Company Sales from LNG Infrastructure Market, Listed on & Products/Services
Table 9.14 Royal Dutch Shell, Total Company Sales 2012-2016 ($bn, AGR %)
Table 9.15 PETRONAS Profile 2015 (Market Entry, Public/Private, Headquarter, No. of Employees, Revenue 2016 ($bn), Change in Revenue, Geography, Key Market, Company Sales from LNG Infrastructure Market, Listed on & Products/Services
Table 9.16 PETRONAS Total Company Revenue 2011-2015 ($bn, AGR %)
Table 9.17 Chevron Corporation Profile 2015 (Market Entry, Public/Private, Headquarter, No. of Employees, Revenue 2016 ($bn), Change in Revenue, Geography, Key Market, Company Sales from LNG Infrastructure Market, Listed on & Products/Services
Table 9.18 Chevron Corporation, Total Company Sales 2012-2016 ($bn, AGR %)
Table 9.19 Rosneft Profile 2015 (Market Entry, Public/Private, Headquarter, No. of Employees, Revenue 2016 ($bn), Change in Revenue, Geography, Key Market, Company Sales from LNG Infrastructure Market, Listed on & Products/Services
Table 9.20 Rosneft Total Company Sales 2012-2016 ($bn, AGR %)
List of Figures
Figure 1.1 Global Natural Gas Consumption Forecast 2010-2035
Figure 1.2 The LNG Liquefaction Market by Country/Region Market Share Forecast 2017, 2022, 2027 (% Share)
Figure 2.1 Global LNG Infrastructure Market Segmentation Overview
Figure 2.2 LNG, Value Chain Analysis
Figure 2.3 LNG Supply Chain from Field Production to Gas Grid
Figure 2.4 Simplified Flow Diagram of the Liquefaction Process
Figure 2.5 LNG Industry Brief Early History Timeline
Figure 3.1 Global Liquefied Natural Gas (LNG) Infrastructure Forecast 2017-2027 ($mn, AGR %)
Figure 4.1 Global Liquefied Natural Gas (LNG) Infrastructure Submarket Forecast 2017-2027 ($mn)
Figure 4.2 Global Liquefied Natural Gas (LNG) Infrastructure Market by Type (CAPEX) Share Forecast 2017, 2022, 2027 (% Share)
Figure 4.3 Liquefied Natural Gas (LNG) Infrastructure Market, By Liquefaction Forecast 2017-2027 ($mn, AGR%)
Figure 4.4 Liquefied Natural Gas (LNG) Infrastructure Market, By Regasification Forecast 2017-2027 ($mn, AGR%)
Figure 4.5 Top 10 LNG Exporter Countries (Million Tons), 2016
Figure 4.6 WTI, Brent, Dubai, Nigerian Forcados Oil Prices 2000-2016 ($/bbl)
Figure 5.1 Regional LNG Liquefaction Market, by CAPEX 2017-2027
Figure 5.2 Regional LNG Liquefaction Market, By Capacity (MMTPA) 2017-2027
Figure 5.3 Leading Country/Regional LNG Liquefaction Market Share by CAPEX 2017
Figure 5.4 Leading Country/Regional LNG Liquefaction Market Share by CAPEX 2022
Figure 5.5 Leading Country/Regional LNG Liquefaction Market Share 2027
Figure 5.6 Australian Large-Scale Onshore LNG Liquefaction Facility Forecast 2017-2027 ($mn, AGR%)
Figure 5.7 Australian Large-Scale Onshore LNG Liquefaction Facility Share Forecast 2017, 2022, 2027 (% Share)
Figure 5.8 Australian Large-Scale Onshore LNG Liquefaction Facility, by Capacity Forecast 2017-2027
Figure 5.9 Australian Onshore LNG Liquefaction Facility Cost per mmtpa of Capacity (Greenfield Terminals, CAPEX per mmtpa ($mn)
Figure 5.10 U.S. Large-Scale Onshore LNG Liquefaction Facility Forecast 2017-2027 ($mn, AGR%)
Figure 5.11 U.S. Large-Scale Onshore LNG Liquefaction Facility Share Forecast 2017, 2022, 2027 (% Share)
Figure 5.12 U.S. Large-Scale Onshore LNG Liquefaction Facility, by Capacity Forecast 2017-2027
Figure 5.13 USLNG Export Terminals Currently Approved by FERC (Name, Location, Sponsor)
Figure 5.14 USLNG Export Terminals Proposed to FERC (Name, Location, Sponsor)
Figure 5.15 Russian Large-Scale Onshore LNG Liquefaction Facility Forecast 2017-2027 ($mn, AGR%)
Figure 5.16 Russian Large-Scale Onshore LNG Liquefaction Facility Share Forecast 2017, 2022, 2027 (% Share)
Figure 5.17 Russian Large-Scale Onshore LNG Liquefaction Facility, by Capacity Forecast 2017-2027
Figure 5.18 Onshore LNG Liquefaction Facility Cost per mmtpa of Capacity (Greenfield Terminals, CAPEX per mmtpa ($m))
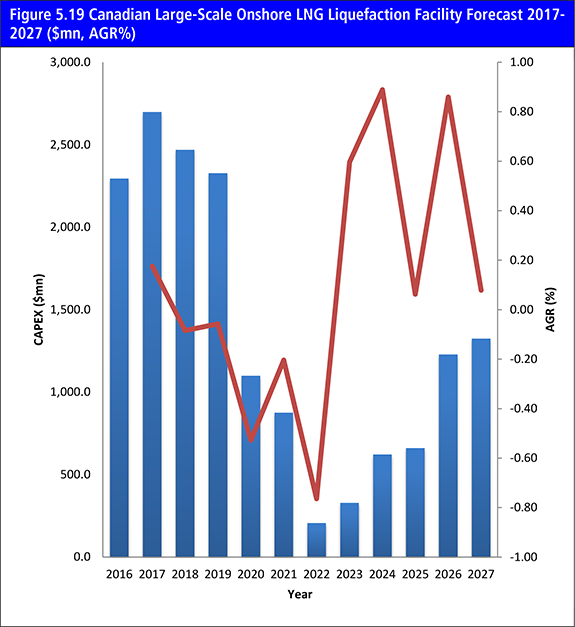
Figure 5.19 Canadian Large-Scale Onshore LNG Liquefaction Facility Forecast 2017-2027 ($mn, AGR%)
Figure 5.20 Canadian Large-Scale Onshore LNG Liquefaction Facility Share Forecast 2017, 2022, 2027 (% Share)
Figure 5.21 Canadian Large-Scale Onshore LNG Liquefaction Facility, by Capacity Forecast 2017-2027 (MMTPA)
Figure 5.22 East African Large-Scale Onshore LNG Liquefaction Facility Forecast 2017-2027 ($mn, AGR%)
Figure 5.23 East African Large-Scale Onshore LNG Liquefaction Facility Share Forecast 2017, 2022, 2027 (% Share)
Figure 5.24 East African Large-Scale Onshore LNG Liquefaction Facility, by Capacity Forecast 2017-2027 (MMTPA)
Figure 5.25 Rest of the World Large-Scale Onshore LNG Liquefaction Facility Forecast 2017-2027 ($mn, AGR%)
Figure 5.26 Rest of the World Large-Scale Onshore LNG Liquefaction Facility Share Forecast 2017, 2022, 2027 (% Share)
Figure 5.27 Rest of the World Large-Scale Onshore LNG Liquefaction Facility, by Capacity Forecast 2017-2027 (MMTPA)
Figure 5.28 North Field, Qatar
Figure 6.1 Regional LNG Regasification Market by CAPEX 2017-2027
Figure 6.2 Regional LNG Regasification Market By Capacity (MMTPA) 2017-2027
Figure 6.3 Leading Country/Regional LNG Regasification Market Share by CAPEX 2017
Figure 6.4 Leading Country/Regional LNG Regasification Market Share by CAPEX 2022
Figure 6.5 Leading Country/Regional LNG Regasification Market Share 2027
Figure 6.6 China Large-Scale Onshore LNG Regasification Facility Forecast 2017-2027 ($mn, AGR%)
Figure 6.7 China Large-Scale Onshore LNG Regasification Facility Share Forecast 2017, 2022, 2027 (% Share)
Figure 6.8 China Large-Scale Onshore LNG Regasification Facility, by Capacity Forecast 2017-2027 (MMTPA)
Figure 6.9 Japan Large-Scale Onshore LNG Regasification Facility Forecast 2017-2027 ($mn, AGR%)
Figure 6.10 Japan Large-Scale Onshore LNG Regasification Facility Share Forecast 2017, 2022, 2027 (% Share)
Figure 6.11 Japan Large-Scale Onshore LNG Regasification Facility, by Capacity Forecast 2017-2027 (MMTPA)
Figure 6.12 Japanese Net Electricity Generation by Fuel Type, 2013 & 2030 Target (% of TWh)
Figure 6.13 India Large-Scale Onshore LNG Regasification Facility Forecast 2017-2027 ($mn, AGR%)
Figure 6.14 India Large-Scale Onshore LNG Regasification Facility Share Forecast 2017, 2022, 2027 (% Share)
Figure 6.15 India Large-Scale Onshore LNG Regasification Facility, by Capacity Forecast 2017-2027 (MMTPA)
Figure 6.16 Europe Large-Scale Onshore LNG Regasification Facility Forecast 2017-2027 ($mn, AGR%)
Figure 6.17 Europe Large-Scale Onshore LNG Regasification Facility Share Forecast 2017, 2022, 2027 (% Share)
Figure 6.18 Europe Large-Scale Onshore LNG Regasification Facility, by Capacity Forecast 2017-2027 (MMTPA)
Figure 6.19 UK Natural Gas Consumption & Production, 2000-2024 (bcm/a)
Figure 6.20 South Korea Large-Scale Onshore LNG Regasification Facility Forecast 2017-2027 ($mn, AGR%)
Figure 6.21 South Korea Large-Scale Onshore LNG Regasification Facility Share Forecast 2017, 2022, 2027 (% Share)
Figure 6.22 South Korea Large-Scale Onshore LNG Regasification Facility, by Capacity Forecast 2017-2027(MMTPA)
Figure 6.23 Rest of the World Large-Scale Onshore LNG Regasification Facility Forecast 2017-2027 ($mn, AGR%)
Figure 6.24 Rest of the World Large-Scale Onshore LNG Regasification Facility Share Forecast 2017, 2022, 2027 (% Share)
Figure 6.25 Rest of the World Large-Scale Onshore LNG Regasification Facility, by Capacity Forecast 2017-2027 (MMTPA)
Figure 9.1 BHP Billiton, Revenue, ($bn& AGR %), 2012-2016
Figure 9.2 BHP Billiton Revenue % Share by Geographic Segment, 2016
Figure 9.3 BHP Billiton Revenue % Share by Business Segment, 2016
Figure 9.4 ExxonMobil, Revenue, ($bn& AGR %), 2012-2016
Figure 9.5 BP P.L.C., Revenue, ($bn& AGR %), 2012-2016
Figure 9.6 BP P.L.C. Revenue % Share by Geographic Segment, 2016
Figure 9.7 BP P.L.C. Revenue % Share by Business Segment, 2016
Figure 9.8 ConocoPhillips, Revenue, ($bn& AGR %), 2012-2016
Figure 9.9 ConocoPhillips Revenue % Share by Product Segment, 2016
Figure 9.10 ConocoPhillips Revenue % Share by Regional Segment, 2016
Figure 9.11 Total S.A., Inc. Revenue, ($bn& AGR %), 2012-2016
Figure 9.12 Total S.A. Revenue % Share by Business Segment, 2016
Figure 9.13 Linde AG, Revenue, ($bn& AGR %), 2012-2016
Figure 9.14 Linde AG Revenue % Share by Business Segment, 2016
Figure 9.15 Linde AG Revenue % Share by Regional Segment (Gases Division), 2016
Figure 9.16 Royal Dutch Shell Revenue ($bn& AGR %), 2012-2016
Figure 9.17 Royal Dutch Shell Revenue % Share by Geographic Segment, 2016
Figure 9.18 Royal Dutch Shell Revenue % Share by Business Segment, 2016
Figure 9.19 PETRONAS Total Company Revenue ($bn & AGR %), 2011-2015
Figure 9.20 PETRONAS Revenue % Share by Product Segment, 2015
Figure 9.21 PETRONAS Revenue % Share by Geographical Trade, 2015
Figure 9.22 PETRONAS Revenue % Share by Business Segment, 2015
Figure 9.23 PETRONAS Revenue % Share by Geographic Segment, 2015
Figure 9.24 Chevron Corporation, Revenue, ($bn& AGR %), 2012-2016
Figure 9.25 Chevron Corporation Revenue % Share by Business Segment, 2016
Figure 9.26 Rosneft Revenue ($bn& AGR %), 2013-2016
Figure 9.27 Rosneft % Share by Business Segment, 2016
Figure 10.1 Global Liquefaction LNG Infrastructure Market Forecast 2017-2027 ($ mn, AGR %)
Figure 10.2 Global Regasification LNG Infrastructure Market Forecast 2017-2027 ($ mn, AGR %)
4Gas
Aceh Regional
Adani Group
ADGAS
Abu Dhabi National Oil Company (ADNOC)
Adria LNG
AES Gener
AIG
Allnet
Anadarko
Annova LNG
Apache
API Nova Energia
Arc Logi
Arrow Energy LNG
Atlantic LNG
Atlantic Sea Island Group LLC
Australian Pacific LNG (APLNG)
Bahia Blanca Gas Port (BBGP)
Bahia de Bizkaia Gas
BC LNG Export Cooperative
Bear Head
BG Group
Bharat Petroleum Corporation
BHP Billiton
Botas
BP
BPCl
Brass LNG
Brindisi LNG
Broadwater Energy
Brunei LNG
Calais LNG
Cameron LNG
Canada Stewart Energy Group
Canaport LNG
Canvey LNG
Cheniere Energy
Chevron
Chinese Petroleum (CPC)
Chita LNG
Chubu Electric
Chubu Electric Power
Chugoko Electric Power
CIC
Cigma LNG
China National Offshore Oil Corporation (CNOOC)
Colbun SA
Comunidad Autonoma de Galicia
ConocoPhillips
Corpus Christi LNG
Cosmo
Cove
Crossnet
Cuadrilla Resources
Daewoo Shipbuilding
Dailian Construction Investment Corp
Dailian Port
DEPA
Dialog LNG
Dominion Energy
Dongguan Fuel Industrial
DOW Chemical
Downeast LNG
Dragon LNG
East Ohio Gas Company
Eco Electrica
EconGas OMV
EDF
Edison
EG LNG
EGAS
Egegaz
EGPC
Egyptian LNG (ELNG)
Elengy
Emirates LNG
Enagas
ENAP
Enarsa
ENDESA
Enel
Energy Transfer Partners
Energy World
ENH
Eni
Esperanza Energy
EVE
Excelerate Energy
ExxonMobil
Fluxys
Fluxys LNG NV (Suez)
Foshan Gas
Freeport LNG
Freeport McMoran LLC
Fujian Investment Development Corporation
Fujian LNG
GAIL
Galp Atlantico (Transgas)
Gangavaram Port Limited
Gas Natural Fenosa
Gas Natural SDG
Gascan
Gasfin
GASSP
Gasunie
Gate Terminal
Gaz de Normandie
Gazprom
GAZ-SYSTEM SA
GDF Suez
GE Capital
GE Energy Financial Services
GNL de Sonora
GNL del Plata
GNL Escobar GasPort
GNL Italia
GNL Mejillones SA
Golden Pass LNG
Grain LNG
Grupo Tojeiro
Gruppo Falcione
GS Energy
Guangdong Dapeng LNG
Guangdong Gas
Guangdong Yudean
Guangzhou Gas Group
Gujarat State Petroleum Corporation
Gulf Coast LNG Partners
Gulf LNG Energy
Hainan Development Holding Corporation
HEP
Heritage Oil
Hess LNG
Highstar
Hiroshima Gas
Hokkaido Gas
Hong Kong & China Gas
Hong Kong Electric
Hunt Oil
Hyundai
Hyundai Heavy Industries
IGas Energy
Imperial Oil
India Oil Company
Indian Oil Corporation
INPEX
Ionio Gas
Iran Liquefied Natural Gas Company
IRIDE Group
Irving Oil
Itochu
Iwatani
Jamaica LNG
Japex
Jiangsu Guoxin
JOGMEC
Jordan Cove Energy
Jovo Group
JX Nippon Oil & Energy
Kanematsu
Kansai Electric Power
KBR
Kinder Morgan
Kitakyushu LNG
Kitimat LNG
Klaipedos Nafta
KM LNG Operating Partnership
KOGAS
Korea LNG
KUFPEC
Kuwait Foreign Petroleum Exploration Company (KUFPEC)
Kyushu Electric
Legislative Assembly of British Columbia
Levant LNG (Pangea LNG)
Linde AG
LNG Japan
LNG Limited
Louisiana LNG
Magnolia LNG
Marathon
Marine Engineering
Mariveles LNG
Marubeni
MedGas LNG
Metrogas
Michael S Smith Cos
Mitsui
MSEB Holding Co
National Grid Transco
National Highway Traffic Safety Administration
National Iranian Oil Company (NIOC)
Nexen Energy
NextDecade
NGC Trinidad
Nigeria LNG (NLNG)
Nihonkai LNG
Ningbo Power Development Co LTD
NIOC (NIGEC)
Nippon Gas
Nippon Oil
Nigerian National Petroleum Corporation (NNPC)
Noble Energy
NOC (Sirte Oil)
Novatek
NTPC
Offshore LNG Toscana
Oil Search
Oita LNG
Okinawa Electric Power Co
OK-LNG OPCO
Oman LNG
Oman Oil
ONGC
Ophir Energy
Oregon LNG
Origin Energy
Osaka Gas
Pacific LNG
Pacific Oil and Gas
Pangea LNG
Partex
Pavilion Energy
PE Wheatstone
Peak Petroleum
Pertamina
Petoro
Petrobras
PetroChina
Petroleum BRUNEI
Petromin PNG
Petronas
Petronet LNG
Philadelphia Gas Works (PGW)
Pieria Energy
Pieridae Energy Canada
Pioneer Natural Resources
Plinacro
PNG Landowners
PNG LNG (Esso Highlands Ltd)
Polskie LNG SP.
Port Dolphin Energy LLC
Port Meridian Energy Ltd
Port Westward LNG
Posco
Project Venezuela LNG
PT Arun NGL (ExxonMobil)
PT Badak NGL
PT Donggi-Senoro LNG
Posta ve Telgraf Teşkilatı (PTT)
PTT LNG Company Ltd
PTTEP
Publigas
Qalhat LNG
Qatar Petroleum
Qatargas
Qingdao Port
Queensland Curtis LNG (QCLNG)
Quicksilver
Quoddy Bay LLC
Rabaska LNG
RasGas
Ratnagiri Gas & Power
Reganosa
REN
Repsol
Rosneft
RREEF Infrastructure
RWE
Sabine Pass LNG
Saggas - Planta de Regasificacion de Sagunto
Saibu Gas
Saipem
Sakai LNG
Sakaide LNG
Sakhalin Energy Investment
Samsung Heavy Industries
Santos Limited
SCT&E LNG
SEGAS
Sempra Energy
Sendai City Gas Bureau
Shannon LNG
Shell
Shell India
Shenergy Group
Shenzhen Energy Group
Shenzhen Gas
Shimizu LNG
Shizuoka Gas
Silk Road Fund 9
Sinochem Corporation
Sinopec
SK Corporation
SK Energy
Skangass AS
Sonagas
Sonangol
Sonatrach
Sorgenia
South Hook LNG
Southern LNG
Southern Union
Statia Terminals Canada
Statoil
Steelhead LNG
Sui Southern Gas
Talisman Energy
Tamil Nadu Industrial Development Corporation (Tidco)
Taranto LNG
Technip
Terasen
Terminal KMS de GNL
Terminale GNL Adriatico SRL
Texas LNG
Thunderbird LNG
Toho Gas
Tohoku Electric Power Co
Tokyo Electric Power (TEPCO)
Tokyo Gas
TonenGeneral
TOTAL
TransCanada
Trieste LNG
Tullow Oil
Ube Industries
Fenosa Gas
Venture Global
Veresen Inc
Vopak
Westpac Terminals
Wheatstone LNG
Woodfibre
Woodside
Woodside Petroleum
Yemen Gas Co
Yemen LNG (YLNG)
ZHA FLNG Purchaser
Zhejiang Energy Group Co Ltd
Other Organisations Mentioned in This Report
Alaska State Government
British Geological Survey (BGS)
China’s Ministry of Land and Resources
Cypriot Government
Dubai Supply Authority (Dusup)
Electricity Generating Authority of Thailand (EGAT)
Environmental Protection Agency (EPA)
Gazprom bank
Government of Brunei
Government of Canada
Government of Mexico
Government of PNG
Government of Russia
Indian financial institutions
International Atomic Energy Agency (IAEA)
International Monetary Fund (IMF)
Japan's Ministry of Economy, Trade and Industry (METI)
Ministry of Water Resources
Omani Government
Russian Development Bank
Russian National Wealth Fund
Sarawak State Government
Singapore Energy Market Authority (EMA)
State Government of Johor
UK Government
UN Security Council
UPS
US Federal Authorities
VEB
World Bank
Download sample pages
Complete the form below to download your free sample pages for Liquefied Natural Gas (LNG) Infrastructure Market 2017-2027
Related reports
-

Top 20 Small-Scale Liquified Natural Gas (SSLNG) Companies 2019
Small Scale LNG is used to supply small or isolated demand centers not connected to pipeline infrastructure, small scale LNG...
Full DetailsPublished: 24 January 2019 -
The Top 20 LNG Infrastructure Companies 2019
There are a number of exciting LNG liquefaction prospects around the world, both under construction and prospective.
...Full DetailsPublished: 11 March 2019 -

Liquefied Natural Gas (LNG) Carrier Market 2018-2028
Visiongain has calculated that the LNG Carrier market will see a capital expenditure (CAPEX) of $11,208 mn in 2018.Read on...
Full DetailsPublished: 13 February 2018 -

Small Scale Liquefied Natural Gas (LNG) Market Forecast 2018-2028
Visiongain has calculated that the global Small Scale Liquefied Natural Gas (LNG) Market will see a capital expenditure (CAPEX) of...
Full DetailsPublished: 05 February 2018 -
LNG Yearbook 2018: The Ultimate Guide to Liquefied Natural Gas Infrastructure 2018-2028
The definitive LNG Yearbook 2018 is the ultimate reference source for the liquefied natural gas industry. The yearbook indicates that...
Full DetailsPublished: 14 June 2018 -

Floating Liquefied Natural Gas (FLNG) Market Report 2018-2028
This latest report by business intelligence provider visiongain assesses that Floating Liquefied Natural Gas spending will reach $9.6bn in 2018.
...Full DetailsPublished: 28 June 2018
Download sample pages
Complete the form below to download your free sample pages for Liquefied Natural Gas (LNG) Infrastructure Market 2017-2027
Do you have any custom requirements we can help you with?
Any specific country, geo region, market segment or specific company information?
Email us today, we can discuss your needs and see how we can help: jamie.roberts@visiongain.com
Would you like a free report overview of the report of your choice?
If so, please drop an email to Jamie Roberts stating your chosen report title to jamie.roberts@visiongain.com
Visiongain energy reports are compiled using a broad and rich mixture of both primary and secondary information to produce an overall industry outlook. In order to provide our clients with the best product possible product, we do not rely on any one single source of information. Visiongain analysts reach out to market-leading vendors and industry experts where possible but also review a wealth of financial data and product information from a vast range of sources. To find out more about our reports methodology, please email jamie.roberts@visiongain.com
Would you like to get the latest Visiongain energy reports catalogue?
What are the dynamic growth sectors? where are the regional business opportunities?
Which technologies will prevail and who are the leading companies succeeding in these sectors and why?
If you want definitive answers to business critical questions, discover Visiongain’s full range of business intelligence reports.
If so, please email Jamie Roberts on jamie.roberts@visiongain.com or call her today on +44 207 336 6100
“The Visiongain report was extremely insightful and helped us construct our basic go-to market strategy for our solution.”
H.
“F.B has used Visiongain to prepare two separate market studies on the ceramic proppants market over the last 12 months. These reports have been professionally researched and written and have assisted FBX greatly in developing its business strategy and investment plans.”
F.B
“We just received your very interesting report on the Energy Storage Technologies (EST) Market and this is a very impressive and useful document on that subject.”
I.E.N
“Visiongain does an outstanding job on putting the reports together and provides valuable insight at the right informative level for our needs. The EOR Visiongain report provided confirmation and market outlook data for EOR in MENA with the leading countries being Oman, Kuwait and eventually Saudi Arabia.”
E.S
“Visiongain produced a comprehensive, well-structured GTL Market report striking a good balance between scope and detail, global and local perspective, large and small industry segments. It is an informative forecast, useful for practitioners as a trusted and upto-date reference.”
Y.N Ltd
Association of Dutch Suppliers in the Oil & Gas Industry
Society of Naval Architects & Marine Engineers
Association of Diving Contractors
Association of Diving Contractors International
Associazione Imprese Subacquee Italiane
Australian Petroleum Production & Exploration Association
Brazilian Association of Offshore Support Companies
Brazilian Petroleum Institute
Canadian Energy Pipeline
Diving Medical Advisory Committee
European Diving Technology Committee
French Oil and Gas Industry Council
IMarEST – Institute of Marine Engineering, Science & Technology
International Association of Drilling Contractors
International Association of Geophysical Contractors
International Association of Oil & Gas Producers
International Chamber of Shipping
International Shipping Federation
International Marine Contractors Association
International Tanker Owners Pollution Federation
Leading Oil & Gas Industry Competitiveness
Maritime Energy Association
National Ocean Industries Association
Netherlands Oil and Gas Exploration and Production Association
NOF Energy
Norsk olje og gass Norwegian Oil and Gas Association
Offshore Contractors’ Association
Offshore Mechanical Handling Equipment Committee
Oil & Gas UK
Oil Companies International Marine Forum
Ontario Petroleum Institute
Organisation of the Petroleum Exporting Countries
Regional Association of Oil and Natural Gas Companies in Latin America and the Caribbean
Society for Underwater Technology
Society of Maritime Industries
Society of Petroleum Engineers
Society of Petroleum Enginners – Calgary
Step Change in Safety
Subsea UK
The East of England Energy Group
UK Petroleum Industry Association
All the events postponed due to COVID-19.
Latest Energy news
Visiongain Publishes Carbon Capture Utilisation and Storage (CCUS) Market Report 2024-2034
The global carbon capture utilisation and storage (CCUS) market was valued at US$3.75 billion in 2023 and is projected to grow at a CAGR of 20.6% during the forecast period 2024-2034.
19 April 2024
Visiongain Publishes Liquid Biofuels Market Report 2024-2034
The global Liquid Biofuels market was valued at US$90.7 billion in 2023 and is projected to grow at a CAGR of 6.7% during the forecast period 2024-2034.
03 April 2024
Visiongain Publishes Hydrogen Generation Market Report 2024-2034
The global Hydrogen Generation market was valued at US$162.3 billion in 2023 and is projected to grow at a CAGR of 3.7% during the forecast period 2024-2034.
28 March 2024
Visiongain Publishes Biofuel Industry Market Report 2024-2034
The global Biofuel Industry market was valued at US$123.2 billion in 2023 and is projected to grow at a CAGR of 7.6% during the forecast period 2024-2034.
27 March 2024
