Industries > Defence > US Border Security Market Report 2019-2029

US Border Security Market Report 2019-2029
Forecasts by (Perimeter Surveillance and Detection Systems, Biometrics & ICT Systems, Unmanned Systems, Manned Platforms, Physical Infrastructure Support and Other Services) for Ground, Aerial and Naval Platforms Opportunities for Leading Companies Offering Technological Solutions UAVs, EO/IR, IT etc.
5 Reasons why you must order and read this report today:
• Highlights key business segments in order to assist key players across value chain companies to realign their business strategies.
• The key findings and recommendations highlight crucial progressive market trends in the US Border Security market, thereby assisting players to form data based decision making.
• Develop/modify business expansion plans by using substantial growth offering developed and emerging markets.
• Scrutinize in-depth regional market trends and outlook coupled with the macroeconomic factors driving the market, as well as those hindering it
• Information of more than 100 recent contracts in the U.S. Border Security market will help the players to identify revenue generating areas
Read on to discover how this definitive report can transform your own research and save you time.
This independent, 294 page report guarantees you will remain better informed than your competition. With more than 122 tables and figures examining the U.S. Border Security market space, the report gives you a visual, one-stop breakdown of your market. PLUS capital expenditure forecasts, as well as analysis, from 2019-2029 keeps your knowledge that one step ahead that you require to succeed.
This report is essential reading for you or anyone in the aerospace and defence sector with an interest in Border Security Market. Purchasing this report today will help you to recognise those important market opportunities and understand the possibilities there. I look forward to receiving your order.
Report highlights
• 200 quantitative tables, charts, and graphs
• More than 120 contracts detailed
• Analysis of key players in U.S Border Security Market 2019
• The Boeing Company
• Lockheed Martin Corporation
• General Dynamics Corporation
• Northrop Grunman
• The Raytheon Company
• Textron Inc.
• Leidos Holdings
• L-3 Technologies
• Harris Corporation
• Rockwell Collins Inc
• Elbit Systems
• FLIR
• The Boeing Company
• U.S. Border Security Market 2019
• Market Segments analysed in U.S.
• Detained information of significant contracts
• Latest Information on Mergers and acquisitions in the target market
• Comprehensive detailed recent developments in U.S. Border Security Market
• Enhanced contract tables / project / programme lists – detail how
• New factors analysed – regulation, technological changes, macroeconomic issues
• Brand new forecasts and analysis
• Key questions answered
• What does the future hold for the companies in the U.S. Border Security Companies Market?
• Where should you target your business strategy?
• Which applications should you focus upon?
• Which disruptive technologies should you invest in?
• Which companies should you form strategic alliances with?
• Which company is likely to success and why?
• What business models should you adopt?
• What industry trends should you be aware of?
• Target audience
• Border Security Solution providers
• Suppliers
• Contractors
• Technologists
• R&D staff
• Consultants
• Analysts
• CEO’s
• CIO’s
• COO’s
• Business development managers
• Investors
• Governments
• Agencies
• Aerospace and Defense Industry organisation
Visiongain is a trading partner with the US Federal Government
CCR Ref number: KD4R6
1. Report Overview
1.1. US Border Security Market Overview
1.2. Why You Should Read This Report
1.3. How This Report Delivers
1.4. Key Questions Answered by This Analytical Report Include:
1.5. Who is This Report For?
1.6. Methodology
1.6.1. Primary Research
1.6.2. Secondary Research
1.6.3. Market Evaluation & Forecasting Methodology
1.7. Frequently Asked Questions (FAQ)
1.8. Associated Visiongain Reports
1.9. About Visiongain
2. Introduction to the US Border Security Market
2.1. US Border Security Market Structure
2.2. US Border Security Market Structure By Environment
2.3. US Border Security Market Definition
2.4. US Border Security Submarkets Definition
2.4.1. US Border Security Perimeter Surveillance and Detection Systems Submarket Definition
2.4.2. US Border Security Biometrics & ICT Systems Submarket Definition
2.4.3. US Border Security Manned Platforms Submarket Definition
2.4.4. US Border Security Unmanned Systems Submarket Definition
2.4.5. US Border Security Physical Infrastructure, Support and Other Services Submarket Definition
3. US Border Security Market 2019-2029
3.1. US Border Security Market Forecast 2019-2029
3.2. US Border Security Drivers & Restraints 2019
3.3. Selected US Border Security Market Contracts 2006-2017
4. US Border Security Submarket Forecast 2019-2029
4.1. US Border Security Perimeter Surveillance and Detection Systems Forecast 2019-2029
4.1.1. The Uncertain Promise of the US-Mexico Border ‘Wall’
4.2. US Border Security Biometrics & ICT Systems Forecast 2019-2029
4.2.1. Strong Promise within the IT Market
4.3. US Border Security Manned Platforms Forecast 2019-2029
4.3.1. Steady Growth of High Value Product Expenditure
4.4. US Border Security Unmanned Systems Forecast 2019-2029
4.4.1. Continued Strong Growth of Unmanned Systems Submarket
4.5. US Border Security Physical Infrastructure, Support and Other Services Forecast 2019-2029
4.5.1. 4.5.1 Steady Growth of Physical and Support Service Submarket
5. US Border Security Submarket By Enviornment Forecast 2019-2029
5.1. US Border Security Ground Environment Forecast 2019-2029
5.2. US Border Security Aerial Environment Forecast 2019-2029
5.3. US Border Security Naval Environment Forecast 2019-2029
6. US Border Security Analysis 2018
6.1. Major US Border Security Issues 2018
6.2. Major US Border Security Organisations 2018
6.2.1. Department of Homeland Security (DHS)
6.2.2. Department of Customs and Border Protection (CBP)
6.2.3. Department of State (DOS)
6.2.4. Department of Defence (DOD)
6.3. US Border Security Future Threats
7. SWOT Analysis of the US Border Security Market 2019-2029
8. PEST Analysis of the US Border Security Market 2019-2029
9. Leading 12 US Border Security Companies
9.1. Leading 12 US Border Security Company Sales Share Analysis 2018
10. U.S. Border Securtiy Market – Company Profiles
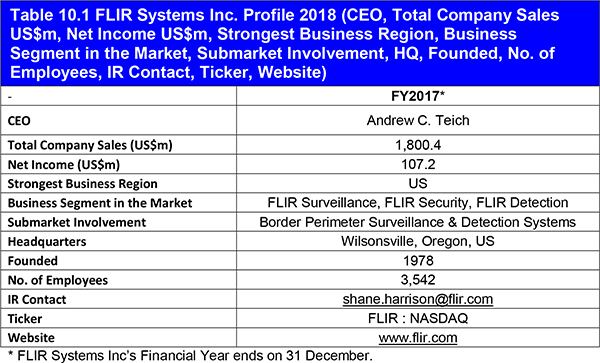
10.1. FLIR Systems Inc.
10.1.1. FLIR Systems Inc. Border Security Selected Recent Contracts & Programmes 2009-2018
10.1.2. FLIR Systems Inc. Total Company Sales & Sales in the Market 2013-2017
10.1.3. FLIR Systems Inc. Sales by Segment of Business 2013-2017
10.1.4. FLIR Systems Inc. Net Income 2013-2017
10.1.5. FLIR Systems Inc. Regional Emphasis
10.1.6. FLIR Systems Inc. Organisational Structure / Notable Subsidiaries
10.1.7. FLIR Systems Inc. Border Security Products / Services
10.1.8. FLIR Systems Inc Primary Market Competitors 2018
10.1.9. FLIR Systems Inc Mergers & Acquisitions (M&A) Activity
10.1.10. FLIR Systems Inc SWOT Analysis 2018
10.1.11. FLIR Systems Inc Analysis
10.1.12. FLIR Systems Inc: Position and Operations in the Border Security Market
10.2. General Dynamics Corporation
10.2.1. General Dynamics Corporation Border Security Selected Recent Contracts & Programmes 2012-2018
10.2.2. General Dynamics Corporation Total Company Sales 2013-2017
10.2.3. General Dynamics Corporation Sales by Segment of Business 2013-2017
10.2.4. General Dynamics Corporation Net Income 2013-2017
10.2.5. General Dynamics Corporation Regional Emphasis
10.2.6. General Dynamics Corporation Organisational Structure / Notable Subsidiaries
10.2.7. General Dynamics Corporation Border Security Products / Services
10.2.8. General Dynamics Corporation Primary Market Competitors 2018
10.2.9. General Dynamics Corporation Mergers & Acquisitions (M&A) Activity
10.2.10. General Dynamics Corporation SWOT Analysis 2018
10.2.11. General Dynamics Corporation Analysis
10.2.12. General Dynamics Corporation: Position and Operations in the Border Security Market
10.3. Harris Corporation
10.3.1. Harris Corporation Border Security Selected Recent Contracts & Programmes 2013-2018
10.3.2. Harris Corporation Total Company Sales 2013-2017
10.3.3. Harris Corporation Sales by Segment of Business 2016-2017
10.3.4. Harris Corporation Net Income 2013-2017
10.3.5. Harris Corporation Regional Emphasis
10.3.6. Harris Corporation Organisational Structure / Notable Subsidiaries
10.3.7. Harris Corporation Border Security Products / Services
10.3.8. Harris Corporation Primary Market Competitors 2018
10.3.9. Harris Corporation Mergers & Acquisitions (M&A) Activity
10.3.10. Harris Corporation SWOT Analysis 2018
10.3.11. Harris Corporation Analysis
10.3.12. Harris Corporation: Position and Operations in the Border Security Market)
10.4. L-3 Technologies Inc.
10.4.1. L-3 Technologies Inc. Border Security Selected Recent Contracts & Programmes 2011-2018
10.4.2. L-3 Technologies Inc. Total Company Sales 2013-2017
10.4.3. L-3 Technologies Inc. Sales by Segment of Business 2013-2017
10.4.4. L-3 Technologies Inc. Net Income 2013-2017
10.4.5. L-3 Technologies Inc. Regional Emphasis
10.4.6. L-3 Technologies Inc. Organisational Structure / Notable Subsidiaries
10.4.7. L-3 Technologies Inc. Border Security Products / Services
10.4.8. L-3 Technologies Inc. Primary Market Competitors 2018
10.4.9. L-3 Technologies Inc. Mergers & Acquisitions (M&A) Activity
10.4.10. L-3 Technologies Inc. SWOT Analysis 2018
10.4.11. L-3 Technologies Inc. Analysis
10.4.12. L-3 Technologies Inc.: Position and Operations in the Border Security Market
10.5. Leidos Holdings Inc
10.5.1. Leidos Holdings Inc Border Security Selected Recent Contracts & Programmes 2013 - 2018
10.5.2. Leidos Holdings Inc Total Company Sales 2013-2017
10.5.3. Leidos Holdings Inc Sales by Segment of Business 2013-2017
10.5.4. Leidos Holdings Inc Net Income / Loss 2013-2017
10.5.5. Leidos Holdings Inc Regional Emphasis
10.5.6. Leidos Holdings Inc Organisational Structure / Notable Subsidiaries
10.5.7. Leidos Holdings Inc Border Security Products / Services
10.5.8. Leidos Holdings Inc Primary Market Competitors 2018
10.5.9. Leidos Holdings Inc Mergers & Acquisitions (M&A) Activity
10.5.10. Leidos Holdings Inc SWOT Analysis 2018
10.5.11. Leidos Holdings Inc Analysis
10.5.12. Leidos Holdings Inc: Position and Operations in the Border Security Market
10.6. Lockheed Martin Corporation
10.6.1. Lockheed Martin Corporation Border Security Selected Recent Contracts & Programmes 2010-2015
10.6.2. Lockheed Martin Corporation Total Company Sales 2013-2017
10.6.3. Lockheed Martin Corporation Sales by Segment of Business 2013-2017
10.6.4. Lockheed Martin Corporation Net Income 2013-2017
10.6.5. Lockheed Martin Corporation Regional Emphasis
10.6.6. Lockheed Martin Corporation Organisational Structure / Notable Subsidiaries
10.6.7. Lockheed Martin Corporation Border Security Products / Services
10.6.8. Lockheed Martin Corporation Primary Market Competitors 2018
10.6.9. Lockheed Martin Corporation Mergers & Acquisitions (M&A) Activity
10.6.10. Lockheed Martin Corporation SWOT Analysis 2018
10.6.11. Lockheed Martin Corporation Analysis
10.6.12. Lockheed Martin Corporation: Position and Operations in the Border Security Market
10.7. Northrop Grumman Corporation
10.7.1. Northrop Grumman Corporation Border Security Selected Recent Contracts & Programmes 2012-2017
10.7.2. Northrop Grumman Corporation Total Company Sales 2013-2017
10.7.3. Northrop Grumman Corporation Sales by Segment of Business 2013-2018
10.7.4. Northrop Grumman Corporation Net Income 2013-2018
10.7.5. Northrop Grumman Corporation Regional Emphasis
10.7.6. Northrop Grumman Corporation Organisational Structure / Notable Subsidiaries
10.7.7. Northrop Grumman Corporation Border Security Products / Services
10.7.8. Northrop Grumman Corporation Primary Market Competitors 2018
10.7.9. Northrop Grumman Corporation Mergers & Acquisitions (M&A) Activity
10.7.10. Northrop Grumman Corporation SWOT Analysis 2018
10.7.11. Northrop Grumman Corporation Analysis
10.7.12. Northrop Grumman Corporation: Position and Operations in the Border Security Market
10.8. The Raytheon Company
10.8.1. The Raytheon Company Border Security Selected Recent Contracts & Programmes 2011-2016
10.8.2. The Raytheon Company Total Company Sales 2013-2017
10.8.3. The Raytheon Company Sales by Segment of Business 2013-2017
10.8.4. The Raytheon Company Net Income 2013-2017
10.8.5. The Raytheon Company Regional Emphasis
10.8.6. The Raytheon Company Organisational Structure / Notable Subsidiaries
10.8.7. The Raytheon Company Border Security Products / Services
10.8.8. The Raytheon Company Primary Market Competitors 2018
10.8.9. The Raytheon Company Mergers & Acquisitions (M&A) Activity
10.8.10. The Raytheon Company SWOT Analysis 2018
10.8.11. The Raytheon Company Analysis
10.8.12. The Raytheon Company: Position and Operations in the Border Security Market
10.9. Rockwell Collins Inc
10.9.1. Rockwell Collins Inc Border Security Selected Recent Contracts & Programmes 2017
10.9.2. Rockwell Collins Inc Total Company Sales 2013-2017
10.9.3. Rockwell Collins Inc Sales by Segment of Business 2013-2017
10.9.4. Rockwell Collins Inc Net Income 2013-2017
10.9.5. Rockwell Collins Inc Regional Emphasis
10.9.6. Rockwell Collins Inc Organisational Structure / Notable Subsidiaries
10.9.7. Rockwell Collins Inc Border Security Products / Services
10.9.8. Rockwell Collins Inc Primary Market Competitors 2018
10.9.9. Rockwell Collins Inc Mergers & Acquisitions (M&A) Activity
10.9.10. Rockwell Collins Inc SWOT Analysis 2018
10.9.11. Rockwell Collins Inc Analysis
10.9.12. Rockwell Collins Inc: Position and Operations in the Border Security Market
10.10. Textron Inc
10.10.1. Textron Inc Border Security Selected Recent Contracts & Programmes 2014-2017
10.10.2. Textron Inc Total Company Sales 2013-2017
10.10.3. Textron Inc Sales by Segment of Business 2013-2017
10.10.4. Textron Inc Net Income 2013-2017
10.10.5. Textron Inc Regional Emphasis
10.10.6. Textron Inc Organisational Structure / Notable Subsidiaries
10.10.7. Textron Inc Border Security Products / Services
10.10.8. Textron Inc Primary Market Competitors 2018
10.10.9. Textron Inc Mergers & Acquisitions (M&A) Activity
10.10.10. Textron Inc SWOT Analysis 2018
10.10.11. Textron Inc Analysis
10.10.12. Textron Inc: Position and Operations in the Border Security Market
10.11. The Boeing Company
10.11.1. The Boeing Company Border Security Selected Recent Contracts & Programmes 2007-2018
10.11.2. The Boeing Company Total Company Sales 2013-2017
10.11.3. The Boeing Company Sales by Segment of Business 2013-2017
10.11.4. The Boeing Company Net Income 2013-2017
10.11.5. The Boeing Company Regional Emphasis
10.11.6. The Boeing Company Notable Subsidiaries
10.11.7. The Boeing Company Border Security Products / Services
10.11.8. The Boeing Company Primary Market Competitors 2019
10.11.9. The Boeing Company Analysis
10.11.10. Boeing Company Analysis: Position and Operations in the Border Security Market
10.12. Elbit Systems
10.12.1. Elbit Systems Border Security Selected Recent Contracts & Programmes 2013-2018
10.12.2. Elbit Systems Total Company Sales 2013-2017
10.12.3. Elbit Systems Sales by Segment of Business 2013-2017
10.12.4. Elbit Systems Net Income 2013-2017
10.12.5. Elbit Systems Regional Emphasis
10.12.6. Elbit Systems Organisational Subsidiaries
10.12.7. Elbit Systems Border Security Products / Services
10.12.8. Elbit Systems Primary Market Competitors 2019
10.12.9. Elbit Systems Mergers & Acquisitions (M&A) Activity
10.12.10. Elbit Systems SWOT Analysis 2019
10.12.11. Elbit Systems Analysis
10.12.12. Elbit Systems: Position and Operations in the Border Security Market
10.13. Other Companies Involved in the US Border Security Market 2018
11. Conclusions and Recommendations
11.1. Glossary
Associated Visiongain Reports
Visiongain Report Sales Order Form
Appendix A
About Visiongain
Appendix B
Visiongain report evaluation form
List of Table
Table 1.1 Example of US Border Security Market Forecast 2019-2029 (US$m, AGR %, Cumulative)
Table 1.2 Example of National US Border Security Market Forecast by Submarket 2019-2029 (US$m, AGR %, Cumulative)
Table 3.1 US Border Security Market Forecast 2019-2029 (US$m, AGR %, CAGR %, Cumulative)
Table 3.2 US Border Security Market Drivers & Restraints 2019
Table 3.3 Selected US Border Security Market Major Contracts 2006-2018 (Date, Company, Value US$m, Details)
Table 4.1 US Border Security Submarket Forecast 2019-2029 (US$m, AGR %, Cumulative)
Table 4.2 US Border Security Submarket CAGR Forecast 2019-2024, 2024-2029, 2019-2029 (CAGR %)
Table 4.3 US Border Security Perimeter Surveillance and Detection Systems Submarket Forecast 2019-2029 (US$m, AGR %, CAGR %, Cumulative)
Table 4.4 US Border Security Biometrics & ICT Systems Submarket Forecast 2019-2029 (US$m, AGR %, CAGR %, Cumulative)
Table 4.5 US Border Security Manned Platforms Submarket Forecast 2019-2029 (US$m, AGR %, CAGR %, Cumulative)
Table 4.6 US Border Security Unmanned Systems Submarket Forecast 2019-2029 (US$m, AGR %, CAGR %, Cumulative)
Table 4.7 US Border Security Physical Infrastructure, Support and Other Services Submarket Forecast 2019-2029 (US$m, AGR %, CAGR %, Cumulative)
Table 5.1 US Border Security Submarket Forecast By Environment 2019-2029 (US$m, AGR %, Cumulative)
Table 5.2 US Border Security Submarket CAGR Forecast By Environment 2019-2024, 2024-2029, 2019-2029 (CAGR %)
Table 5.3 US Border Security Ground Environment Submarket Forecast 2019-2029 (US$m, AGR %, CAGR %, Cumulative)
Table 5.4 US Border Security Aerial Environment Submarket Forecast 2019-2029 (US$m, AGR %, CAGR %, Cumulative)
Table 5.5 US Border Security Naval Environment Submarket Forecast 2019-2029 (US$m, AGR %, CAGR %, Cumulative)
Table 6.1 Territories of the United States of America 2018 (Territories, Status)
Table 6.2 Department of Homeland Security (DHS) Profile 2019 (Founded, Secretary, Budget US$m, Headquarters, Website)
Table 6.3 Selected Departments, Agencies and Offices of the Department of Department of Homeland Security (DHS)
Table 6.4 Department of Customs and Border Protection (CBP) Profile 2019 (Founded, Commissioner, Budget US$m, Headquarters, Website)
Table 6.5 Department of State (DOS) Profile 2019 (Founded, Secretary, Budget US$m, Headquarters, Website)
Table 6.6 Department of Defence (DOD) Profile 2018 (Founded, Secretary Budget US$m, Headquarters, Website)
Table 7.1 US Border Security Market SWOT Analysis 2019-2029
Table 8.1 US Border Security Market PEST Analysis 2019-2029
Table 9.1 Leading 12 US Border Security Companies Sales 2017 (Company, FY2017 Total Company Sales US$m, Primary Market Specialisation)
Table 10.1 FLIR Systems Inc. Profile 2017 (CEO, Total Company Sales US$m, Net Income US$m, Strongest Business Region, Business Segment in the Market, Submarket Involvement, HQ, Founded, No. of Employees, IR Contact, Ticker, Website)
Table 10.2 Selected Recent FLIR Systems Inc. Border Security Contracts & Programmes 2009-2018 (Date, Country, Value US$m, Product & Details)
Table 10.3 FLIR Systems Inc. Total Company Sales 2013-2017 (US$m, AGR%)
Table 10.4 FLIR Systems Inc. Sales by Segment of Business 2013-2017 (US$m, AGR%)
Table 10.5 FLIR Systems Inc. Net Income 2013-2017 (US$m, AGR%)
Table 10.6 FLIR Systems Inc. Sales by Geographical Location 2013-2017 (US$m, AGR%)
Table 10.7 FLIR Systems Inc. Notable Subsidiaries 2018 (Subsidiary, Location)
Table 10.8 FLIR Systems Inc. Border Security Products / Services (Segment of Business, Product, Specification / Features)
Table 10.9 FLIR Systems Inc Mergers and Acquisitions, and Partnership 2013-2016 (Date, Company Involved, Value US$m, Details)
Table 10.10 FLIR Systems Inc Strengths, Weaknesses, Opportunities & Threats Analysis 2018
Table 10.11 General Dynamics Corporation Profile 2017 (CEO, Total Company Sales US$m, Net Income US$m, Strongest Business Region, Business Segment in the Market, Submarket Involvement, HQ, Founded, No. of Employees, IR Contact, Ticker, Website)
Table 10.12 Selected Recent General Dynamics Corporation Border Security Contracts & Programmes 2012-2018 (Date, Country , Value US$m, Product & Details)
Table 10.13 General Dynamics Corporation Total Company Sales 2013-2017 (US$m, AGR%)
Table 10.14 General Dynamics Corporation Sales by Segment of Business 2013-2017 (US$m, AGR%)
Table 10.15 General Dynamics Corporation Net Income 2013-2017 (US$m, AGR%)
Table 10.16 General Dynamics Corporation Sales by Geographical Location 2013-2017 (US$m, AGR%)
Table 10.17 General Dynamics Corporation Notable Subsidiaries 2018 (Subsidiary, Location)
Table 10.18 General Dynamics Corporation Border Security Products / Services (Segment of Business, Product, Specification / Features)
Table 10.19 General Dynamics Notable Mergers and Acquisitions 2011-2018 (Date, Company Involved, Details)
Table 10.20 General Dynamics Divestitures 2011-2015 (Date, Company Involved, Details)
Table 10.22 General Dynamics Corporation Strengths, Weaknesses, Opportunities & Threats Analysis 2018
Table 10.23 Harris Corporation Profile 2017 (CEO, Total Company Sales US$m, Net Income US$m, Net Capital Expenditure US$m, Cost of Research & Development US$m, Order Backlog US$m, Strongest Business Region, Business Segment in the Market, Submarket Involvement, HQ, Founded, No. of Employees, IR Contact, Ticker, Website)
Table 10.24 Selected Recent Harris Corporation Border Security Contracts & Programmes 2013-2018 (Date, Country, Value US$m, Product & Details)
Table 10.25 Harris Corporation Total Company Sales 2013-2017 (US$m, AGR%)
Table 10.26 Harris Corporation Sales by Segment of Business 2016-2017 (US$m)
Table 10.27 Harris Corporation Net Income 2013-2017 (US$m, AGR%)
Table 10.28 Harris Corporation Sales by Geographical Location 2013-2017 (US$m, AGR%)
Table 10.29 Harris Corporation Notable Subsidiaries 2018(Subsidiary, Location)
Table 10.30 Harris Corporation Border Security Products / Services (Segment of Business, Product, Specification / Features)
Table 10.31 Harris Corporation Mergers and Acquisitions 2013-2017 (Date, Company Involved, Value US$m, Details)
Table 10.32 Harris Corporation Divestitures 2013-2016(Date, Company Involved, Details)
Table 10.33 Harris Corporation Strengths, Weaknesses, Opportunities & Threats Analysis 2018
Table 10.34 L-3 Technologies Inc. Profile 2017 (CEO, Total Company Sales US$m, Net Income US$m, Strongest Business Region, Business Segment in the Market, Submarket Involvement, HQ, Founded, No. of Employees, IR Contact, Ticker, Website)
Table 10.35 Selected Recent L-3 Technologies Inc. Border Security Contracts & Programmes 2011-2018 (Date, Country, Value US$m, Product & Details)
Table 10.36 L-3 Technologies Inc. Total Company Sales 2013-2017 (US$m, AGR%)
Table 10.37 L-3 Technologies Inc. Sales by Segment of Business 2013-2017 (US$m, AGR%)
Table 10.38 L-3 Technologies Inc. Net Income 2013-2017 (US$m, AGR%)
Table 10.39 L-3 Technologies Inc. Sales by Geographical Location 2013-2017 (US$m, AGR%)
Table 10.40 L-3 Technologies Inc. Notable Subsidiaries 2018 (Subsidiary, Location)
Table 10.41 L-3 Technologies Inc. Border Security Products / Services (Segment of Business, Product, Specification / Features)
Table 10.42 L-3 Technologies Inc. Mergers and Acquisitions 2012-2018 (Date, Company Involved, Value US$m, Details)
Table 10.43 L-3 Technologies Inc. Divestitures 2014-2018 (Date, Company Involved, Details)
Table 10.44 L-3 Technologies Inc. Strengths, Weaknesses, Opportunities & Threats Analysis 2018
Table 10.45 Leidos Holdings Inc Profile 2017(CEO, Total Company Sales US$m, Net Income / Loss US$m, Strongest Business Region, Business Segment in the Market, Submarket Involvement, HQ, Founded, No. of Employees, IR Contact, Ticker, Website)
Table 10.46 Selected Recent Leidos Holdings Inc Border Security Contracts & Programmes 2013 - 2018 (Date, Country, Value US$m, Product & Details)
Table 10.47 Leidos Holdings Inc Total Company Sales 2013-2017 (US$m, AGR%)
Table 10.48 Leidos Holdings Inc Sales by Segment of Business 2013-2017 (US$m, AGR%)
Table 10.49 Leidos Holdings Inc Net Income / Loss 2013-2017 (US$m, AGR%)
Table 10.50 Leidos Holdings Inc Notable Subsidiaries 2018 (Subsidiary, Location)
Table 10.51 Leidos Holdings Inc Border Security Products / Services (Segment of Business, Product, Specification / Features)
Table 10.52 Leidos Holdings Inc Mergers and Acquisitions 2016 (Date, Company Involved, Value US$m, Details)
Table 10.53 Leidos Holdings Inc Divestitures 2013-2015 (Date, Company Involved, Value US$m, Details)
Table 4.103 Leidos Holdings Inc Strengths, Weaknesses, Opportunities & Threats Analysis 2018
Table 10.54 Lockheed Martin Corporation Profile 2017 (CEO, Total Company Sales US$m, Net Income US$m, Net Capital Expenditure US$m, Cost of Research & Development US$m, Order Backlog US$m, Strongest Business Region, Business Segment in the Market, Submarket Involvement, HQ, Founded, No. of Employees, IR Contact, Ticker, Website)
Table 10.55 Selected Recent Lockheed Martin Corporation Border Security Contracts & Programmes 2010-2015 (Date, Country , Value US$m, Product & Details)
Table 10.56 Lockheed Martin Corporation Total Company Sales 2013-2017 (US$m, AGR%)
Table 10.57 Lockheed Martin Corporation Sales by Segment of Business 2013-2017 (US$m, AGR%)
Table 10.58 Lockheed Martin Corporation Net Income 2010-2017 (US$m, AGR%)
Table 10.59 Lockheed Martin Corporation Sales by Geographical Location 2013-2017 (US$m, AGR%)
Table 10.60 Lockheed Martin Corporation Notable Subsidiaries 2018 (Subsidiary, Location)
Table 10.61 Lockheed Martin Corporation Border Security Products / Services (Segment of Business, Product, Specification / Features)
Table 10.62 Lockheed Martin Corporation Mergers and Acquisitions 2012-2015 (Date, Company Involved, Details)
Table 10.63 Lockheed Martin Corporation Divestitures 2010-2011 (Date, Company Involved, Details)
Table 10.64 Lockheed Martin Corporation Strengths, Weaknesses, Opportunities & Threats Analysis 2018
Table 10.65 Northrop Grumman Corporation Profile 2017 (CEO, Total Company Sales US$m, Net Income US$m, Net Capital Expenditure US$m, Cost of Research & Development US$m, Order Backlog US$m, Strongest Business Region, Business Segment in the Market, Submarket Involvement, HQ, Founded, No. of Employees, IR Contact, Ticker, Website)
Table 10.66 Selected Recent Northrop Grumman Corporation Border Security Contracts & Programmes 2012-2017 (Date, Country, Value US$m, Product & Details)
Table 10.67 Northrop Grumman Corporation Total Company Sales 2013-2017 (US$m, AGR%)
Table 10.68 Northrop Grumman Corporation Sales by Segment of Business 2013-2018 (US$m, AGR%)
Table 10.69 Northrop Grumman Corporation Net Income 2013-2018 (US$m, AGR%)
Table 10.70 Northrop Grumman Corporation Sales by Geographical Location 2013-2017 (US$m, AGR%)
Table 10.71 Northrop Grumman Corporation Notable Subsidiaries 2018 (Subsidiary, Location)
Table 10.72 Northrop Grumman Corporation Border Security Products / Services (Segment of Business, Product, Specification / Features)
Table 10.73 Northrop Grumman Corporation Mergers and Acquisitions 2013-2018 (Date, Company Involved, Value US$m, Details)
Table 10.74 Northrop Grumman Corporation Strengths, Weaknesses, Opportunities & Threats Analysis 2018
Table 10.75 The Raytheon Company Profile 2017 (CEO, Total Company Sales US$m, Net Income US$m, Net Capital Expenditure US$m, Cost of Research & Development US$m, Order Backlog US$m, Strongest Business Region, Business Segment in the Market, Submarket Involvement, HQ, Founded, No. of Employees, IR Contact, Ticker, Website)
Table 10.76 Selected Recent The Raytheon Company Border Security Contracts & Programmes 2011-2016 (Date, Country , Value US$m, Product & Details)
Table 10.77 The Raytheon Company Total Company Sales 2013-2017 (US$m, AGR%)
Table 10.78 The Raytheon Company Sales by Segment of Business 2013-2017 (US$m, AGR%)
Table 10.79 The Raytheon Company Net Income 2013-2017 (US$m, AGR%)
Table 10.80 The Raytheon Company Sales by Geographical Location 2013-2017 (US$m, AGR%)
Table 10.81 The Raytheon Company Notable Subsidiaries 2018 (Subsidiary, Location)
Table 10.82 The Raytheon Company Border Security Products / Services (Segment of Business, Product, Specification / Features)
Table 10.83 The Raytheon Company Mergers and Acquisitions 2013-2017 (Date, Company Involved, Value US$m, Details)
Table 10.84 The Raytheon Company Divestitures 2014 (Date, Details)
Table 10.85 The Raytheon Company Strengths, Weaknesses, Opportunities & Threats Analysis 2018
Table 10.86 Rockwell Collins Inc Profile 2017 (CEO, Total Company Sales US$m, Net Income US$m, Net Capital Expenditure US$m, Cost of Research & Development US$m, Order Backlog US$m, Strongest Business Region, Business Segment in the Market, Submarket Involvement, HQ, Founded, No. of Employees, IR Contact, Ticker, Website)
Table 10.87 Selected Recent Rockwell Collins Inc Border Security Contracts & Programmes 2017 (Date, Country, Value US$m, Product & Details)
Table 10.88 Rockwell Collins Inc Total Company Sales 2013-2017 (US$m, AGR%)
Table 10.89 Rockwell Collins Inc Sales by Segment of Business 2013-2017 (US$m, AGR%)
Table 10.90 Rockwell Collins Inc Net Income 2013-2017 (US$m, AGR%)
Table 10.91 Rockwell Collins Inc Sales by Geographical Location 2013-2017 (US$m, AGR%)
Table 10.92 Rockwell Collins Inc Notable Subsidiaries 2018 (Subsidiary, Location)
Table 10.93 Rockwell Collins Inc Border Security Products / Services (Segment of Business, Product, Specification / Features)
Table 10.94 Rockwell Collins Inc Mergers and Acquisitions 2011-2015 (Date, Company Involved, Value US$m)
Table 10.95 Rockwell Collins Inc Divestitures 2013-2015 (Date, Company Involved, Details)
Table 10.96 Rockwell Collins Inc Strengths, Weaknesses, Opportunities & Threats Analysis 2018
Table 10.97 Textron Inc Profile 2017 (CEO, Total Company Sales US$m, Net Income US$m, Net Capital Expenditure US$m, Cost of Research & Development US$m, Order Backlog US$m, Strongest Business Region, Business Segment in the Market, Submarket Involvement, HQ, Founded, No. of Employees, IR Contact, Ticker, Website)
Table 10.98 Selected Recent Textron Inc Border Security Contracts & Programmes 2014-2017 (Date, Country, Value US$m, Product & Details)
Table 10.99 Textron Inc Total Company Sales 2013-2017 (US$m, AGR%)
Table 10.100 Textron Inc Sales by Segment of Business 2013-2017 (US$m, AGR%)
Table 10.101 Textron Inc Net Income 2013-2017 (US$m, AGR%)
Table 10.102 Textron Inc Sales by Geographical Location 2013-2017 (US$m, AGR%)
Table 10.103 Textron Inc Notable Subsidiaries 2018 (Subsidiary, Location)
Table 10.104 Textron Inc Border Security Products / Services (Segment of Business, Product, Specification / Features)
Table 10.105 Textron Inc Mergers and Acquisitions 2013-2018 (Date, Company Involved, Details)
Table 10.106 Textron Inc Strengths, Weaknesses, Opportunities & Threats Analysis 2018
Table 10.107 The Boeing Company Profile 2017 (CEO, Total Company Sales US$m, Net Income US$m, Strongest Business Region, Business Segment in the Market, Submarket Involvement, HQ, Founded, No. of Employees, IR Contact, Ticker, Website)
Table 10.108 Selected Recent Boeing Company Border Security Contracts & Programmes 2007-2018 (Date, Country, Value US$m, Product & Details)
Table 10.109 The Boeing Company Total Company Sales 2013-2017 (US$m, AGR%)
Table 10.110 The Boeing Company Net Income 2013-2017 (US$m, AGR%)
Table 10.111 The Boeing Company Sales by Geographical Location 2013-2017 (US$m, AGR%)
Table 10.112 The Boeing Company Notable Subsidiaries 2019 (Subsidiary, Location)
Table 10.113 The Boeing Company Border Security Products / Services (Segment of Business, Product)
Table 10.114 The Boeing Company Border Security Products / Services (Segment of Business, Product)
Table 10.115 Elbit Systems Profile 2017 (CEO, Total Company Sales US$m, Net Income US$m, Net Capital Expenditure US$m, Cost of Research & Development US$m, Order Backlog US$m, Strongest Business Region, Business Division in the Market, Submarket Involvement, HQ, Founded, No. of Employees, IR Contact, Ticker, Website)
Table 10.116 Selected Recent Elbit Systems Border Security Contracts & Programmes 2013-2018 (Date, Country, Value US$m, Product & Details)
Table 10.117 Elbit Systems Total Company Sales 2013-2017 (US$m, AGR%)
Table 10.118 Elbit Systems Sales by Segment of Business 2013-2017 (US$m, AGR%)
Table 10.119 Elbit Systems Net Income 2013-2017 (US$m, AGR%)
Table 10.120 Elbit Systems Sales by Geographical Location 2013-2017 (US$m, AGR%)
Table 10.121 Elbit Systems Notable Subsidiaries 2019 (Subsidiary, Location)
Table 10.122 Elbit Systems Border Security Products / Services (Segment of Business, Product, Specification / Features)
Table 10.123 Elbit Systems Notable Mergers and Acquisitions 2013-2018 (Date, Company Involved, Details)
Table 10.124 Elbit Systems Notable Divestitures 2013-2014 (Date, Company Involved, Details)
Table 10.125 Elbit Systems Strengths, Weaknesses, Opportunities & Threats Analysis 2019
Table 10.126 Other Companies Involved in the US Border Security Market 2018 (Company, Submarket Involvement)
List of Figure
Figure 1.1 US Border Security Submarket Share Forecast 2019 (% Share)
Figure 1.2 Example of National US Border Security Market by Submarket Forecast 2019-2029 (US$m, AGR %)
Figure 2.1 US Border Security Market Segmentation Overview
Figure 2.2 US Border Security Market Segmentation By Environment Overview
Figure 3.1 US Border Security Market Forecast 2019-2029 (US$m, AGR %)
Figure 4.1 US Border Security Submarket AGR Forecast 2019-2029 (AGR %)
Figure 4.2 US Border Security Submarket Forecast 2019-2029 (US$m, AGR %)
Figure 4.3 US Border Security Submarket Share Forecast 2019 (% Share)
Figure 4.4 US Border Security Submarket Share Forecast 2024 (% Share)
Figure 4.5 US Border Security Submarket Share Forecast 2029 (% Share)
Figure 4.6 US Border Security Perimeter Surveillance and Detection Systems Submarket Forecast 2019-2029 (US$m, AGR %)
Figure 4.7 US Border Security Biometrics & ICT Systems Submarket Forecast 2019-2029 (US$m, AGR %)
Figure 4.8 US Border Security Manned Platforms Submarket Forecast 2019-2029 (US$m, AGR %)
Figure 4.9 US Border Security Unmanned Systems Submarket Forecast 2019-2029 (US$m, AGR %)
Figure 4.10 US Border Security Physical Infrastructure, Support and Other Services Submarket Forecast 2019-2029 (US$m, AGR %)
Figure 5.1 US Border Security Submarket AGR Forecast By Enviornment 2019-2029 (AGR %)
Figure 5.2 US Border Security Submarket Forecast By Environment 2019-2029 (US$m, AGR %)
Figure 5.3 US Border Security Submarket Share Forecast By Environment 2019 (% Share)
Figure 5.4 US Border Security Submarket Share Forecast By Environment 2024 (% Share)
Figure 5.5 US Border Security Submarket Share Forecast By Environment 2029 (% Share)
Figure 5.6 US Border Security Ground Environment Submarket Forecast 2019-2029 (US$m, AGR %)
Figure 5.7 US Border Security Aerial Environment Submarket Forecast 2019-2029 (US$m, AGR %)
Figure 5.8 US Border Security Naval Environment Submarket Forecast 2019-2029 (US$m, AGR %)
Figure 6.1 US Border Security Regional Map
Figure 6.2 US Border Security Land Borders Map
Figure 6.3 US Border Security Coastal Borders Map
Figure 6.4 Major US Border Security Issues 2018
Figure 6.5 Major US Border Security Organisations 2018
Figure 6.6 US Border Security Emerging Threats
Figure 10.1 FLIR Systems Inc. Total Company Sales 2013-2017 (US$m, AGR%)
Figure 10.2 FLIR Systems Inc. Sales by Segment of Business 2013-2017 (US$m)
Figure 10.3 FLIR Systems Inc. Net Income 2013-2017 (US$m, AGR%)
Figure 10.4 FLIR Systems Inc. Primary International Operations 2018
Figure 10.5 FLIR Systems Inc. Sales by Geographical Location 2013-2017 (US$m)
Figure 10.6 FLIR Systems Inc. Organisational Structure 2018
Figure 10.7 FLIR Systems Inc Primary Market Competitors 2018
Figure 10.8 General Dynamics Corporation Total Company Sales 2013-2017 (US$m, AGR%)
Figure 10.9 General Dynamics Corporation Sales by Segment of Business 2013-2017 (US$m)
Figure 10.10 General Dynamics Corporation Net Income 2013-2017 (US$m, AGR%)
Figure 10.11 General Dynamics Corporation Primary International Operations 2018
Figure 10.12 General Dynamics Corporation Sales by Geographical Location 2013-2017 (US$m)
Figure 10.13 General Dynamics Corporation Organisational Structure 2018
Figure 10.14 General Dynamics Corporation Primary Market Competitors 2018
Figure 10.15 Harris Corporation Total Company Sales 2013-2017 (US$m, AGR%)
Figure 10.16 Harris Corporation Sales by Segment of Business 2016-2017 (US$m)
Figure 10.17 Harris Corporation Net Income 2013-2017 (US$m, AGR%)
Figure 10.18 Harris Corporation Primary International Operations 2018
Figure 10.19 Harris Corporation Sales by Geographical Location 2013-2017 (US$m)
Figure 10.20 Harris Corporation Organisational Structure 2018
Figure 10.21 Harris Corporation Primary Market Competitors 2018
Figure 10.22 L-3 Technologies Inc. Total Company Sales 2013-2017 (US$m, AGR%)
Figure 10.23 L-3 Technologies Inc. Sales by Segment of Business 2013-2017 (US$m)
Figure 10.24 L-3 Technologies Inc. Net Income 2013-2017 (US$m, AGR%)
Figure 10.25 L-3 Technologies Inc. Primary International Operations 2018
Figure 10.26 L-3 Technologies Inc. Sales by Geographical Location 2013-2017 (US$m)
Figure 10.27 L-3 Technologies Inc. Organisational Structure 2018
Figure 10.28 L-3 Technologies Inc. Primary Market Competitors 2018
Figure 10.29 Leidos Holdings Inc Total Company Sales 2013-2017 (US$m, AGR%)
Figure 10.30 Leidos Holdings Inc Sales by Segment of Business 2013-2017 (US$m)
Figure 10.31 Leidos Holdings Inc Primary International Operations 2018
Figure 10.32 Leidos Holdings Inc Organisational Structure 2018
Figure 10.33 Leidos Holdings Inc Primary Market Competitors 2018
Figure 10.34 Lockheed Martin Corporation Total Company Sales 2013-2017 (US$m, AGR%)
Figure 10.35 Lockheed Martin Corporation Sales by Segment of Business 2013-2017 (US$m)
Figure 10.36 Lockheed Martin Corporation Net Income 2013-2017 (US$m, AGR%)
Figure 10.37 Lockheed Martin Corporation Primary International Operations 2018
Figure 10.38 Lockheed Martin Corporation Sales by Geographical Location 2013-2017 (US$m)
Figure 10.39 Lockheed Martin Corporation Organisational Structure 2018
Figure 10.40 Lockheed Martin Corporation Primary Market Competitors 2018
Figure 10.41 Northrop Grumman Corporation Total Company Sales 2013-2017 (US$m, AGR%)
Figure 10.42 Northrop Grumman Corporation Sales by Segment of Business 2013-2017 (US$m)
Figure 10.43 Northrop Grumman Corporation Net Income 2013-2017 (US$m, AGR%)
Figure 10.44 Northrop Grumman Corporation Primary International Operations 2018
Figure 10.45 Northrop Grumman Corporation Sales by Geographical Location 2013-2018 (US$m)
Figure 10.46 Northrop Grumman Corporation Organisational Structure 2018
Figure 10.47 Northrop Grumman Corporation Primary Market Competitors 2018
Figure 10.48 The Raytheon Company Total Company Sales 2013-2017 (US$m, AGR%)
Figure 10.49 The Raytheon Company Sales by Segment of Business 2013-2017 (US$m, Total Company Sales)
Figure 10.50 The Raytheon Company Net Income 2013-2017 (US$m, AGR%)
Figure 10.51 The Raytheon Company Primary International Operations 2018
Figure 10.52 The Raytheon Company Sales by Geographical Location 2013-2017 (US$m)
Figure 10.53 The Raytheon Company Organisational Structure 2018
Figure 10.54 The Raytheon Company Primary Market Competitors 2018
Figure 10.55 Rockwell Collins Inc Total Company Sales 2013-2017 (US$m, AGR%)
Figure 10.56 Rockwell Collins Inc Sales by Segment of Business 2013-2017 (US$m)
Figure 10.57 Rockwell Collins Inc Net Income 2013-2017 (US$m, AGR%)
Figure 10.58 Rockwell Collins Inc Primary International Operations 2018
Figure 10.59 Rockwell Collins Inc Sales by Geographical Location 2013-2017 (US$m)
Figure 10.60 Rockwell Collins Inc Organisational Structure 2018
Figure 10.61 Rockwell Collins Inc Primary Market Competitors 2018
Figure 10.62 Textron Inc Total Company Sales 2013-2017 (US$m, AGR%)
Figure 10.63 Textron Inc Sales by Segment of Business 2013-2017 (US$m)
Figure 10.64 Textron Inc Net Income 2013-2017 (US$m, AGR%)
Figure 10.65 Textron Inc Primary International Operations 2018
Figure 10.66 Textron Inc Sales by Geographical Location 2013-2017 (US$m)
Figure 10.67 Textron Inc Organisational Structure 2018
Figure 10.68 Textron Inc Primary Market Competitors 2018
Figure 10.69 The Boeing Company Total Company Sales 2013-2017 (US$m, AGR%)
Figure 10.70 The Boeing Company Sales by Segment of Business 2013-2017 (US$m, Total Company Sales AGR%)
Figure 10.71 The Boeing Company Net Income 2013-2017 (US$m, AGR%)
Figure 10.72 The Boeing Company Primary International Operations 2019
Figure 10.73 The Boeing Company Sales by Geographical Location 2013-2017 (US$m, Total Company Sales AGR%)
Figure 10.74 The Boeing Company Primary Market Competitors 2019
Figure 10.75 Elbit Systems Total Company Sales 2013-2017 (US$m, AGR%)
Figure 10.76 Elbit Systems Sales by Segment of Business 2013-2017 (US$m)
Figure 10.77 Elbit Systems Net Income 2013-2017 (US$m, AGR%)
Figure 10.78 Elbit Systems Primary International Operations 2018
Figure 10.79 Elbit Systems Sales by Geographical Location 2013-2017 (US$m)
Figure 10.80 Elbit Systems Organisational Structure 2018
Figure 10.81 Elbit Systems Primary Market Competitors 2019
3M
AAI Corporation
ABRY Partners
Accenture Federal Services
ACE Management S.A.
ACELEC
Adani Group
Advanced New Technologies Ltd.
Aerius Photonics LLC
Aero Vodochody
Aeroguard Company Ltd
Aerospace Power Distribution Management Solutions
Aerospace Propulsion Products
Aerovision
Agusta Holding BV
AgustaWestland Inc.
AgustaWestland North America Inc.
AgustaWestland NV.
AgustaWestland SpA
Airbus Americas
Airbus China
Airbus Defence & Space
Airbus Defense and Space GmbH
Airbus DS Electronics and Border Security SAS.
Airbus DS Optronics GmbH
Airbus Electronics and Border Security GmbH
Airbus Group SE
Airbus Helicopters
Airbus Helicopters Deutschland
Airbus Helicopters España
Airbus Helicopters Inc
Airbus Japan
Airbus Middle East
Airbus Operations S.L.U.
Airbus ProSky
Airbus Safran Launchers Joint Venture
Airbus SAS
Airbus UK
Aircelle
Akaer
Akendenic Guvenlik Hizmetleri
Al Fatten Ship Industry
Albany International
Alenia Aermacchi SpA
Alestis Aerospace S.L.
American Eurocopter Corporation
American Industrial Partners
American Science & Engineering Inc
Amor Group
Analex Corporation
Ansaldo Energia
Apogen Technologies Inc
Applied Physical Science Corporation
Applied Signal Technology, Inc
Arctic Cat
Ares Aeroespacial e Defesa
Ares Shipyard
Areva SA
ARINC
Arkoon Network Security
ARMA Global Corporation
Armasight, Inc.
AS&E
Aselsan
Ashgal
Asia Global Technologies (AGT) International
Astrium Services GmbH
Astrotech Corporation
Astrotech Space Operations
Atkins
Atlas Telecom
ATR
Austral
Automotive Robotic Industry
Aveos Fleet Performance
Aviation Communications & Surveillance Systems
Avibras Divisao Aerea e Naval S.A.
Avibras Indústria Aeroespacial’s Divisão Aerea e Naval S.A.
Avio Spa
Avionics Services
Aware
Axis Communications
AxleTech
BAE Systems
BAE Systems (Operations) Limited
BAE Systems Australia
BAE Systems Controls Inc.
BAE Systems Information and Electronic Systems Integration Inc.
BAE Systems Information Solutions Inc.
BAE Systems Land & Armaments LP
BAE Systems Land Systems South Africa (Pty) Limited
BAE Systems Plc
BAE Systems Saudi Arabia
BAE Systems Surface Ships Limited
Bahrain Airport Company
Bangkok Dock
Bart & Associates
Beech Holdings LLC
Beechcraft
Bell Helicopter
Bharat Electronics Limited India
Blighter Surveillance Systems
BlueBird
Bluefin Robotics
Boeing
Bollinger Shipyards
Bombardier
Booz Allen Hamilton
Boston Engineering Corporation’s Advanced Systems Group (ASG)
Broadcast Communications
Buccaneer Computer Systems & Service, Inc
Bundesdruckerei GmbH
CACI International
Campbell/Harris Security Equipment Company (CSECO)
Capita PLC
CapRock Communications
CapRock Government Solutions, Inc
Carefx Corporation
Carl Zeiss Optronics GmbH
Cassidian
Cassidian Cybersecurity SAS
CDL Systems Ltd.
CEA-Liten
Cessna
CFM International
Chandler/May, Inc
Cimpa SAS
Cinven
Cisco Systems Inc
CIST
Claridge Israel
Cloudshield
Cobham Plc
Cochin Shipyard
Comptek Research Inc
Compucat Research Pty. Ltd
Computer Sciences Corporation (CSC)
Computing Technologies for Aviation, Inc
Cray
CrossMatch Technologies Inc
CSRA
CTSC, LLC
Cusgmand
Cyberbit Ltd.
Cyveillance, Inc
D.T.S. Ltda
Daebo Communication & Systems
Damen Shipyards
Danieli Group
Dassault Aviation
Data Tactics Corp (L-3 Data Tactics)
Datapath Inc
DCNS
Defense Support Services LLC
DefenSoft
Denel (SOC) Limited
Deposition Sciences Inc
Diehl Air Cabin GmbH
Diehl Group.
Digital Receiver Technology, Inc
DigitalOptics Corporation’s Micro-Optics
Dixie Chopper
DJI Innovations
Doss Aviation
DRS Technologies
DVTEL Inc.
EADS North America, Inc.
Eagle Enterprise, Inc
Earl Industries
EBCO Systems Ltd
Eclipse Electronics Systems Inc.
eGlobalTech
Egyptian Aircraft Factory
ELAC Nautik Unterstützungskaße GmbH
Elbatech Ltd
Elbit Security Systems (ELSEC)
Elbit Systems - Kinetic
Elbit Systems Cyclone
Elbit Systems Electro-Optics - Elop Ltd
Elbit Systems EW and SIGINT – Elisra ltd
Elbit Systems Land and C4I Ltd
Elbit Systems of America LLC
Elbit Systems, Ltd.
Elettronica SpA
Elisra
Elta North America Inc
Elta Systems Ltd
Eltra Holdings Pte Ltd.
Embraer Defense and Security
Embraer SA
Emirates
Enhanced Harpia Sistemas SA
Enics Kazan
Enterprise Integration Group (EIG)
ESG
ESG Elektroniksystem- und Logistik GmbH
E-Sicherheitsbeteiligungen GmbH.
ESLT
Esterline Corporation
E-Systems Technologies Holding, Inc
ETI
Etihad Ship Building
Eurocopter
Eurofighter GmbH
European Advanced Technology
European Advanced Technology S.A. (EAT)
Eutelsat
exactEarth Ltd
Exelis Inc.
Extech Instruments Corporation
E-Z-Go
Fairchild Imaging Inc.
Fata SpA
Fidelis Cybersecurity Solutions
Fidelis Security Systems Inc
Finmeccanica Group Services SpA
Flex-Tek.
Flight Options LLC
Flight Technologies Sistemas SA
FLIR Advanced Imaging Systems Inc.
FLIR Government Systems Inc.
FLIR Systems Aviation LLC
FLIR Systems CV
FLIR Systems Inc.
FLIR Systems Ltd
FLIR Systems Middle East FZE
FNSS Savuma Sistemleri AS
Force Dynamics LLC
Force Protection Inc
ForceX
Foreground Security
Forensic Technology WAI Inc
Foster & Freeman
Foster-Miller Inc
FSI Holdings Inc.
G4S Secure Solutions US Inc
Garda Security Screening Inc
Gayston Corporation
GE
GEM Elettronica
Gemalto
General Atomics
General Dynamics
General Dynamics Advanced Information Systems Spacecraft
General Dynamics C4 Systems, Inc
General Dynamics Canada Ltd.
General Dynamics Combat Systems
General Dynamics Corporation
General Dynamics do Brazil Solucoes Para Projectos Ltda
General Dynamics European Land Systems
General Dynamics European Land Systems - Germany GmbH
General Dynamics European Land Systems - Steyr GmbH
General Dynamics Global Holdings Limited
General Dynamics Global Imaging Technologies, Inc
General Dynamics Information Technology Canada, Limited
General Dynamics Information Technology, Inc
General Dynamics Mission Systems
General Dynamics Overseas Systems and Services Corporation
General Dynamics Robotic Systems, Inc
General Dynamics Satcom Technologies Asia Private Limited
General Dynamics Satellite Communication Services, LLC
General Dynamics Support Services Company
General Electric Corporation
Gentex Corporation
Global RadioData Communications (GRC)
G-NIUS
Goa Shipyard Limited
Greenlee
Griffon Hoverwork
Grintek Group
Gulfstream Aerospace Corporation
Gulfstream Aerospace Hong Kong Limited
Gulfstream Aerospace LLC
Hanwha Thales
Harpia
Harris CapRock Communications, Inc
Harris Corporation
Havelsan
Hawker Beechcraft
Helibras
Henggeler Computer Consultants Inc.
Hensoldt
Herakles
Hewlett Packard
HID Global
Hispano-suiza
Hitachi Group
Honeywell International Inc.
Huntington Ingalls Industries
Hydroid
Hypertronics Corporation
Hytera
Hyundai Autoever
I.A.I. ASIA Pte Ltd
IACIT
IAI North America Inc
IAP Research
IBM
ICx Technologies Inc
IGG
ImageSat International N.V. (ISI)
Implant Science Corporation
Incubit Technology Ventures Ltd
Indra ATM S.L.
Industrial Defender, Inc
InfoPro
InfoZen
Infraero
Innovative Contractors for Advanced Dimensions (ICAD)
Integrated Cockpit Solutions
IntelliCam LLC
Interconnect Devices, Inc
International Business Machines (IBM)
International Communications Group
Inuktun US LLC
IRDI S.A.
Israel Aerospace Industries Ltd (IAI)
Israel Military Industry (IMI) Systems
ITL Optronics
ITS Corporation
J.F. Lehman
Jacobsen
JC Production Solutions, Inc
JetBlue
John Crane Inc
John Crane Italia SpA
John Crane Middle East FZE
John Crane UK Limited
Kaiser Optical Systems Inc
Kalyani Group
Kautex Textron
Kellog Brown & Root
KKR
Klein Associates, Inc
Ktech Corporation
L&T Technology Services
L-1 Identity Solutions, Inc
L-3 Advanced Programs, Inc
L-3 Applied Technologies, Inc
L-3 Communications
L-3 Communications Australia Pty Ltd
L-3 Communications Avionics Systems, Inc
L-3 Communications Canada Inc
L-3 Communications ELAC Nautik GmbH
L-3 Communications Electron Technologies, Inc
L-3 Communications Electronic Systems Inc
L-3 Communications EO/IR, Inc
L-3 Communications Holdings
L-3 Communications Hong Kong Limited
L-3 Communications India Private Limited
L-3 Communications Korea Corporation
L-3 Communications Ltd.
L-3 Communications Magnet-Motor GmbH
L-3 Communications MAPPS Inc
L-3 Communications MAPPS Malaysia Sdn. Bhd.
L-3 Communications Marine Holdings AS
L-3 Communications Marine Systems UK Ltd.
L-3 Integrated Sensor Systems
L-3 KEO
L-3 Narda-MITEQ
L-3 Saudi Arabia LLC
L-3 Security & Detection
L-3 Technologies Inc.
L-3 Wescam
L-3's Narda Microwave East
L-3's National Security Solutions (NSS)
Labinal Power Systems
LARDOSA
Lardosa Investment B.V.
Larsen & Toubro
LaSalle Capital
Leidos
Leidos Australia Pty Ltd
Leidos Biomedical Research Inc
Leidos Canada
Leidos Constructors LLC
Leidos Engineering LCC
Leidos Health
Leidos Holdings Inc.
Leonardo SpA
Ligado Networks
Lindsay Goldberg LLC.
Link Simulation & Training UK Limited
Lion Group
LiveTV
Lockheed Martin Aerospace Systems Integration Corporation (Delaware)
Lockheed Martin Australia Pty Limited
Lockheed Martin Canada Inc
Lockheed Martin Corporation
Lockheed Martin Desktop Solutions Inc
Lockheed Martin Global Inc
Lockheed Martin Information Systems & Global Solutions
Lockheed Martin Integrated Systems Inc
Lockheed Martin Integrated Technology LLC
Lockheed Martin Investments Inc
Lockheed Martin Logistics Management Inc
Lockheed Martin Mission Systems and Training
Lockheed Martin Operations Support Inc
Lockheed Martin Services Inc
Lockheed Martin Space Alliance Company
Lockheed Martin TAS International Services Inc
Lockheed Martin UK Limited
Lockheed Martin Unmanned Integrated Systems
LookingGlass Cyber Solutions, Inc
Lorex Technology Inc.
Lumidign
Lürssen Shipyard
Lycoming Engines,
M5 Network Security
ManTech
Mardan Holdco Pte Ltd
Marine Data Solutions
Marine Systems International (MSI)
MARSS
MAVCO Inc
MBDA
Mechtronix
Messier-Bugatti-Dowty
Metro Machine Corp
Metron Aviation
MITEQ, Inc
Morpho Detection LLC
Mustang Technology Group, LP
Nant Health, LLC
Narita International Airport Corporation
National ICT Australia (NICTA)
Nautic Africa
Navtech
Naykar Makina
ND Satcom GmbH
Ness Technologies
Netasq
NICE Systems – Cyber and Intelligence Division
Northrop Grumman Corporation
Northrop Grumman Electronic Systems International Company (UK)
Northrop Grumman Electronics Systems Integration International Inc
Northrop Grumman Field Support Services Inc
Northrop Grumman Integrated Defence Services Pty Limited
Northrop Grumman Litef GmbH
Northrop Grumman Overseas Service Corporation
Northrop Grumman Technical Services
Northrop International Aircraft Inc
Nova
Nuctech
Oberthur Technologies
Ocean Server Technology
OHB System AG
OnTrack Innovations Ltd.
Open Kernel Labs
Open Water Power Inc.
OpenHydro
Opinicus
OptaSense
Orbital ATK
Oshkosh
Oto Melara
OTO Melara SpA
Outerlink Global Solutions
Pacific Architects and Engineers Inc
Pacific Avionics Pty Limited
Panasonic
Parter Capital Group AG
Patria Oyj
PCA Electronic Test
Peak Nano Optics LLC
Perceptics Corporation
Perimeter Internetworking Corp
Periscopio
Pikewerks Corporation
Pivotal Power
Poseidon Scientific Instruments Pty Ltd
Power Distribution, Inc
Power Holdings Inc,
Procerus Technologies, L.C.
Proflight
Prox Dynamics AS
PwC
PZL Swidnik
Qantas Defence Services Pty Limited
Qatar Airbus DS
QinetiQ Group Holdings Limited
QinetiQ Group Plc
QinetiQ Holdings Limited
QinetiQ Limited
QinetiQ North America Inc
QinetiQ Overseas Holdings Limited
QinetiQ US Holdings Inc
Quantas Defence Services
Quantum Industries S.à.r.l.
Rafael Advanced Defense Systems
Ransomes
Rapiscan Systems
Raymarine Holdings Limited
Raytheon
Raytheon Aircraft Systems International L.P.
Raytheon Applied Signal Technology, Inc (RAST)
Raytheon Australia International PTY Limited
Raytheon Blackbird Technologies
Raytheon Brasil Sistemas De Integracao Ltda
Raytheon Canada Ltd.
Raytheon Company
Raytheon International Korea, Inc
Raytheon Marine G.m.b.H.
Raytheon Philippines, Inc
Raytheon Saudi Arabia Limited
Raytheon Systems Israel Company
Raytheon Systems Limited (RSL)
Raytheon UK
ReconRobotics
Redfern Integrated Optics (RIO)
Remotec Inc
Reveal Imaging Technologies Inc
Rheinmetall
Rheinmetall Airborne Systems GmbH
Rockwell Collins Aerospace & Electronics, Inc
Rockwell Collins Australia Pty Limited
Rockwell Collins Business Services, Inc
Rockwell Collins Canada Inc
Rockwell Collins Deutschland GmbH
Rockwell Collins do Brasil Ltda.
Rockwell Collins ElectroMechanical Systems, Inc
Rockwell Collins France S.A.S.
Rockwell Collins Government Systems (Canada), Inc
Rockwell Collins Inc.
Rockwell Collins In-Flight Network Company
Rockwell Collins Optronics, Inc
Rockwell Collins Simulation & Training Solutions LLC
Rohde & Schwarz GmbH und Co. KG
Rotorsim US LLC
Russian Helicopters
Saab AB
Saab Asia Pacific Co. Ltd
Saab Danmark A/S,
Saab Defense and Security US LLC (SDAS)
Saab France SAS
Saab Grintek Technologies (Pty) Ltd
Saab India Technologies Pvt. Ltd.
Saab Kenya Ltd
Saab Kockums AB
Saab North America, Inc
Saab Seaeye Limited
Saab Sensis Corporation
Saab South Africa (Pty) Ltd
Saab Technologies Ltd.
Saab Technologies Norway AS
Saab Technologies UK Limited
Saab Training Systems B.V
Saab Training Systems GmbH
Saab Ventures AB
Safety Prods Inc.
Safran Consulting
Safran Electronics & Defense
Safran Landing Systems
Safran SA
Safran Security (Morpho)
Sagem
SAIC
Salem Technologies
Salzburg München Bank AG
SAM Electronics GmbH
SAM Electronics Nederland B.V.
Samsung
Samtel Avionics Ltd.
Sandia Corporation
Savi Technology, Inc
Saymar
SC Elettra
Schiebel
Schlumberger’s Global Connectivity Services (GCS)
Schroth Safety Prods. GmbH
Seaspan
Securitas Transport Aviation Security Ltd
Seguritech
Selex Communications GmbH
Selex ES
Selex ES do Brazil
Selex ES GmbH
Selex ES Inc
Selex ES SpA
SELEX Systems Integration GmbH
SenStar
SESA
Sharp Aviation K Inc.
SI Organisation Inc
Sierra Nevada Corporation (SNC)
Signalis
Sikorsky Aircraft
Sisfron
Sistemi Dinamici SpA
SITA
Sky Intermediate Merger Sub, LLC
Smiths Detection – Watford Ltd
Smiths Detection (Asia-Pacific) Pte Ltd
Smiths Detection, Inc
Smiths Group
Smiths Heimann GmbH
Smiths Heimann SAS
Smiths Interconnect
Smiths Medical ASD, Inc
Smiths Medical Deutschland GmbH
Smiths Medical France SA
Smiths Medical International Limited
Smiths Medical Japan Limited
Sofradir
Soltam
Sonardyne International Ltd
Sopra Steria Group
Space Engineering Spa
SR2020 Inc
SRC Inc
Stark Aerospace Inc
Sterling Software (US) Inc
Strategic Simulation Solutions
stratsec.net
STX Offshore & Shipbuilding Co.
Swiss-Photonics AG
Sysgo AG
Systems Electro-Optics Elop Ltd (Elop
Systems Engineering & Assessment Limited
Systems Made Simple
Tampa Microwave
Tamuz F.T.K. Solutions Ltd
Technology Associates Inc
Techspace Aero
Tecnologias Internacionales de Manufactura S.A. de C.V.
Telespazio Argentina
Telespazio Hungary Satellite Telecommunications
Telespazio SpA
Teligy Inc
Telstra
Test & Measures Group SAS
Textron Acquisition LLC
Textron AirLand
Textron Aviation
Textron Financial
Textron Inc.
Textron Marine & Land Systems
Textron Specialised Vehicles
Textron Systems
Textron Systems Unmanned Systems
Thales
Thales Air Defence Ltd
Thales Air Systems & Electron Devices GmbH
Thales Alenia Space SAS
Thales Communications & Security SAS
Thales Defence & Security Inc
Thales Electronic Systems GmbH
Thales Espana Grp, S.A.U.
Thales Group
Thales International Saudi Arabia
Thales Optronique SA
Thales Raytheon Systems Arabia L.P.
Thales Raytheon Systems Company SAS
Thales Security Solutions & Services Company
Thales Software India Pvt. Ltd.,
Thales Solutions Asia Pte Ltd
Thales UK Ltd
Thales Underwater Systems SAS
Thales-Raytheon Systems Company LLC
Thales-Raytheon Systems Company S.A.S. (TRS SAS)
The Gores Group, LLC
The Gulf Industrial Technology Company (KSC)
The O’Gara Group, Inc.
The Raytheon Company
ThyssenKrupp AG
ThyssenKrupp Industrial Solutions AG
ThyssenKrupp Marine Systems AB
Tinsley Product Line; Broadcast Sports Inc
Titeflex Corporation
TNO
Tor
Traficon International NV
Transportation Partners
Transtector Systems, Inc
Trusted Computer Solutions Inc
TSG
TUG
Turbo Components and Engineering Inc
Turbomeca
Tutco, Inc
UAS Dynamics LLC
UMS Aero Group AG
UMS Skeldar AG.
Undisclosed Company
Unisys
Universal Avionics Systems Corporation
US Airbus DS
Vangent Holding Corporation
Vangent Inc.
Varec Inc
Vencore
Veritas Capital
Vertex Aerospace Business segment
Vision Box
Vision Systems LLC
Visionix
Vista Equity Partners
Visual Analytics Inc
Wärtsilä Corporation
Websense
Westar Aerospace & Defence Group Inc
Whitehead Sistemi Subaquei SpA
Wipro
World of Powersports, Inc
Wuchang Shipbuilding Industry Co
Xetron Corporation
Zeta Associates, Inc
Zodiac Marine
Organisations mentioned
FAA
U.S. Air National Guard
U.S. Coast Guard
U.S. Department of Homeland Security (DHS)
U.S. Space and Naval Warfare Systems Center Atlantic (SPAWAR)
U.S. Special Operations Command (USSOCOM).
United Nations
US Air Force (USAF)
US Air Force Life Cycle Management Center
US Air Force Research Laboratory (AFRL)
US Air Force Space and Missile Systems Center
US Army
US Border Control Forces
US Citizenship & Immigration Services (USCIS)
US Coast Guard (USCG).
US Customs and Border Protection (US-CBP)
US Defense Advanced Research Projects Agency (DARPA)
US Defense Logistics Agency
US Defense Threat Reduction Agency (DTRA)
US Department of Homeland Security’s (DHS) Office of Biometric Identity Management (OBIM)
US Department of Veterans Affairs (VA)
US DHS – Citizenship & Immigration Services
US Federal Aviation Administration (FAA)
US Federal Emergency Management Agency (FEMA)
US Marine Corps
US Naval Sea Systems Command
US Navy
US Office of the Chief Information Officer
US State Department
US Transport Security Administration (TSA)
Download sample pages
Complete the form below to download your free sample pages for US Border Security Market Report 2019-2029Related reports
-
Australian Defence Market Report 2019-2029
Where is the Australian Defence market heading? If you are involved in this sector you must read this brand new...Full DetailsPublished: 16 May 2019 -
Chemical, Biological, Radiological & Nuclear (CBRN) Defence Market Report 2019-2029
The CBRN defence market set to grow to $15,193mn by 2029.
...Full DetailsPublished: 19 December 2018 -
Military Simulation, Modelling and Virtual Training Market Report 2019-2029
Developments in simulation systems related technology have had a significant impact on the defence military simulation and virtual training market.
...Full DetailsPublished: 06 December 2018 -
Top 20 Companies Developing Commercial Electric Aircraft 2020
Commercial Electric Aircraft spending to grow at a double digit rate over the forecast period.
...Full DetailsPublished: 23 January 2020 -
Airport Security Market Report 2019-2029
The US$8.83bn airport security market is expected to flourish in the next few years. If you want to be part...
Full DetailsPublished: 18 June 2019 -
Electronic Warfare (EW) Market Report 2019-2029
The recent developments in electronic warfare systems in defence platforms and systems, has led Visiongain to publish this timey report....
Full DetailsPublished: 26 March 2019 -
Airport Security Market Report 2018-2028
Visiongain evaluates the global Airport Security market to be worth US$10,505m in 2018.
...Full DetailsPublished: 25 June 2018 -

Military Embedded Systems Market Forecast 2019-2029
The $89.6 billion military embedded systems market is expected to flourish in the next few years because increasing investment towards...
Full DetailsPublished: 30 April 2019 -
Special Mission Aircraft Market Report 2019-2029
The US$ 11.42bn special mission aircraft is expected to flourish in the next few years because of widespread budgetary constraints...
Full DetailsPublished: 16 May 2019 -
Military Electro-Optical and Infrared (EO/IR) Systems Market Report 2018-2028
The latest report from business intelligence provider Visiongain offers comprehensive analysis of the global Military Electro-Optical Infrared System market. Visiongain...Full DetailsPublished: 22 January 2018
Download sample pages
Complete the form below to download your free sample pages for US Border Security Market Report 2019-2029Do you have any custom requirements we can help you with?
Any specific country, geo region, market segment or specific company information?
Email us today, we can discuss your needs and see how we can help: jamie.roberts@visiongain.com
Would you like a free report overview of the report of your choice?
If so, please drop an email to Jamie Roberts stating your chosen report title to jamie.roberts@visiongain.com
Visiongain defence reports are compiled using a broad and rich mixture of both primary and secondary information to produce an overall industry outlook. In order to provide our clients with the best product possible, Visiongain analysts reach out to market-leading vendors and industry experts and review a wealth of financial data and product information from a vast range of sources. To find out more about our reports methodology, please email jamie.roberts@visiongain.com
Would you like to get the latest Visiongain defence reports catalogue?
What are the dynamic growth sectors? where are the regional business opportunities?
Which technologies will prevail and who are the leading companies succeeding in these sectors and why?
If you want definitive answers to business critical questions, discover Visiongain’s full range of business intelligence reports.
If so, please email Jamie Roberts on jamie.roberts@visiongain.com or call her today on +44 207 336 6100
ADS Group
Aerial Refueling Systems Advisory Group
Aerospace and Defence Industries Association of Nova Scotia
Aerospace Industries Association
Aerospace Industries Association of Canada
AHS International – The Vertical Flight Technical Society
Air Force Association
Aircraft Electronics Association
Airlift/Tanker Association
American Astronautical Society
American Gear Manufacturers Association
American Institute of Aeronautics and Astronautics
American Logistics Association
American Society of Naval Engineers
AMSUS – The Society of the Federal Health Agencies
Armed Forces Communications and Electronics Association
Armed Forces Communications and Electronics Association
Army Aviation Association of America
ASD – Aerospace & Defence Association of Europe
Association for Unmanned Vehicle Systems International
Association of Aviation Manufacturers of the Czech Republic
Association of Naval Aviation
Association of Old Crows
Association of Polish Aviation Industry
Association of the Defense Industry of the Czech Republic
Association of the United States Army
Association of the United States Navy
Australia Defence Association
Australian Industry & Defence Network
Australian Industry Group Defence Council
Austrian Aeronautics Industries Group
Aviation Distributors and Manufacturers Association
Aviation Suppliers Association
Belgian Security and Defence Industry
Bulgarian Defence Industry Association
Business Executives for National Security
Canadian Association of Defence and Security Industries
Conference of Defense Associations
Council of Defense and Space Industry Associations
Danish Defence & Security Industries Association
Defence Industry Manufacturers Association
Defense Industry Initiative on Business Ethics and Conduct
Defense Industry Offset Association
Defense Orientation Conference Association
Deutsche Gesellschaft fur Wehrtechnik
Federal Association of the German Security and Defence Industry
Federation of Aerospace Enterprises in Ireland
French Aerospace Industries Association
French Land Defence Manufacturers Association (GICAT)
German Aerospace Industries Association
Helicopter Association International
Hellenic Aerospace & Defense Industries Group
Homeland Security & Defense Business Council
International Stability Operations Association
Japan Association of Defense Industry
Korea Defense Industry Association
Marine Corps Association & Foundation
National Aeronautic Association
National Association of Ordnance and Explosive Waste Contractors
National Defense Industrial Association
National Defense Transportation Association
National Guard Association of the U.S.
Navy League of the United States
Netherlands Aerospace Group
New Zealand Defence Industry Association
Portuguese Association of Defense Related Industries & New Technologies Companies
Québec Ground Transportation Cluster
Satellite Industry Association
Society of American Military Engineers
South African Aerospace Maritime and Defence Industries Association
Spanish Aerospace and Defence Association Industries
Submarine Industrial Base Council
Swedish Aerospace Industries
Swedish Security and Defence Industry Association
Swiss Aeronautical Industries Group
The Association of Finnish Defence and Aerospace Industries
The Italian Industries Association for Aerospace Systems and Defence
The Netherlands Defence Manufacturers Association
The Society of Japanese Aerospace Companies
UK AeroSpace, Defence & Security Industries
United Kingdom National Defence Association
Don’t Miss Out!
Latest Defence news
Robotic Warfare Market
The global Robotic Warfare market is projected to grow at a CAGR of 6.7% by 2034
19 July 2024
Cyber Warfare Market
The global Cyber Warfare market is projected to grow at a CAGR of 17.7% by 2034
16 July 2024
Counter-UAV (C-UAV) Market
The global Counter-UAV (C-UAV) market is projected to grow at a CAGR of 29.6% by 2034
08 July 2024
Special Mission Aircraft Market
The global Special Mission Aircraft market is projected to grow at a CAGR of 4.6% by 2034
27 June 2024


